Eureka, IL Map & Demographics
Eureka Map
Eureka Overview
$34,647
PER CAPITA INCOME
$69,703
AVG FAMILY INCOME
$48,250
AVG HOUSEHOLD INCOME
7.5%
WAGE / INCOME GAP [ % ]
92.5¢/ $1
WAGE / INCOME GAP [ $ ]
0.45
INEQUALITY / GINI INDEX
5,504
TOTAL POPULATION
2,526
MALE POPULATION
2,978
FEMALE POPULATION
84.82
MALES / 100 FEMALES
117.89
FEMALES / 100 MALES
39.6
MEDIAN AGE
2.7
AVG FAMILY SIZE
2.1
AVG HOUSEHOLD SIZE
2,946
LABOR FORCE [ PEOPLE ]
64.3%
PERCENT IN LABOR FORCE
7.6%
UNEMPLOYMENT RATE
Eureka Zip Codes
Eureka Area Codes
Income in Eureka
Income Overview in Eureka
Per Capita Income in Eureka is $34,647, while median incomes of families and households are $69,703 and $48,250 respectively.
| Characteristic | Number | Measure |
| Per Capita Income | 5,504 | $34,647 |
| Median Family Income | 1,428 | $69,703 |
| Mean Family Income | 1,428 | $90,684 |
| Median Household Income | 2,313 | $48,250 |
| Mean Household Income | 2,313 | $69,518 |
| Income Deficit | 1,428 | $0 |
| Wage / Income Gap (%) | 5,504 | 7.53% |
| Wage / Income Gap ($) | 5,504 | 92.47¢ per $1 |
| Gini / Inequality Index | 5,504 | 0.45 |
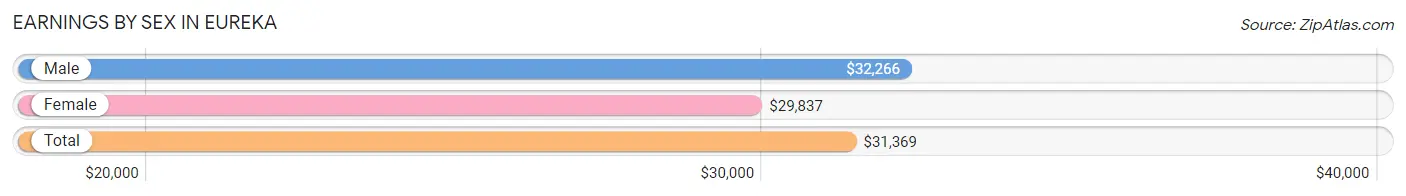
Earnings by Sex in Eureka
Average Earnings in Eureka are $31,369, $32,266 for men and $29,837 for women, a difference of 7.5%.
| Sex | Number | Average Earnings |
| Male | 1,619 (52.5%) | $32,266 |
| Female | 1,464 (47.5%) | $29,837 |
| Total | 3,083 (100.0%) | $31,369 |
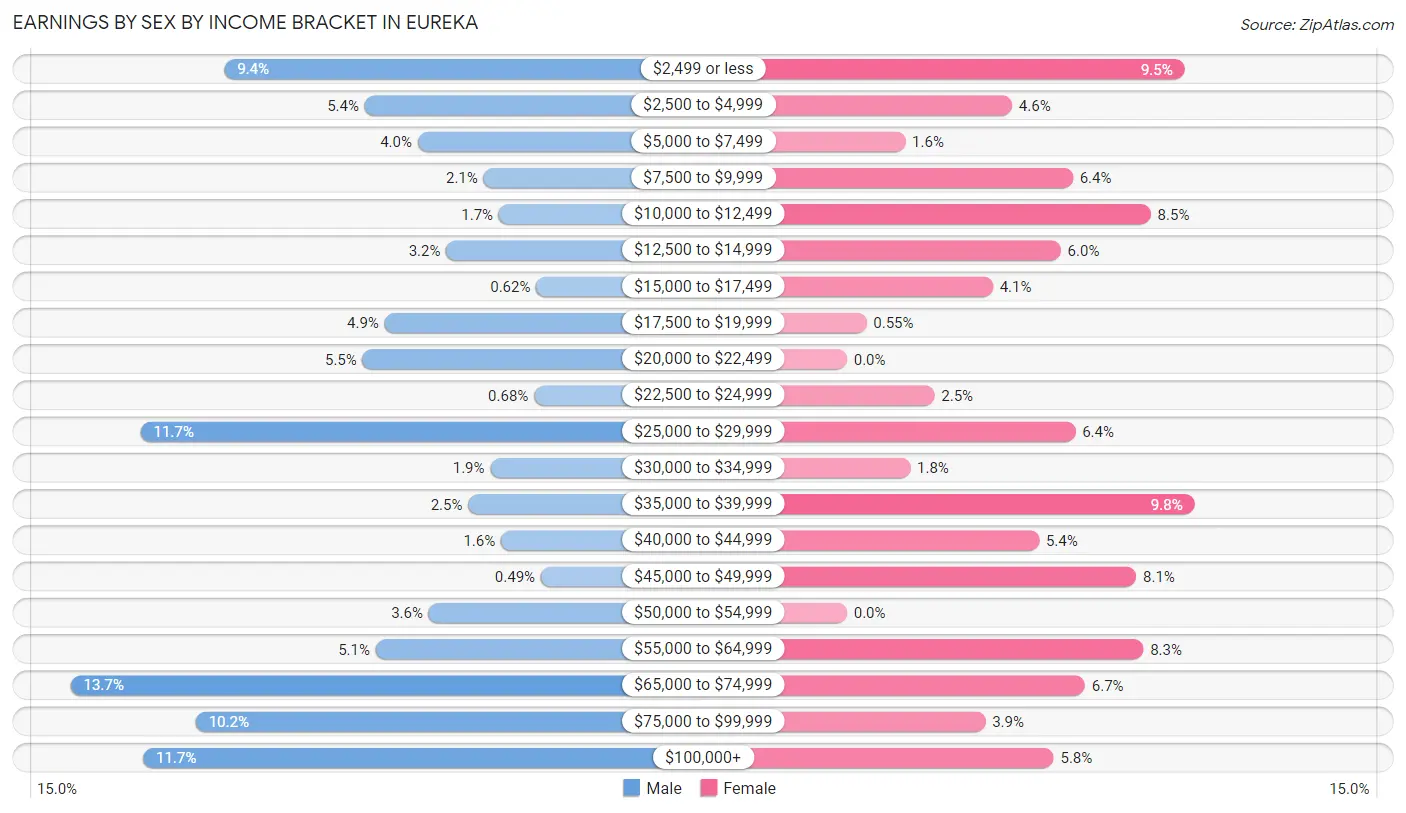
Earnings by Sex by Income Bracket in Eureka
The most common earnings brackets in Eureka are $65,000 to $74,999 for men (222 | 13.7%) and $35,000 to $39,999 for women (143 | 9.8%).
| Income | Male | Female |
| $2,499 or less | 152 (9.4%) | 139 (9.5%) |
| $2,500 to $4,999 | 88 (5.4%) | 68 (4.6%) |
| $5,000 to $7,499 | 64 (4.0%) | 24 (1.6%) |
| $7,500 to $9,999 | 34 (2.1%) | 93 (6.4%) |
| $10,000 to $12,499 | 27 (1.7%) | 125 (8.5%) |
| $12,500 to $14,999 | 51 (3.2%) | 88 (6.0%) |
| $15,000 to $17,499 | 10 (0.6%) | 60 (4.1%) |
| $17,500 to $19,999 | 79 (4.9%) | 8 (0.5%) |
| $20,000 to $22,499 | 89 (5.5%) | 0 (0.0%) |
| $22,500 to $24,999 | 11 (0.7%) | 36 (2.5%) |
| $25,000 to $29,999 | 190 (11.7%) | 94 (6.4%) |
| $30,000 to $34,999 | 31 (1.9%) | 26 (1.8%) |
| $35,000 to $39,999 | 41 (2.5%) | 143 (9.8%) |
| $40,000 to $44,999 | 26 (1.6%) | 79 (5.4%) |
| $45,000 to $49,999 | 8 (0.5%) | 119 (8.1%) |
| $50,000 to $54,999 | 59 (3.6%) | 0 (0.0%) |
| $55,000 to $64,999 | 83 (5.1%) | 122 (8.3%) |
| $65,000 to $74,999 | 222 (13.7%) | 98 (6.7%) |
| $75,000 to $99,999 | 165 (10.2%) | 57 (3.9%) |
| $100,000+ | 189 (11.7%) | 85 (5.8%) |
| Total | 1,619 (100.0%) | 1,464 (100.0%) |
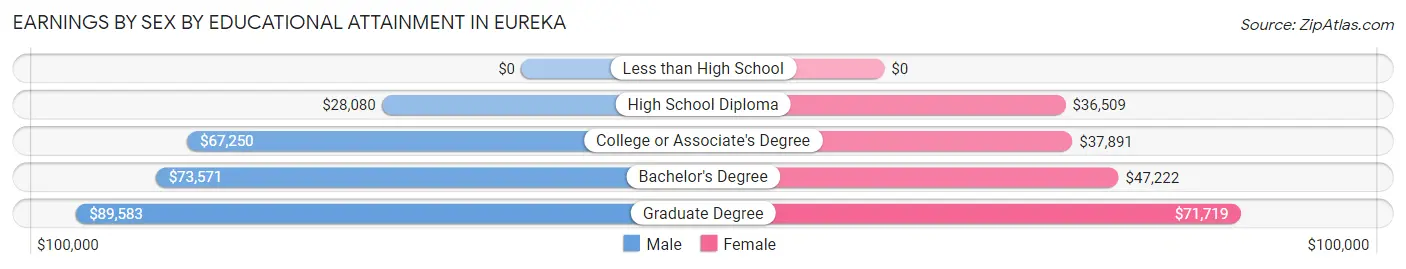
Earnings by Sex by Educational Attainment in Eureka
Average earnings in Eureka are $55,051 for men and $39,631 for women, a difference of 28.0%. Men with an educational attainment of graduate degree enjoy the highest average annual earnings of $89,583, while those with high school diploma education earn the least with $28,080. Women with an educational attainment of graduate degree earn the most with the average annual earnings of $71,719, while those with high school diploma education have the smallest earnings of $36,509.
| Educational Attainment | Male Income | Female Income |
| Less than High School | - | - |
| High School Diploma | $28,080 | $36,509 |
| College or Associate's Degree | $67,250 | $37,891 |
| Bachelor's Degree | $73,571 | $47,222 |
| Graduate Degree | $89,583 | $71,719 |
| Total | $55,051 | $39,631 |
Family Income in Eureka
Family Income Brackets in Eureka
According to the Eureka family income data, there are 301 families falling into the $100,000 to $149,999 income range, which is the most common income bracket and makes up 21.1% of all families. Conversely, the less than $10,000 income bracket is the least frequent group with only 9 families (0.6%) belonging to this category.
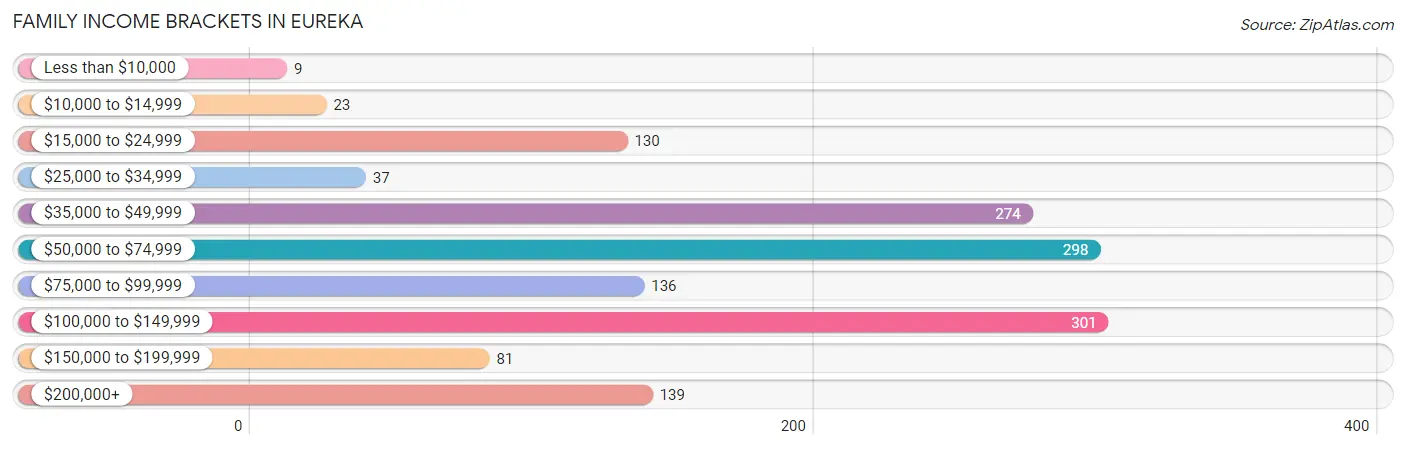
| Income Bracket | # Families | % Families |
| Less than $10,000 | 9 | 0.6% |
| $10,000 to $14,999 | 23 | 1.6% |
| $15,000 to $24,999 | 130 | 9.1% |
| $25,000 to $34,999 | 37 | 2.6% |
| $35,000 to $49,999 | 274 | 19.2% |
| $50,000 to $74,999 | 298 | 20.9% |
| $75,000 to $99,999 | 136 | 9.5% |
| $100,000 to $149,999 | 301 | 21.1% |
| $150,000 to $199,999 | 81 | 5.7% |
| $200,000+ | 139 | 9.7% |
Family Income by Famaliy Size in Eureka
3-person families (189 | 13.2%) account for the highest median family income in Eureka with $176,518 per family, while 3-person families (189 | 13.2%) have the highest median income of $58,839 per family member.
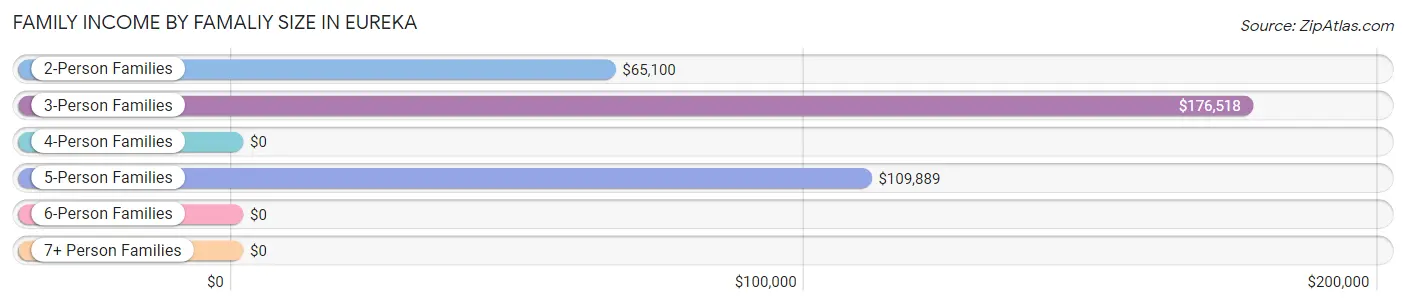
| Income Bracket | # Families | Median Income |
| 2-Person Families | 836 (58.5%) | $65,100 |
| 3-Person Families | 189 (13.2%) | $176,518 |
| 4-Person Families | 261 (18.3%) | $0 |
| 5-Person Families | 142 (9.9%) | $109,889 |
| 6-Person Families | 0 (0.0%) | $0 |
| 7+ Person Families | 0 (0.0%) | $0 |
| Total | 1,428 (100.0%) | $69,703 |
Family Income by Number of Earners in Eureka
The median family income in Eureka is $69,703, with families comprising 3+ earners (114) having the highest median family income of $224,000, while families with no earners (226) have the lowest median family income of $49,833, accounting for 8.0% and 15.8% of families, respectively.
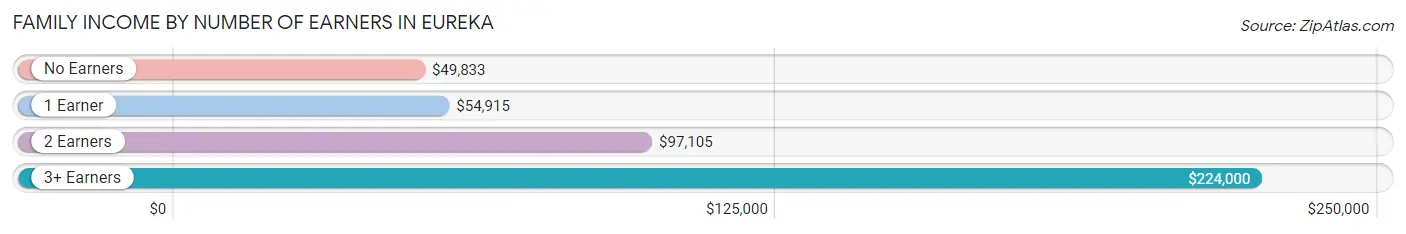
| Number of Earners | # Families | Median Income |
| No Earners | 226 (15.8%) | $49,833 |
| 1 Earner | 402 (28.1%) | $54,915 |
| 2 Earners | 686 (48.0%) | $97,105 |
| 3+ Earners | 114 (8.0%) | $224,000 |
| Total | 1,428 (100.0%) | $69,703 |
Household Income in Eureka
Household Income Brackets in Eureka
With 437 households falling in the category, the $15,000 to $24,999 income range is the most frequent in Eureka, accounting for 18.9% of all households. In contrast, only 93 households (4.0%) fall into the $150,000 to $199,999 income bracket, making it the least populous group.
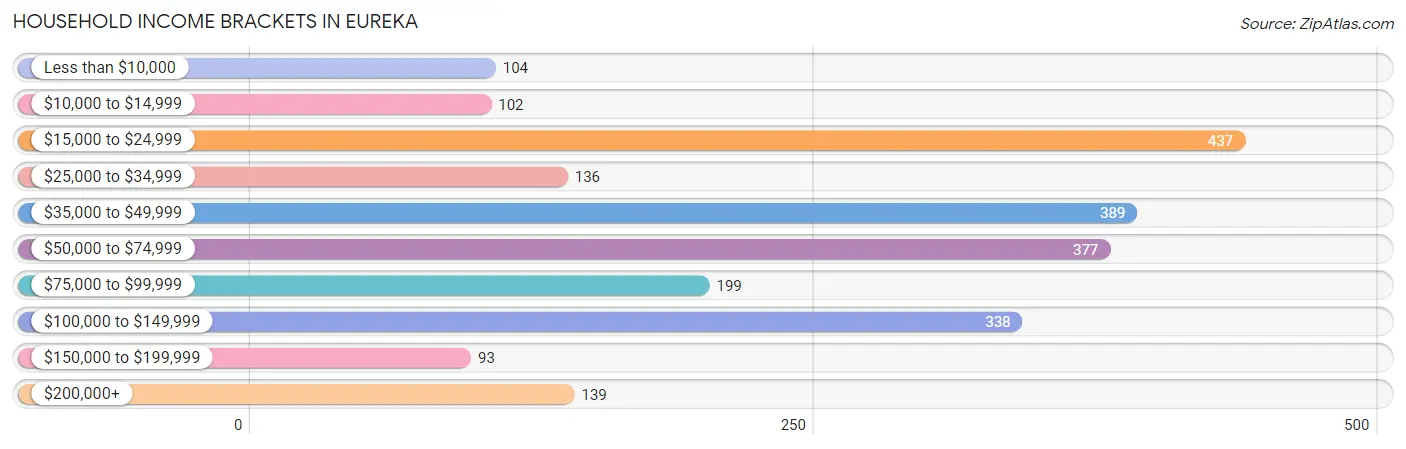
| Income Bracket | # Households | % Households |
| Less than $10,000 | 104 | 4.5% |
| $10,000 to $14,999 | 102 | 4.4% |
| $15,000 to $24,999 | 437 | 18.9% |
| $25,000 to $34,999 | 136 | 5.9% |
| $35,000 to $49,999 | 389 | 16.8% |
| $50,000 to $74,999 | 377 | 16.3% |
| $75,000 to $99,999 | 199 | 8.6% |
| $100,000 to $149,999 | 338 | 14.6% |
| $150,000 to $199,999 | 93 | 4.0% |
| $200,000+ | 139 | 6.0% |
Household Income by Householder Age in Eureka
The median household income in Eureka is $48,250, with the highest median household income of $86,900 found in the 25 to 44 years age bracket for the primary householder. A total of 532 households (23.0%) fall into this category. Meanwhile, the 65+ years age bracket for the primary householder has the lowest median household income of $33,750, with 670 households (29.0%) in this group.
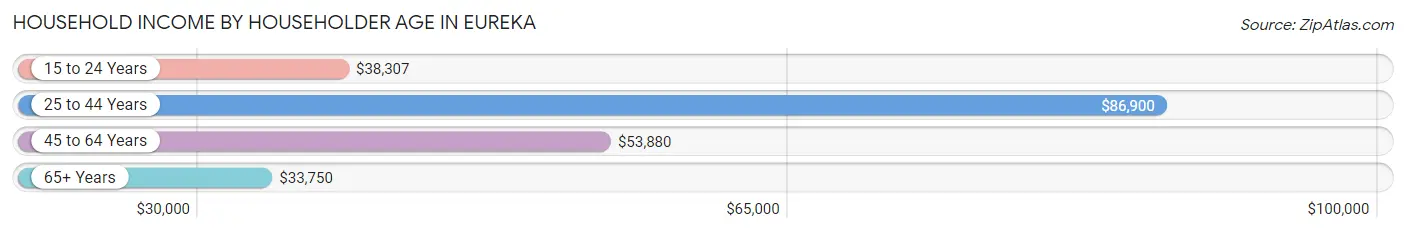
| Income Bracket | # Households | Median Income |
| 15 to 24 Years | 334 (14.4%) | $38,307 |
| 25 to 44 Years | 532 (23.0%) | $86,900 |
| 45 to 64 Years | 777 (33.6%) | $53,880 |
| 65+ Years | 670 (29.0%) | $33,750 |
| Total | 2,313 (100.0%) | $48,250 |
Poverty in Eureka
Income Below Poverty by Sex and Age in Eureka
With 12.4% poverty level for males and 14.0% for females among the residents of Eureka, 75 year old and over males and 18 to 24 year old females are the most vulnerable to poverty, with 46 males (40.4%) and 168 females (40.4%) in their respective age groups living below the poverty level.
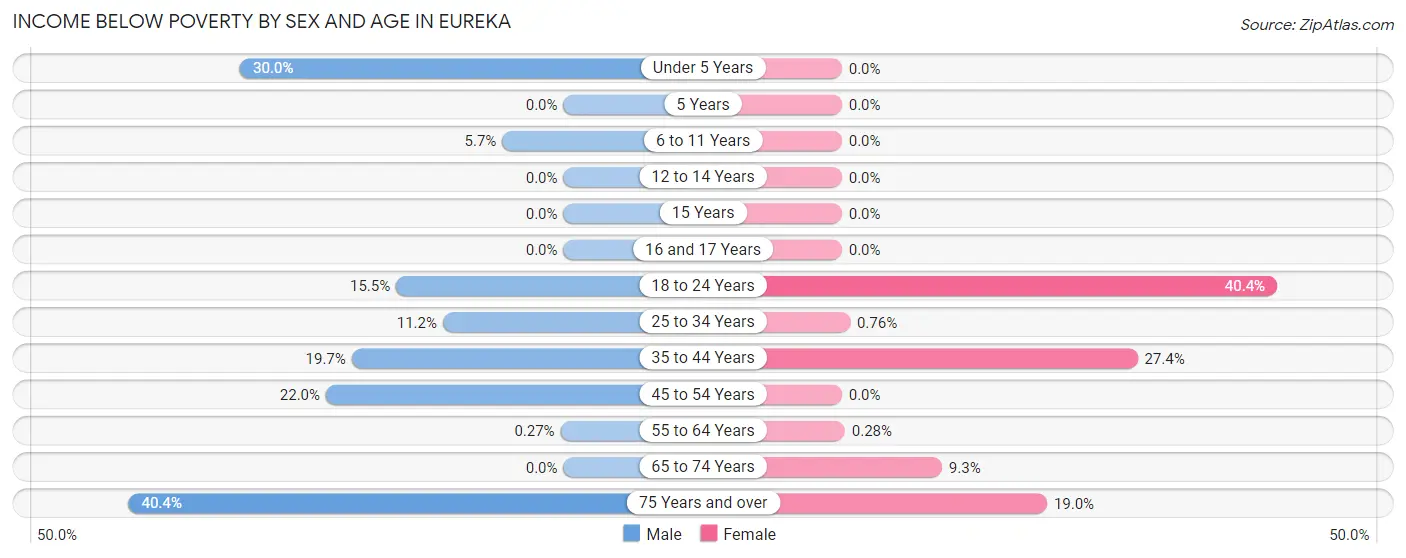
| Age Bracket | Male | Female |
| Under 5 Years | 36 (30.0%) | 0 (0.0%) |
| 5 Years | 0 (0.0%) | 0 (0.0%) |
| 6 to 11 Years | 13 (5.7%) | 0 (0.0%) |
| 12 to 14 Years | 0 (0.0%) | 0 (0.0%) |
| 15 Years | 0 (0.0%) | 0 (0.0%) |
| 16 and 17 Years | 0 (0.0%) | 0 (0.0%) |
| 18 to 24 Years | 32 (15.5%) | 168 (40.4%) |
| 25 to 34 Years | 46 (11.2%) | 1 (0.8%) |
| 35 to 44 Years | 34 (19.7%) | 107 (27.4%) |
| 45 to 54 Years | 67 (22.0%) | 0 (0.0%) |
| 55 to 64 Years | 1 (0.3%) | 1 (0.3%) |
| 65 to 74 Years | 0 (0.0%) | 17 (9.3%) |
| 75 Years and over | 46 (40.4%) | 87 (19.0%) |
| Total | 275 (12.4%) | 381 (14.0%) |
Income Above Poverty by Sex and Age in Eureka
According to the poverty statistics in Eureka, males aged 5 years and females aged under 5 years are the age groups that are most secure financially, with 100.0% of males and 100.0% of females in these age groups living above the poverty line.
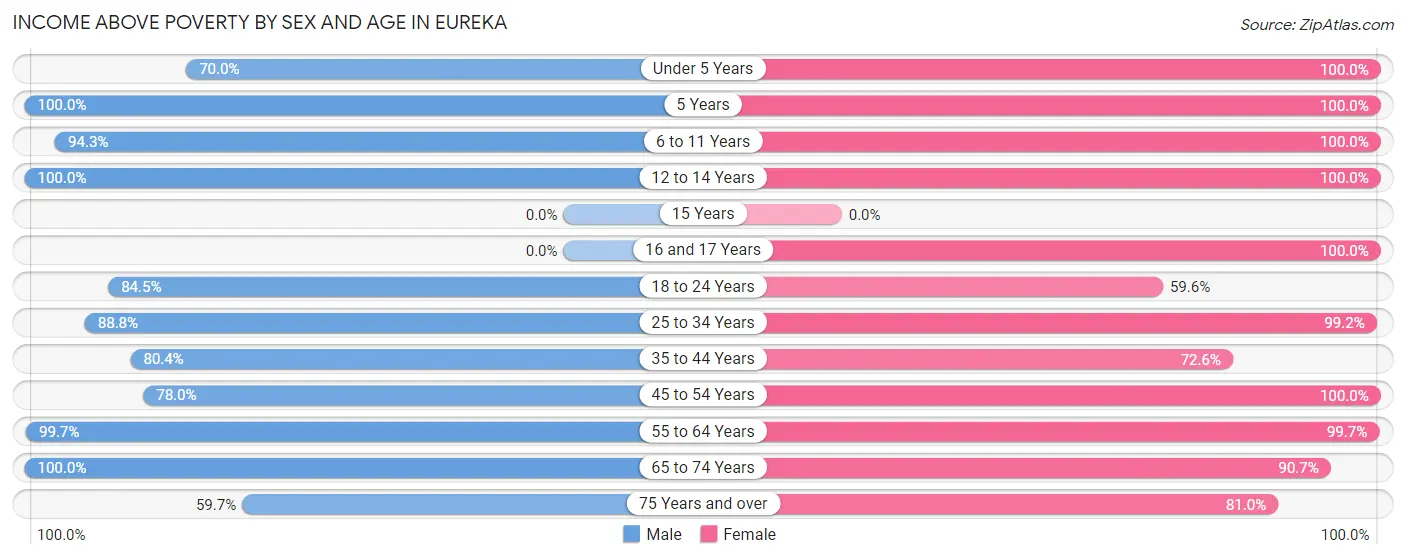
| Age Bracket | Male | Female |
| Under 5 Years | 84 (70.0%) | 202 (100.0%) |
| 5 Years | 43 (100.0%) | 30 (100.0%) |
| 6 to 11 Years | 216 (94.3%) | 149 (100.0%) |
| 12 to 14 Years | 45 (100.0%) | 104 (100.0%) |
| 15 Years | 0 (0.0%) | 0 (0.0%) |
| 16 and 17 Years | 0 (0.0%) | 28 (100.0%) |
| 18 to 24 Years | 174 (84.5%) | 248 (59.6%) |
| 25 to 34 Years | 365 (88.8%) | 130 (99.2%) |
| 35 to 44 Years | 139 (80.3%) | 283 (72.6%) |
| 45 to 54 Years | 237 (78.0%) | 289 (100.0%) |
| 55 to 64 Years | 366 (99.7%) | 352 (99.7%) |
| 65 to 74 Years | 197 (100.0%) | 166 (90.7%) |
| 75 Years and over | 68 (59.7%) | 370 (81.0%) |
| Total | 1,934 (87.5%) | 2,351 (86.1%) |
Income Below Poverty Among Married-Couple Families in Eureka
The poverty statistics for married-couple families in Eureka show that 8.5% or 104 of the total 1,221 families live below the poverty line. Families with no children have the highest poverty rate of 13.3%, comprising of 104 families. On the other hand, families with 1 or 2 children have the lowest poverty rate of 0.0%, which includes 0 families.
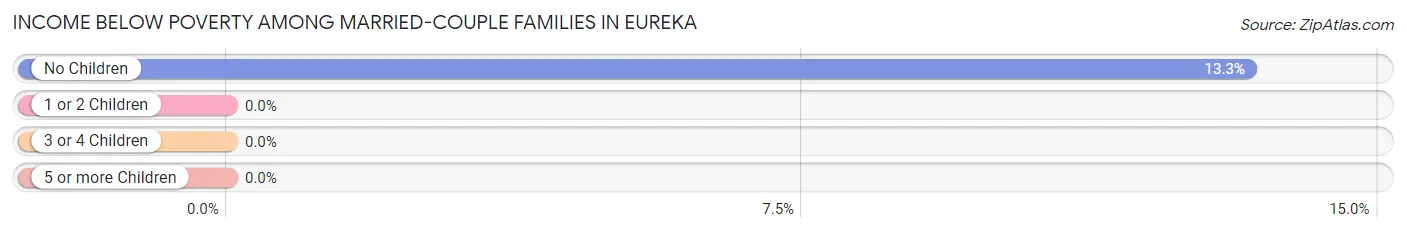
| Children | Above Poverty | Below Poverty |
| No Children | 678 (86.7%) | 104 (13.3%) |
| 1 or 2 Children | 325 (100.0%) | 0 (0.0%) |
| 3 or 4 Children | 114 (100.0%) | 0 (0.0%) |
| 5 or more Children | 0 (0.0%) | 0 (0.0%) |
| Total | 1,117 (91.5%) | 104 (8.5%) |
Income Below Poverty Among Single-Parent Households in Eureka
According to the poverty data in Eureka, 42.3% or 22 single-father households and 14.8% or 23 single-mother households are living below the poverty line. Among single-father households, those with no children have the highest poverty rate, with 9 households (100.0%) experiencing poverty. Likewise, among single-mother households, those with 1 or 2 children have the highest poverty rate, with 23 households (52.3%) falling below the poverty line.
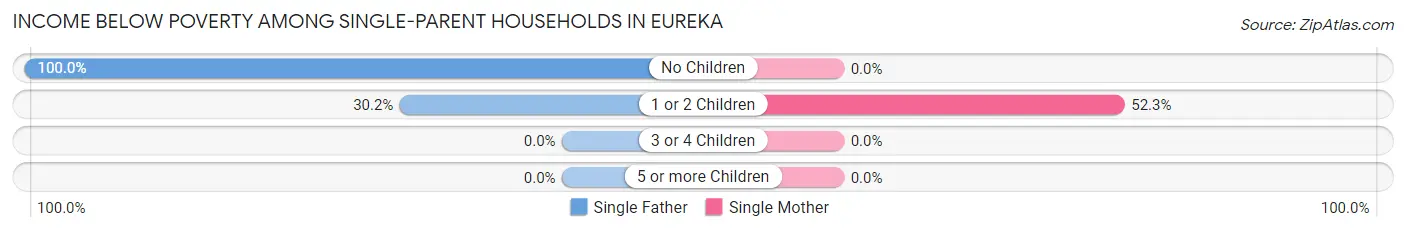
| Children | Single Father | Single Mother |
| No Children | 9 (100.0%) | 0 (0.0%) |
| 1 or 2 Children | 13 (30.2%) | 23 (52.3%) |
| 3 or 4 Children | 0 (0.0%) | 0 (0.0%) |
| 5 or more Children | 0 (0.0%) | 0 (0.0%) |
| Total | 22 (42.3%) | 23 (14.8%) |
Income Below Poverty Among Married-Couple vs Single-Parent Households in Eureka
The poverty data for Eureka shows that 104 of the married-couple family households (8.5%) and 45 of the single-parent households (21.7%) are living below the poverty level. Within the married-couple family households, those with no children have the highest poverty rate, with 104 households (13.3%) falling below the poverty line. Among the single-parent households, those with 1 or 2 children have the highest poverty rate, with 36 household (41.4%) living below poverty.
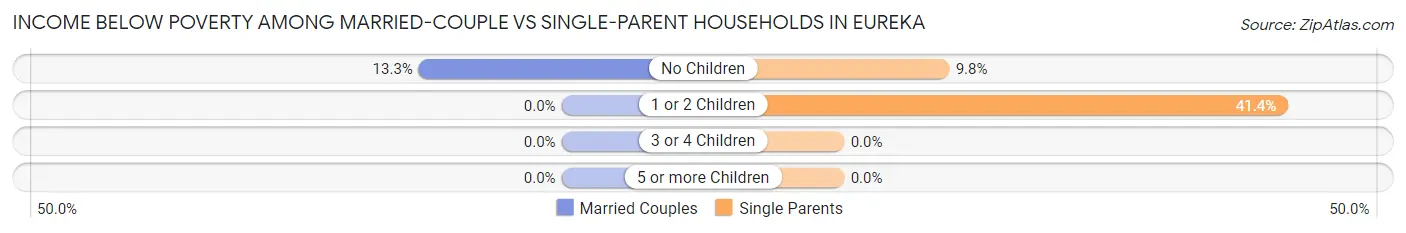
| Children | Married-Couple Families | Single-Parent Households |
| No Children | 104 (13.3%) | 9 (9.8%) |
| 1 or 2 Children | 0 (0.0%) | 36 (41.4%) |
| 3 or 4 Children | 0 (0.0%) | 0 (0.0%) |
| 5 or more Children | 0 (0.0%) | 0 (0.0%) |
| Total | 104 (8.5%) | 45 (21.7%) |
Race in Eureka
The most populous races in Eureka are White / Caucasian (5,021 | 91.2%), Some other Race (231 | 4.2%), and Hispanic or Latino (225 | 4.1%).
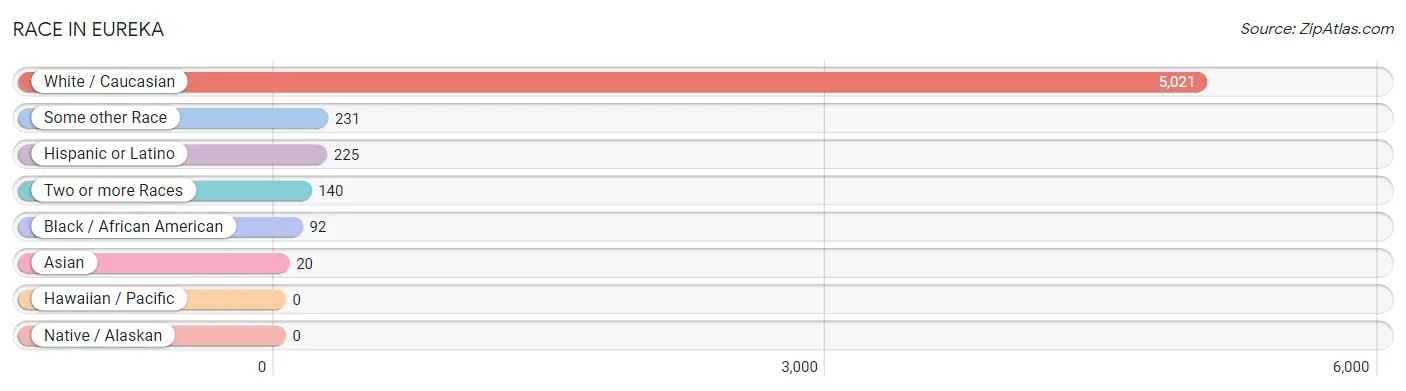
| Race | # Population | % Population |
| Asian | 20 | 0.4% |
| Black / African American | 92 | 1.7% |
| Hawaiian / Pacific | 0 | 0.0% |
| Hispanic or Latino | 225 | 4.1% |
| Native / Alaskan | 0 | 0.0% |
| White / Caucasian | 5,021 | 91.2% |
| Two or more Races | 140 | 2.5% |
| Some other Race | 231 | 4.2% |
| Total | 5,504 | 100.0% |
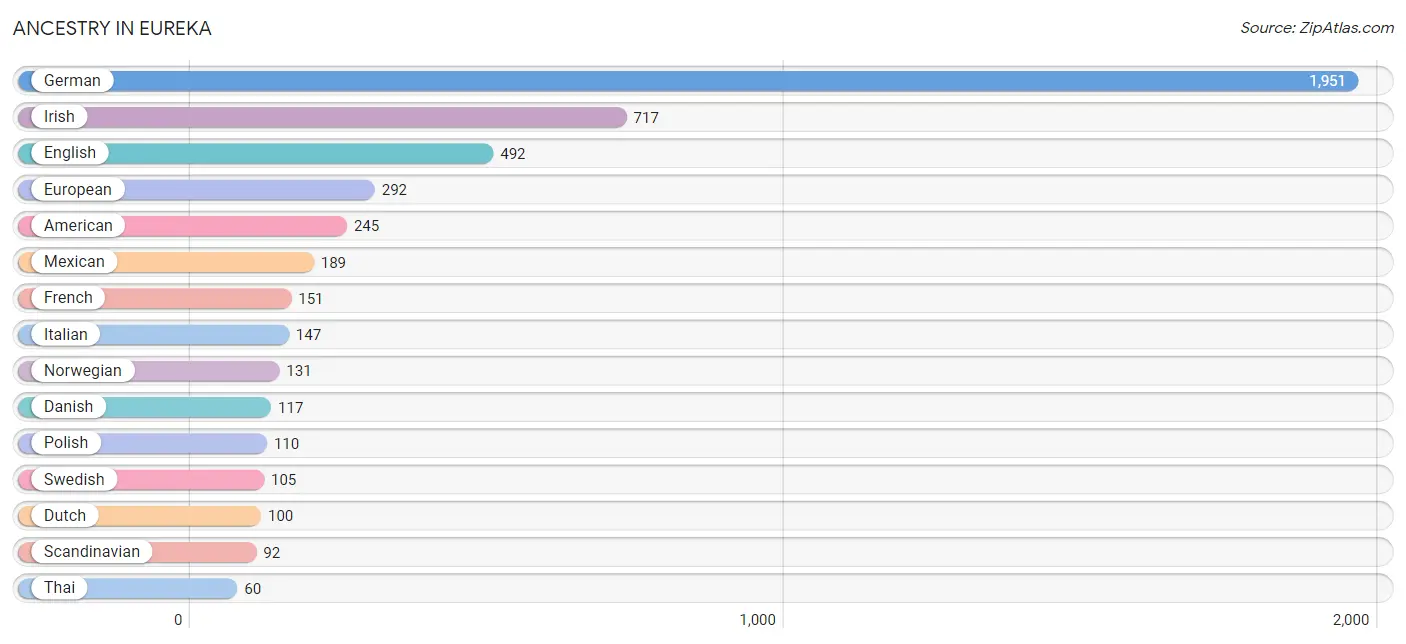
Ancestry in Eureka
The most populous ancestries reported in Eureka are German (1,951 | 35.4%), Irish (717 | 13.0%), English (492 | 8.9%), European (292 | 5.3%), and American (245 | 4.4%), together accounting for 67.2% of all Eureka residents.
| Ancestry | # Population | % Population |
| African | 7 | 0.1% |
| American | 245 | 4.4% |
| Arab | 44 | 0.8% |
| Czech | 20 | 0.4% |
| Danish | 117 | 2.1% |
| Dutch | 100 | 1.8% |
| Eastern European | 8 | 0.2% |
| Egyptian | 13 | 0.2% |
| English | 492 | 8.9% |
| European | 292 | 5.3% |
| French | 151 | 2.7% |
| French Canadian | 1 | 0.0% |
| German | 1,951 | 35.4% |
| Guyanese | 14 | 0.3% |
| Hungarian | 7 | 0.1% |
| Indian (Asian) | 19 | 0.4% |
| Irish | 717 | 13.0% |
| Italian | 147 | 2.7% |
| Korean | 7 | 0.1% |
| Lebanese | 31 | 0.6% |
| Mexican | 189 | 3.4% |
| Norwegian | 131 | 2.4% |
| Polish | 110 | 2.0% |
| Puerto Rican | 18 | 0.3% |
| Russian | 33 | 0.6% |
| Scandinavian | 92 | 1.7% |
| Scotch-Irish | 59 | 1.1% |
| Scottish | 32 | 0.6% |
| Slovene | 12 | 0.2% |
| Subsaharan African | 7 | 0.1% |
| Swedish | 105 | 1.9% |
| Swiss | 47 | 0.9% |
| Thai | 60 | 1.1% |
| Welsh | 5 | 0.1% | View All 34 Rows |
Immigrants in Eureka
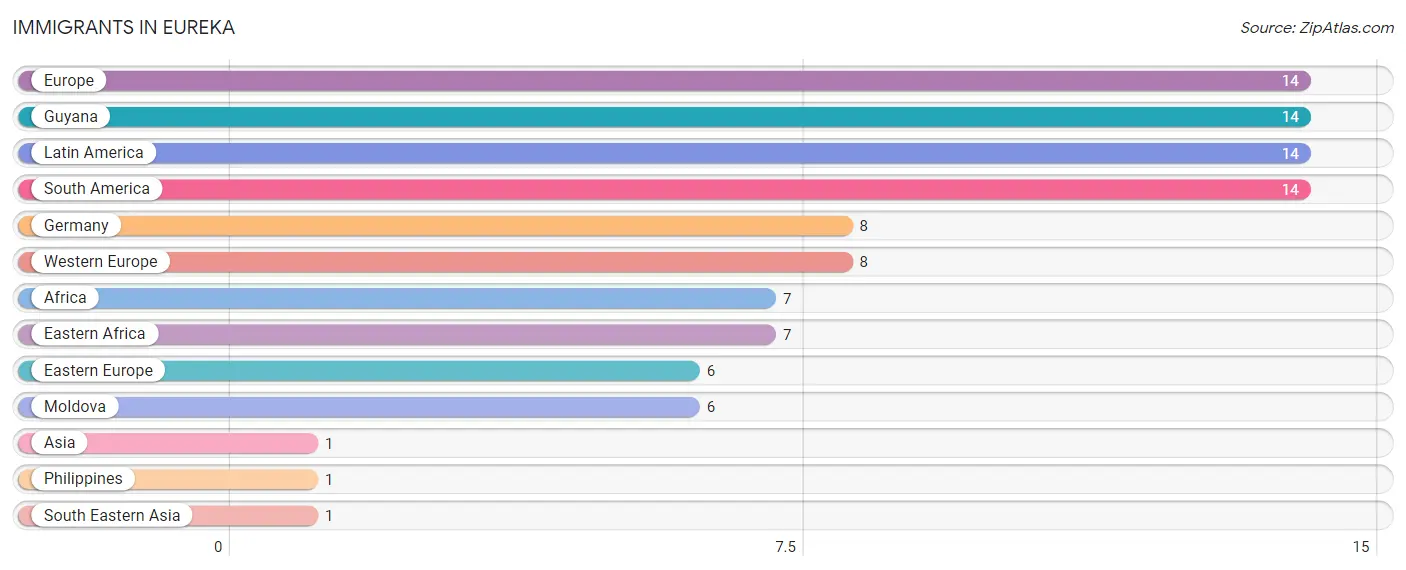
The most numerous immigrant groups reported in Eureka came from Europe (14 | 0.3%), Guyana (14 | 0.3%), Latin America (14 | 0.3%), South America (14 | 0.3%), and Germany (8 | 0.2%), together accounting for 1.1% of all Eureka residents.
| Immigration Origin | # Population | % Population |
| Africa | 7 | 0.1% |
| Asia | 1 | 0.0% |
| Eastern Africa | 7 | 0.1% |
| Eastern Europe | 6 | 0.1% |
| Europe | 14 | 0.3% |
| Germany | 8 | 0.2% |
| Guyana | 14 | 0.3% |
| Latin America | 14 | 0.3% |
| Moldova | 6 | 0.1% |
| Philippines | 1 | 0.0% |
| South America | 14 | 0.3% |
| South Eastern Asia | 1 | 0.0% |
| Western Europe | 8 | 0.2% | View All 13 Rows |
Sex and Age in Eureka
Sex and Age in Eureka
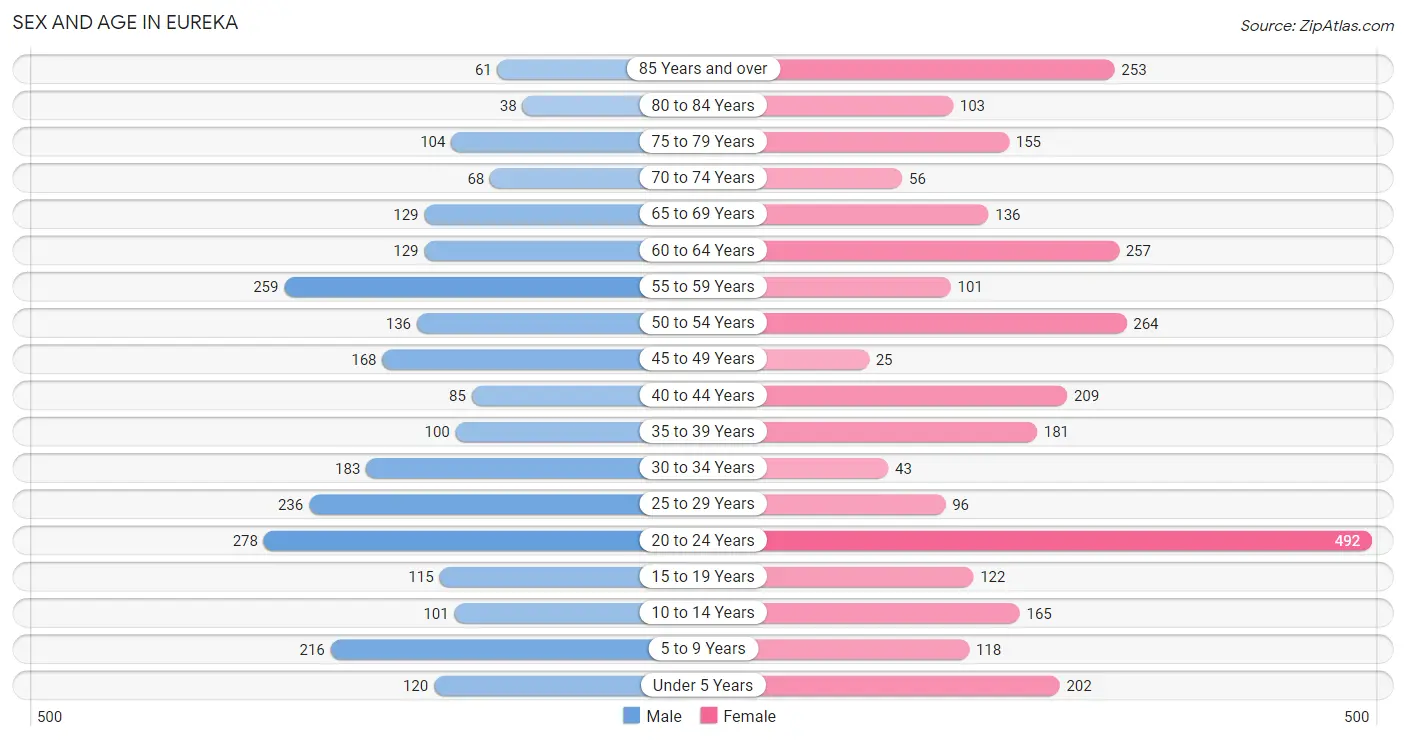
The most populous age groups in Eureka are 20 to 24 Years (278 | 11.0%) for men and 20 to 24 Years (492 | 16.5%) for women.
| Age Bracket | Male | Female |
| Under 5 Years | 120 (4.8%) | 202 (6.8%) |
| 5 to 9 Years | 216 (8.6%) | 118 (4.0%) |
| 10 to 14 Years | 101 (4.0%) | 165 (5.5%) |
| 15 to 19 Years | 115 (4.5%) | 122 (4.1%) |
| 20 to 24 Years | 278 (11.0%) | 492 (16.5%) |
| 25 to 29 Years | 236 (9.3%) | 96 (3.2%) |
| 30 to 34 Years | 183 (7.2%) | 43 (1.4%) |
| 35 to 39 Years | 100 (4.0%) | 181 (6.1%) |
| 40 to 44 Years | 85 (3.4%) | 209 (7.0%) |
| 45 to 49 Years | 168 (6.7%) | 25 (0.8%) |
| 50 to 54 Years | 136 (5.4%) | 264 (8.9%) |
| 55 to 59 Years | 259 (10.2%) | 101 (3.4%) |
| 60 to 64 Years | 129 (5.1%) | 257 (8.6%) |
| 65 to 69 Years | 129 (5.1%) | 136 (4.6%) |
| 70 to 74 Years | 68 (2.7%) | 56 (1.9%) |
| 75 to 79 Years | 104 (4.1%) | 155 (5.2%) |
| 80 to 84 Years | 38 (1.5%) | 103 (3.5%) |
| 85 Years and over | 61 (2.4%) | 253 (8.5%) |
| Total | 2,526 (100.0%) | 2,978 (100.0%) |
Families and Households in Eureka
Median Family Size in Eureka
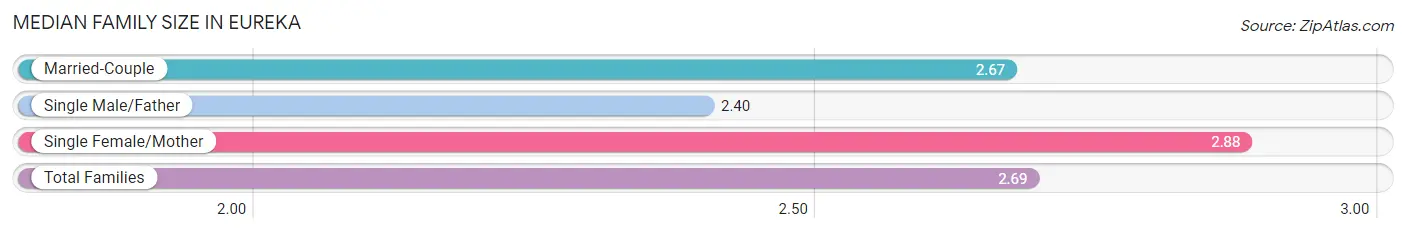
The median family size in Eureka is 2.69 persons per family, with single female/mother families (155 | 10.8%) accounting for the largest median family size of 2.88 persons per family. On the other hand, single male/father families (52 | 3.6%) represent the smallest median family size with 2.40 persons per family.
| Family Type | # Families | Family Size |
| Married-Couple | 1,221 (85.5%) | 2.67 |
| Single Male/Father | 52 (3.6%) | 2.40 |
| Single Female/Mother | 155 (10.8%) | 2.88 |
| Total Families | 1,428 (100.0%) | 2.69 |
Median Household Size in Eureka
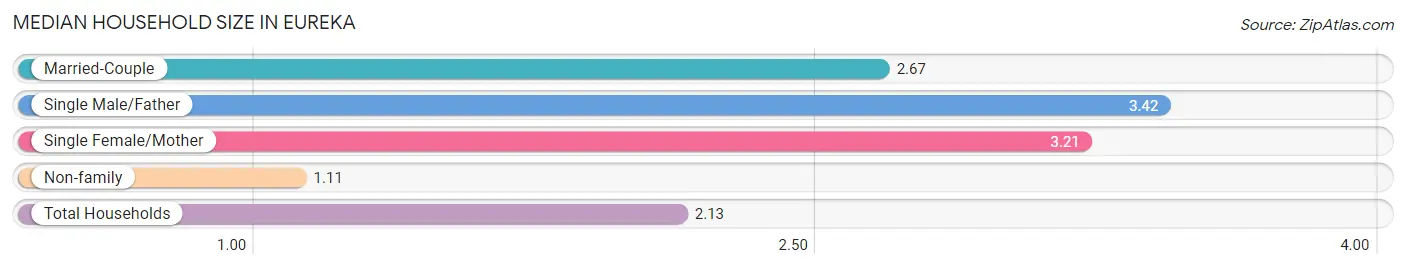
The median household size in Eureka is 2.13 persons per household, with single male/father households (52 | 2.2%) accounting for the largest median household size of 3.42 persons per household. non-family households (885 | 38.3%) represent the smallest median household size with 1.11 persons per household.
| Household Type | # Households | Household Size |
| Married-Couple | 1,221 (52.8%) | 2.67 |
| Single Male/Father | 52 (2.2%) | 3.42 |
| Single Female/Mother | 155 (6.7%) | 3.21 |
| Non-family | 885 (38.3%) | 1.11 |
| Total Households | 2,313 (100.0%) | 2.13 |
Household Size by Marriage Status in Eureka
Out of a total of 2,313 households in Eureka, 1,428 (61.7%) are family households, while 885 (38.3%) are nonfamily households. The most numerous type of family households are 2-person households, comprising 776, and the most common type of nonfamily households are 1-person households, comprising 819.
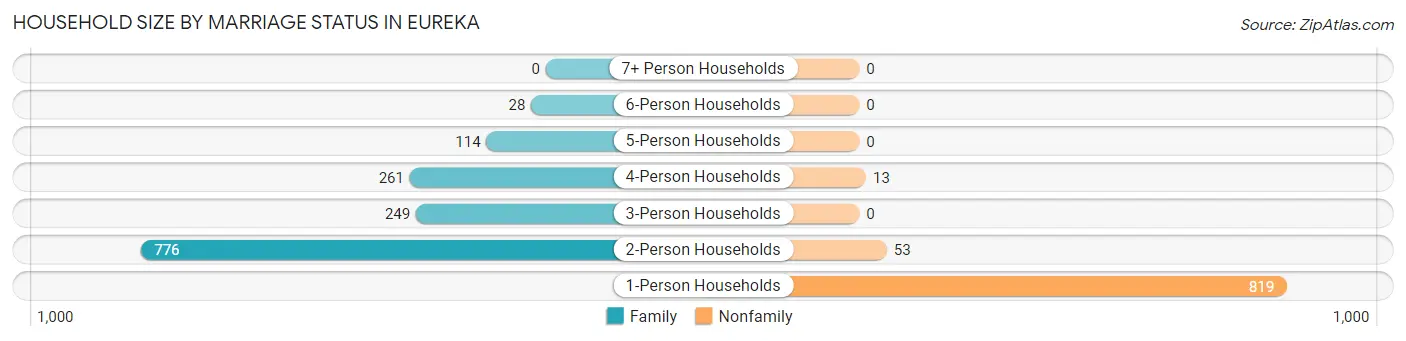
| Household Size | Family Households | Nonfamily Households |
| 1-Person Households | - | 819 (35.4%) |
| 2-Person Households | 776 (33.6%) | 53 (2.3%) |
| 3-Person Households | 249 (10.8%) | 0 (0.0%) |
| 4-Person Households | 261 (11.3%) | 13 (0.6%) |
| 5-Person Households | 114 (4.9%) | 0 (0.0%) |
| 6-Person Households | 28 (1.2%) | 0 (0.0%) |
| 7+ Person Households | 0 (0.0%) | 0 (0.0%) |
| Total | 1,428 (61.7%) | 885 (38.3%) |
Female Fertility in Eureka
Fertility by Age in Eureka
Average fertility rate in Eureka is 56.0 births per 1,000 women. Women in the age bracket of 20 to 34 years have the highest fertility rate with 103.0 births per 1,000 women. Women in the age bracket of 20 to 34 years acount for 100.0% of all women with births.
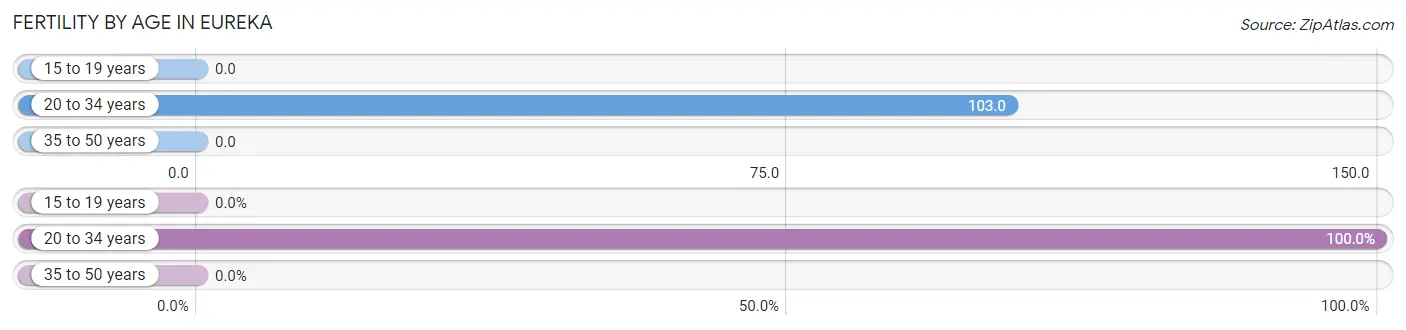
| Age Bracket | Women with Births | Births / 1,000 Women |
| 15 to 19 years | 0 (0.0%) | 0.0 |
| 20 to 34 years | 65 (100.0%) | 103.0 |
| 35 to 50 years | 0 (0.0%) | 0.0 |
| Total | 65 (100.0%) | 56.0 |
Fertility by Age by Marriage Status in Eureka
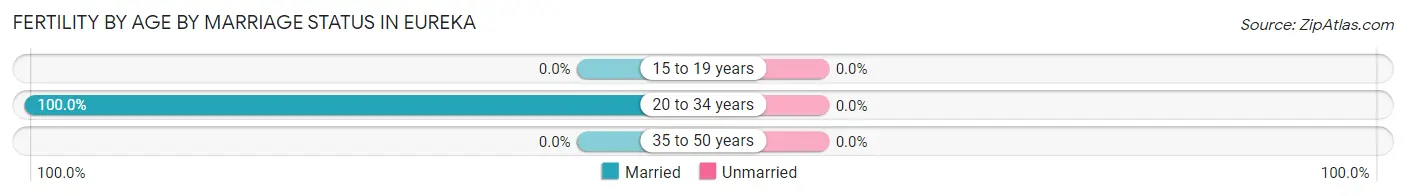
| Age Bracket | Married | Unmarried |
| 15 to 19 years | 0 (0.0%) | 0 (0.0%) |
| 20 to 34 years | 65 (100.0%) | 0 (0.0%) |
| 35 to 50 years | 0 (0.0%) | 0 (0.0%) |
| Total | 65 (100.0%) | 0 (0.0%) |
Fertility by Education in Eureka
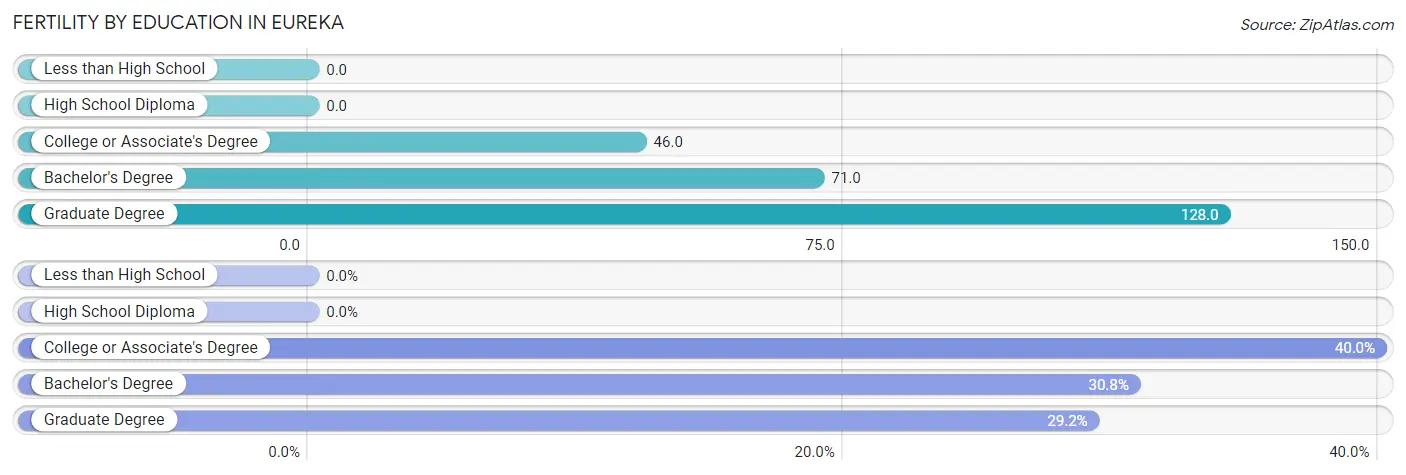
| Educational Attainment | Women with Births | Births / 1,000 Women |
| Less than High School | 0 (0.0%) | 0.0 |
| High School Diploma | 0 (0.0%) | 0.0 |
| College or Associate's Degree | 26 (40.0%) | 46.0 |
| Bachelor's Degree | 20 (30.8%) | 71.0 |
| Graduate Degree | 19 (29.2%) | 128.0 |
| Total | 65 (100.0%) | 56.0 |
Fertility by Education by Marriage Status in Eureka
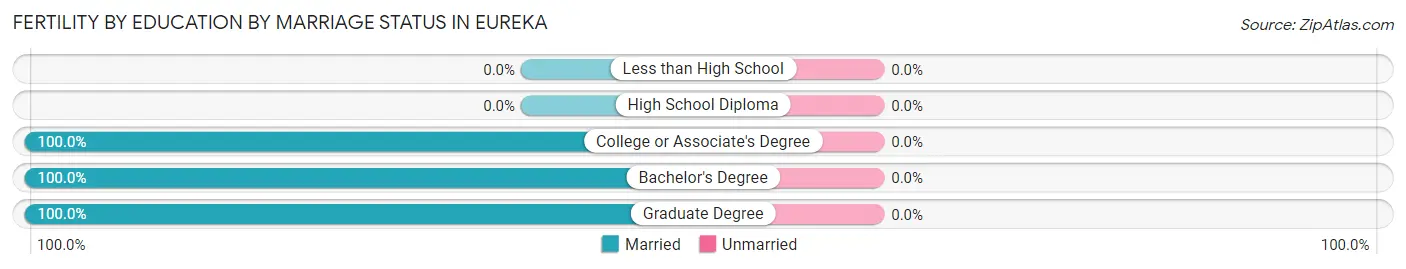
| Educational Attainment | Married | Unmarried |
| Less than High School | 0 (0.0%) | 0 (0.0%) |
| High School Diploma | 0 (0.0%) | 0 (0.0%) |
| College or Associate's Degree | 26 (100.0%) | 0 (0.0%) |
| Bachelor's Degree | 20 (100.0%) | 0 (0.0%) |
| Graduate Degree | 19 (100.0%) | 0 (0.0%) |
| Total | 65 (100.0%) | 0 (0.0%) |
Employment Characteristics in Eureka
Employment by Class of Employer in Eureka
Among the 2,710 employed individuals in Eureka, private company employees (1,801 | 66.5%), not-for-profit organizations (495 | 18.3%), and local government employees (185 | 6.8%) make up the most common classes of employment.
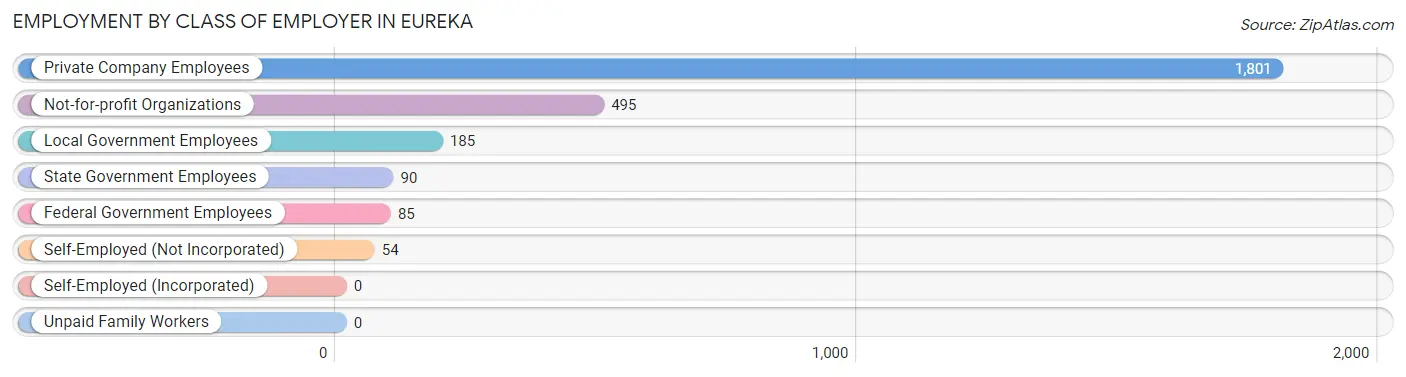
| Employer Class | # Employees | % Employees |
| Private Company Employees | 1,801 | 66.5% |
| Self-Employed (Incorporated) | 0 | 0.0% |
| Self-Employed (Not Incorporated) | 54 | 2.0% |
| Not-for-profit Organizations | 495 | 18.3% |
| Local Government Employees | 185 | 6.8% |
| State Government Employees | 90 | 3.3% |
| Federal Government Employees | 85 | 3.1% |
| Unpaid Family Workers | 0 | 0.0% |
| Total | 2,710 | 100.0% |
Employment Status by Age in Eureka
According to the labor force statistics for Eureka, out of the total population over 16 years of age (4,582), 64.3% or 2,946 individuals are in the labor force, with 7.6% or 224 of them unemployed. The age group with the highest labor force participation rate is 25 to 29 years, with 99.1% or 329 individuals in the labor force. Within the labor force, the 25 to 29 years age range has the highest percentage of unemployed individuals, with 27.1% or 89 of them being unemployed.
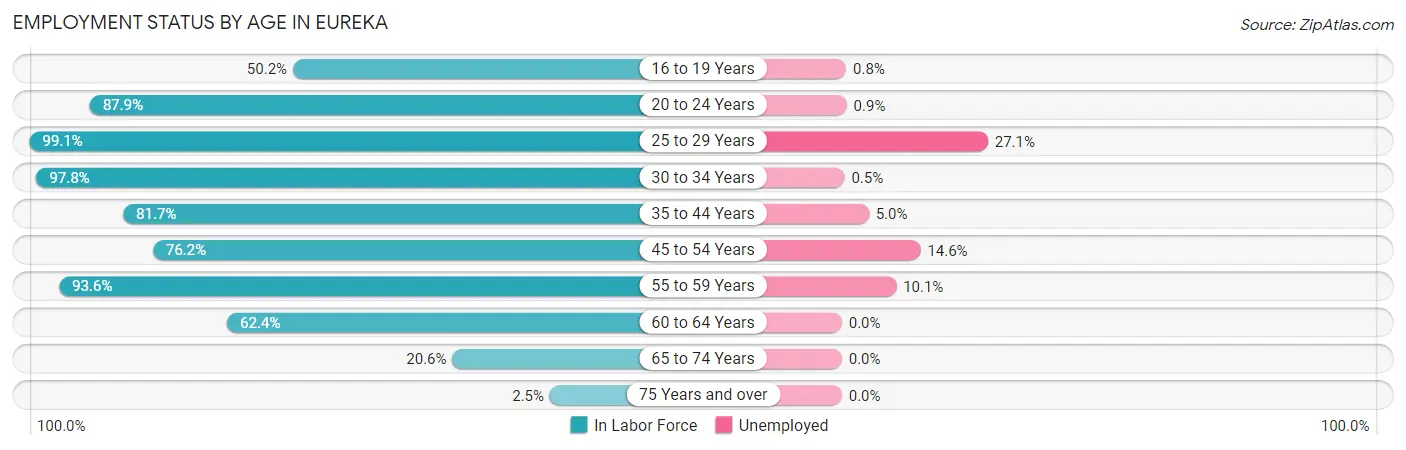
| Age Bracket | In Labor Force | Unemployed |
| 16 to 19 Years | 119 (50.2%) | 1 (0.8%) |
| 20 to 24 Years | 677 (87.9%) | 6 (0.9%) |
| 25 to 29 Years | 329 (99.1%) | 89 (27.1%) |
| 30 to 34 Years | 221 (97.8%) | 1 (0.5%) |
| 35 to 44 Years | 470 (81.7%) | 24 (5.0%) |
| 45 to 54 Years | 452 (76.2%) | 66 (14.6%) |
| 55 to 59 Years | 337 (93.6%) | 34 (10.1%) |
| 60 to 64 Years | 241 (62.4%) | 0 (0.0%) |
| 65 to 74 Years | 80 (20.6%) | 0 (0.0%) |
| 75 Years and over | 18 (2.5%) | 0 (0.0%) |
| Total | 2,946 (64.3%) | 224 (7.6%) |
Employment Status by Educational Attainment in Eureka
According to labor force statistics for Eureka, 82.9% of individuals (2,049) out of the total population between 25 and 64 years of age (2,472) are in the labor force, with 10.5% or 215 of them being unemployed. The group with the highest labor force participation rate are those with the educational attainment of less than high school, with 93.8% or 91 individuals in the labor force. Within the labor force, individuals with high school diploma education have the highest percentage of unemployment, with 20.0% or 106 of them being unemployed.
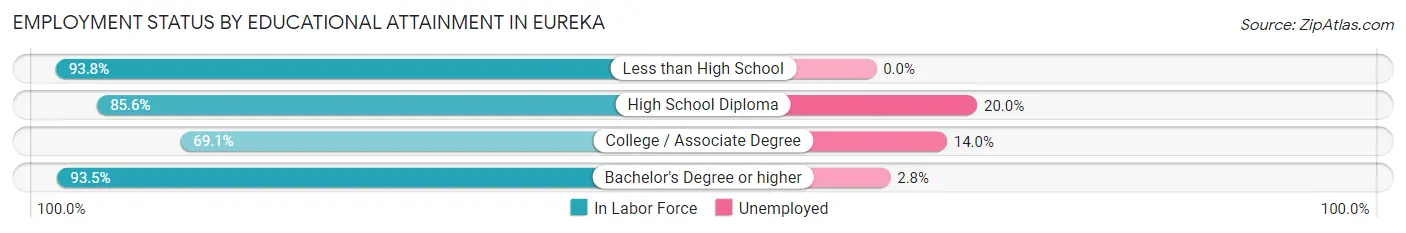
| Educational Attainment | In Labor Force | Unemployed |
| Less than High School | 91 (93.8%) | 0 (0.0%) |
| High School Diploma | 529 (85.6%) | 124 (20.0%) |
| College / Associate Degree | 602 (69.1%) | 122 (14.0%) |
| Bachelor's Degree or higher | 828 (93.5%) | 25 (2.8%) |
| Total | 2,049 (82.9%) | 260 (10.5%) |
Employment Occupations by Sex in Eureka
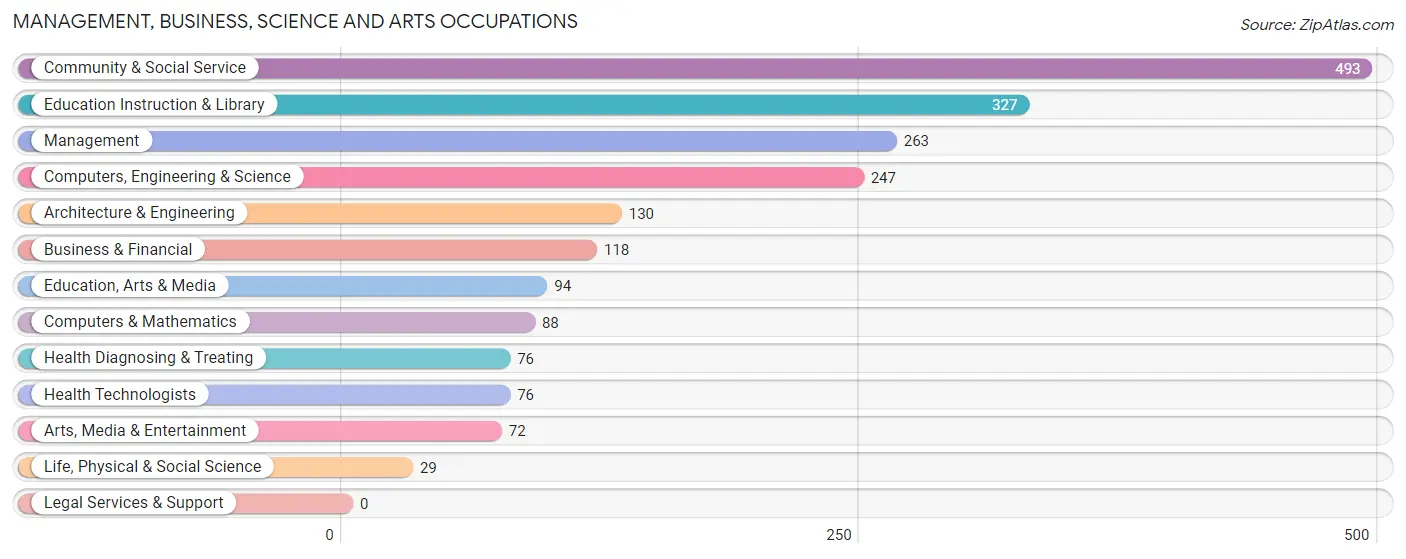
Management, Business, Science and Arts Occupations
The most common Management, Business, Science and Arts occupations in Eureka are Community & Social Service (493 | 18.3%), Education Instruction & Library (327 | 12.2%), Management (263 | 9.8%), Computers, Engineering & Science (247 | 9.2%), and Architecture & Engineering (130 | 4.8%).
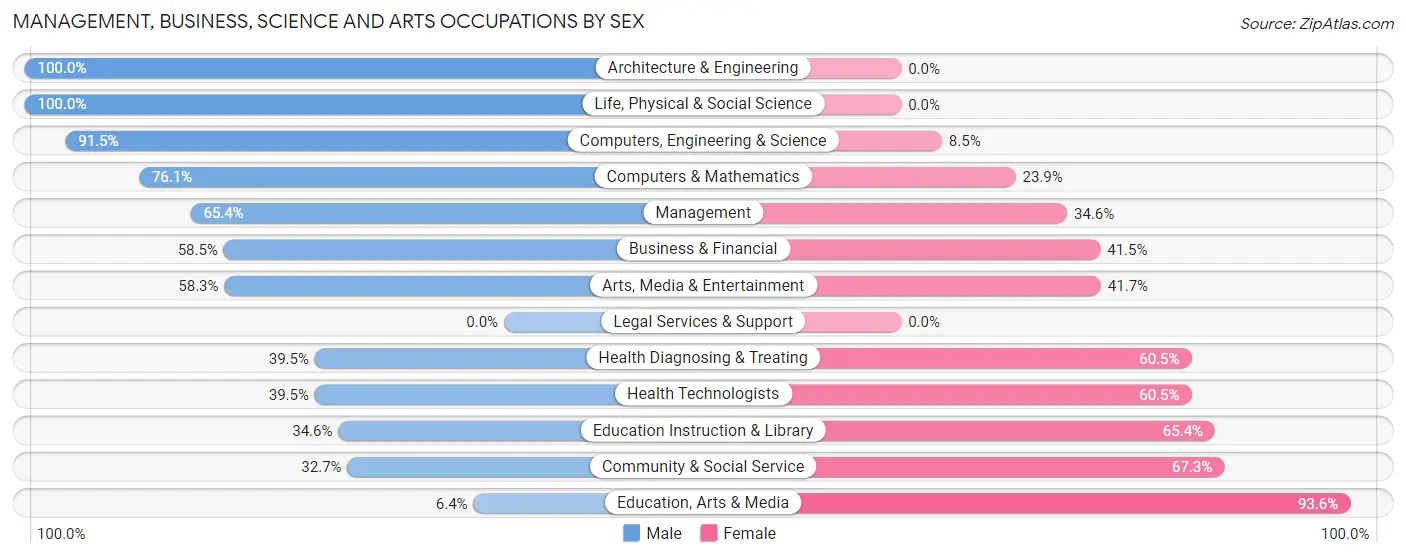
Management, Business, Science and Arts Occupations by Sex
Within the Management, Business, Science and Arts occupations in Eureka, the most male-oriented occupations are Architecture & Engineering (100.0%), Life, Physical & Social Science (100.0%), and Computers, Engineering & Science (91.5%), while the most female-oriented occupations are Education, Arts & Media (93.6%), Community & Social Service (67.3%), and Education Instruction & Library (65.4%).
| Occupation | Male | Female |
| Management | 172 (65.4%) | 91 (34.6%) |
| Business & Financial | 69 (58.5%) | 49 (41.5%) |
| Computers, Engineering & Science | 226 (91.5%) | 21 (8.5%) |
| Computers & Mathematics | 67 (76.1%) | 21 (23.9%) |
| Architecture & Engineering | 130 (100.0%) | 0 (0.0%) |
| Life, Physical & Social Science | 29 (100.0%) | 0 (0.0%) |
| Community & Social Service | 161 (32.7%) | 332 (67.3%) |
| Education, Arts & Media | 6 (6.4%) | 88 (93.6%) |
| Legal Services & Support | 0 (0.0%) | 0 (0.0%) |
| Education Instruction & Library | 113 (34.6%) | 214 (65.4%) |
| Arts, Media & Entertainment | 42 (58.3%) | 30 (41.7%) |
| Health Diagnosing & Treating | 30 (39.5%) | 46 (60.5%) |
| Health Technologists | 30 (39.5%) | 46 (60.5%) |
| Total (Category) | 658 (55.0%) | 539 (45.0%) |
| Total (Overall) | 1,314 (48.9%) | 1,375 (51.1%) |
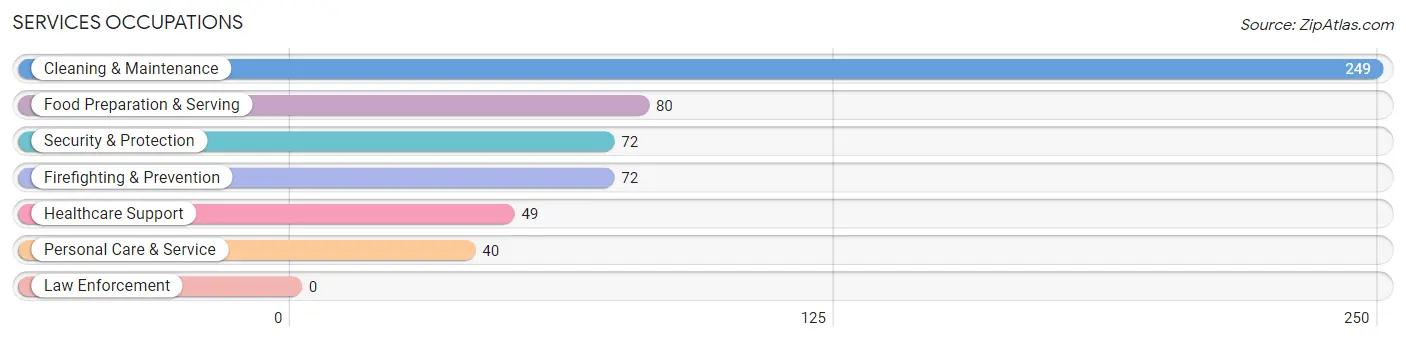
Services Occupations
The most common Services occupations in Eureka are Cleaning & Maintenance (249 | 9.3%), Food Preparation & Serving (80 | 3.0%), Security & Protection (72 | 2.7%), Firefighting & Prevention (72 | 2.7%), and Healthcare Support (49 | 1.8%).
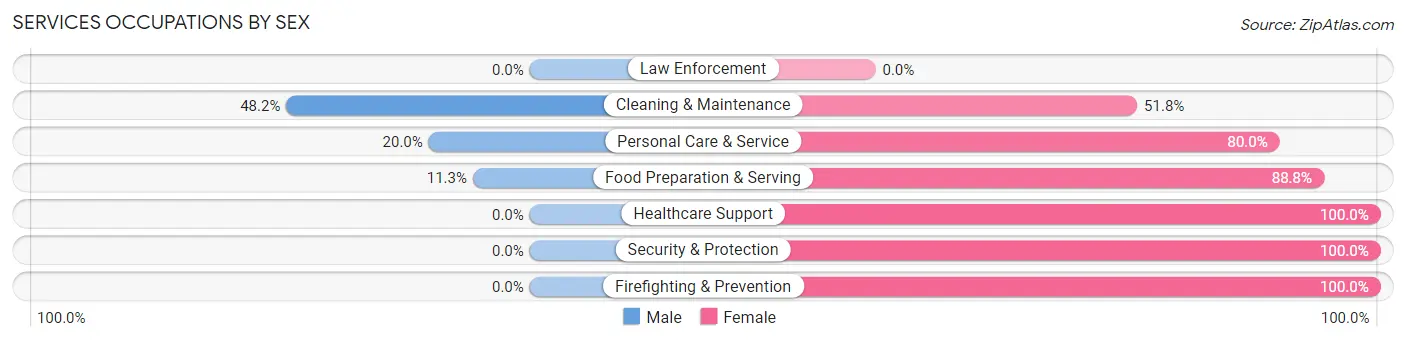
Services Occupations by Sex
Within the Services occupations in Eureka, the most male-oriented occupations are Cleaning & Maintenance (48.2%), Personal Care & Service (20.0%), and Food Preparation & Serving (11.3%), while the most female-oriented occupations are Healthcare Support (100.0%), Security & Protection (100.0%), and Firefighting & Prevention (100.0%).
| Occupation | Male | Female |
| Healthcare Support | 0 (0.0%) | 49 (100.0%) |
| Security & Protection | 0 (0.0%) | 72 (100.0%) |
| Firefighting & Prevention | 0 (0.0%) | 72 (100.0%) |
| Law Enforcement | 0 (0.0%) | 0 (0.0%) |
| Food Preparation & Serving | 9 (11.3%) | 71 (88.7%) |
| Cleaning & Maintenance | 120 (48.2%) | 129 (51.8%) |
| Personal Care & Service | 8 (20.0%) | 32 (80.0%) |
| Total (Category) | 137 (28.0%) | 353 (72.0%) |
| Total (Overall) | 1,314 (48.9%) | 1,375 (51.1%) |
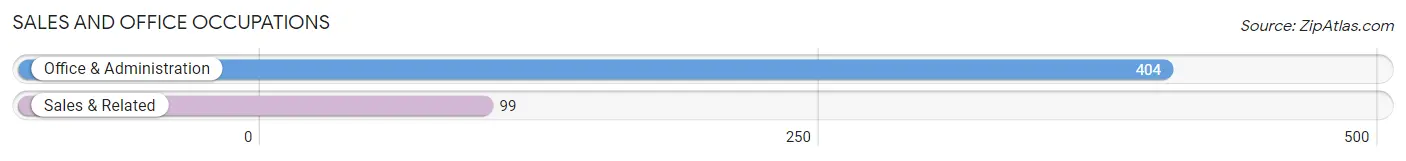
Sales and Office Occupations
The most common Sales and Office occupations in Eureka are Office & Administration (404 | 15.0%), and Sales & Related (99 | 3.7%).
Sales and Office Occupations by Sex
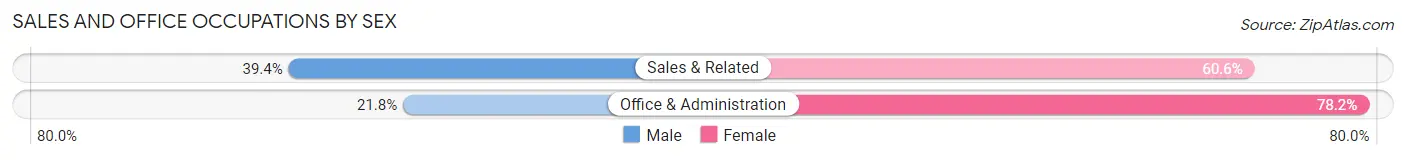
| Occupation | Male | Female |
| Sales & Related | 39 (39.4%) | 60 (60.6%) |
| Office & Administration | 88 (21.8%) | 316 (78.2%) |
| Total (Category) | 127 (25.3%) | 376 (74.8%) |
| Total (Overall) | 1,314 (48.9%) | 1,375 (51.1%) |
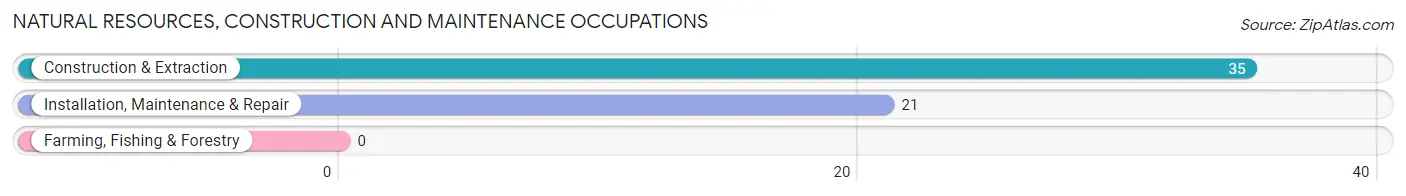
Natural Resources, Construction and Maintenance Occupations
The most common Natural Resources, Construction and Maintenance occupations in Eureka are Construction & Extraction (35 | 1.3%), and Installation, Maintenance & Repair (21 | 0.8%).
Natural Resources, Construction and Maintenance Occupations by Sex
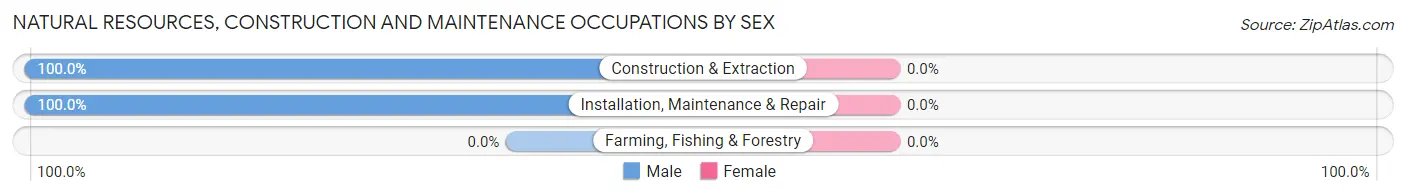
| Occupation | Male | Female |
| Farming, Fishing & Forestry | 0 (0.0%) | 0 (0.0%) |
| Construction & Extraction | 35 (100.0%) | 0 (0.0%) |
| Installation, Maintenance & Repair | 21 (100.0%) | 0 (0.0%) |
| Total (Category) | 56 (100.0%) | 0 (0.0%) |
| Total (Overall) | 1,314 (48.9%) | 1,375 (51.1%) |
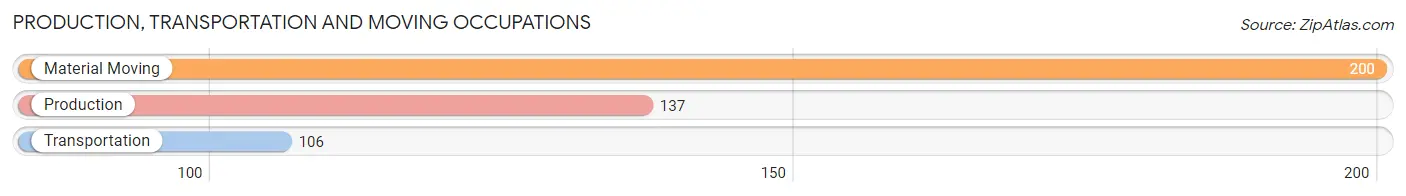
Production, Transportation and Moving Occupations
The most common Production, Transportation and Moving occupations in Eureka are Material Moving (200 | 7.4%), Production (137 | 5.1%), and Transportation (106 | 3.9%).
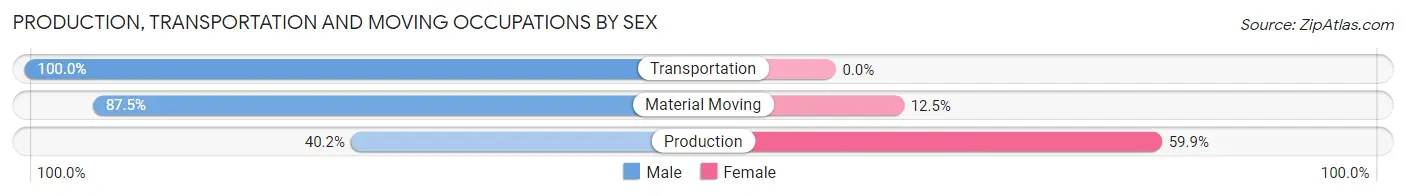
Production, Transportation and Moving Occupations by Sex
| Occupation | Male | Female |
| Production | 55 (40.2%) | 82 (59.9%) |
| Transportation | 106 (100.0%) | 0 (0.0%) |
| Material Moving | 175 (87.5%) | 25 (12.5%) |
| Total (Category) | 336 (75.8%) | 107 (24.1%) |
| Total (Overall) | 1,314 (48.9%) | 1,375 (51.1%) |
Employment Industries by Sex in Eureka
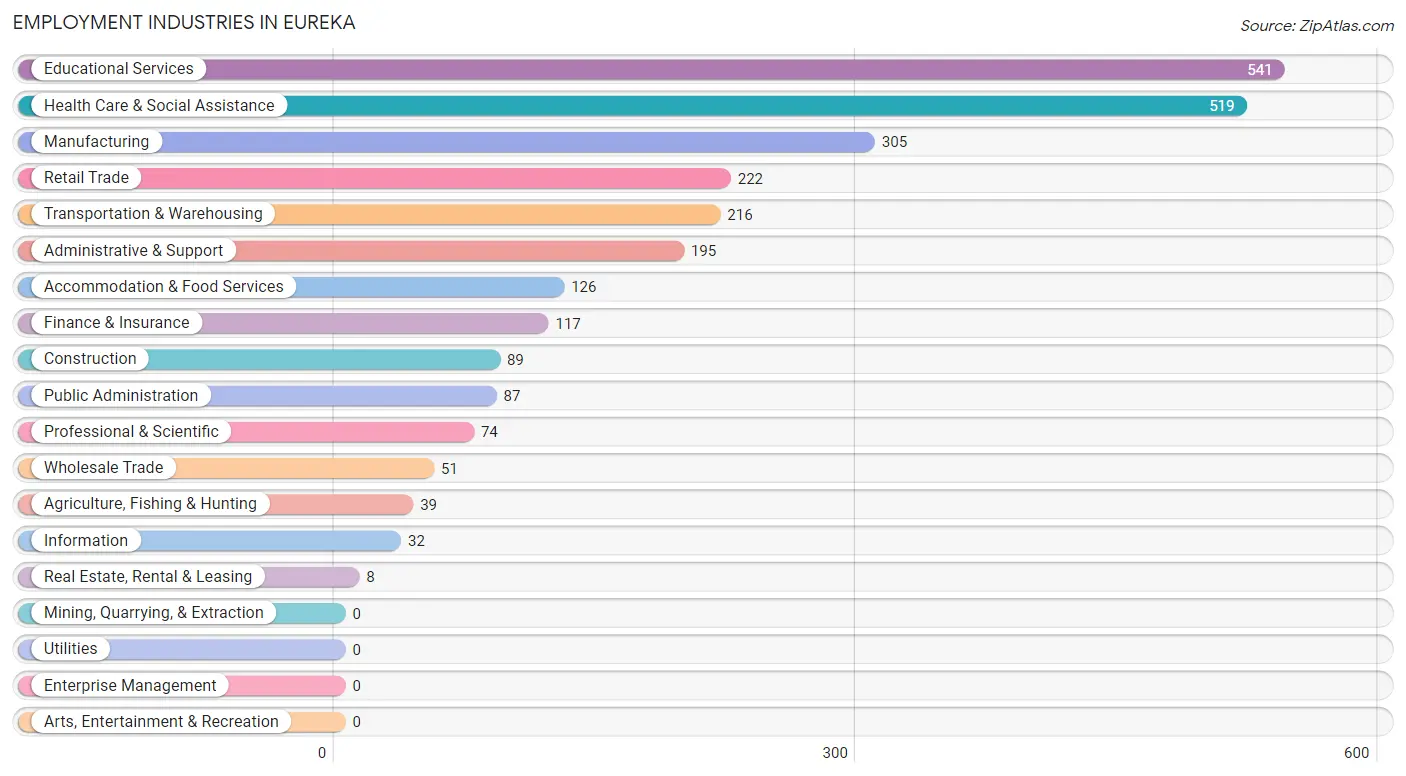
Employment Industries in Eureka
The major employment industries in Eureka include Educational Services (541 | 20.1%), Health Care & Social Assistance (519 | 19.3%), Manufacturing (305 | 11.3%), Retail Trade (222 | 8.3%), and Transportation & Warehousing (216 | 8.0%).
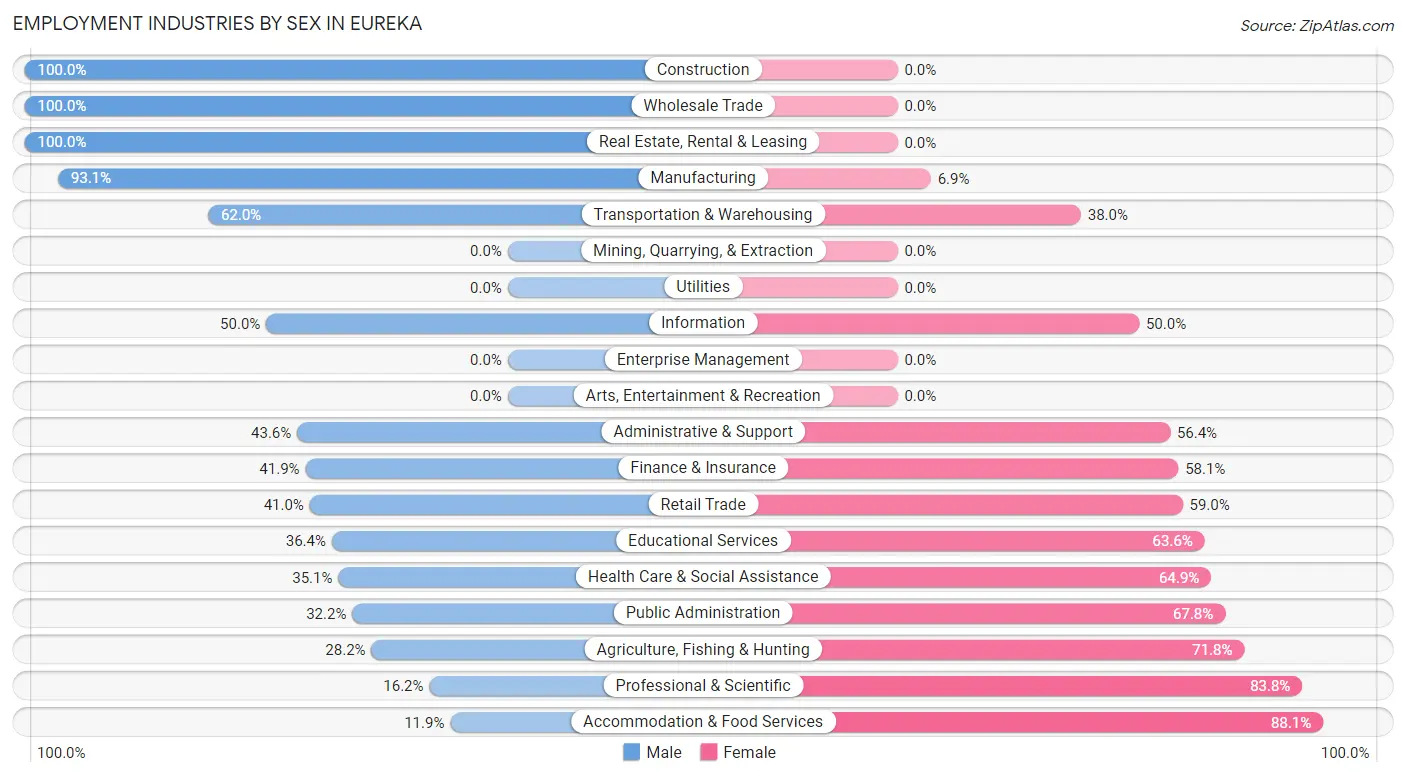
Employment Industries by Sex in Eureka
The Eureka industries that see more men than women are Construction (100.0%), Wholesale Trade (100.0%), and Real Estate, Rental & Leasing (100.0%), whereas the industries that tend to have a higher number of women are Accommodation & Food Services (88.1%), Professional & Scientific (83.8%), and Agriculture, Fishing & Hunting (71.8%).
| Industry | Male | Female |
| Agriculture, Fishing & Hunting | 11 (28.2%) | 28 (71.8%) |
| Mining, Quarrying, & Extraction | 0 (0.0%) | 0 (0.0%) |
| Construction | 89 (100.0%) | 0 (0.0%) |
| Manufacturing | 284 (93.1%) | 21 (6.9%) |
| Wholesale Trade | 51 (100.0%) | 0 (0.0%) |
| Retail Trade | 91 (41.0%) | 131 (59.0%) |
| Transportation & Warehousing | 134 (62.0%) | 82 (38.0%) |
| Utilities | 0 (0.0%) | 0 (0.0%) |
| Information | 16 (50.0%) | 16 (50.0%) |
| Finance & Insurance | 49 (41.9%) | 68 (58.1%) |
| Real Estate, Rental & Leasing | 8 (100.0%) | 0 (0.0%) |
| Professional & Scientific | 12 (16.2%) | 62 (83.8%) |
| Enterprise Management | 0 (0.0%) | 0 (0.0%) |
| Administrative & Support | 85 (43.6%) | 110 (56.4%) |
| Educational Services | 197 (36.4%) | 344 (63.6%) |
| Health Care & Social Assistance | 182 (35.1%) | 337 (64.9%) |
| Arts, Entertainment & Recreation | 0 (0.0%) | 0 (0.0%) |
| Accommodation & Food Services | 15 (11.9%) | 111 (88.1%) |
| Public Administration | 28 (32.2%) | 59 (67.8%) |
| Total | 1,314 (48.9%) | 1,375 (51.1%) |
Education in Eureka
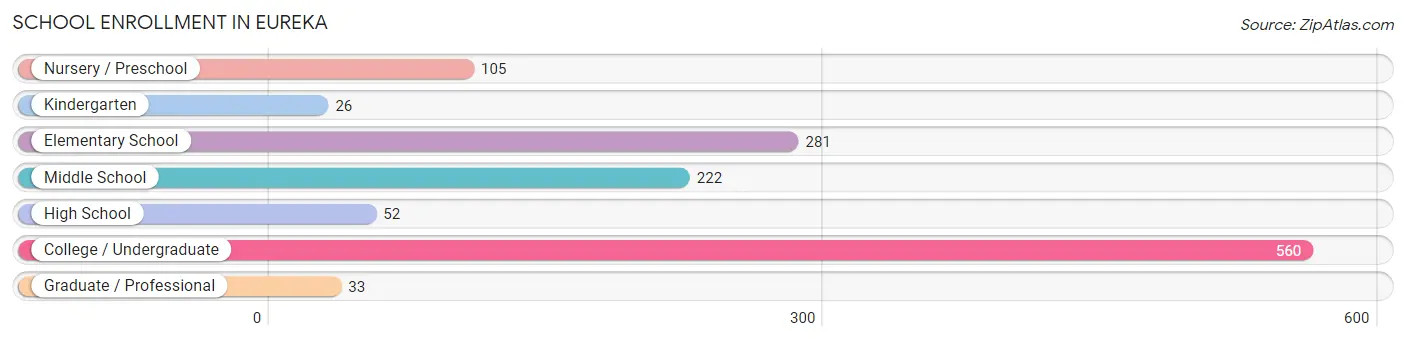
School Enrollment in Eureka
The most common levels of schooling among the 1,279 students in Eureka are college / undergraduate (560 | 43.8%), elementary school (281 | 22.0%), and middle school (222 | 17.4%).
| School Level | # Students | % Students |
| Nursery / Preschool | 105 | 8.2% |
| Kindergarten | 26 | 2.0% |
| Elementary School | 281 | 22.0% |
| Middle School | 222 | 17.4% |
| High School | 52 | 4.1% |
| College / Undergraduate | 560 | 43.8% |
| Graduate / Professional | 33 | 2.6% |
| Total | 1,279 | 100.0% |
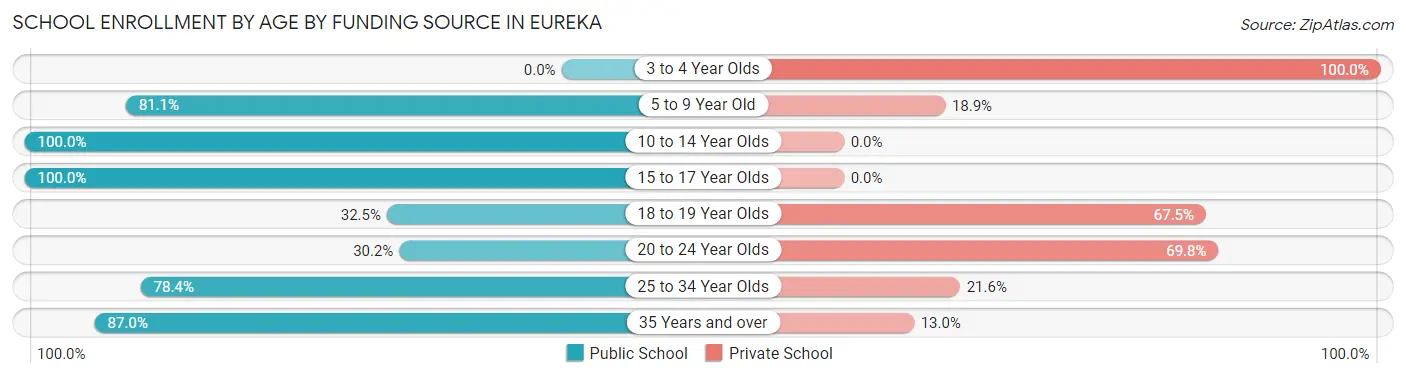
School Enrollment by Age by Funding Source in Eureka
Out of a total of 1,279 students who are enrolled in schools in Eureka, 486 (38.0%) attend a private institution, while the remaining 793 (62.0%) are enrolled in public schools. The age group of 3 to 4 year olds has the highest likelihood of being enrolled in private schools, with 58 (100.0% in the age bracket) enrolled. Conversely, the age group of 10 to 14 year olds has the lowest likelihood of being enrolled in a private school, with 266 (100.0% in the age bracket) attending a public institution.
| Age Bracket | Public School | Private School |
| 3 to 4 Year Olds | 0 (0.0%) | 58 (100.0%) |
| 5 to 9 Year Old | 271 (81.1%) | 63 (18.9%) |
| 10 to 14 Year Olds | 266 (100.0%) | 0 (0.0%) |
| 15 to 17 Year Olds | 28 (100.0%) | 0 (0.0%) |
| 18 to 19 Year Olds | 68 (32.5%) | 141 (67.5%) |
| 20 to 24 Year Olds | 91 (30.2%) | 210 (69.8%) |
| 25 to 34 Year Olds | 29 (78.4%) | 8 (21.6%) |
| 35 Years and over | 40 (87.0%) | 6 (13.0%) |
| Total | 793 (62.0%) | 486 (38.0%) |
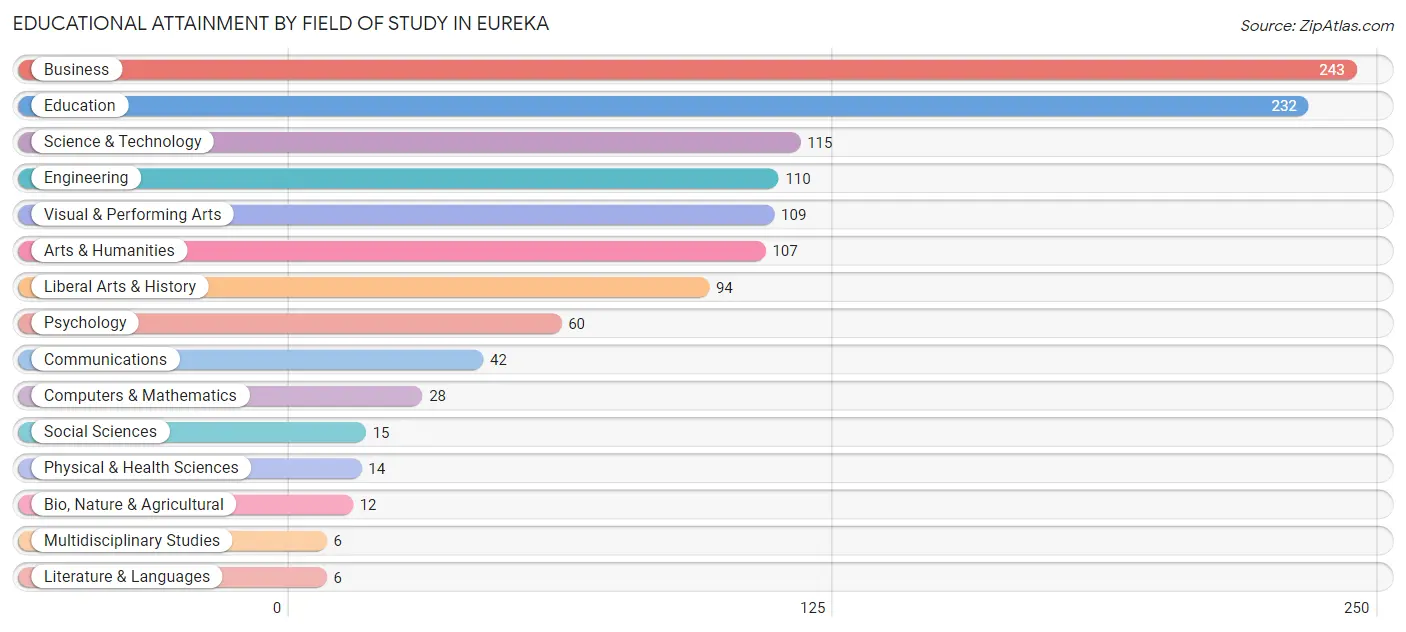
Educational Attainment by Field of Study in Eureka
Business (243 | 20.4%), education (232 | 19.5%), science & technology (115 | 9.6%), engineering (110 | 9.2%), and visual & performing arts (109 | 9.1%) are the most common fields of study among 1,193 individuals in Eureka who have obtained a bachelor's degree or higher.
| Field of Study | # Graduates | % Graduates |
| Computers & Mathematics | 28 | 2.4% |
| Bio, Nature & Agricultural | 12 | 1.0% |
| Physical & Health Sciences | 14 | 1.2% |
| Psychology | 60 | 5.0% |
| Social Sciences | 15 | 1.3% |
| Engineering | 110 | 9.2% |
| Multidisciplinary Studies | 6 | 0.5% |
| Science & Technology | 115 | 9.6% |
| Business | 243 | 20.4% |
| Education | 232 | 19.5% |
| Literature & Languages | 6 | 0.5% |
| Liberal Arts & History | 94 | 7.9% |
| Visual & Performing Arts | 109 | 9.1% |
| Communications | 42 | 3.5% |
| Arts & Humanities | 107 | 9.0% |
| Total | 1,193 | 100.0% |
Transportation & Commute in Eureka
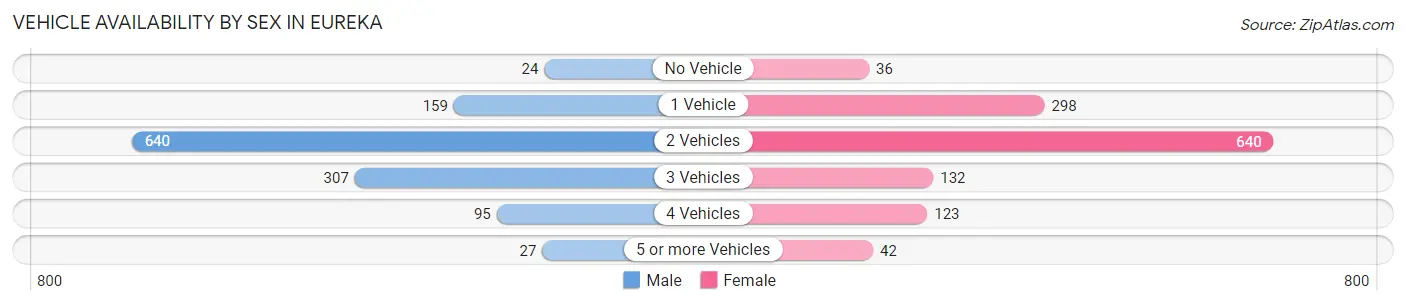
Vehicle Availability by Sex in Eureka
The most prevalent vehicle ownership categories in Eureka are males with 2 vehicles (640, accounting for 51.1%) and females with 2 vehicles (640, making up 50.3%).
| Vehicles Available | Male | Female |
| No Vehicle | 24 (1.9%) | 36 (2.8%) |
| 1 Vehicle | 159 (12.7%) | 298 (23.4%) |
| 2 Vehicles | 640 (51.1%) | 640 (50.3%) |
| 3 Vehicles | 307 (24.5%) | 132 (10.4%) |
| 4 Vehicles | 95 (7.6%) | 123 (9.7%) |
| 5 or more Vehicles | 27 (2.2%) | 42 (3.3%) |
| Total | 1,252 (100.0%) | 1,271 (100.0%) |
Commute Time in Eureka
The most frequently occuring commute durations in Eureka are 5 to 9 minutes (447 commuters, 17.6%), less than 5 minutes (368 commuters, 14.5%), and 30 to 34 minutes (360 commuters, 14.2%).
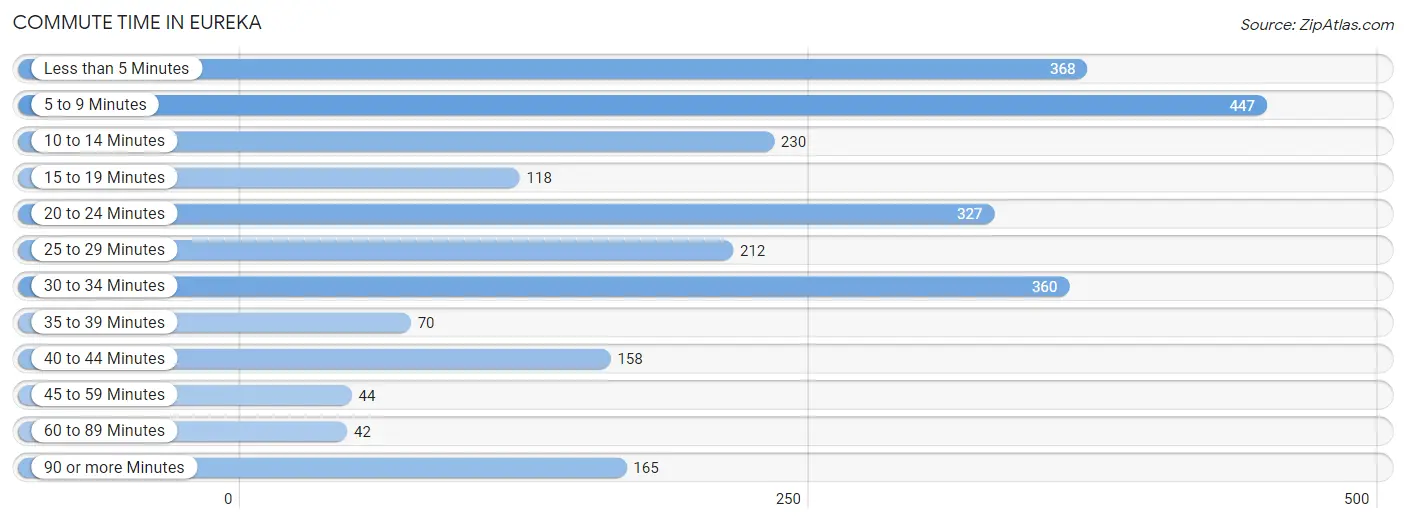
| Commute Time | # Commuters | % Commuters |
| Less than 5 Minutes | 368 | 14.5% |
| 5 to 9 Minutes | 447 | 17.6% |
| 10 to 14 Minutes | 230 | 9.0% |
| 15 to 19 Minutes | 118 | 4.6% |
| 20 to 24 Minutes | 327 | 12.9% |
| 25 to 29 Minutes | 212 | 8.3% |
| 30 to 34 Minutes | 360 | 14.2% |
| 35 to 39 Minutes | 70 | 2.8% |
| 40 to 44 Minutes | 158 | 6.2% |
| 45 to 59 Minutes | 44 | 1.7% |
| 60 to 89 Minutes | 42 | 1.7% |
| 90 or more Minutes | 165 | 6.5% |
Commute Time by Sex in Eureka
The most common commute times in Eureka are 10 to 14 minutes (201 commuters, 16.2%) for males and less than 5 minutes (254 commuters, 19.5%) for females.
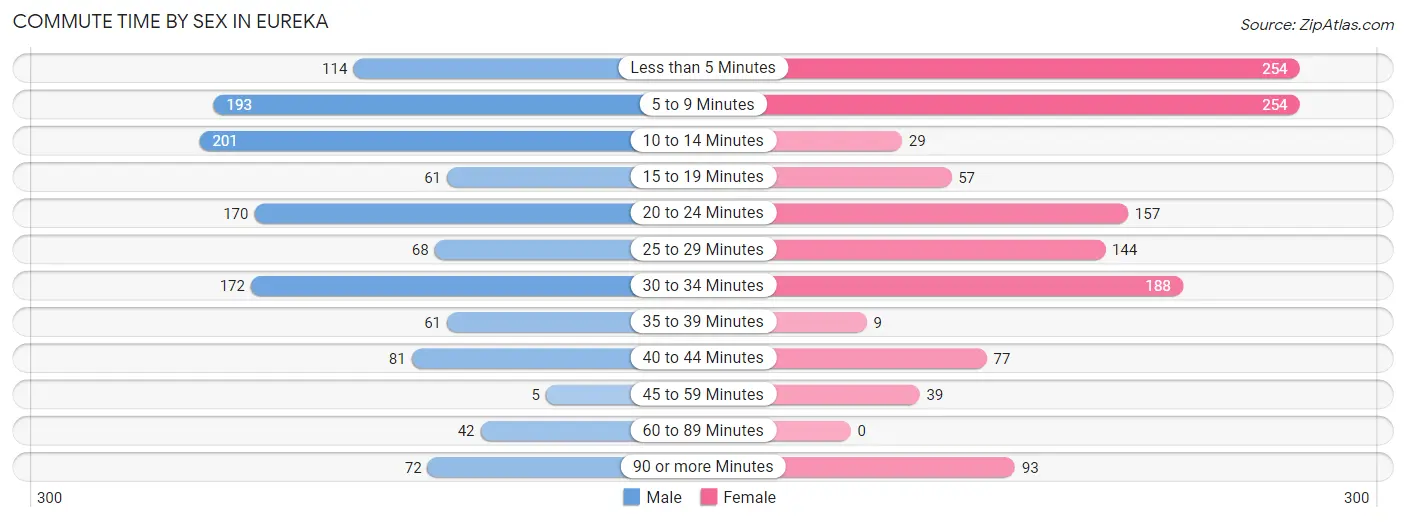
| Commute Time | Male | Female |
| Less than 5 Minutes | 114 (9.2%) | 254 (19.5%) |
| 5 to 9 Minutes | 193 (15.6%) | 254 (19.5%) |
| 10 to 14 Minutes | 201 (16.2%) | 29 (2.2%) |
| 15 to 19 Minutes | 61 (4.9%) | 57 (4.4%) |
| 20 to 24 Minutes | 170 (13.7%) | 157 (12.1%) |
| 25 to 29 Minutes | 68 (5.5%) | 144 (11.1%) |
| 30 to 34 Minutes | 172 (13.9%) | 188 (14.4%) |
| 35 to 39 Minutes | 61 (4.9%) | 9 (0.7%) |
| 40 to 44 Minutes | 81 (6.5%) | 77 (5.9%) |
| 45 to 59 Minutes | 5 (0.4%) | 39 (3.0%) |
| 60 to 89 Minutes | 42 (3.4%) | 0 (0.0%) |
| 90 or more Minutes | 72 (5.8%) | 93 (7.1%) |
Time of Departure to Work by Sex in Eureka
The most frequent times of departure to work in Eureka are 6:30 AM to 6:59 AM (233, 18.8%) for males and 7:00 AM to 7:29 AM (286, 22.0%) for females.
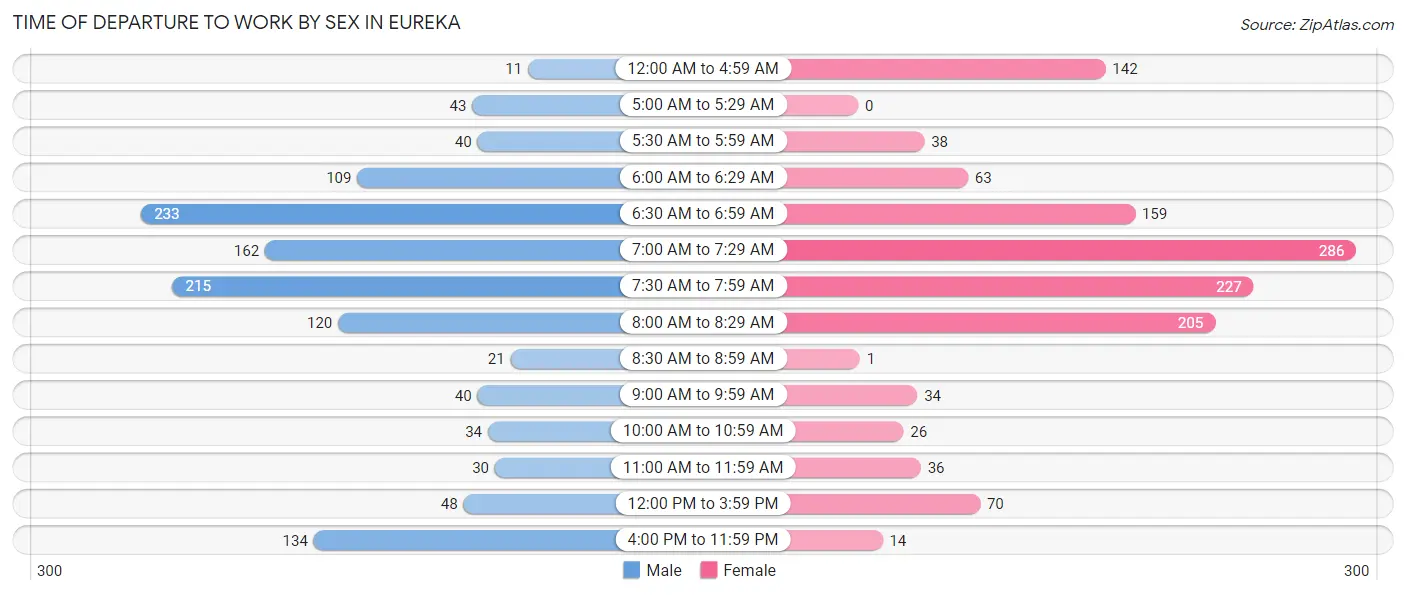
| Time of Departure | Male | Female |
| 12:00 AM to 4:59 AM | 11 (0.9%) | 142 (10.9%) |
| 5:00 AM to 5:29 AM | 43 (3.5%) | 0 (0.0%) |
| 5:30 AM to 5:59 AM | 40 (3.2%) | 38 (2.9%) |
| 6:00 AM to 6:29 AM | 109 (8.8%) | 63 (4.8%) |
| 6:30 AM to 6:59 AM | 233 (18.8%) | 159 (12.2%) |
| 7:00 AM to 7:29 AM | 162 (13.1%) | 286 (22.0%) |
| 7:30 AM to 7:59 AM | 215 (17.3%) | 227 (17.4%) |
| 8:00 AM to 8:29 AM | 120 (9.7%) | 205 (15.8%) |
| 8:30 AM to 8:59 AM | 21 (1.7%) | 1 (0.1%) |
| 9:00 AM to 9:59 AM | 40 (3.2%) | 34 (2.6%) |
| 10:00 AM to 10:59 AM | 34 (2.7%) | 26 (2.0%) |
| 11:00 AM to 11:59 AM | 30 (2.4%) | 36 (2.8%) |
| 12:00 PM to 3:59 PM | 48 (3.9%) | 70 (5.4%) |
| 4:00 PM to 11:59 PM | 134 (10.8%) | 14 (1.1%) |
| Total | 1,240 (100.0%) | 1,301 (100.0%) |
Housing Occupancy in Eureka
Occupancy by Ownership in Eureka
Of the total 2,313 dwellings in Eureka, owner-occupied units account for 1,521 (65.8%), while renter-occupied units make up 792 (34.2%).
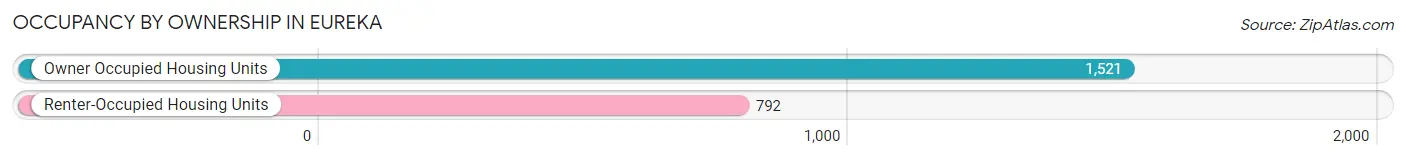
| Occupancy | # Housing Units | % Housing Units |
| Owner Occupied Housing Units | 1,521 | 65.8% |
| Renter-Occupied Housing Units | 792 | 34.2% |
| Total Occupied Housing Units | 2,313 | 100.0% |
Occupancy by Household Size in Eureka
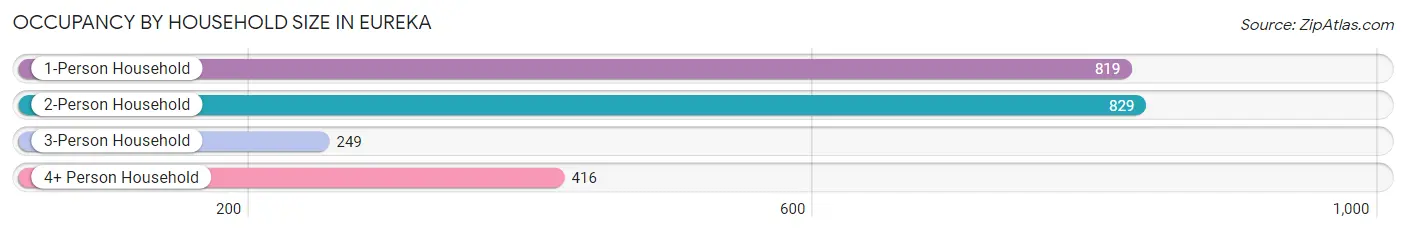
| Household Size | # Housing Units | % Housing Units |
| 1-Person Household | 819 | 35.4% |
| 2-Person Household | 829 | 35.8% |
| 3-Person Household | 249 | 10.8% |
| 4+ Person Household | 416 | 18.0% |
| Total Housing Units | 2,313 | 100.0% |
Occupancy by Ownership by Household Size in Eureka
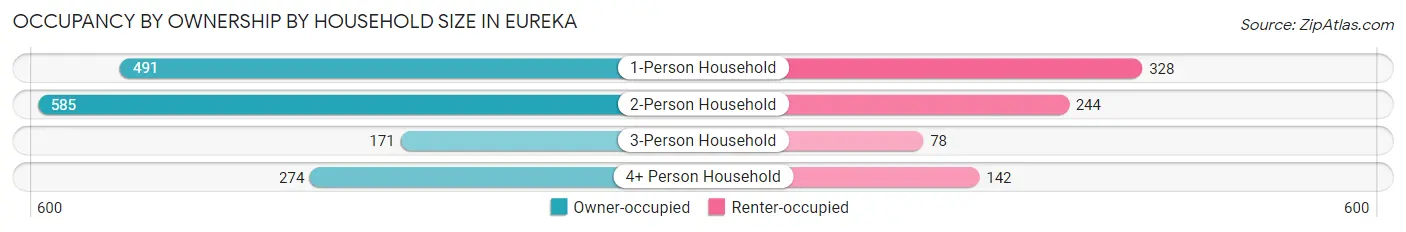
| Household Size | Owner-occupied | Renter-occupied |
| 1-Person Household | 491 (60.0%) | 328 (40.1%) |
| 2-Person Household | 585 (70.6%) | 244 (29.4%) |
| 3-Person Household | 171 (68.7%) | 78 (31.3%) |
| 4+ Person Household | 274 (65.9%) | 142 (34.1%) |
| Total Housing Units | 1,521 (65.8%) | 792 (34.2%) |
Occupancy by Educational Attainment in Eureka
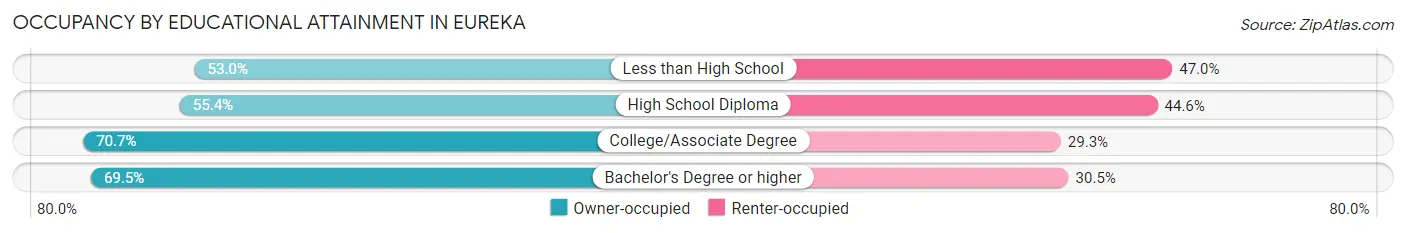
| Household Size | Owner-occupied | Renter-occupied |
| Less than High School | 35 (53.0%) | 31 (47.0%) |
| High School Diploma | 341 (55.4%) | 275 (44.6%) |
| College/Associate Degree | 683 (70.7%) | 283 (29.3%) |
| Bachelor's Degree or higher | 462 (69.5%) | 203 (30.5%) |
Occupancy by Age of Householder in Eureka
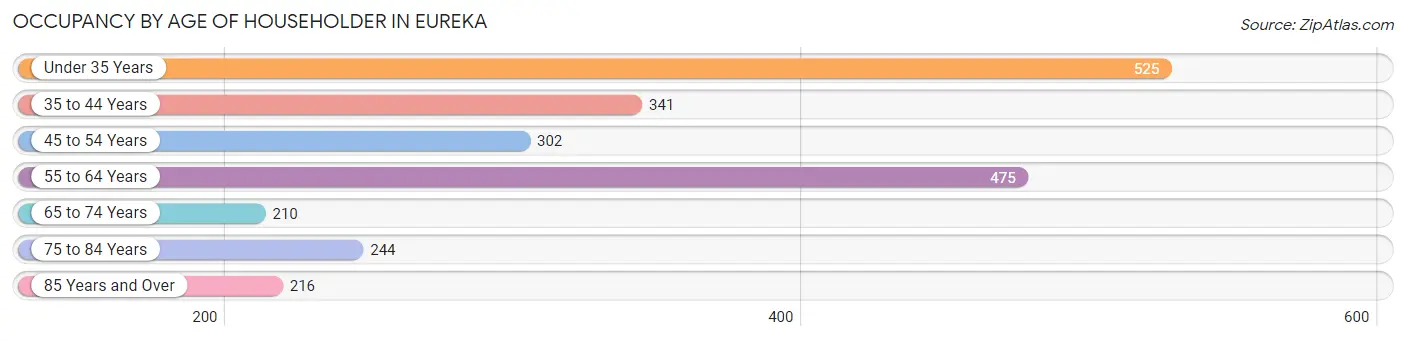
| Age Bracket | # Households | % Households |
| Under 35 Years | 525 | 22.7% |
| 35 to 44 Years | 341 | 14.7% |
| 45 to 54 Years | 302 | 13.1% |
| 55 to 64 Years | 475 | 20.5% |
| 65 to 74 Years | 210 | 9.1% |
| 75 to 84 Years | 244 | 10.5% |
| 85 Years and Over | 216 | 9.3% |
| Total | 2,313 | 100.0% |
Housing Finances in Eureka
Median Income by Occupancy in Eureka
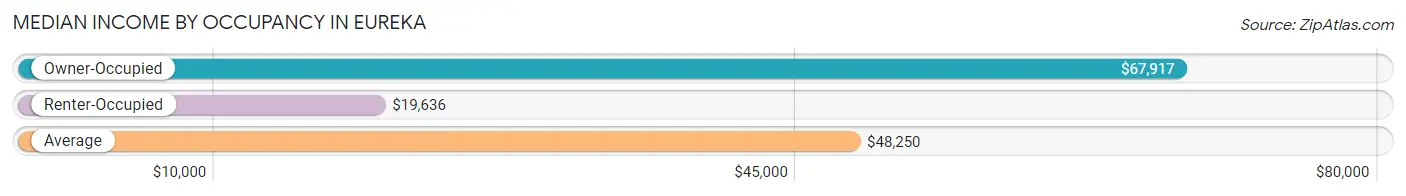
| Occupancy Type | # Households | Median Income |
| Owner-Occupied | 1,521 (65.8%) | $67,917 |
| Renter-Occupied | 792 (34.2%) | $19,636 |
| Average | 2,313 (100.0%) | $48,250 |
Occupancy by Householder Income Bracket in Eureka
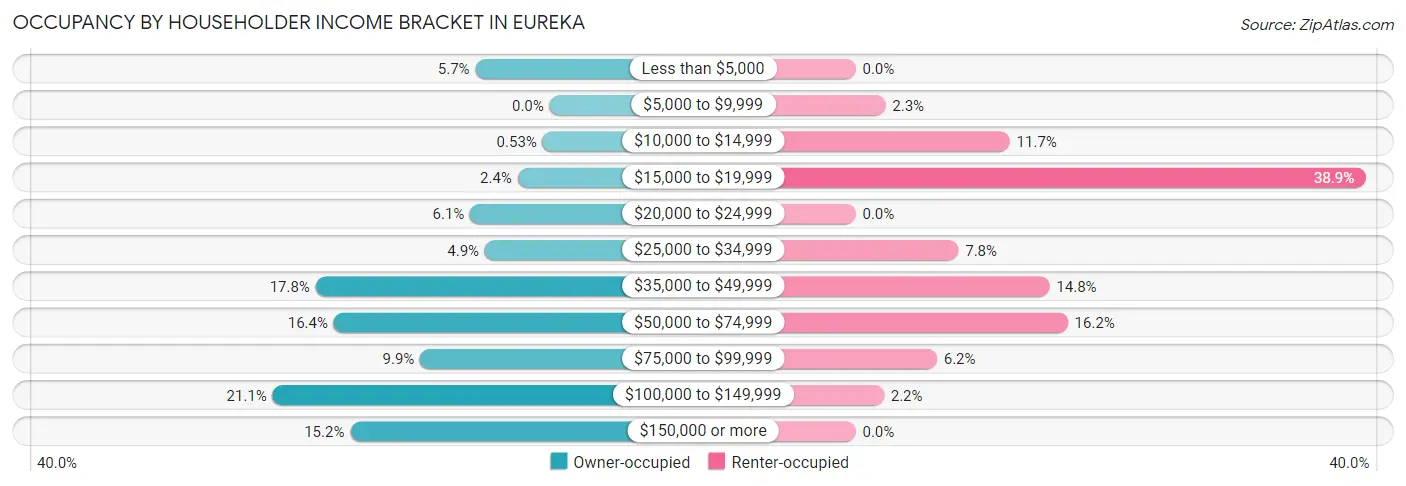
| Income Bracket | Owner-occupied | Renter-occupied |
| Less than $5,000 | 86 (5.7%) | 0 (0.0%) |
| $5,000 to $9,999 | 0 (0.0%) | 18 (2.3%) |
| $10,000 to $14,999 | 8 (0.5%) | 93 (11.7%) |
| $15,000 to $19,999 | 37 (2.4%) | 308 (38.9%) |
| $20,000 to $24,999 | 92 (6.0%) | 0 (0.0%) |
| $25,000 to $34,999 | 75 (4.9%) | 62 (7.8%) |
| $35,000 to $49,999 | 271 (17.8%) | 117 (14.8%) |
| $50,000 to $74,999 | 250 (16.4%) | 128 (16.2%) |
| $75,000 to $99,999 | 150 (9.9%) | 49 (6.2%) |
| $100,000 to $149,999 | 321 (21.1%) | 17 (2.1%) |
| $150,000 or more | 231 (15.2%) | 0 (0.0%) |
| Total | 1,521 (100.0%) | 792 (100.0%) |
Monthly Housing Cost Tiers in Eureka
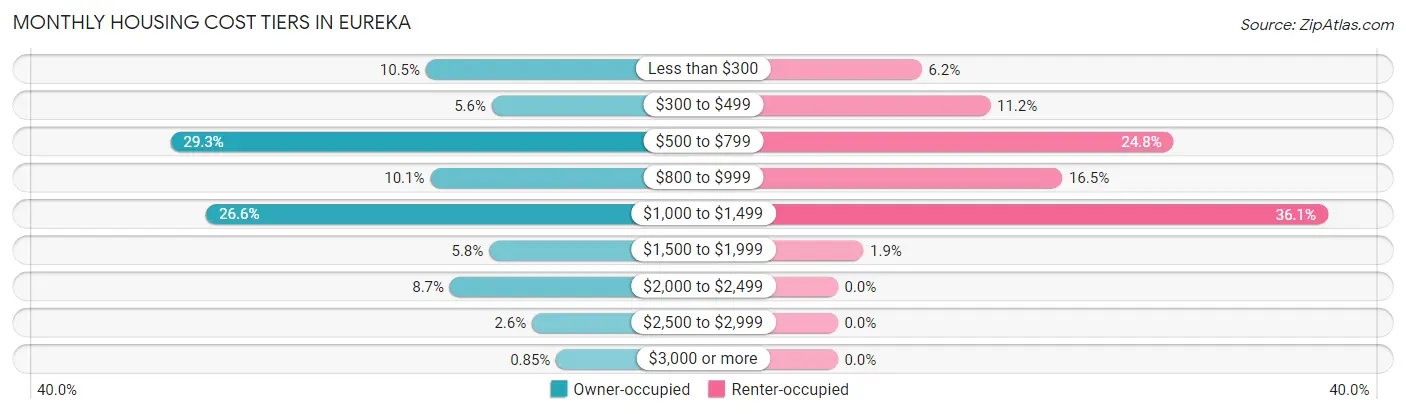
| Monthly Cost | Owner-occupied | Renter-occupied |
| Less than $300 | 159 (10.4%) | 49 (6.2%) |
| $300 to $499 | 85 (5.6%) | 89 (11.2%) |
| $500 to $799 | 445 (29.3%) | 196 (24.7%) |
| $800 to $999 | 154 (10.1%) | 131 (16.5%) |
| $1,000 to $1,499 | 405 (26.6%) | 286 (36.1%) |
| $1,500 to $1,999 | 88 (5.8%) | 15 (1.9%) |
| $2,000 to $2,499 | 132 (8.7%) | 0 (0.0%) |
| $2,500 to $2,999 | 40 (2.6%) | 0 (0.0%) |
| $3,000 or more | 13 (0.9%) | 0 (0.0%) |
| Total | 1,521 (100.0%) | 792 (100.0%) |
Physical Housing Characteristics in Eureka
Housing Structures in Eureka
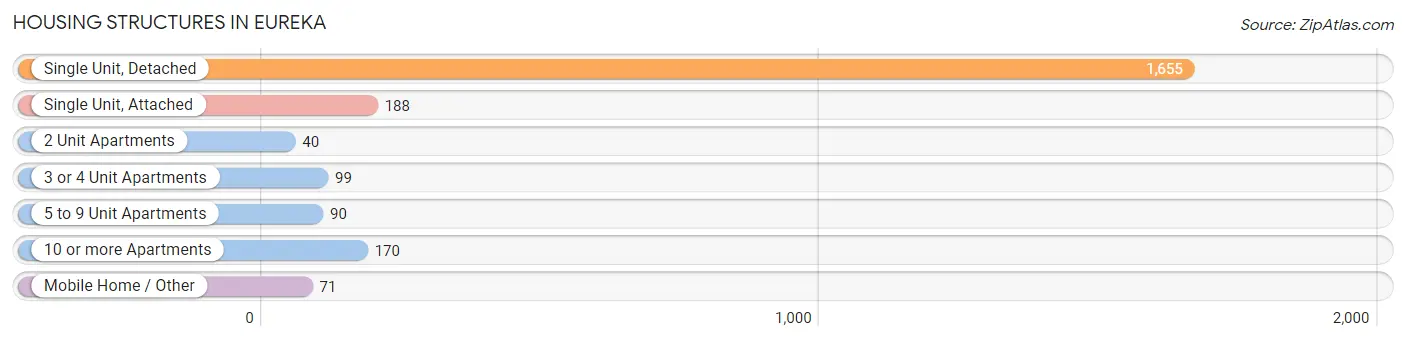
| Structure Type | # Housing Units | % Housing Units |
| Single Unit, Detached | 1,655 | 71.6% |
| Single Unit, Attached | 188 | 8.1% |
| 2 Unit Apartments | 40 | 1.7% |
| 3 or 4 Unit Apartments | 99 | 4.3% |
| 5 to 9 Unit Apartments | 90 | 3.9% |
| 10 or more Apartments | 170 | 7.3% |
| Mobile Home / Other | 71 | 3.1% |
| Total | 2,313 | 100.0% |
Housing Structures by Occupancy in Eureka
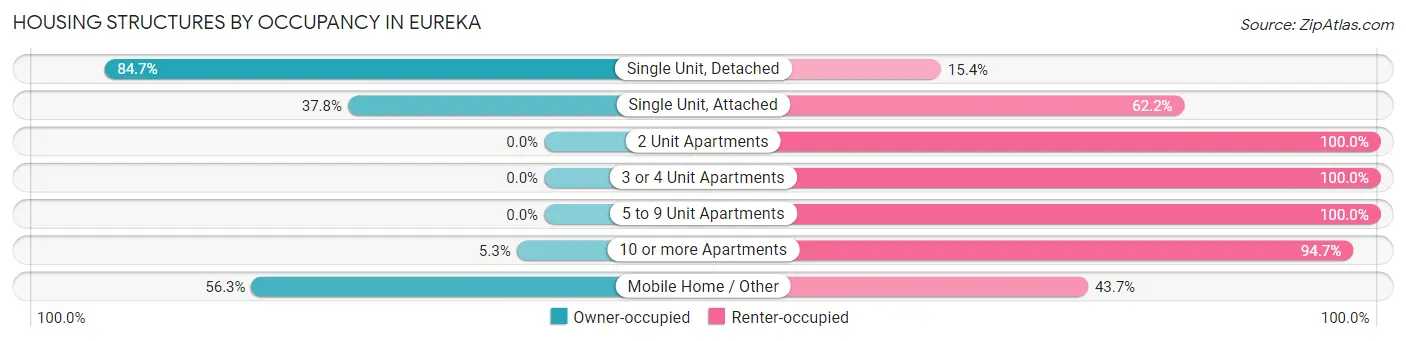
| Structure Type | Owner-occupied | Renter-occupied |
| Single Unit, Detached | 1,401 (84.7%) | 254 (15.3%) |
| Single Unit, Attached | 71 (37.8%) | 117 (62.2%) |
| 2 Unit Apartments | 0 (0.0%) | 40 (100.0%) |
| 3 or 4 Unit Apartments | 0 (0.0%) | 99 (100.0%) |
| 5 to 9 Unit Apartments | 0 (0.0%) | 90 (100.0%) |
| 10 or more Apartments | 9 (5.3%) | 161 (94.7%) |
| Mobile Home / Other | 40 (56.3%) | 31 (43.7%) |
| Total | 1,521 (65.8%) | 792 (34.2%) |
Housing Structures by Number of Rooms in Eureka
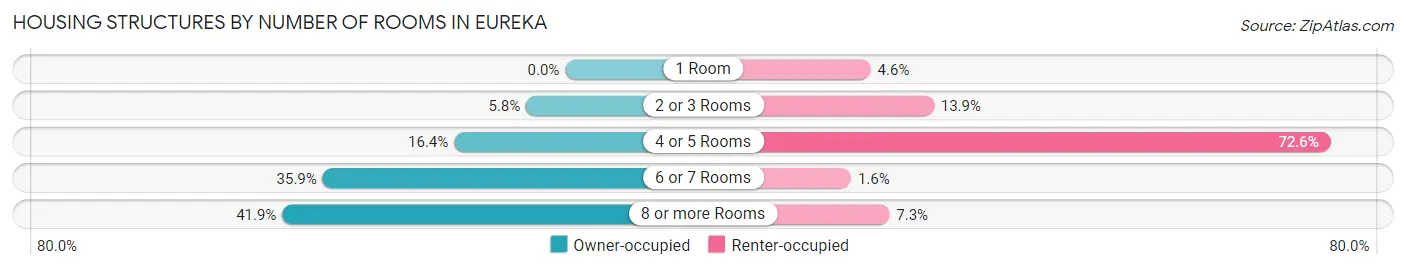
| Number of Rooms | Owner-occupied | Renter-occupied |
| 1 Room | 0 (0.0%) | 36 (4.5%) |
| 2 or 3 Rooms | 88 (5.8%) | 110 (13.9%) |
| 4 or 5 Rooms | 250 (16.4%) | 575 (72.6%) |
| 6 or 7 Rooms | 546 (35.9%) | 13 (1.6%) |
| 8 or more Rooms | 637 (41.9%) | 58 (7.3%) |
| Total | 1,521 (100.0%) | 792 (100.0%) |
Housing Structure by Heating Type in Eureka
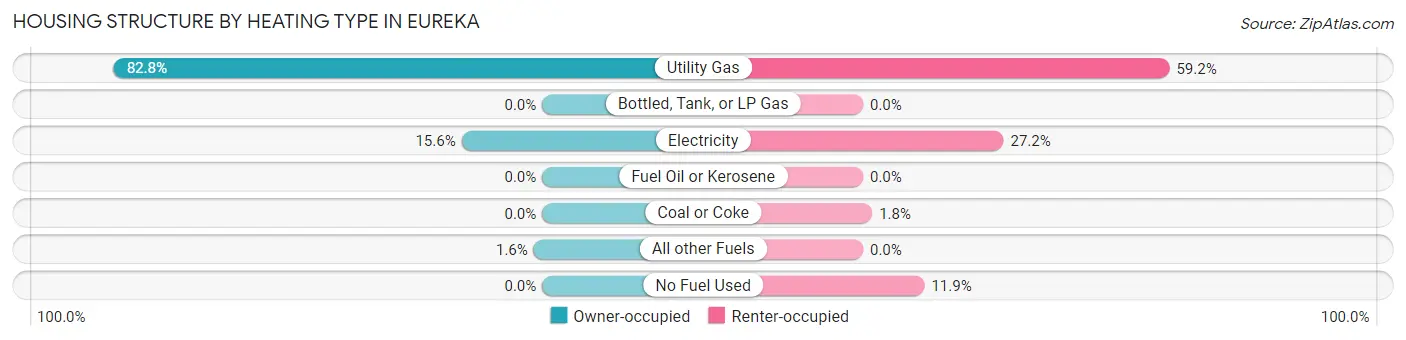
| Heating Type | Owner-occupied | Renter-occupied |
| Utility Gas | 1,259 (82.8%) | 469 (59.2%) |
| Bottled, Tank, or LP Gas | 0 (0.0%) | 0 (0.0%) |
| Electricity | 237 (15.6%) | 215 (27.2%) |
| Fuel Oil or Kerosene | 0 (0.0%) | 0 (0.0%) |
| Coal or Coke | 0 (0.0%) | 14 (1.8%) |
| All other Fuels | 25 (1.6%) | 0 (0.0%) |
| No Fuel Used | 0 (0.0%) | 94 (11.9%) |
| Total | 1,521 (100.0%) | 792 (100.0%) |
Household Vehicle Usage in Eureka
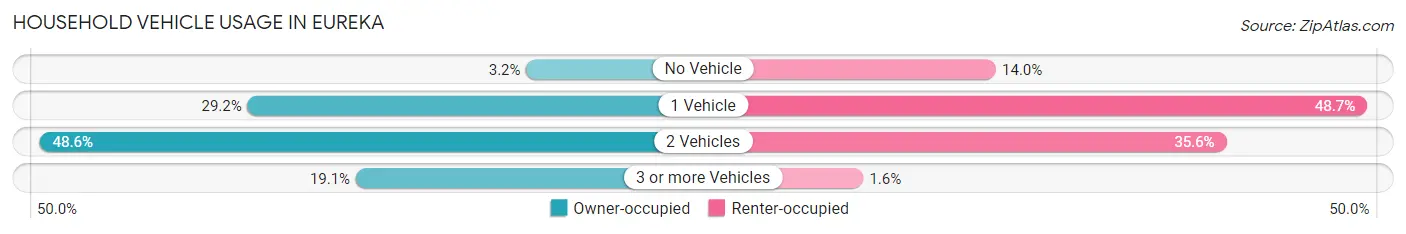
| Vehicles per Household | Owner-occupied | Renter-occupied |
| No Vehicle | 48 (3.2%) | 111 (14.0%) |
| 1 Vehicle | 444 (29.2%) | 386 (48.7%) |
| 2 Vehicles | 739 (48.6%) | 282 (35.6%) |
| 3 or more Vehicles | 290 (19.1%) | 13 (1.6%) |
| Total | 1,521 (100.0%) | 792 (100.0%) |
Real Estate & Mortgages in Eureka
Real Estate and Mortgage Overview in Eureka
| Characteristic | Without Mortgage | With Mortgage |
| Housing Units | 769 | 752 |
| Median Property Value | $119,000 | $171,100 |
| Median Household Income | $53,736 | $171 |
| Monthly Housing Costs | $578 | $13 |
| Real Estate Taxes | $3,264 | $72 |
Property Value by Mortgage Status in Eureka
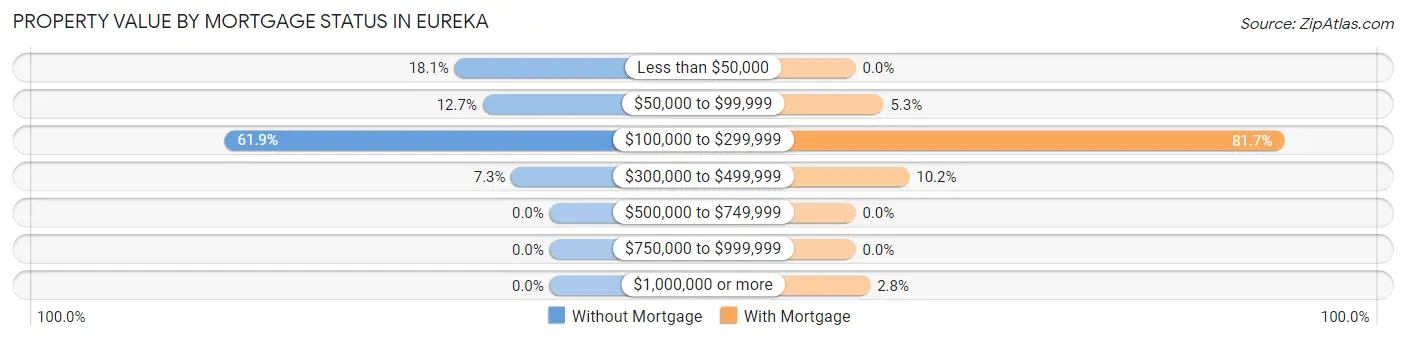
| Property Value | Without Mortgage | With Mortgage |
| Less than $50,000 | 139 (18.1%) | 0 (0.0%) |
| $50,000 to $99,999 | 98 (12.7%) | 40 (5.3%) |
| $100,000 to $299,999 | 476 (61.9%) | 614 (81.7%) |
| $300,000 to $499,999 | 56 (7.3%) | 77 (10.2%) |
| $500,000 to $749,999 | 0 (0.0%) | 0 (0.0%) |
| $750,000 to $999,999 | 0 (0.0%) | 0 (0.0%) |
| $1,000,000 or more | 0 (0.0%) | 21 (2.8%) |
| Total | 769 (100.0%) | 752 (100.0%) |
Household Income by Mortgage Status in Eureka
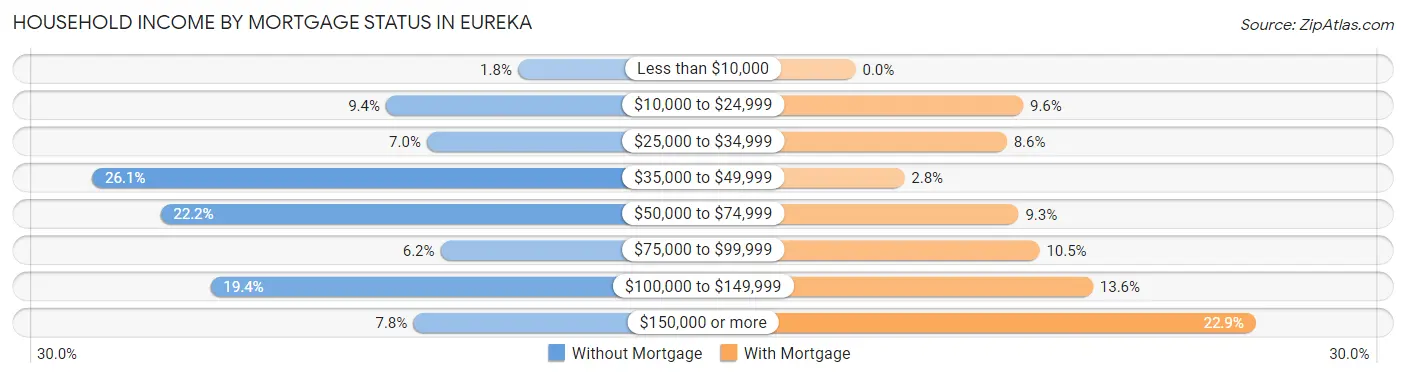
| Household Income | Without Mortgage | With Mortgage |
| Less than $10,000 | 14 (1.8%) | 0 (0.0%) |
| $10,000 to $24,999 | 72 (9.4%) | 72 (9.6%) |
| $25,000 to $34,999 | 54 (7.0%) | 65 (8.6%) |
| $35,000 to $49,999 | 201 (26.1%) | 21 (2.8%) |
| $50,000 to $74,999 | 171 (22.2%) | 70 (9.3%) |
| $75,000 to $99,999 | 48 (6.2%) | 79 (10.5%) |
| $100,000 to $149,999 | 149 (19.4%) | 102 (13.6%) |
| $150,000 or more | 60 (7.8%) | 172 (22.9%) |
| Total | 769 (100.0%) | 752 (100.0%) |
Property Value to Household Income Ratio in Eureka
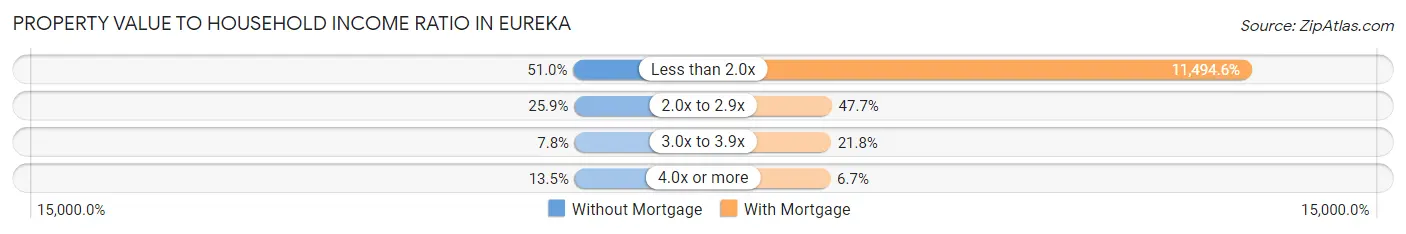
| Value-to-Income Ratio | Without Mortgage | With Mortgage |
| Less than 2.0x | 392 (51.0%) | 86,439 (11,494.5%) |
| 2.0x to 2.9x | 199 (25.9%) | 359 (47.7%) |
| 3.0x to 3.9x | 60 (7.8%) | 164 (21.8%) |
| 4.0x or more | 104 (13.5%) | 50 (6.7%) |
| Total | 769 (100.0%) | 752 (100.0%) |
Real Estate Taxes by Mortgage Status in Eureka
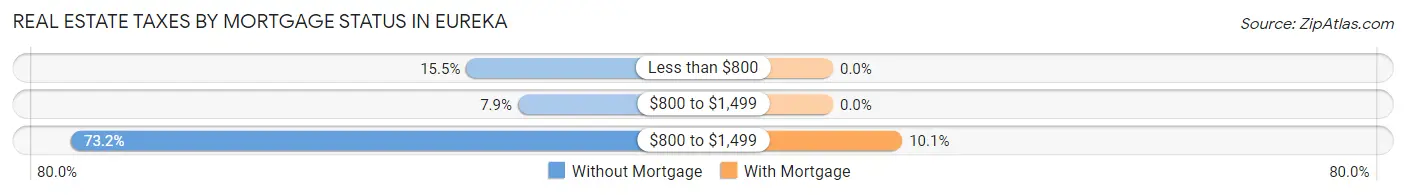
| Property Taxes | Without Mortgage | With Mortgage |
| Less than $800 | 119 (15.5%) | 0 (0.0%) |
| $800 to $1,499 | 61 (7.9%) | 0 (0.0%) |
| $800 to $1,499 | 563 (73.2%) | 76 (10.1%) |
| Total | 769 (100.0%) | 752 (100.0%) |
Health & Disability in Eureka
Health Insurance Coverage by Age in Eureka
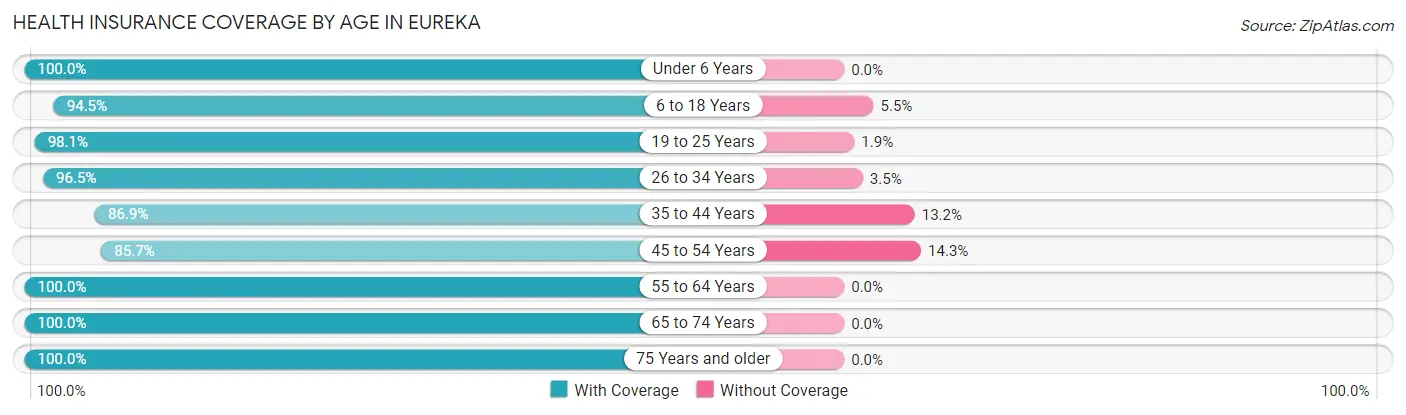
| Age Bracket | With Coverage | Without Coverage |
| Under 6 Years | 395 (100.0%) | 0 (0.0%) |
| 6 to 18 Years | 606 (94.5%) | 35 (5.5%) |
| 19 to 25 Years | 932 (98.1%) | 18 (1.9%) |
| 26 to 34 Years | 445 (96.5%) | 16 (3.5%) |
| 35 to 44 Years | 482 (86.9%) | 73 (13.2%) |
| 45 to 54 Years | 508 (85.7%) | 85 (14.3%) |
| 55 to 64 Years | 720 (100.0%) | 0 (0.0%) |
| 65 to 74 Years | 380 (100.0%) | 0 (0.0%) |
| 75 Years and older | 571 (100.0%) | 0 (0.0%) |
| Total | 5,039 (95.7%) | 227 (4.3%) |
Health Insurance Coverage by Citizenship Status in Eureka
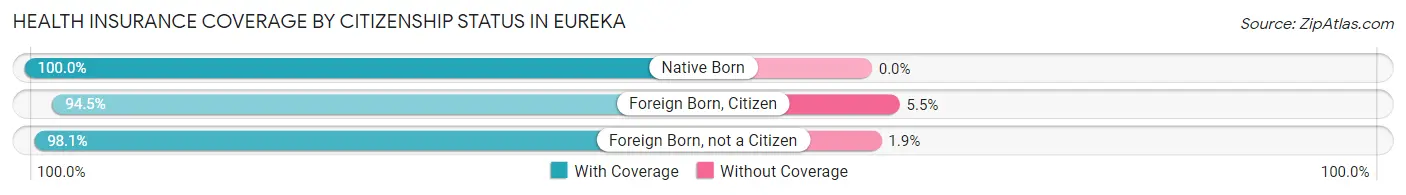
| Citizenship Status | With Coverage | Without Coverage |
| Native Born | 395 (100.0%) | 0 (0.0%) |
| Foreign Born, Citizen | 606 (94.5%) | 35 (5.5%) |
| Foreign Born, not a Citizen | 932 (98.1%) | 18 (1.9%) |
Health Insurance Coverage by Household Income in Eureka
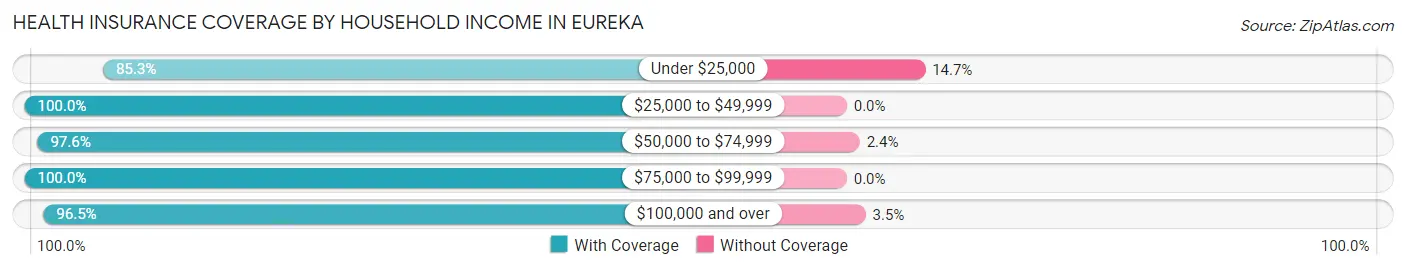
| Household Income | With Coverage | Without Coverage |
| Under $25,000 | 720 (85.3%) | 124 (14.7%) |
| $25,000 to $49,999 | 978 (100.0%) | 0 (0.0%) |
| $50,000 to $74,999 | 845 (97.6%) | 21 (2.4%) |
| $75,000 to $99,999 | 500 (100.0%) | 0 (0.0%) |
| $100,000 and over | 1,638 (96.5%) | 60 (3.5%) |
Public vs Private Health Insurance Coverage by Age in Eureka
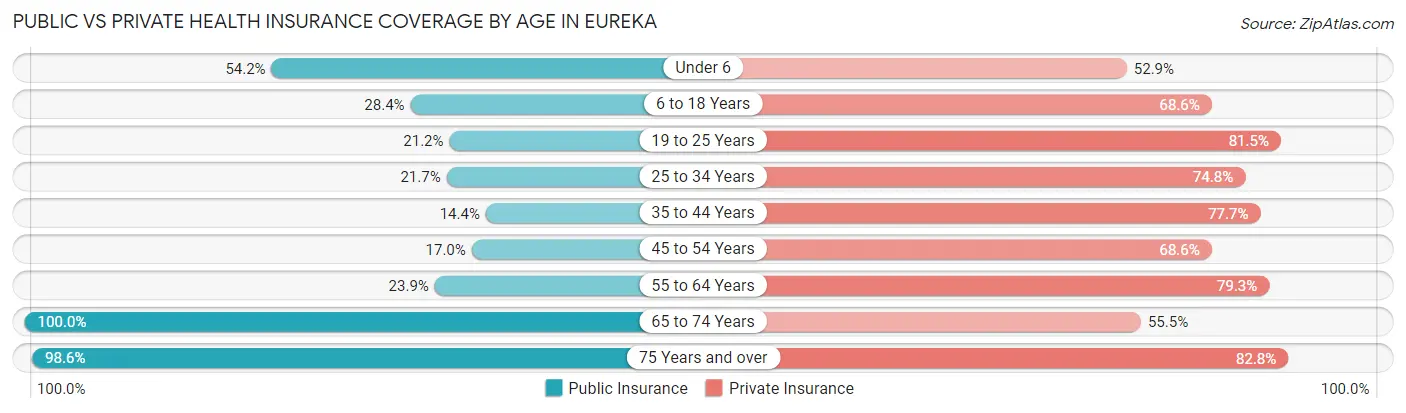
| Age Bracket | Public Insurance | Private Insurance |
| Under 6 | 214 (54.2%) | 209 (52.9%) |
| 6 to 18 Years | 182 (28.4%) | 440 (68.6%) |
| 19 to 25 Years | 201 (21.2%) | 774 (81.5%) |
| 25 to 34 Years | 100 (21.7%) | 345 (74.8%) |
| 35 to 44 Years | 80 (14.4%) | 431 (77.7%) |
| 45 to 54 Years | 101 (17.0%) | 407 (68.6%) |
| 55 to 64 Years | 172 (23.9%) | 571 (79.3%) |
| 65 to 74 Years | 380 (100.0%) | 211 (55.5%) |
| 75 Years and over | 563 (98.6%) | 473 (82.8%) |
| Total | 1,993 (37.9%) | 3,861 (73.3%) |
Disability Status by Sex by Age in Eureka
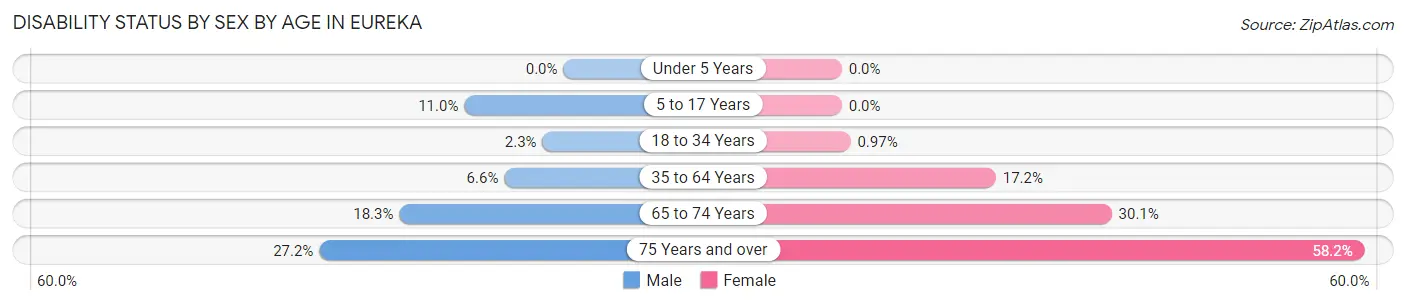
| Age Bracket | Male | Female |
| Under 5 Years | 0 (0.0%) | 0 (0.0%) |
| 5 to 17 Years | 35 (11.0%) | 0 (0.0%) |
| 18 to 34 Years | 18 (2.3%) | 7 (1.0%) |
| 35 to 64 Years | 55 (6.6%) | 177 (17.2%) |
| 65 to 74 Years | 36 (18.3%) | 55 (30.0%) |
| 75 Years and over | 31 (27.2%) | 266 (58.2%) |
Disability Class by Sex by Age in Eureka
Disability Class: Hearing Difficulty
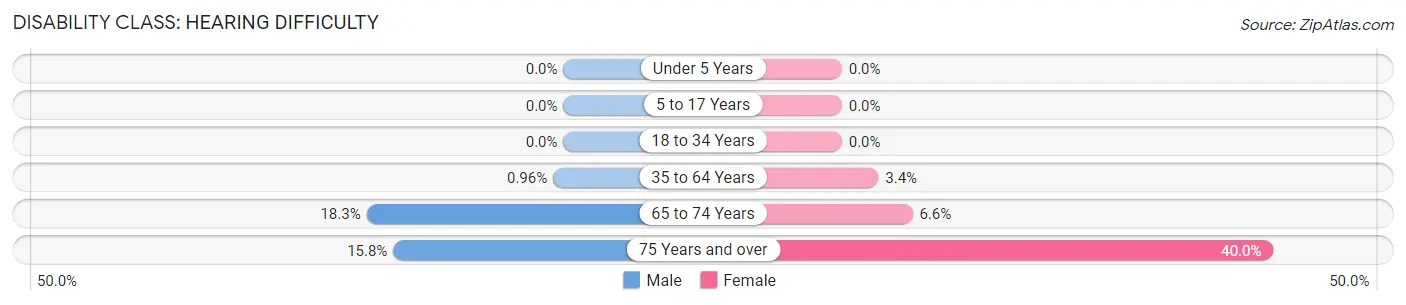
| Age Bracket | Male | Female |
| Under 5 Years | 0 (0.0%) | 0 (0.0%) |
| 5 to 17 Years | 0 (0.0%) | 0 (0.0%) |
| 18 to 34 Years | 0 (0.0%) | 0 (0.0%) |
| 35 to 64 Years | 8 (1.0%) | 35 (3.4%) |
| 65 to 74 Years | 36 (18.3%) | 12 (6.6%) |
| 75 Years and over | 18 (15.8%) | 183 (40.0%) |
Disability Class: Vision Difficulty
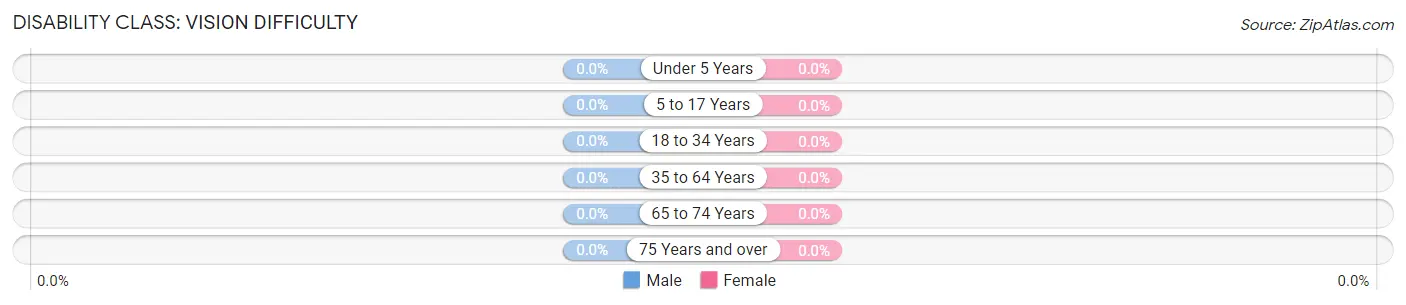
| Age Bracket | Male | Female |
| Under 5 Years | 0 (0.0%) | 0 (0.0%) |
| 5 to 17 Years | 0 (0.0%) | 0 (0.0%) |
| 18 to 34 Years | 0 (0.0%) | 0 (0.0%) |
| 35 to 64 Years | 0 (0.0%) | 0 (0.0%) |
| 65 to 74 Years | 0 (0.0%) | 0 (0.0%) |
| 75 Years and over | 0 (0.0%) | 0 (0.0%) |
Disability Class: Cognitive Difficulty
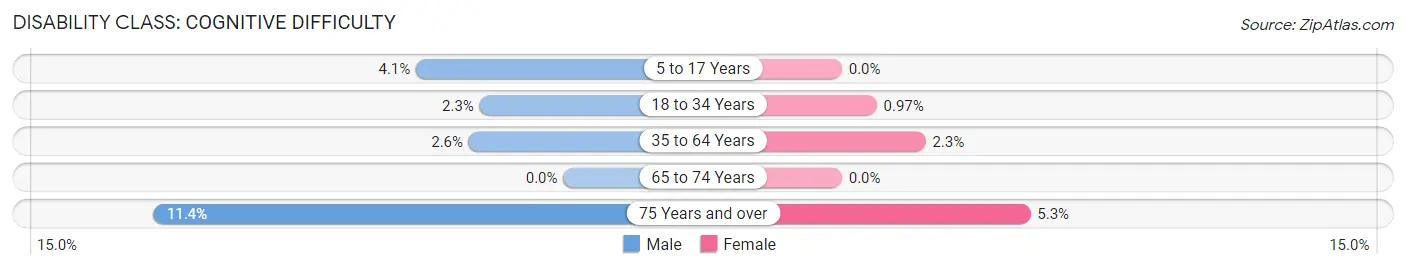
| Age Bracket | Male | Female |
| 5 to 17 Years | 13 (4.1%) | 0 (0.0%) |
| 18 to 34 Years | 18 (2.3%) | 7 (1.0%) |
| 35 to 64 Years | 22 (2.6%) | 24 (2.3%) |
| 65 to 74 Years | 0 (0.0%) | 0 (0.0%) |
| 75 Years and over | 13 (11.4%) | 24 (5.2%) |
Disability Class: Ambulatory Difficulty
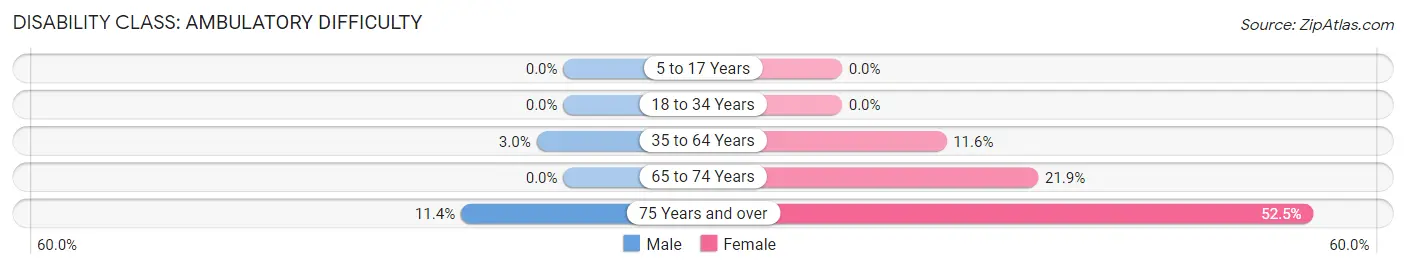
| Age Bracket | Male | Female |
| 5 to 17 Years | 0 (0.0%) | 0 (0.0%) |
| 18 to 34 Years | 0 (0.0%) | 0 (0.0%) |
| 35 to 64 Years | 25 (3.0%) | 120 (11.6%) |
| 65 to 74 Years | 0 (0.0%) | 40 (21.9%) |
| 75 Years and over | 13 (11.4%) | 240 (52.5%) |
Disability Class: Self-Care Difficulty
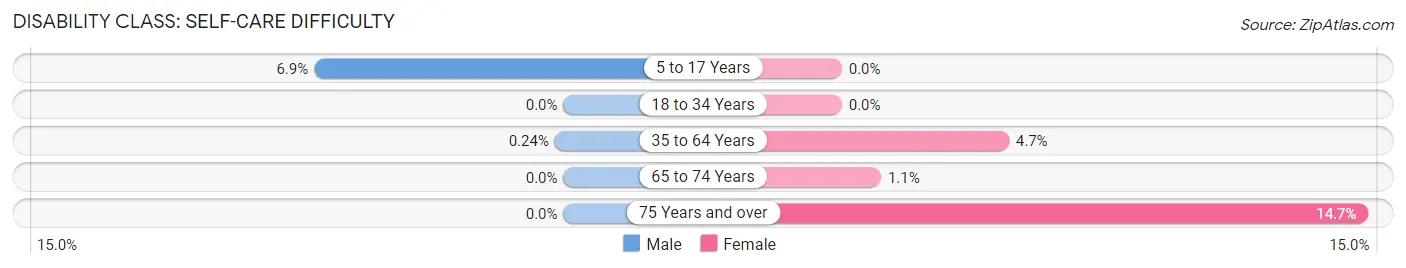
| Age Bracket | Male | Female |
| 5 to 17 Years | 22 (6.9%) | 0 (0.0%) |
| 18 to 34 Years | 0 (0.0%) | 0 (0.0%) |
| 35 to 64 Years | 2 (0.2%) | 48 (4.6%) |
| 65 to 74 Years | 0 (0.0%) | 2 (1.1%) |
| 75 Years and over | 0 (0.0%) | 67 (14.7%) |
Technology Access in Eureka
Computing Device Access in Eureka
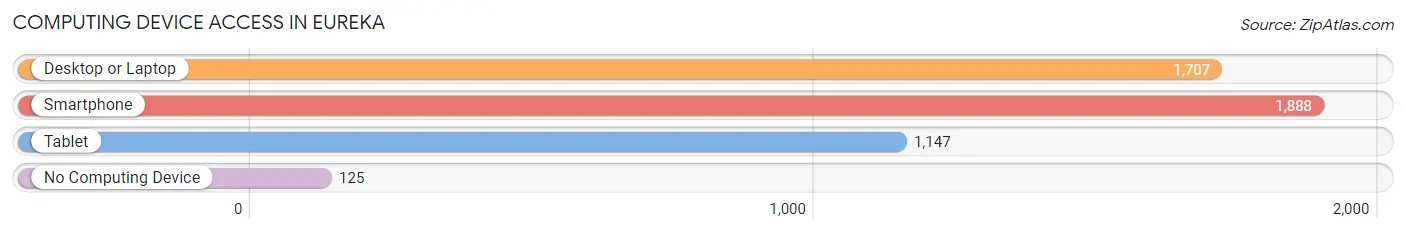
| Device Type | # Households | % Households |
| Desktop or Laptop | 1,707 | 73.8% |
| Smartphone | 1,888 | 81.6% |
| Tablet | 1,147 | 49.6% |
| No Computing Device | 125 | 5.4% |
| Total | 2,313 | 100.0% |
Internet Access in Eureka
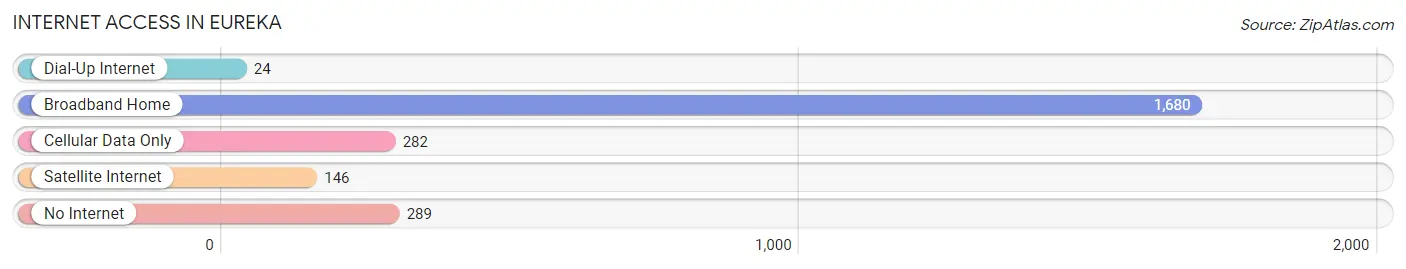
| Internet Type | # Households | % Households |
| Dial-Up Internet | 24 | 1.0% |
| Broadband Home | 1,680 | 72.6% |
| Cellular Data Only | 282 | 12.2% |
| Satellite Internet | 146 | 6.3% |
| No Internet | 289 | 12.5% |
| Total | 2,313 | 100.0% |
Eureka Summary
Eureka, Illinois is a small city located in Woodford County, Illinois. It is situated in the heart of the Midwest, approximately 100 miles southwest of Chicago. The city is home to a population of approximately 5,000 people and is known for its small-town charm and friendly atmosphere.
History
Eureka was founded in 1855 by a group of settlers from New York. The city was named after the Greek word for “discovery”, as the settlers believed they had found a new home. The city was incorporated in 1867 and quickly grew to become a thriving community.
In the late 19th century, Eureka was a major hub for the railroad industry. The city was home to several major railroads, including the Chicago and Alton Railroad, the Chicago, Burlington and Quincy Railroad, and the Illinois Central Railroad. The railroads brought a great deal of economic prosperity to the city, and it quickly became a major center for industry and commerce.
In the early 20th century, Eureka was a major center for the coal mining industry. The city was home to several large coal mines, and the industry provided a great deal of employment for the local population. The coal mining industry eventually declined in the mid-20th century, but the city still retains a strong connection to its mining heritage.
Geography
Eureka is located in the heart of the Midwest, approximately 100 miles southwest of Chicago. The city is situated in the northern part of Woodford County, Illinois, and is bordered by the cities of Metamora, Germantown Hills, and Roanoke. The city is situated on the banks of the Mackinaw River, and is surrounded by rolling hills and farmland.
Economy
Eureka’s economy is largely based on agriculture and manufacturing. The city is home to several large agricultural operations, including a large dairy farm and several grain elevators. The city is also home to several manufacturing companies, including a large paper mill and a plastics factory.
The city is also home to several small businesses, including restaurants, retail stores, and professional services. The city is also home to a large medical center, which provides a variety of healthcare services to the local population.
Demographics
As of the 2010 census, the population of Eureka was 5,295. The city has a population density of 1,092 people per square mile. The median age of the population is 40.7 years, and the median household income is $50,945.
The racial makeup of the city is 97.2% White, 0.7% African American, 0.3% Native American, 0.3% Asian, 0.1% Pacific Islander, 0.4% from other races, and 1.1% from two or more races. The city is also home to a large Hispanic population, with 8.3% of the population identifying as Hispanic or Latino.
Eureka is a small city with a rich history and a strong sense of community. The city is home to a diverse population and a thriving economy, and is a great place to live and work.
Common Questions
What is Per Capita Income in Eureka?
Per Capita income in Eureka is $34,647.
What is the Median Family Income in Eureka?
Median Family Income in Eureka is $69,703.
What is the Median Household income in Eureka?
Median Household Income in Eureka is $48,250.
What is Income or Wage Gap in Eureka?
Income or Wage Gap in Eureka is 7.5%.
Women in Eureka earn 92.5 cents for every dollar earned by a man.
What is Inequality or Gini Index in Eureka?
Inequality or Gini Index in Eureka is 0.45.
What is the Total Population of Eureka?
Total Population of Eureka is 5,504.
What is the Total Male Population of Eureka?
Total Male Population of Eureka is 2,526.
What is the Total Female Population of Eureka?
Total Female Population of Eureka is 2,978.
What is the Ratio of Males per 100 Females in Eureka?
There are 84.82 Males per 100 Females in Eureka.
What is the Ratio of Females per 100 Males in Eureka?
There are 117.89 Females per 100 Males in Eureka.
What is the Median Population Age in Eureka?
Median Population Age in Eureka is 39.6 Years.
What is the Average Family Size in Eureka
Average Family Size in Eureka is 2.7 People.
What is the Average Household Size in Eureka
Average Household Size in Eureka is 2.1 People.
How Large is the Labor Force in Eureka?
There are 2,946 People in the Labor Forcein in Eureka.
What is the Percentage of People in the Labor Force in Eureka?
64.3% of People are in the Labor Force in Eureka.
What is the Unemployment Rate in Eureka?
Unemployment Rate in Eureka is 7.6%.