Energy, IL Map & Demographics
Energy Map
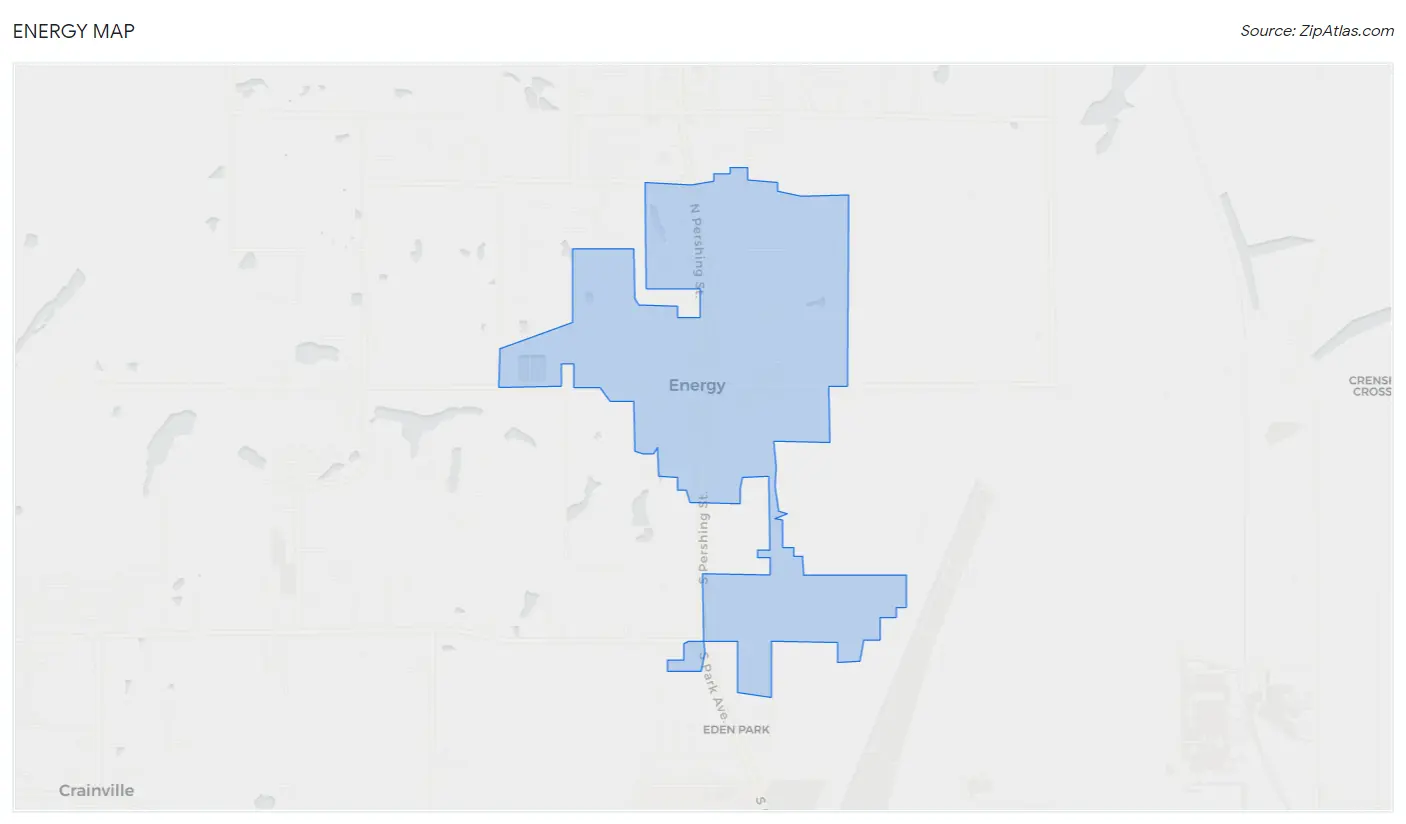
Energy Overview
$32,340
PER CAPITA INCOME
$83,750
AVG FAMILY INCOME
$67,713
AVG HOUSEHOLD INCOME
27.3%
WAGE / INCOME GAP [ % ]
72.7¢/ $1
WAGE / INCOME GAP [ $ ]
0.36
INEQUALITY / GINI INDEX
1,227
TOTAL POPULATION
497
MALE POPULATION
730
FEMALE POPULATION
68.08
MALES / 100 FEMALES
146.88
FEMALES / 100 MALES
43.7
MEDIAN AGE
3.0
AVG FAMILY SIZE
2.2
AVG HOUSEHOLD SIZE
556
LABOR FORCE [ PEOPLE ]
59.0%
PERCENT IN LABOR FORCE
5.6%
UNEMPLOYMENT RATE
Energy Zip Codes
Energy Area Codes
Income in Energy
Income Overview in Energy
Per Capita Income in Energy is $32,340, while median incomes of families and households are $83,750 and $67,713 respectively.
| Characteristic | Number | Measure |
| Per Capita Income | 1,227 | $32,340 |
| Median Family Income | 311 | $83,750 |
| Mean Family Income | 311 | $90,766 |
| Median Household Income | 533 | $67,713 |
| Mean Household Income | 533 | $76,961 |
| Income Deficit | 311 | $0 |
| Wage / Income Gap (%) | 1,227 | 27.30% |
| Wage / Income Gap ($) | 1,227 | 72.70¢ per $1 |
| Gini / Inequality Index | 1,227 | 0.36 |
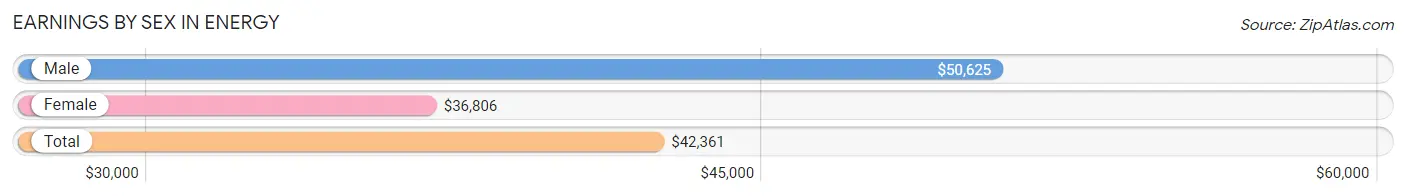
Earnings by Sex in Energy
Average Earnings in Energy are $42,361, $50,625 for men and $36,806 for women, a difference of 27.3%.
| Sex | Number | Average Earnings |
| Male | 255 (44.1%) | $50,625 |
| Female | 323 (55.9%) | $36,806 |
| Total | 578 (100.0%) | $42,361 |
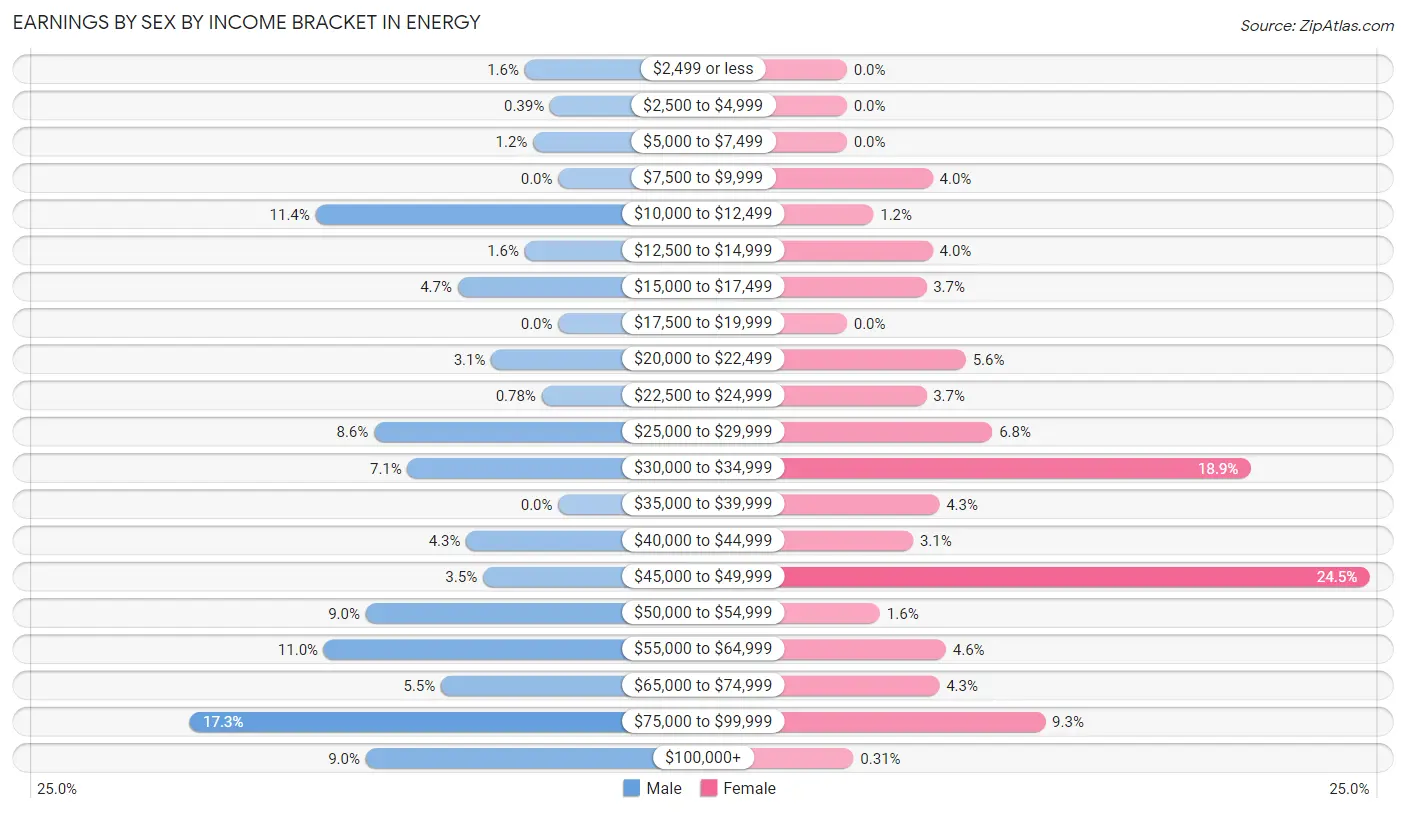
Earnings by Sex by Income Bracket in Energy
The most common earnings brackets in Energy are $75,000 to $99,999 for men (44 | 17.2%) and $45,000 to $49,999 for women (79 | 24.5%).
| Income | Male | Female |
| $2,499 or less | 4 (1.6%) | 0 (0.0%) |
| $2,500 to $4,999 | 1 (0.4%) | 0 (0.0%) |
| $5,000 to $7,499 | 3 (1.2%) | 0 (0.0%) |
| $7,500 to $9,999 | 0 (0.0%) | 13 (4.0%) |
| $10,000 to $12,499 | 29 (11.4%) | 4 (1.2%) |
| $12,500 to $14,999 | 4 (1.6%) | 13 (4.0%) |
| $15,000 to $17,499 | 12 (4.7%) | 12 (3.7%) |
| $17,500 to $19,999 | 0 (0.0%) | 0 (0.0%) |
| $20,000 to $22,499 | 8 (3.1%) | 18 (5.6%) |
| $22,500 to $24,999 | 2 (0.8%) | 12 (3.7%) |
| $25,000 to $29,999 | 22 (8.6%) | 22 (6.8%) |
| $30,000 to $34,999 | 18 (7.1%) | 61 (18.9%) |
| $35,000 to $39,999 | 0 (0.0%) | 14 (4.3%) |
| $40,000 to $44,999 | 11 (4.3%) | 10 (3.1%) |
| $45,000 to $49,999 | 9 (3.5%) | 79 (24.5%) |
| $50,000 to $54,999 | 23 (9.0%) | 5 (1.5%) |
| $55,000 to $64,999 | 28 (11.0%) | 15 (4.6%) |
| $65,000 to $74,999 | 14 (5.5%) | 14 (4.3%) |
| $75,000 to $99,999 | 44 (17.2%) | 30 (9.3%) |
| $100,000+ | 23 (9.0%) | 1 (0.3%) |
| Total | 255 (100.0%) | 323 (100.0%) |
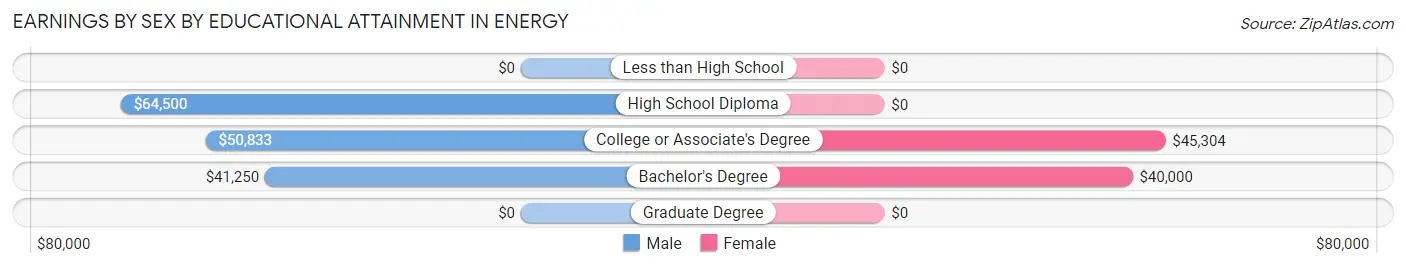
Earnings by Sex by Educational Attainment in Energy
Average earnings in Energy are $52,750 for men and $45,517 for women, a difference of 13.7%. Men with an educational attainment of high school diploma enjoy the highest average annual earnings of $64,500, while those with bachelor's degree education earn the least with $41,250. Women with an educational attainment of college or associate's degree earn the most with the average annual earnings of $45,304, while those with bachelor's degree education have the smallest earnings of $40,000.
| Educational Attainment | Male Income | Female Income |
| Less than High School | - | - |
| High School Diploma | $64,500 | $0 |
| College or Associate's Degree | $50,833 | $45,304 |
| Bachelor's Degree | $41,250 | $40,000 |
| Graduate Degree | - | - |
| Total | $52,750 | $45,517 |
Family Income in Energy
Family Income Brackets in Energy
According to the Energy family income data, there are 83 families falling into the $100,000 to $149,999 income range, which is the most common income bracket and makes up 26.7% of all families. Conversely, the $200,000+ income bracket is the least frequent group with only 3 families (1.0%) belonging to this category.
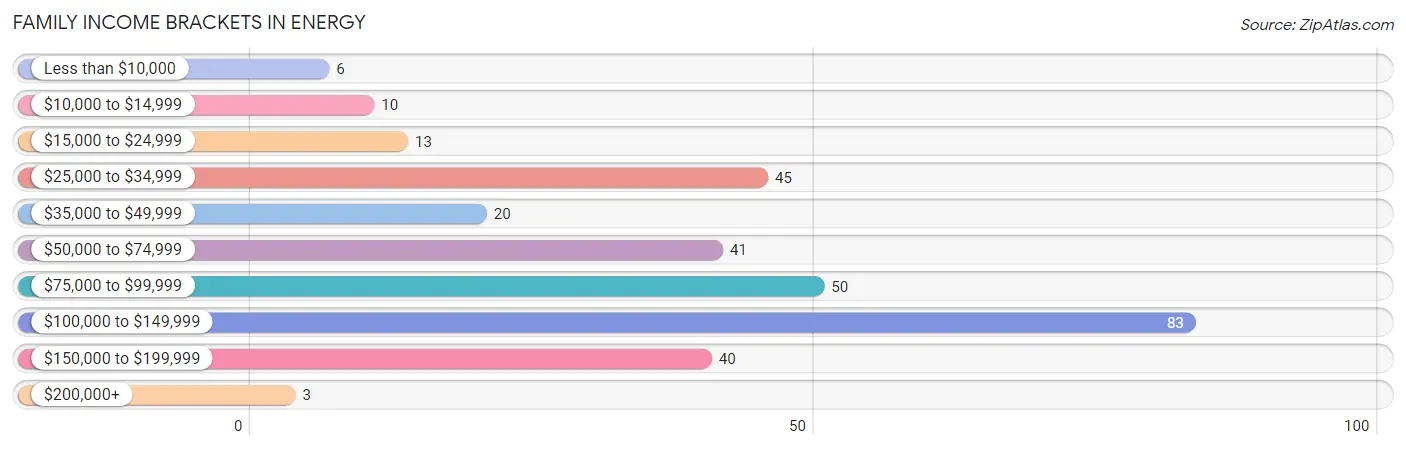
| Income Bracket | # Families | % Families |
| Less than $10,000 | 6 | 1.9% |
| $10,000 to $14,999 | 10 | 3.2% |
| $15,000 to $24,999 | 13 | 4.2% |
| $25,000 to $34,999 | 45 | 14.5% |
| $35,000 to $49,999 | 20 | 6.4% |
| $50,000 to $74,999 | 41 | 13.2% |
| $75,000 to $99,999 | 50 | 16.1% |
| $100,000 to $149,999 | 83 | 26.7% |
| $150,000 to $199,999 | 40 | 12.9% |
| $200,000+ | 3 | 1.0% |
Family Income by Famaliy Size in Energy
4-person families (66 | 21.2%) account for the highest median family income in Energy with $135,833 per family, while 2-person families (174 | 55.9%) have the highest median income of $39,375 per family member.
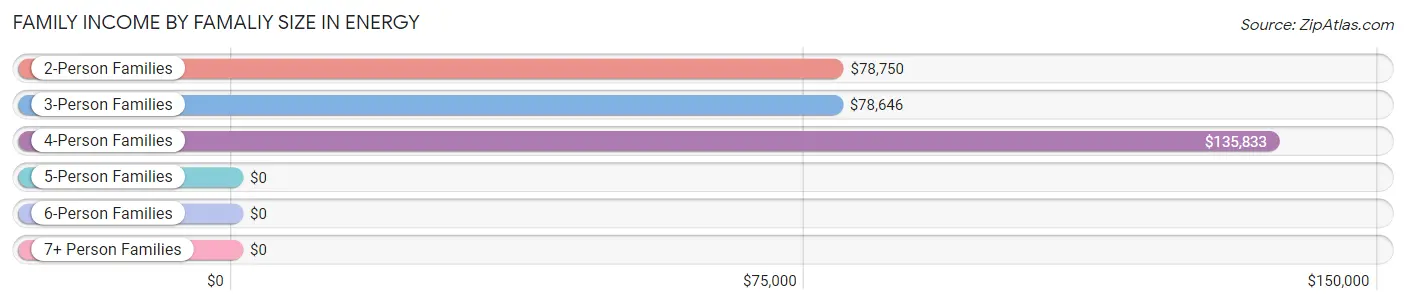
| Income Bracket | # Families | Median Income |
| 2-Person Families | 174 (55.9%) | $78,750 |
| 3-Person Families | 51 (16.4%) | $78,646 |
| 4-Person Families | 66 (21.2%) | $135,833 |
| 5-Person Families | 19 (6.1%) | $0 |
| 6-Person Families | 0 (0.0%) | $0 |
| 7+ Person Families | 1 (0.3%) | $0 |
| Total | 311 (100.0%) | $83,750 |
Family Income by Number of Earners in Energy
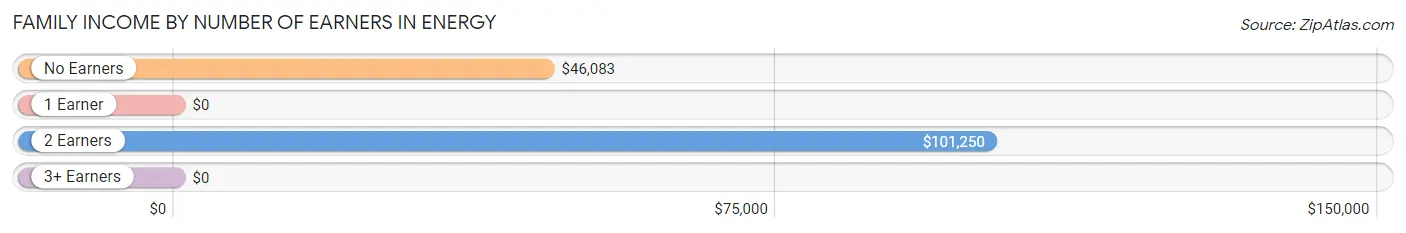
| Number of Earners | # Families | Median Income |
| No Earners | 63 (20.3%) | $46,083 |
| 1 Earner | 66 (21.2%) | $0 |
| 2 Earners | 178 (57.2%) | $101,250 |
| 3+ Earners | 4 (1.3%) | $0 |
| Total | 311 (100.0%) | $83,750 |
Household Income in Energy
Household Income Brackets in Energy
With 108 households falling in the category, the $100,000 to $149,999 income range is the most frequent in Energy, accounting for 20.3% of all households. In contrast, only 3 households (0.6%) fall into the $200,000+ income bracket, making it the least populous group.
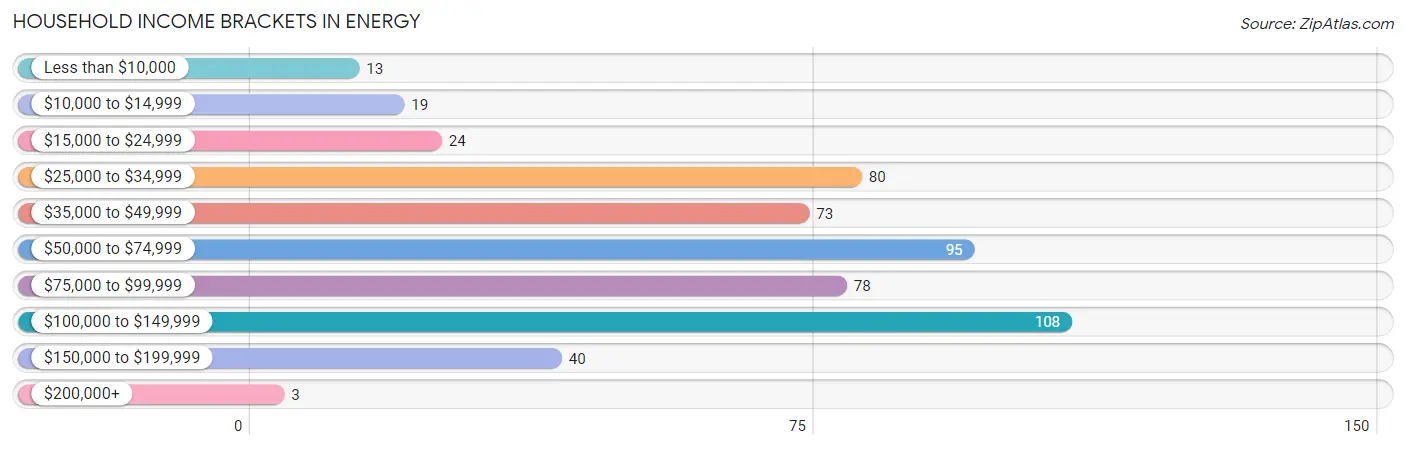
| Income Bracket | # Households | % Households |
| Less than $10,000 | 13 | 2.4% |
| $10,000 to $14,999 | 19 | 3.6% |
| $15,000 to $24,999 | 24 | 4.5% |
| $25,000 to $34,999 | 80 | 15.0% |
| $35,000 to $49,999 | 73 | 13.7% |
| $50,000 to $74,999 | 95 | 17.8% |
| $75,000 to $99,999 | 78 | 14.6% |
| $100,000 to $149,999 | 108 | 20.3% |
| $150,000 to $199,999 | 40 | 7.5% |
| $200,000+ | 3 | 0.6% |
Household Income by Householder Age in Energy
The median household income in Energy is $67,713, with the highest median household income of $95,500 found in the 45 to 64 years age bracket for the primary householder. A total of 164 households (30.8%) fall into this category. Meanwhile, the 65+ years age bracket for the primary householder has the lowest median household income of $41,420, with 193 households (36.2%) in this group.
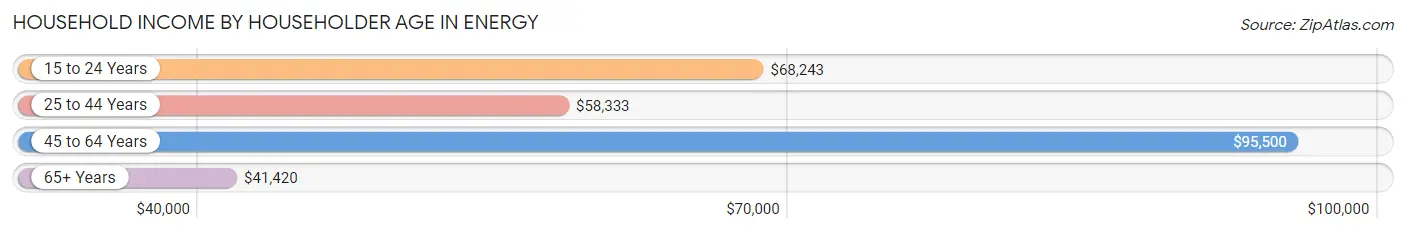
| Income Bracket | # Households | Median Income |
| 15 to 24 Years | 52 (9.8%) | $68,243 |
| 25 to 44 Years | 124 (23.3%) | $58,333 |
| 45 to 64 Years | 164 (30.8%) | $95,500 |
| 65+ Years | 193 (36.2%) | $41,420 |
| Total | 533 (100.0%) | $67,713 |
Poverty in Energy
Income Below Poverty by Sex and Age in Energy
With 11.2% poverty level for males and 9.6% for females among the residents of Energy, 6 to 11 year old males and 12 to 14 year old females are the most vulnerable to poverty, with 8 males (72.7%) and 10 females (32.3%) in their respective age groups living below the poverty level.
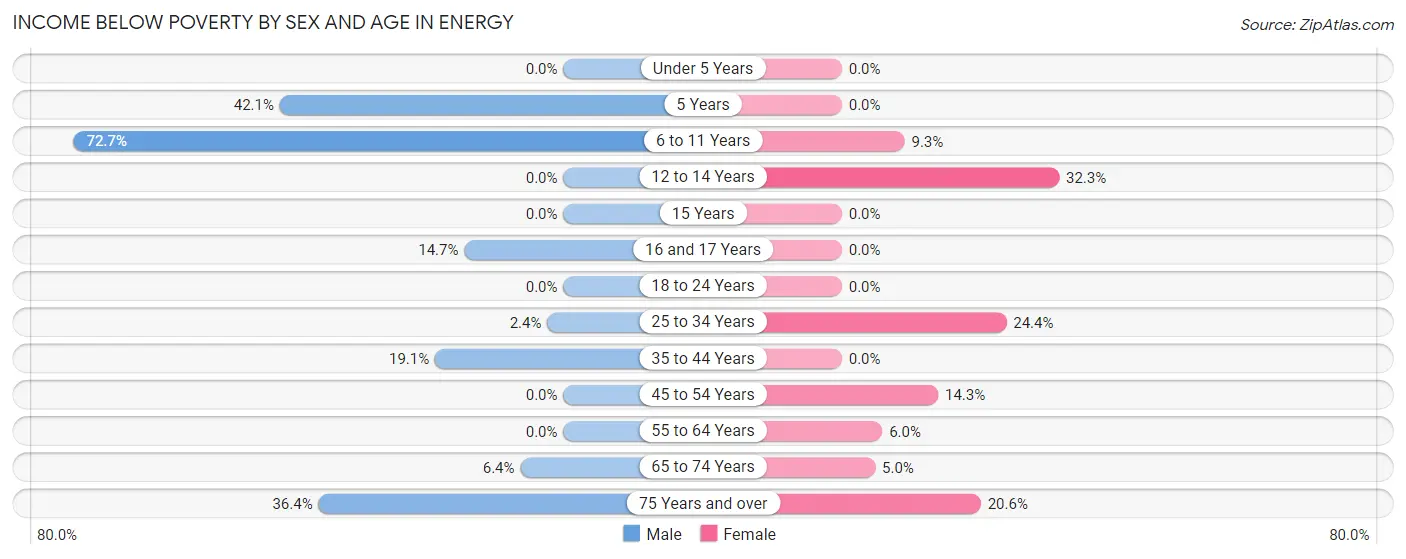
| Age Bracket | Male | Female |
| Under 5 Years | 0 (0.0%) | 0 (0.0%) |
| 5 Years | 8 (42.1%) | 0 (0.0%) |
| 6 to 11 Years | 8 (72.7%) | 11 (9.3%) |
| 12 to 14 Years | 0 (0.0%) | 10 (32.3%) |
| 15 Years | 0 (0.0%) | 0 (0.0%) |
| 16 and 17 Years | 5 (14.7%) | 0 (0.0%) |
| 18 to 24 Years | 0 (0.0%) | 0 (0.0%) |
| 25 to 34 Years | 1 (2.4%) | 21 (24.4%) |
| 35 to 44 Years | 8 (19.1%) | 0 (0.0%) |
| 45 to 54 Years | 0 (0.0%) | 4 (14.3%) |
| 55 to 64 Years | 0 (0.0%) | 6 (6.0%) |
| 65 to 74 Years | 6 (6.4%) | 5 (5.0%) |
| 75 Years and over | 16 (36.4%) | 13 (20.6%) |
| Total | 52 (11.2%) | 70 (9.6%) |
Income Above Poverty by Sex and Age in Energy
According to the poverty statistics in Energy, males aged under 5 years and females aged under 5 years are the age groups that are most secure financially, with 100.0% of males and 100.0% of females in these age groups living above the poverty line.
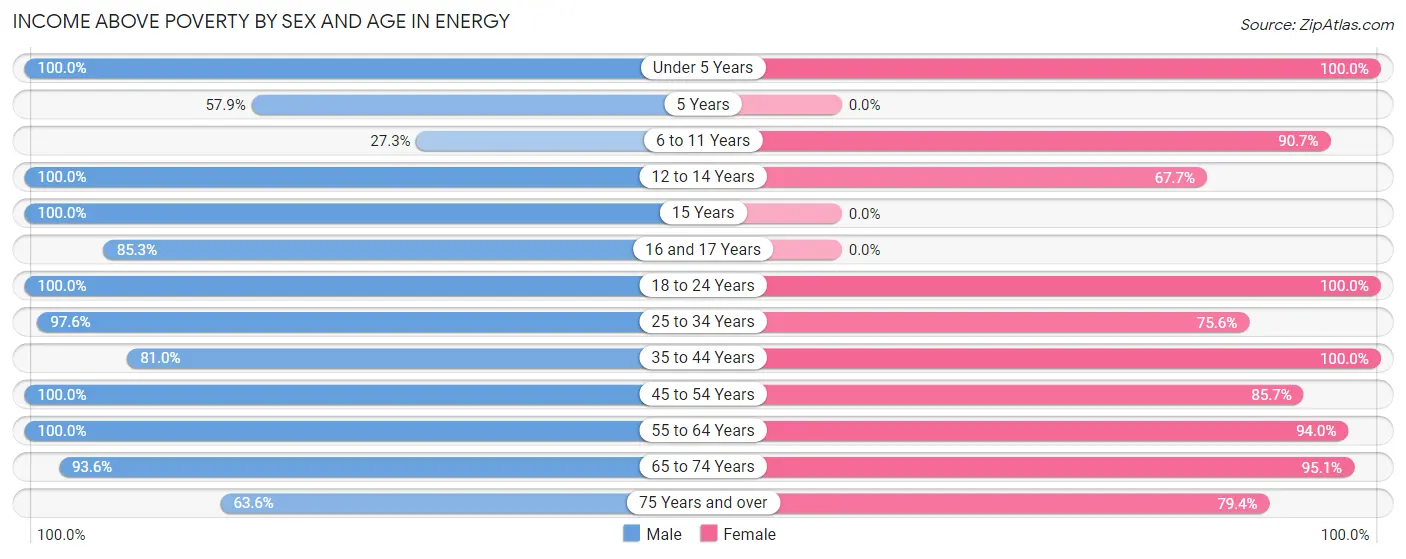
| Age Bracket | Male | Female |
| Under 5 Years | 8 (100.0%) | 77 (100.0%) |
| 5 Years | 11 (57.9%) | 0 (0.0%) |
| 6 to 11 Years | 3 (27.3%) | 107 (90.7%) |
| 12 to 14 Years | 13 (100.0%) | 21 (67.7%) |
| 15 Years | 7 (100.0%) | 0 (0.0%) |
| 16 and 17 Years | 29 (85.3%) | 0 (0.0%) |
| 18 to 24 Years | 16 (100.0%) | 71 (100.0%) |
| 25 to 34 Years | 41 (97.6%) | 65 (75.6%) |
| 35 to 44 Years | 34 (80.9%) | 55 (100.0%) |
| 45 to 54 Years | 44 (100.0%) | 24 (85.7%) |
| 55 to 64 Years | 89 (100.0%) | 94 (94.0%) |
| 65 to 74 Years | 88 (93.6%) | 96 (95.1%) |
| 75 Years and over | 28 (63.6%) | 50 (79.4%) |
| Total | 411 (88.8%) | 660 (90.4%) |
Income Below Poverty Among Married-Couple Families in Energy
The poverty statistics for married-couple families in Energy show that 9.0% or 22 of the total 243 families live below the poverty line. Families with 1 or 2 children have the highest poverty rate of 14.7%, comprising of 11 families. On the other hand, families with 3 or 4 children have the lowest poverty rate of 0.0%, which includes 0 families.
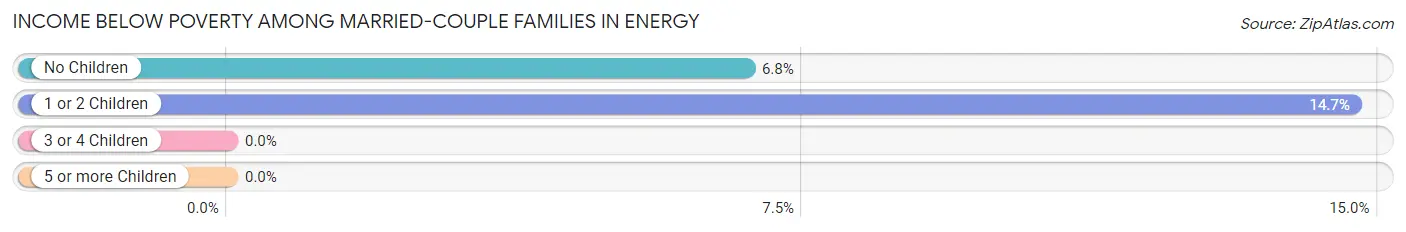
| Children | Above Poverty | Below Poverty |
| No Children | 152 (93.2%) | 11 (6.8%) |
| 1 or 2 Children | 64 (85.3%) | 11 (14.7%) |
| 3 or 4 Children | 5 (100.0%) | 0 (0.0%) |
| 5 or more Children | 0 (0.0%) | 0 (0.0%) |
| Total | 221 (90.9%) | 22 (9.0%) |
Income Below Poverty Among Single-Parent Households in Energy
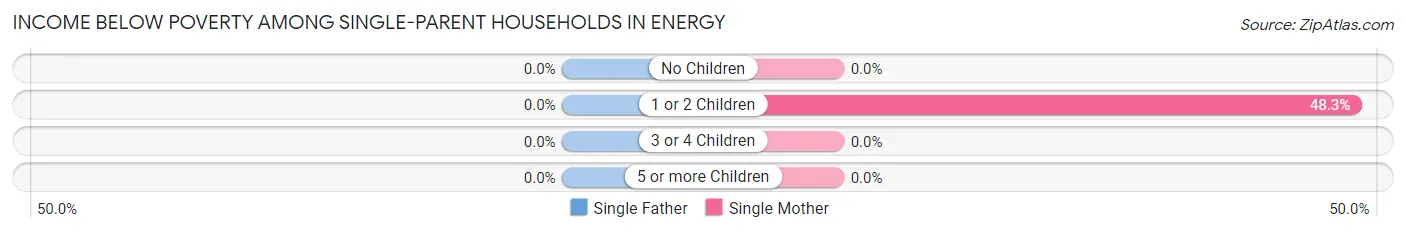
| Children | Single Father | Single Mother |
| No Children | 0 (0.0%) | 0 (0.0%) |
| 1 or 2 Children | 0 (0.0%) | 14 (48.3%) |
| 3 or 4 Children | 0 (0.0%) | 0 (0.0%) |
| 5 or more Children | 0 (0.0%) | 0 (0.0%) |
| Total | 0 (0.0%) | 14 (27.5%) |
Income Below Poverty Among Married-Couple vs Single-Parent Households in Energy
The poverty data for Energy shows that 22 of the married-couple family households (9.0%) and 14 of the single-parent households (20.6%) are living below the poverty level. Within the married-couple family households, those with 1 or 2 children have the highest poverty rate, with 11 households (14.7%) falling below the poverty line. Among the single-parent households, those with 1 or 2 children have the highest poverty rate, with 14 household (32.6%) living below poverty.
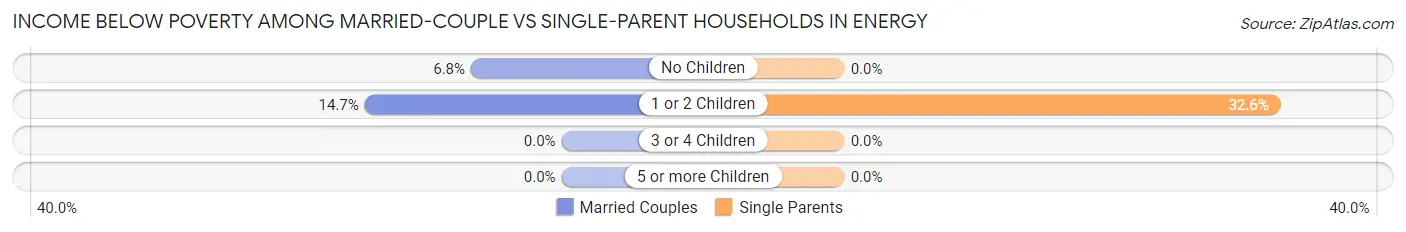
| Children | Married-Couple Families | Single-Parent Households |
| No Children | 11 (6.8%) | 0 (0.0%) |
| 1 or 2 Children | 11 (14.7%) | 14 (32.6%) |
| 3 or 4 Children | 0 (0.0%) | 0 (0.0%) |
| 5 or more Children | 0 (0.0%) | 0 (0.0%) |
| Total | 22 (9.0%) | 14 (20.6%) |
Race in Energy
The most populous races in Energy are White / Caucasian (1,029 | 83.9%), Two or more Races (182 | 14.8%), and Hispanic or Latino (41 | 3.3%).
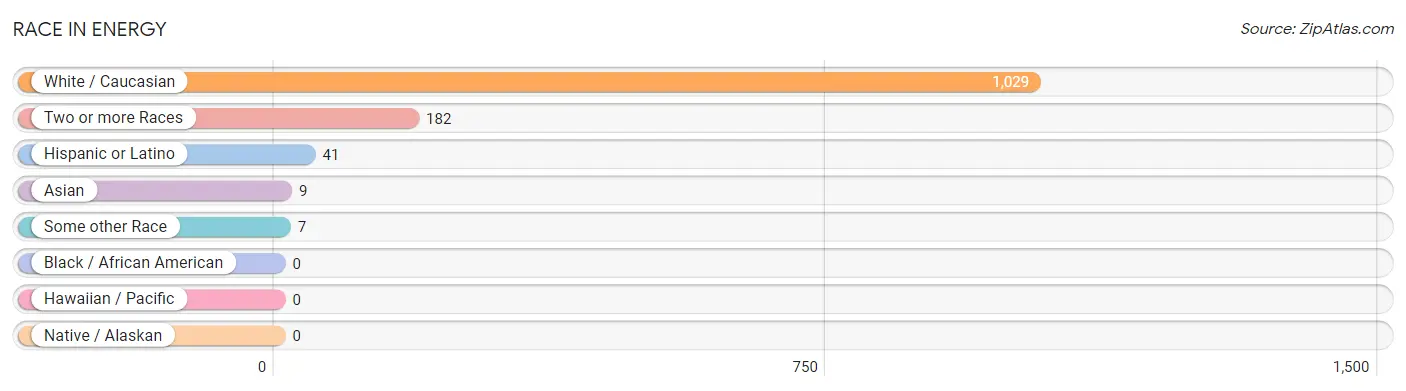
| Race | # Population | % Population |
| Asian | 9 | 0.7% |
| Black / African American | 0 | 0.0% |
| Hawaiian / Pacific | 0 | 0.0% |
| Hispanic or Latino | 41 | 3.3% |
| Native / Alaskan | 0 | 0.0% |
| White / Caucasian | 1,029 | 83.9% |
| Two or more Races | 182 | 14.8% |
| Some other Race | 7 | 0.6% |
| Total | 1,227 | 100.0% |
Ancestry in Energy
The most populous ancestries reported in Energy are German (145 | 11.8%), Irish (111 | 9.0%), Italian (104 | 8.5%), English (103 | 8.4%), and American (96 | 7.8%), together accounting for 45.6% of all Energy residents.
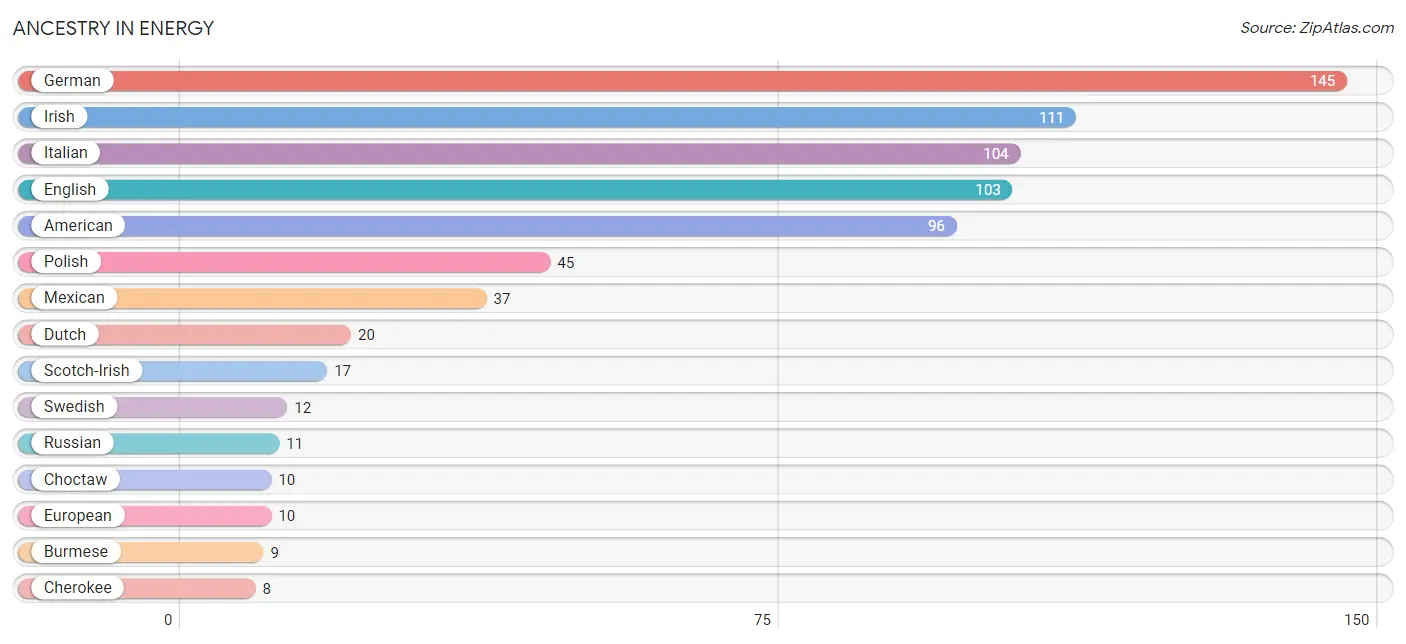
| Ancestry | # Population | % Population |
| American | 96 | 7.8% |
| British | 6 | 0.5% |
| Burmese | 9 | 0.7% |
| Cherokee | 8 | 0.6% |
| Choctaw | 10 | 0.8% |
| Dutch | 20 | 1.6% |
| English | 103 | 8.4% |
| European | 10 | 0.8% |
| German | 145 | 11.8% |
| Irish | 111 | 9.0% |
| Italian | 104 | 8.5% |
| Korean | 1 | 0.1% |
| Lithuanian | 1 | 0.1% |
| Mexican | 37 | 3.0% |
| Norwegian | 8 | 0.6% |
| Polish | 45 | 3.7% |
| Russian | 11 | 0.9% |
| Scotch-Irish | 17 | 1.4% |
| Scottish | 5 | 0.4% |
| Slovak | 3 | 0.2% |
| Swedish | 12 | 1.0% | View All 21 Rows |
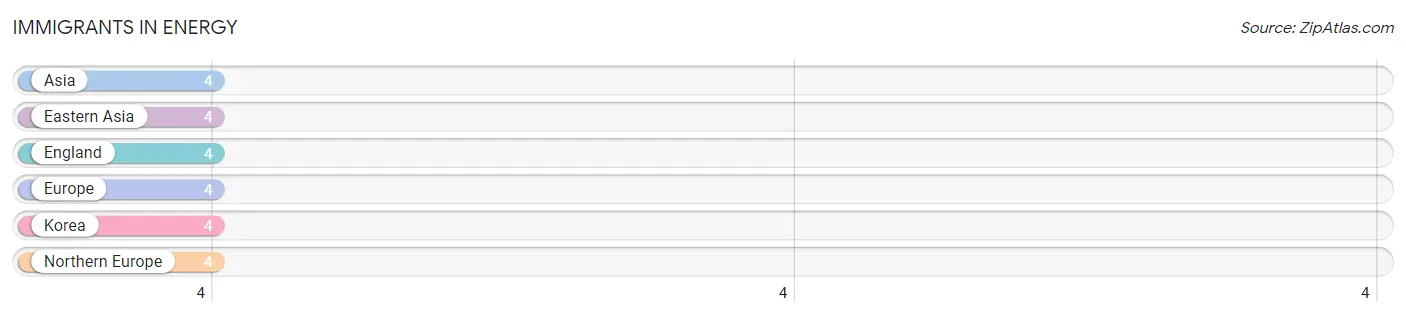
Immigrants in Energy
The most numerous immigrant groups reported in Energy came from Asia (4 | 0.3%), Eastern Asia (4 | 0.3%), England (4 | 0.3%), Europe (4 | 0.3%), and Korea (4 | 0.3%), together accounting for 1.7% of all Energy residents.
| Immigration Origin | # Population | % Population |
| Asia | 4 | 0.3% |
| Eastern Asia | 4 | 0.3% |
| England | 4 | 0.3% |
| Europe | 4 | 0.3% |
| Korea | 4 | 0.3% |
| Northern Europe | 4 | 0.3% | View All 6 Rows |
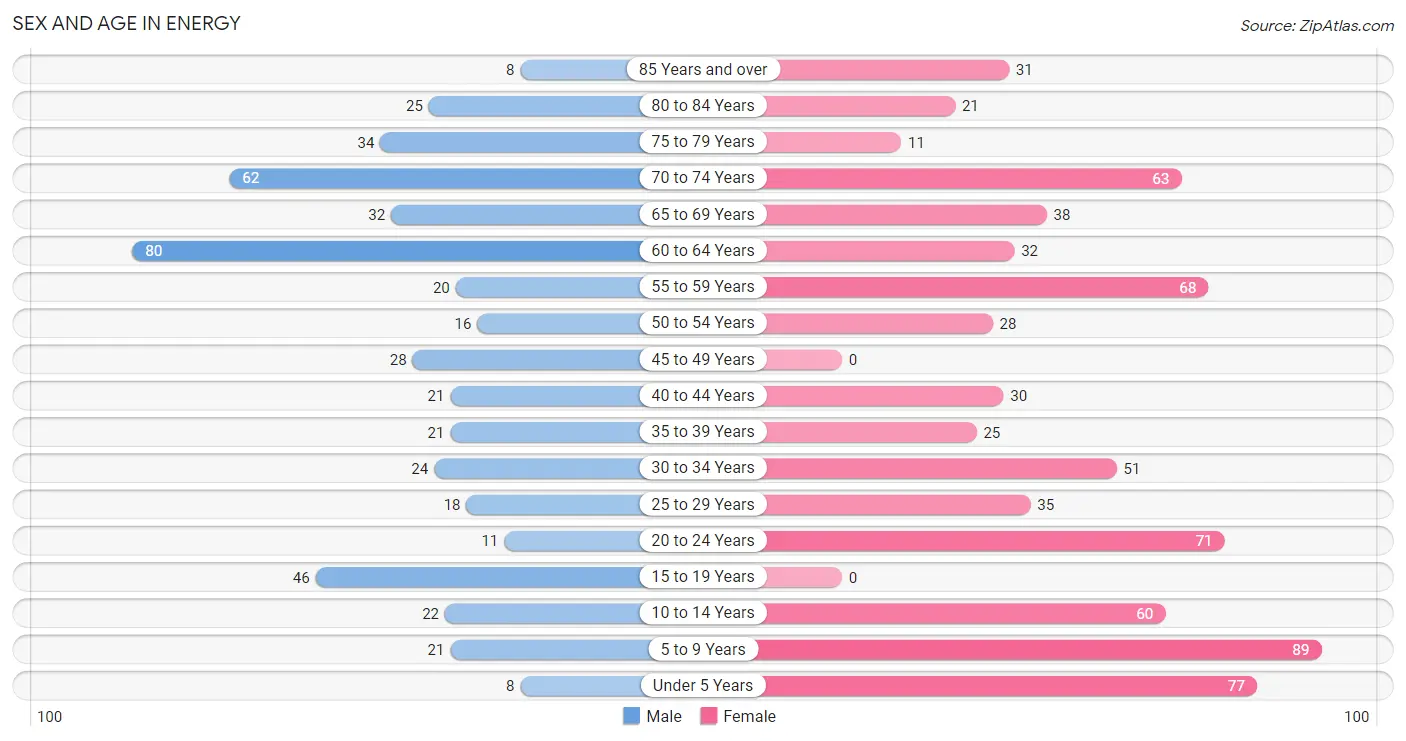
Sex and Age in Energy
Sex and Age in Energy
The most populous age groups in Energy are 60 to 64 Years (80 | 16.1%) for men and 5 to 9 Years (89 | 12.2%) for women.
| Age Bracket | Male | Female |
| Under 5 Years | 8 (1.6%) | 77 (10.5%) |
| 5 to 9 Years | 21 (4.2%) | 89 (12.2%) |
| 10 to 14 Years | 22 (4.4%) | 60 (8.2%) |
| 15 to 19 Years | 46 (9.3%) | 0 (0.0%) |
| 20 to 24 Years | 11 (2.2%) | 71 (9.7%) |
| 25 to 29 Years | 18 (3.6%) | 35 (4.8%) |
| 30 to 34 Years | 24 (4.8%) | 51 (7.0%) |
| 35 to 39 Years | 21 (4.2%) | 25 (3.4%) |
| 40 to 44 Years | 21 (4.2%) | 30 (4.1%) |
| 45 to 49 Years | 28 (5.6%) | 0 (0.0%) |
| 50 to 54 Years | 16 (3.2%) | 28 (3.8%) |
| 55 to 59 Years | 20 (4.0%) | 68 (9.3%) |
| 60 to 64 Years | 80 (16.1%) | 32 (4.4%) |
| 65 to 69 Years | 32 (6.4%) | 38 (5.2%) |
| 70 to 74 Years | 62 (12.5%) | 63 (8.6%) |
| 75 to 79 Years | 34 (6.8%) | 11 (1.5%) |
| 80 to 84 Years | 25 (5.0%) | 21 (2.9%) |
| 85 Years and over | 8 (1.6%) | 31 (4.3%) |
| Total | 497 (100.0%) | 730 (100.0%) |
Families and Households in Energy
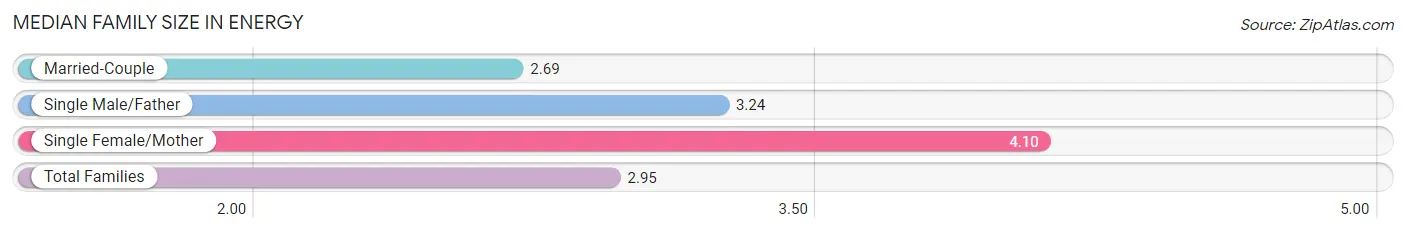
Median Family Size in Energy
The median family size in Energy is 2.95 persons per family, with single female/mother families (51 | 16.4%) accounting for the largest median family size of 4.1 persons per family. On the other hand, married-couple families (243 | 78.1%) represent the smallest median family size with 2.69 persons per family.
| Family Type | # Families | Family Size |
| Married-Couple | 243 (78.1%) | 2.69 |
| Single Male/Father | 17 (5.5%) | 3.24 |
| Single Female/Mother | 51 (16.4%) | 4.10 |
| Total Families | 311 (100.0%) | 2.95 |
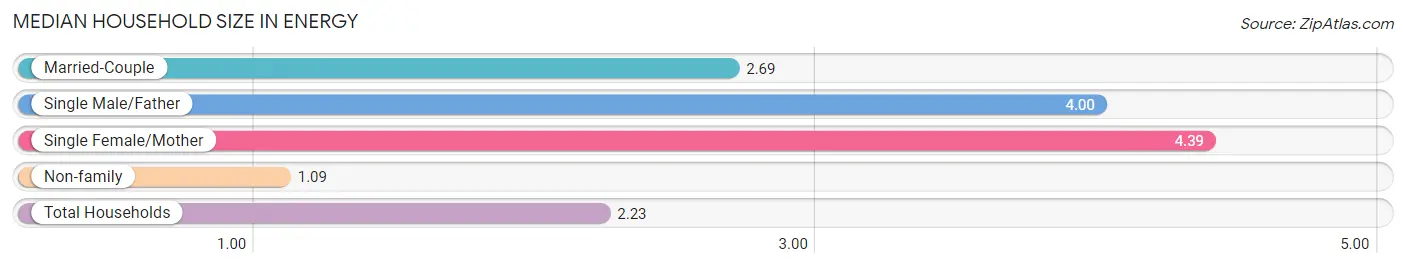
Median Household Size in Energy
The median household size in Energy is 2.23 persons per household, with single female/mother households (51 | 9.6%) accounting for the largest median household size of 4.39 persons per household. non-family households (222 | 41.6%) represent the smallest median household size with 1.09 persons per household.
| Household Type | # Households | Household Size |
| Married-Couple | 243 (45.6%) | 2.69 |
| Single Male/Father | 17 (3.2%) | 4.00 |
| Single Female/Mother | 51 (9.6%) | 4.39 |
| Non-family | 222 (41.6%) | 1.09 |
| Total Households | 533 (100.0%) | 2.23 |
Household Size by Marriage Status in Energy
Out of a total of 533 households in Energy, 311 (58.4%) are family households, while 222 (41.6%) are nonfamily households. The most numerous type of family households are 2-person households, comprising 156, and the most common type of nonfamily households are 1-person households, comprising 176.
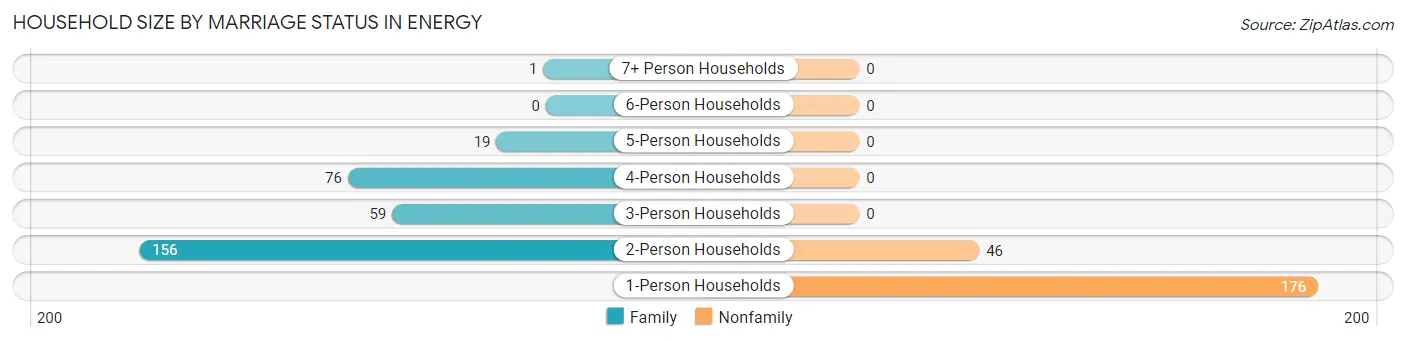
| Household Size | Family Households | Nonfamily Households |
| 1-Person Households | - | 176 (33.0%) |
| 2-Person Households | 156 (29.3%) | 46 (8.6%) |
| 3-Person Households | 59 (11.1%) | 0 (0.0%) |
| 4-Person Households | 76 (14.3%) | 0 (0.0%) |
| 5-Person Households | 19 (3.6%) | 0 (0.0%) |
| 6-Person Households | 0 (0.0%) | 0 (0.0%) |
| 7+ Person Households | 1 (0.2%) | 0 (0.0%) |
| Total | 311 (58.4%) | 222 (41.6%) |
Female Fertility in Energy
Fertility by Age in Energy
Average fertility rate in Energy is 22.0 births per 1,000 women. Women in the age bracket of 20 to 34 years have the highest fertility rate with 32.0 births per 1,000 women. Women in the age bracket of 20 to 34 years acount for 100.0% of all women with births.
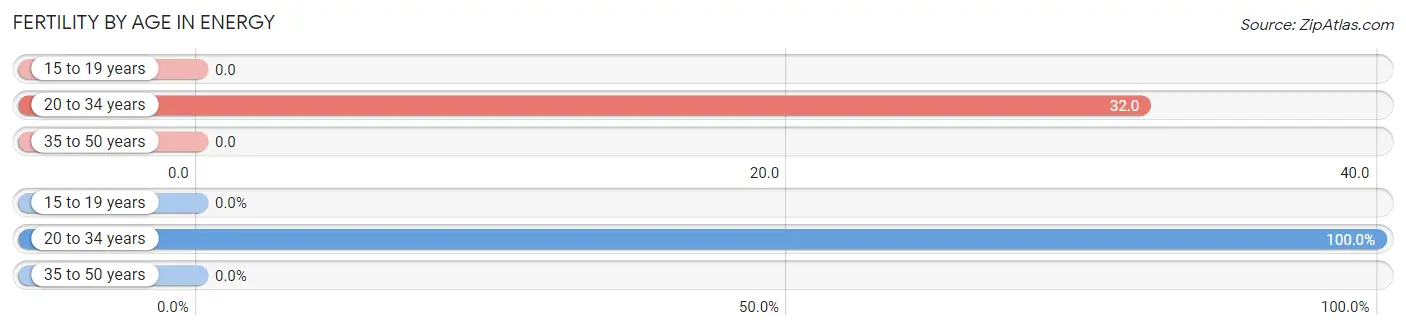
| Age Bracket | Women with Births | Births / 1,000 Women |
| 15 to 19 years | 0 (0.0%) | 0.0 |
| 20 to 34 years | 5 (100.0%) | 32.0 |
| 35 to 50 years | 0 (0.0%) | 0.0 |
| Total | 5 (100.0%) | 22.0 |
Fertility by Age by Marriage Status in Energy
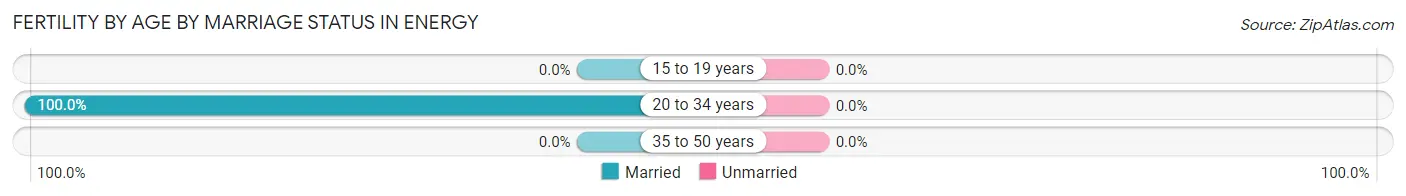
| Age Bracket | Married | Unmarried |
| 15 to 19 years | 0 (0.0%) | 0 (0.0%) |
| 20 to 34 years | 5 (100.0%) | 0 (0.0%) |
| 35 to 50 years | 0 (0.0%) | 0 (0.0%) |
| Total | 5 (100.0%) | 0 (0.0%) |
Fertility by Education in Energy
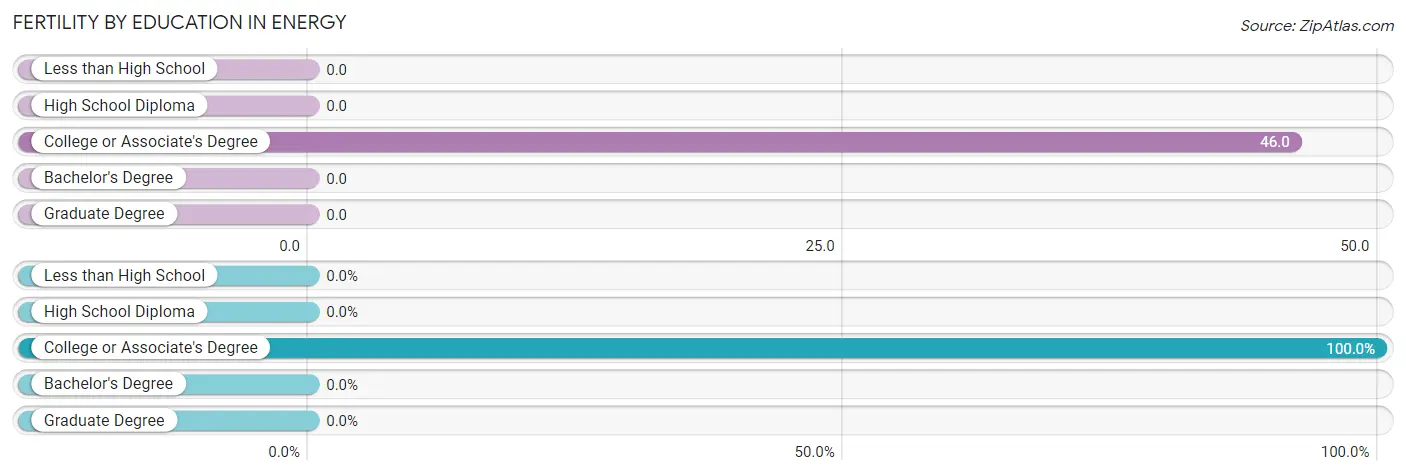
| Educational Attainment | Women with Births | Births / 1,000 Women |
| Less than High School | 0 (0.0%) | 0.0 |
| High School Diploma | 0 (0.0%) | 0.0 |
| College or Associate's Degree | 5 (100.0%) | 46.0 |
| Bachelor's Degree | 0 (0.0%) | 0.0 |
| Graduate Degree | 0 (0.0%) | 0.0 |
| Total | 5 (100.0%) | 22.0 |
Fertility by Education by Marriage Status in Energy
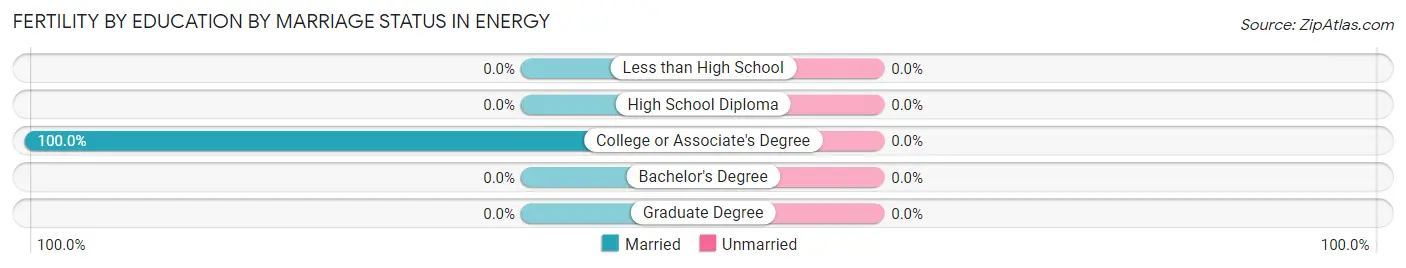
| Educational Attainment | Married | Unmarried |
| Less than High School | 0 (0.0%) | 0 (0.0%) |
| High School Diploma | 0 (0.0%) | 0 (0.0%) |
| College or Associate's Degree | 5 (100.0%) | 0 (0.0%) |
| Bachelor's Degree | 0 (0.0%) | 0 (0.0%) |
| Graduate Degree | 0 (0.0%) | 0 (0.0%) |
| Total | 5 (100.0%) | 0 (0.0%) |
Employment Characteristics in Energy
Employment by Class of Employer in Energy
Among the 518 employed individuals in Energy, private company employees (261 | 50.4%), local government employees (70 | 13.5%), and not-for-profit organizations (69 | 13.3%) make up the most common classes of employment.
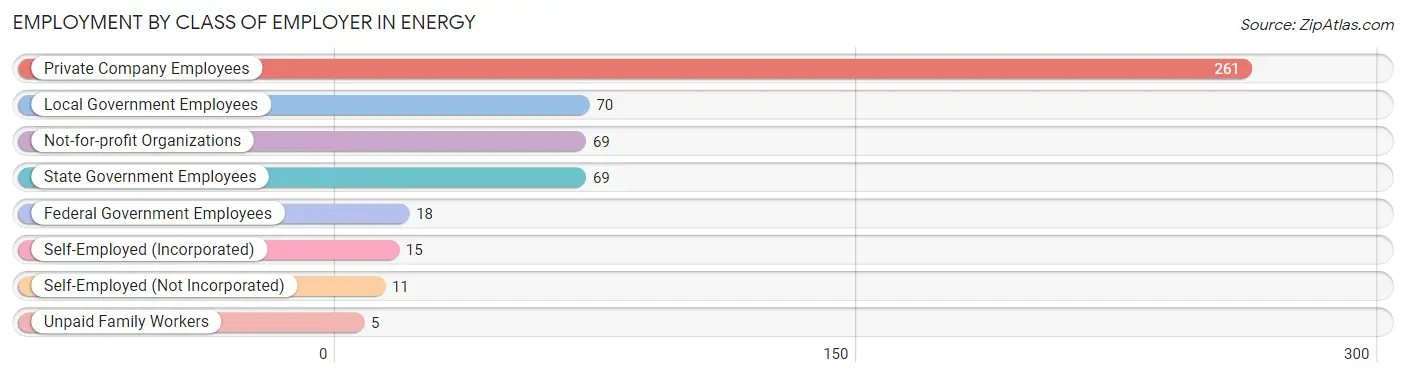
| Employer Class | # Employees | % Employees |
| Private Company Employees | 261 | 50.4% |
| Self-Employed (Incorporated) | 15 | 2.9% |
| Self-Employed (Not Incorporated) | 11 | 2.1% |
| Not-for-profit Organizations | 69 | 13.3% |
| Local Government Employees | 70 | 13.5% |
| State Government Employees | 69 | 13.3% |
| Federal Government Employees | 18 | 3.5% |
| Unpaid Family Workers | 5 | 1.0% |
| Total | 518 | 100.0% |
Employment Status by Age in Energy
According to the labor force statistics for Energy, out of the total population over 16 years of age (943), 59.0% or 556 individuals are in the labor force, with 5.6% or 31 of them unemployed. The age group with the highest labor force participation rate is 25 to 29 years, with 100.0% or 53 individuals in the labor force. Within the labor force, the 45 to 54 years age range has the highest percentage of unemployed individuals, with 26.2% or 17 of them being unemployed.
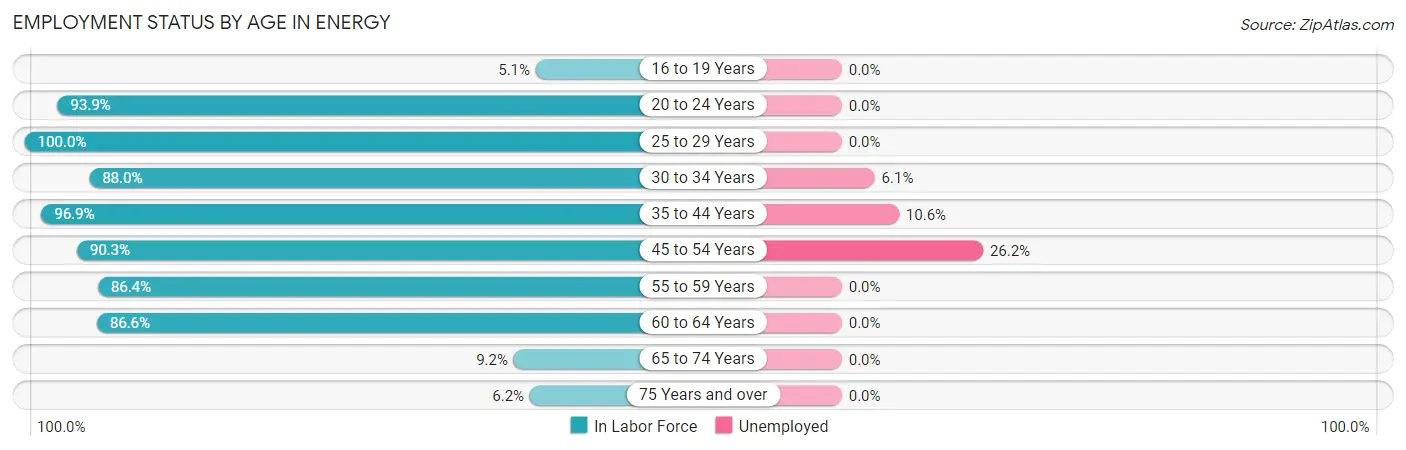
| Age Bracket | In Labor Force | Unemployed |
| 16 to 19 Years | 2 (5.1%) | 0 (0.0%) |
| 20 to 24 Years | 77 (93.9%) | 0 (0.0%) |
| 25 to 29 Years | 53 (100.0%) | 0 (0.0%) |
| 30 to 34 Years | 66 (88.0%) | 4 (6.1%) |
| 35 to 44 Years | 94 (96.9%) | 10 (10.6%) |
| 45 to 54 Years | 65 (90.3%) | 17 (26.2%) |
| 55 to 59 Years | 76 (86.4%) | 0 (0.0%) |
| 60 to 64 Years | 97 (86.6%) | 0 (0.0%) |
| 65 to 74 Years | 18 (9.2%) | 0 (0.0%) |
| 75 Years and over | 8 (6.2%) | 0 (0.0%) |
| Total | 556 (59.0%) | 31 (5.6%) |
Employment Status by Educational Attainment in Energy
According to labor force statistics for Energy, 90.7% of individuals (451) out of the total population between 25 and 64 years of age (497) are in the labor force, with 6.9% or 31 of them being unemployed. The group with the highest labor force participation rate are those with the educational attainment of less than high school, with 100.0% or 10 individuals in the labor force. Within the labor force, individuals with college / associate degree education have the highest percentage of unemployment, with 13.4% or 28 of them being unemployed.
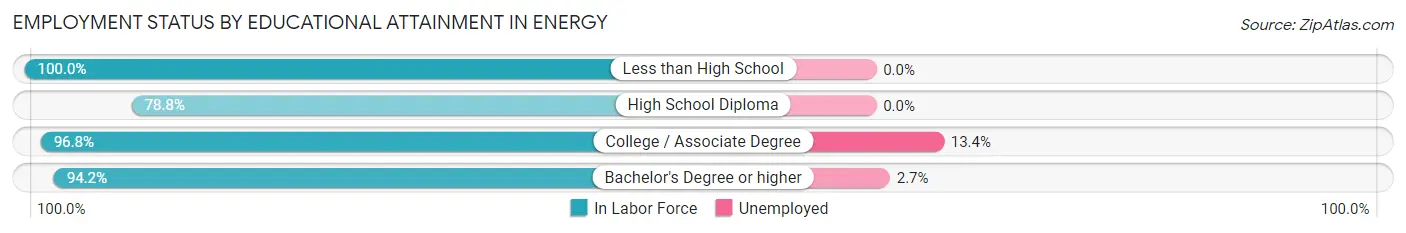
| Educational Attainment | In Labor Force | Unemployed |
| Less than High School | 10 (100.0%) | 0 (0.0%) |
| High School Diploma | 119 (78.8%) | 0 (0.0%) |
| College / Associate Degree | 209 (96.8%) | 29 (13.4%) |
| Bachelor's Degree or higher | 113 (94.2%) | 3 (2.7%) |
| Total | 451 (90.7%) | 34 (6.9%) |
Employment Occupations by Sex in Energy
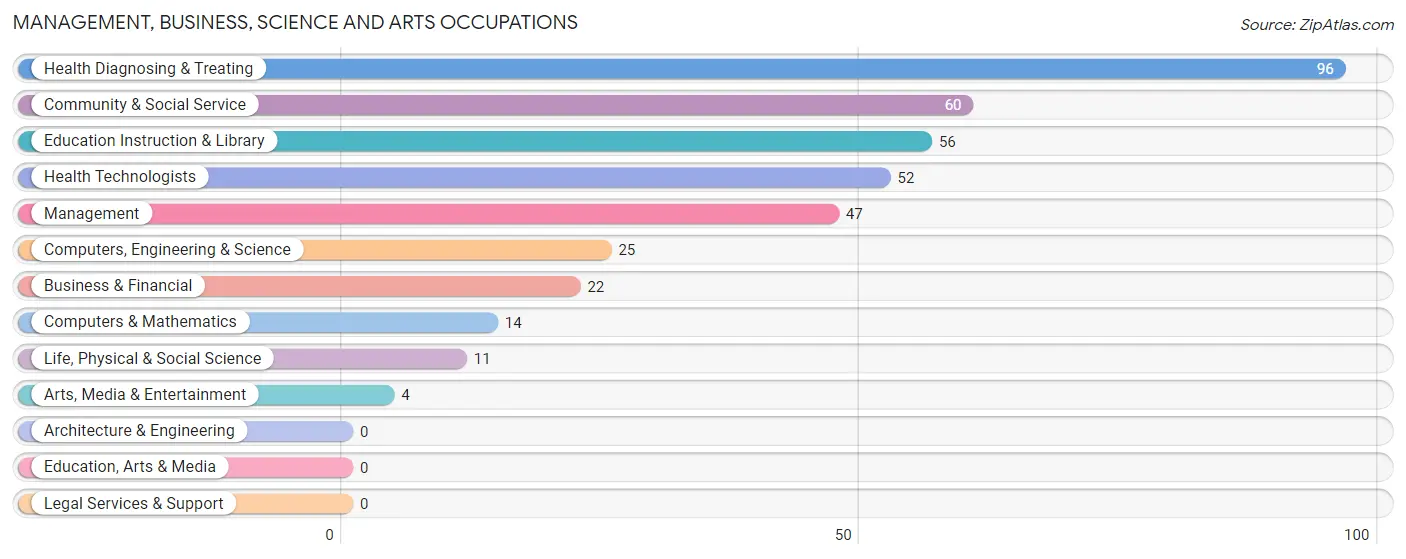
Management, Business, Science and Arts Occupations
The most common Management, Business, Science and Arts occupations in Energy are Health Diagnosing & Treating (96 | 18.3%), Community & Social Service (60 | 11.4%), Education Instruction & Library (56 | 10.7%), Health Technologists (52 | 9.9%), and Management (47 | 8.9%).
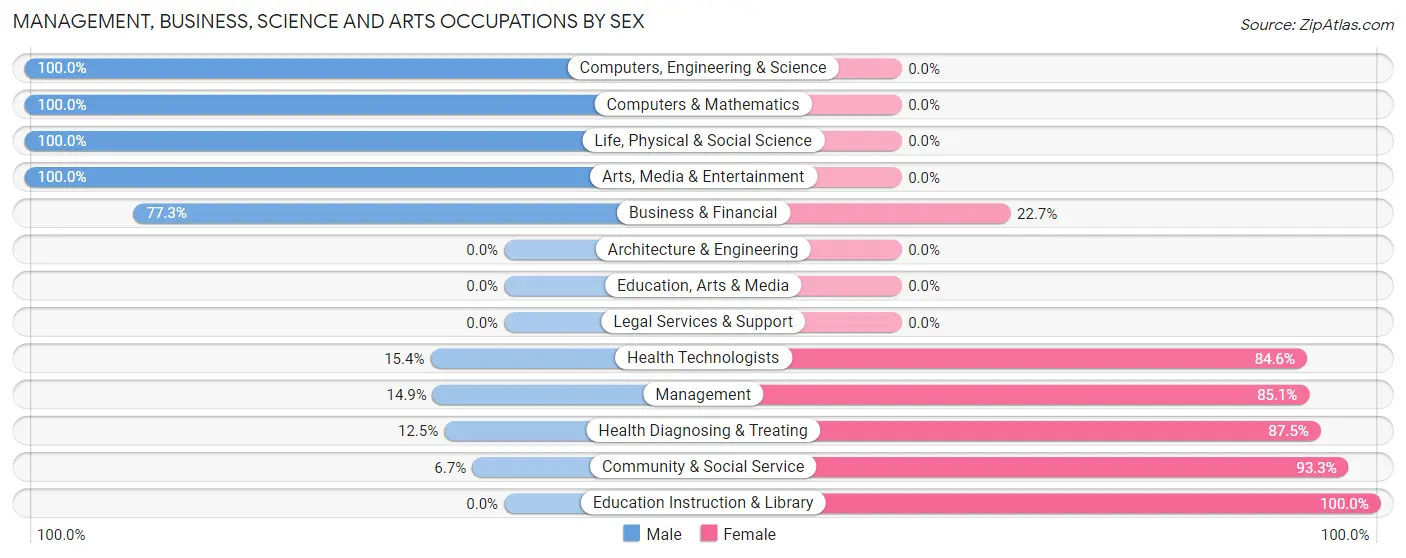
Management, Business, Science and Arts Occupations by Sex
Within the Management, Business, Science and Arts occupations in Energy, the most male-oriented occupations are Computers, Engineering & Science (100.0%), Computers & Mathematics (100.0%), and Life, Physical & Social Science (100.0%), while the most female-oriented occupations are Education Instruction & Library (100.0%), Community & Social Service (93.3%), and Health Diagnosing & Treating (87.5%).
| Occupation | Male | Female |
| Management | 7 (14.9%) | 40 (85.1%) |
| Business & Financial | 17 (77.3%) | 5 (22.7%) |
| Computers, Engineering & Science | 25 (100.0%) | 0 (0.0%) |
| Computers & Mathematics | 14 (100.0%) | 0 (0.0%) |
| Architecture & Engineering | 0 (0.0%) | 0 (0.0%) |
| Life, Physical & Social Science | 11 (100.0%) | 0 (0.0%) |
| Community & Social Service | 4 (6.7%) | 56 (93.3%) |
| Education, Arts & Media | 0 (0.0%) | 0 (0.0%) |
| Legal Services & Support | 0 (0.0%) | 0 (0.0%) |
| Education Instruction & Library | 0 (0.0%) | 56 (100.0%) |
| Arts, Media & Entertainment | 4 (100.0%) | 0 (0.0%) |
| Health Diagnosing & Treating | 12 (12.5%) | 84 (87.5%) |
| Health Technologists | 8 (15.4%) | 44 (84.6%) |
| Total (Category) | 65 (26.0%) | 185 (74.0%) |
| Total (Overall) | 206 (39.2%) | 319 (60.8%) |
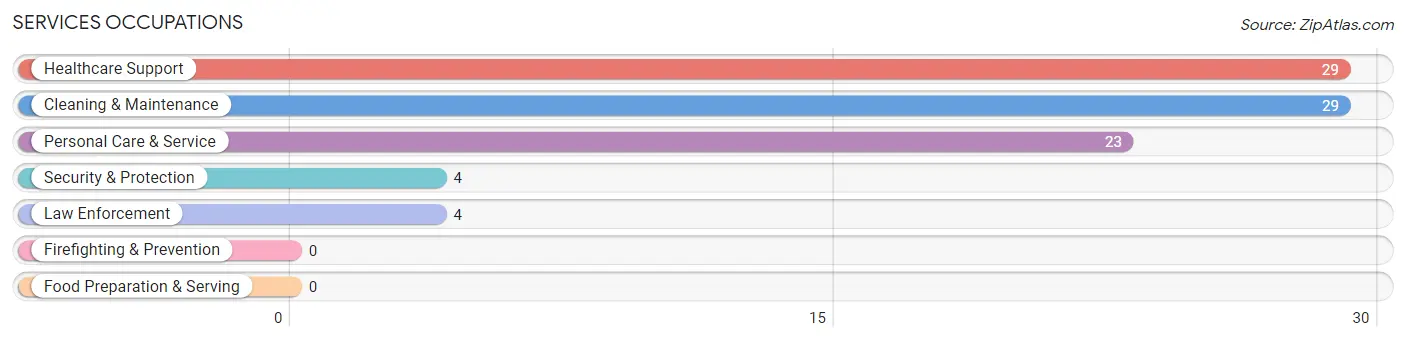
Services Occupations
The most common Services occupations in Energy are Healthcare Support (29 | 5.5%), Cleaning & Maintenance (29 | 5.5%), Personal Care & Service (23 | 4.4%), Security & Protection (4 | 0.8%), and Law Enforcement (4 | 0.8%).
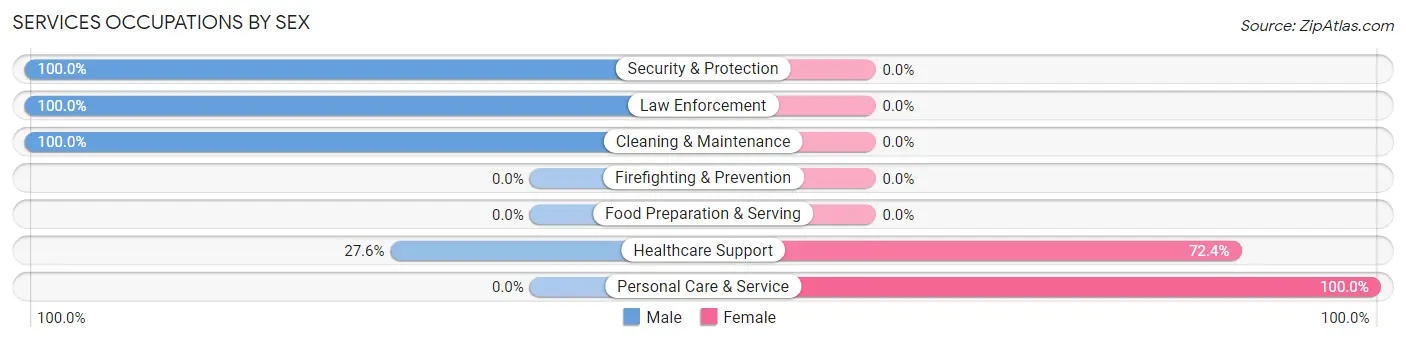
Services Occupations by Sex
Within the Services occupations in Energy, the most male-oriented occupations are Security & Protection (100.0%), Law Enforcement (100.0%), and Cleaning & Maintenance (100.0%), while the most female-oriented occupations are Personal Care & Service (100.0%), and Healthcare Support (72.4%).
| Occupation | Male | Female |
| Healthcare Support | 8 (27.6%) | 21 (72.4%) |
| Security & Protection | 4 (100.0%) | 0 (0.0%) |
| Firefighting & Prevention | 0 (0.0%) | 0 (0.0%) |
| Law Enforcement | 4 (100.0%) | 0 (0.0%) |
| Food Preparation & Serving | 0 (0.0%) | 0 (0.0%) |
| Cleaning & Maintenance | 29 (100.0%) | 0 (0.0%) |
| Personal Care & Service | 0 (0.0%) | 23 (100.0%) |
| Total (Category) | 41 (48.2%) | 44 (51.8%) |
| Total (Overall) | 206 (39.2%) | 319 (60.8%) |
Sales and Office Occupations
The most common Sales and Office occupations in Energy are Office & Administration (76 | 14.5%), and Sales & Related (45 | 8.6%).

Sales and Office Occupations by Sex

| Occupation | Male | Female |
| Sales & Related | 45 (100.0%) | 0 (0.0%) |
| Office & Administration | 0 (0.0%) | 76 (100.0%) |
| Total (Category) | 45 (37.2%) | 76 (62.8%) |
| Total (Overall) | 206 (39.2%) | 319 (60.8%) |
Natural Resources, Construction and Maintenance Occupations
The most common Natural Resources, Construction and Maintenance occupations in Energy are Construction & Extraction (14 | 2.7%), and Installation, Maintenance & Repair (10 | 1.9%).
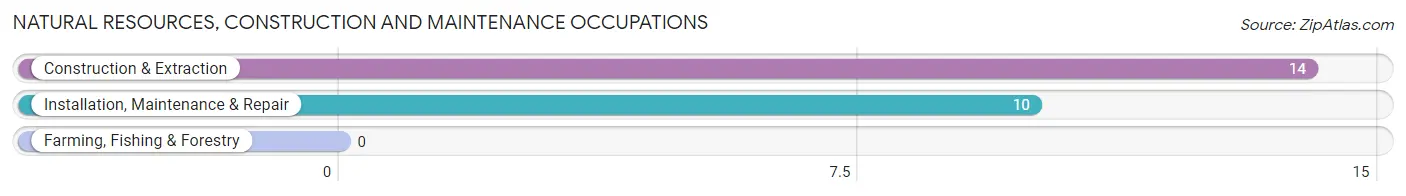
Natural Resources, Construction and Maintenance Occupations by Sex
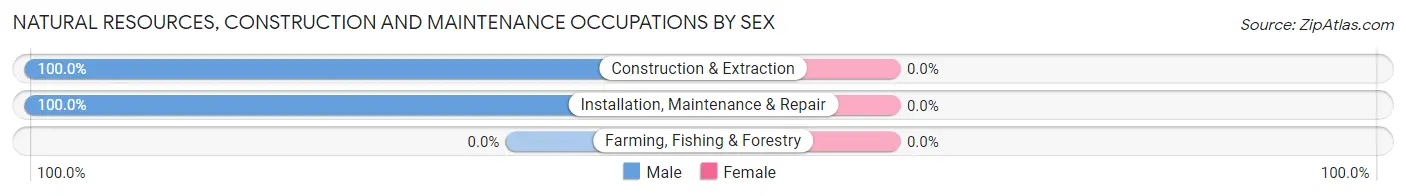
| Occupation | Male | Female |
| Farming, Fishing & Forestry | 0 (0.0%) | 0 (0.0%) |
| Construction & Extraction | 14 (100.0%) | 0 (0.0%) |
| Installation, Maintenance & Repair | 10 (100.0%) | 0 (0.0%) |
| Total (Category) | 24 (100.0%) | 0 (0.0%) |
| Total (Overall) | 206 (39.2%) | 319 (60.8%) |
Production, Transportation and Moving Occupations
The most common Production, Transportation and Moving occupations in Energy are Transportation (17 | 3.2%), Production (15 | 2.9%), and Material Moving (13 | 2.5%).
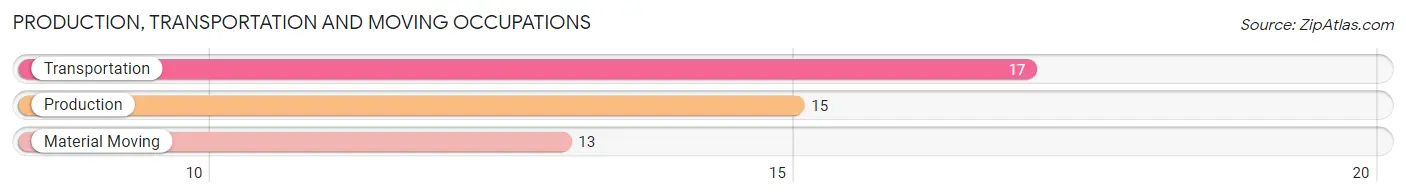
Production, Transportation and Moving Occupations by Sex
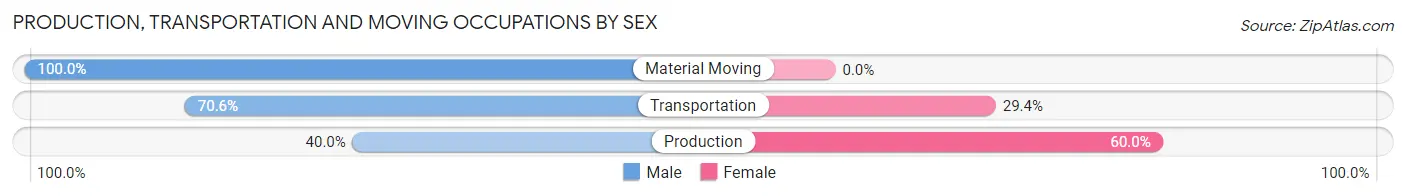
| Occupation | Male | Female |
| Production | 6 (40.0%) | 9 (60.0%) |
| Transportation | 12 (70.6%) | 5 (29.4%) |
| Material Moving | 13 (100.0%) | 0 (0.0%) |
| Total (Category) | 31 (68.9%) | 14 (31.1%) |
| Total (Overall) | 206 (39.2%) | 319 (60.8%) |
Employment Industries by Sex in Energy
Employment Industries in Energy
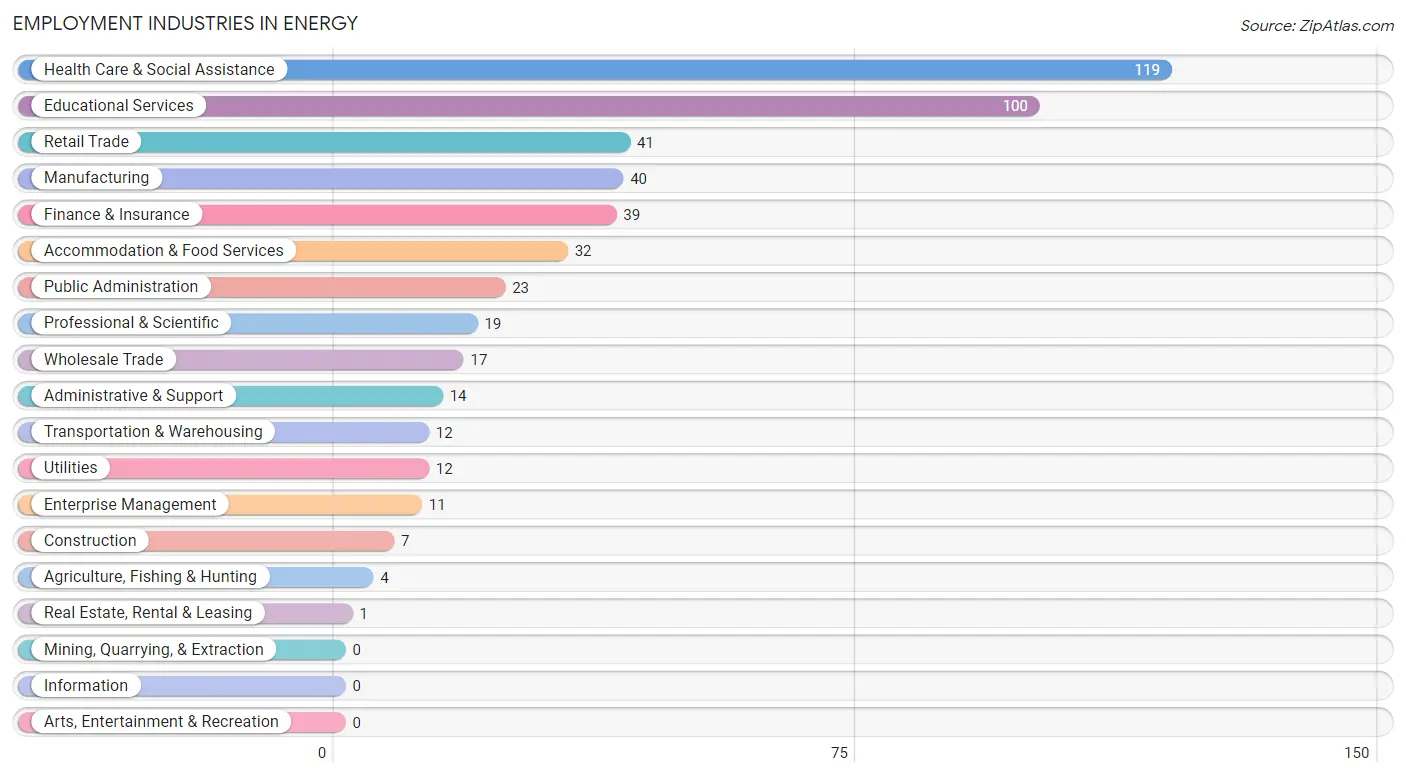
The major employment industries in Energy include Health Care & Social Assistance (119 | 22.7%), Educational Services (100 | 19.1%), Retail Trade (41 | 7.8%), Manufacturing (40 | 7.6%), and Finance & Insurance (39 | 7.4%).
Employment Industries by Sex in Energy
The Energy industries that see more men than women are Agriculture, Fishing & Hunting (100.0%), Construction (100.0%), and Professional & Scientific (100.0%), whereas the industries that tend to have a higher number of women are Utilities (100.0%), Real Estate, Rental & Leasing (100.0%), and Enterprise Management (100.0%).

| Industry | Male | Female |
| Agriculture, Fishing & Hunting | 4 (100.0%) | 0 (0.0%) |
| Mining, Quarrying, & Extraction | 0 (0.0%) | 0 (0.0%) |
| Construction | 7 (100.0%) | 0 (0.0%) |
| Manufacturing | 10 (25.0%) | 30 (75.0%) |
| Wholesale Trade | 12 (70.6%) | 5 (29.4%) |
| Retail Trade | 13 (31.7%) | 28 (68.3%) |
| Transportation & Warehousing | 7 (58.3%) | 5 (41.7%) |
| Utilities | 0 (0.0%) | 12 (100.0%) |
| Information | 0 (0.0%) | 0 (0.0%) |
| Finance & Insurance | 12 (30.8%) | 27 (69.2%) |
| Real Estate, Rental & Leasing | 0 (0.0%) | 1 (100.0%) |
| Professional & Scientific | 19 (100.0%) | 0 (0.0%) |
| Enterprise Management | 0 (0.0%) | 11 (100.0%) |
| Administrative & Support | 10 (71.4%) | 4 (28.6%) |
| Educational Services | 34 (34.0%) | 66 (66.0%) |
| Health Care & Social Assistance | 24 (20.2%) | 95 (79.8%) |
| Arts, Entertainment & Recreation | 0 (0.0%) | 0 (0.0%) |
| Accommodation & Food Services | 32 (100.0%) | 0 (0.0%) |
| Public Administration | 11 (47.8%) | 12 (52.2%) |
| Total | 206 (39.2%) | 319 (60.8%) |
Education in Energy
School Enrollment in Energy
The most common levels of schooling among the 290 students in Energy are elementary school (90 | 31.0%), middle school (82 | 28.3%), and high school (44 | 15.2%).
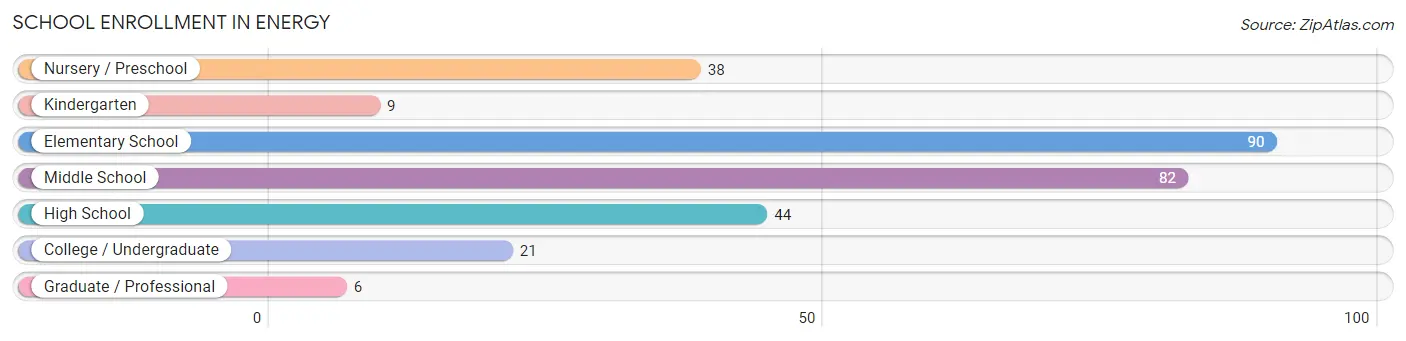
| School Level | # Students | % Students |
| Nursery / Preschool | 38 | 13.1% |
| Kindergarten | 9 | 3.1% |
| Elementary School | 90 | 31.0% |
| Middle School | 82 | 28.3% |
| High School | 44 | 15.2% |
| College / Undergraduate | 21 | 7.2% |
| Graduate / Professional | 6 | 2.1% |
| Total | 290 | 100.0% |
School Enrollment by Age by Funding Source in Energy
Out of a total of 290 students who are enrolled in schools in Energy, 137 (47.2%) attend a private institution, while the remaining 153 (52.8%) are enrolled in public schools. The age group of 3 to 4 year olds has the highest likelihood of being enrolled in private schools, with 38 (100.0% in the age bracket) enrolled. Conversely, the age group of 15 to 17 year olds has the lowest likelihood of being enrolled in a private school, with 41 (100.0% in the age bracket) attending a public institution.
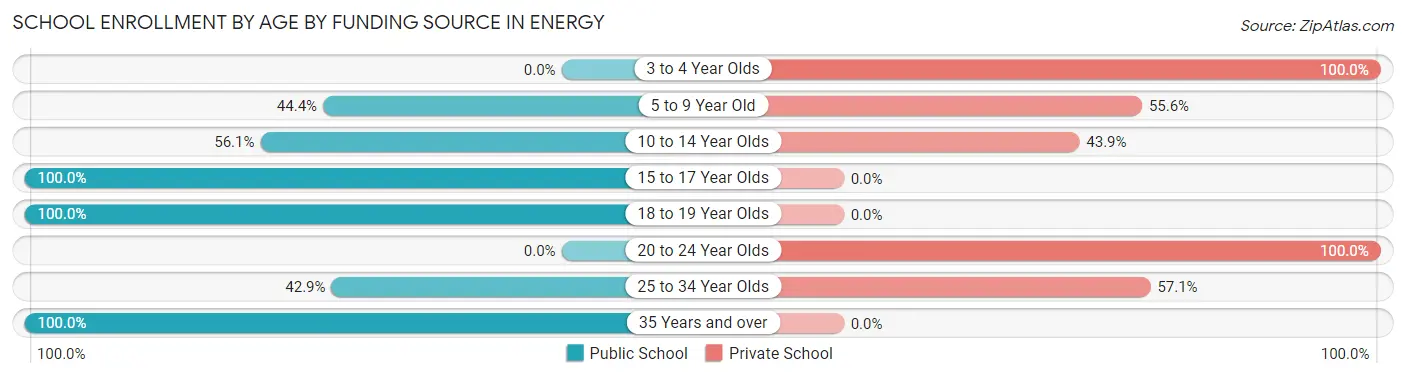
| Age Bracket | Public School | Private School |
| 3 to 4 Year Olds | 0 (0.0%) | 38 (100.0%) |
| 5 to 9 Year Old | 44 (44.4%) | 55 (55.6%) |
| 10 to 14 Year Olds | 46 (56.1%) | 36 (43.9%) |
| 15 to 17 Year Olds | 41 (100.0%) | 0 (0.0%) |
| 18 to 19 Year Olds | 3 (100.0%) | 0 (0.0%) |
| 20 to 24 Year Olds | 0 (0.0%) | 4 (100.0%) |
| 25 to 34 Year Olds | 3 (42.9%) | 4 (57.1%) |
| 35 Years and over | 16 (100.0%) | 0 (0.0%) |
| Total | 153 (52.8%) | 137 (47.2%) |
Educational Attainment by Field of Study in Energy
Education (44 | 20.4%), physical & health sciences (38 | 17.6%), science & technology (38 | 17.6%), business (36 | 16.7%), and communications (17 | 7.9%) are the most common fields of study among 216 individuals in Energy who have obtained a bachelor's degree or higher.
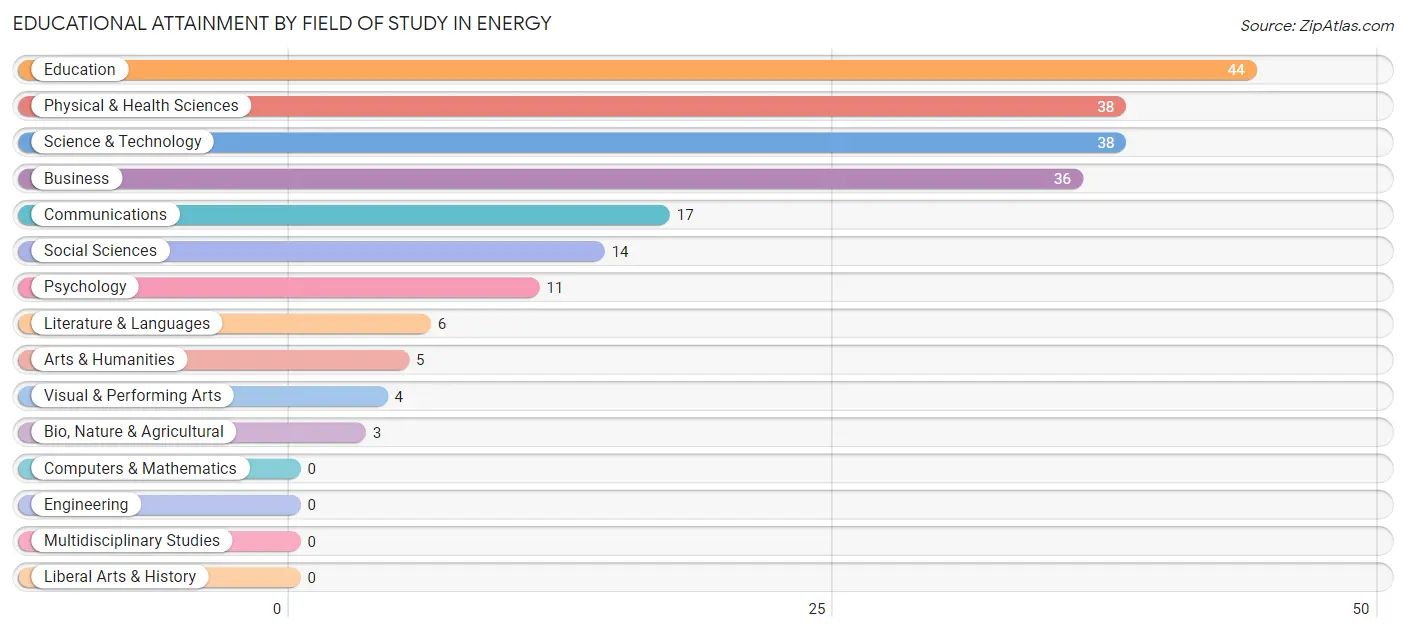
| Field of Study | # Graduates | % Graduates |
| Computers & Mathematics | 0 | 0.0% |
| Bio, Nature & Agricultural | 3 | 1.4% |
| Physical & Health Sciences | 38 | 17.6% |
| Psychology | 11 | 5.1% |
| Social Sciences | 14 | 6.5% |
| Engineering | 0 | 0.0% |
| Multidisciplinary Studies | 0 | 0.0% |
| Science & Technology | 38 | 17.6% |
| Business | 36 | 16.7% |
| Education | 44 | 20.4% |
| Literature & Languages | 6 | 2.8% |
| Liberal Arts & History | 0 | 0.0% |
| Visual & Performing Arts | 4 | 1.8% |
| Communications | 17 | 7.9% |
| Arts & Humanities | 5 | 2.3% |
| Total | 216 | 100.0% |
Transportation & Commute in Energy
Vehicle Availability by Sex in Energy
The most prevalent vehicle ownership categories in Energy are males with 2 vehicles (94, accounting for 45.9%) and females with 2 vehicles (135, making up 30.1%).
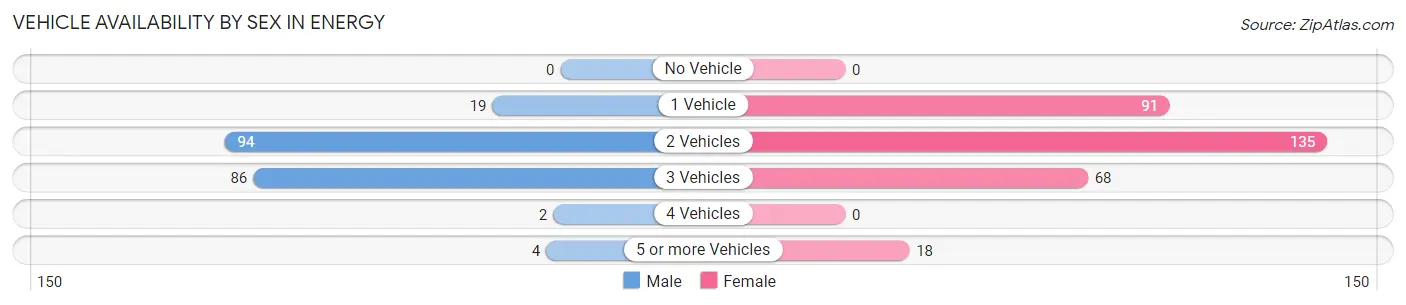
| Vehicles Available | Male | Female |
| No Vehicle | 0 (0.0%) | 0 (0.0%) |
| 1 Vehicle | 19 (9.3%) | 91 (29.2%) |
| 2 Vehicles | 94 (45.9%) | 135 (43.3%) |
| 3 Vehicles | 86 (41.9%) | 68 (21.8%) |
| 4 Vehicles | 2 (1.0%) | 0 (0.0%) |
| 5 or more Vehicles | 4 (1.9%) | 18 (5.8%) |
| Total | 205 (100.0%) | 312 (100.0%) |
Commute Time in Energy
The most frequently occuring commute durations in Energy are 15 to 19 minutes (99 commuters, 20.5%), 10 to 14 minutes (84 commuters, 17.4%), and 20 to 24 minutes (82 commuters, 17.0%).
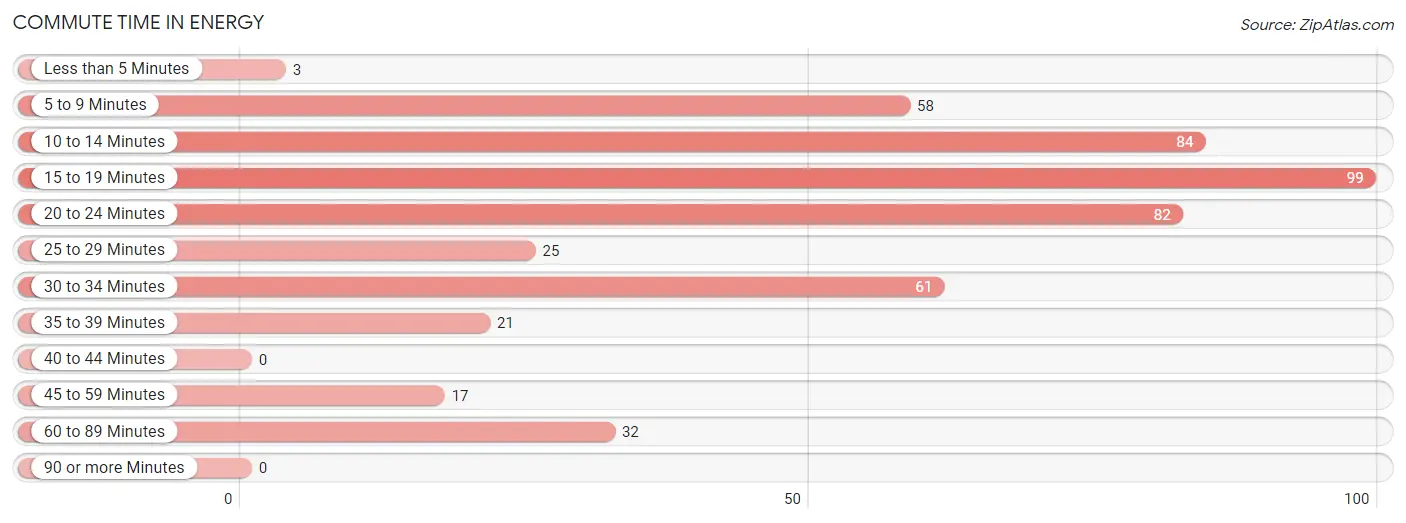
| Commute Time | # Commuters | % Commuters |
| Less than 5 Minutes | 3 | 0.6% |
| 5 to 9 Minutes | 58 | 12.0% |
| 10 to 14 Minutes | 84 | 17.4% |
| 15 to 19 Minutes | 99 | 20.5% |
| 20 to 24 Minutes | 82 | 17.0% |
| 25 to 29 Minutes | 25 | 5.2% |
| 30 to 34 Minutes | 61 | 12.7% |
| 35 to 39 Minutes | 21 | 4.4% |
| 40 to 44 Minutes | 0 | 0.0% |
| 45 to 59 Minutes | 17 | 3.5% |
| 60 to 89 Minutes | 32 | 6.6% |
| 90 or more Minutes | 0 | 0.0% |
Commute Time by Sex in Energy
The most common commute times in Energy are 30 to 34 minutes (52 commuters, 26.5%) for males and 20 to 24 minutes (66 commuters, 23.1%) for females.
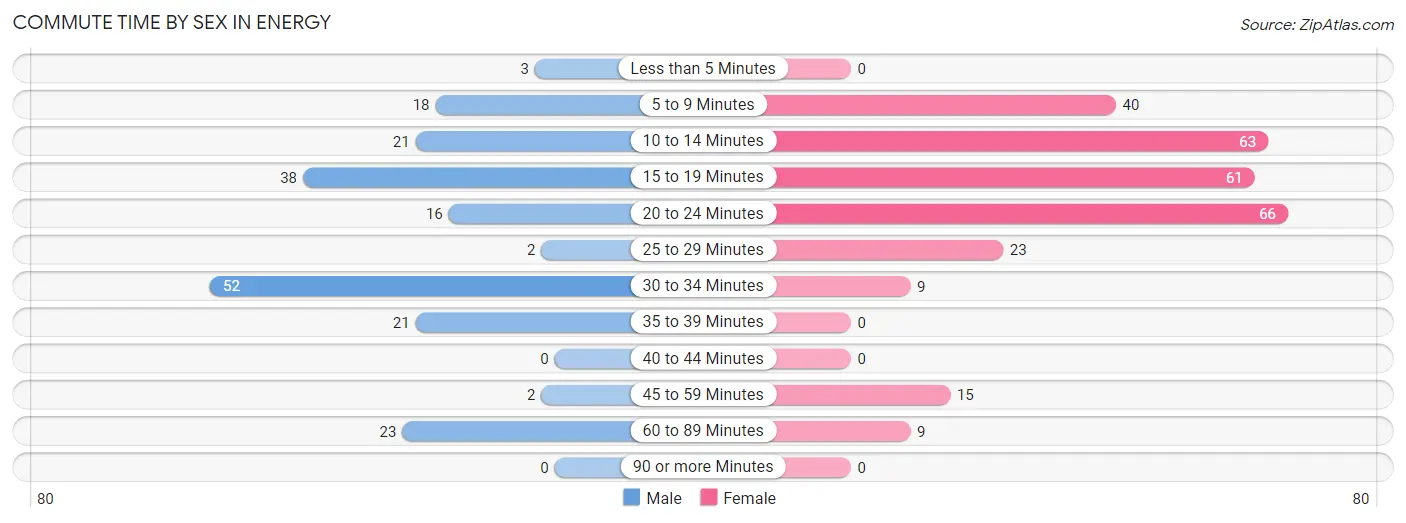
| Commute Time | Male | Female |
| Less than 5 Minutes | 3 (1.5%) | 0 (0.0%) |
| 5 to 9 Minutes | 18 (9.2%) | 40 (14.0%) |
| 10 to 14 Minutes | 21 (10.7%) | 63 (22.0%) |
| 15 to 19 Minutes | 38 (19.4%) | 61 (21.3%) |
| 20 to 24 Minutes | 16 (8.2%) | 66 (23.1%) |
| 25 to 29 Minutes | 2 (1.0%) | 23 (8.0%) |
| 30 to 34 Minutes | 52 (26.5%) | 9 (3.2%) |
| 35 to 39 Minutes | 21 (10.7%) | 0 (0.0%) |
| 40 to 44 Minutes | 0 (0.0%) | 0 (0.0%) |
| 45 to 59 Minutes | 2 (1.0%) | 15 (5.2%) |
| 60 to 89 Minutes | 23 (11.7%) | 9 (3.2%) |
| 90 or more Minutes | 0 (0.0%) | 0 (0.0%) |
Time of Departure to Work by Sex in Energy
The most frequent times of departure to work in Energy are 5:30 AM to 5:59 AM (54, 27.6%) for males and 7:30 AM to 7:59 AM (93, 32.5%) for females.
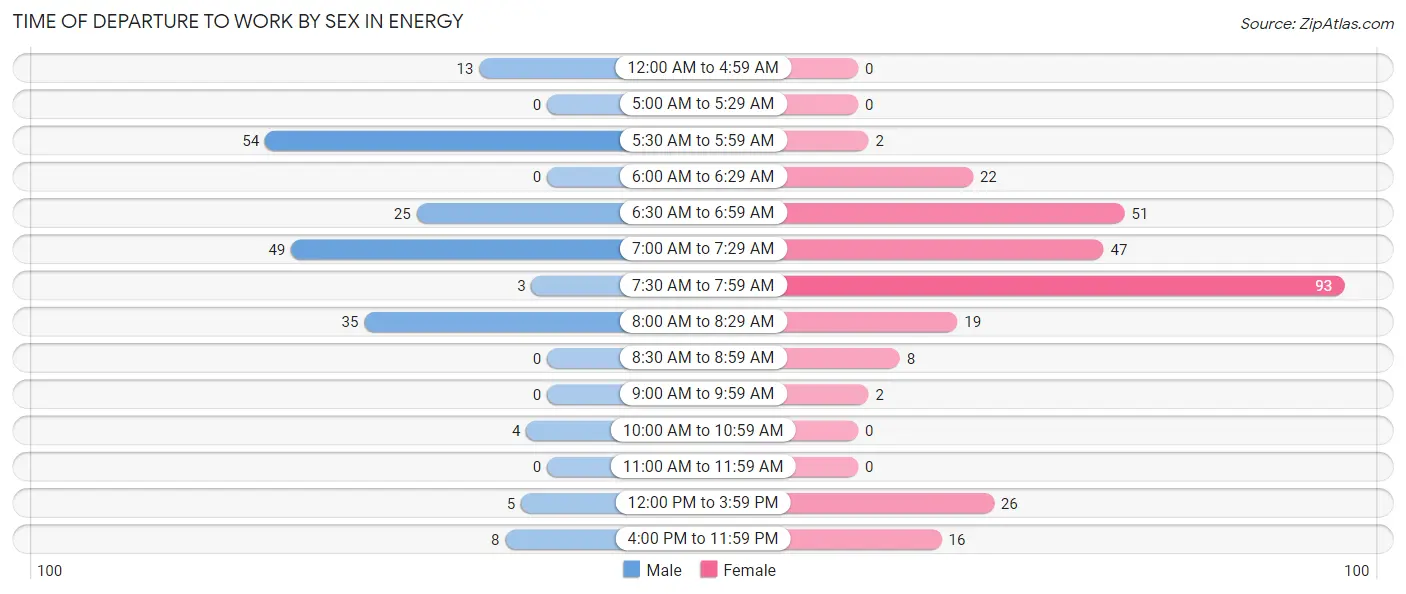
| Time of Departure | Male | Female |
| 12:00 AM to 4:59 AM | 13 (6.6%) | 0 (0.0%) |
| 5:00 AM to 5:29 AM | 0 (0.0%) | 0 (0.0%) |
| 5:30 AM to 5:59 AM | 54 (27.6%) | 2 (0.7%) |
| 6:00 AM to 6:29 AM | 0 (0.0%) | 22 (7.7%) |
| 6:30 AM to 6:59 AM | 25 (12.8%) | 51 (17.8%) |
| 7:00 AM to 7:29 AM | 49 (25.0%) | 47 (16.4%) |
| 7:30 AM to 7:59 AM | 3 (1.5%) | 93 (32.5%) |
| 8:00 AM to 8:29 AM | 35 (17.9%) | 19 (6.6%) |
| 8:30 AM to 8:59 AM | 0 (0.0%) | 8 (2.8%) |
| 9:00 AM to 9:59 AM | 0 (0.0%) | 2 (0.7%) |
| 10:00 AM to 10:59 AM | 4 (2.0%) | 0 (0.0%) |
| 11:00 AM to 11:59 AM | 0 (0.0%) | 0 (0.0%) |
| 12:00 PM to 3:59 PM | 5 (2.5%) | 26 (9.1%) |
| 4:00 PM to 11:59 PM | 8 (4.1%) | 16 (5.6%) |
| Total | 196 (100.0%) | 286 (100.0%) |
Housing Occupancy in Energy
Occupancy by Ownership in Energy
Of the total 533 dwellings in Energy, owner-occupied units account for 394 (73.9%), while renter-occupied units make up 139 (26.1%).
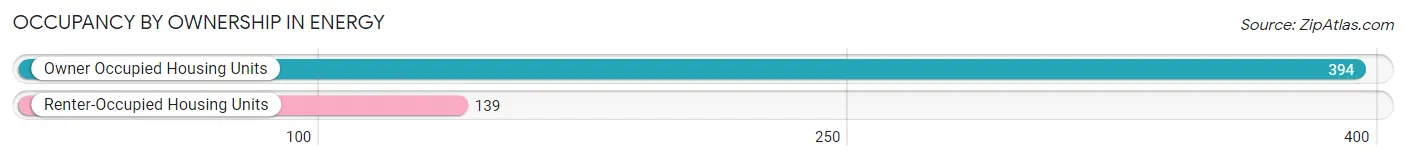
| Occupancy | # Housing Units | % Housing Units |
| Owner Occupied Housing Units | 394 | 73.9% |
| Renter-Occupied Housing Units | 139 | 26.1% |
| Total Occupied Housing Units | 533 | 100.0% |
Occupancy by Household Size in Energy
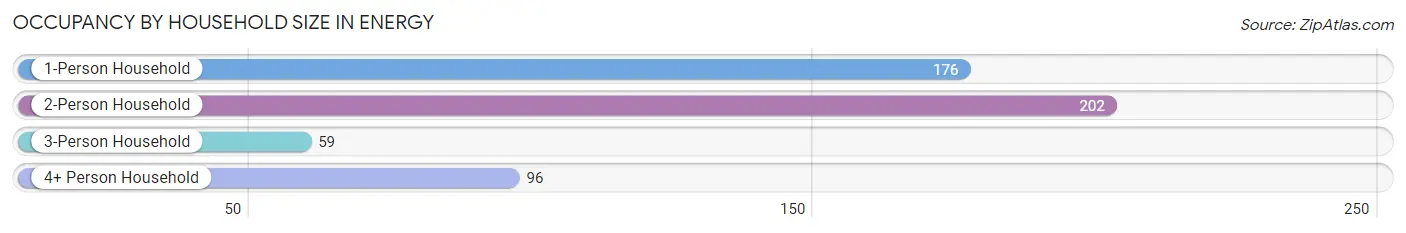
| Household Size | # Housing Units | % Housing Units |
| 1-Person Household | 176 | 33.0% |
| 2-Person Household | 202 | 37.9% |
| 3-Person Household | 59 | 11.1% |
| 4+ Person Household | 96 | 18.0% |
| Total Housing Units | 533 | 100.0% |
Occupancy by Ownership by Household Size in Energy
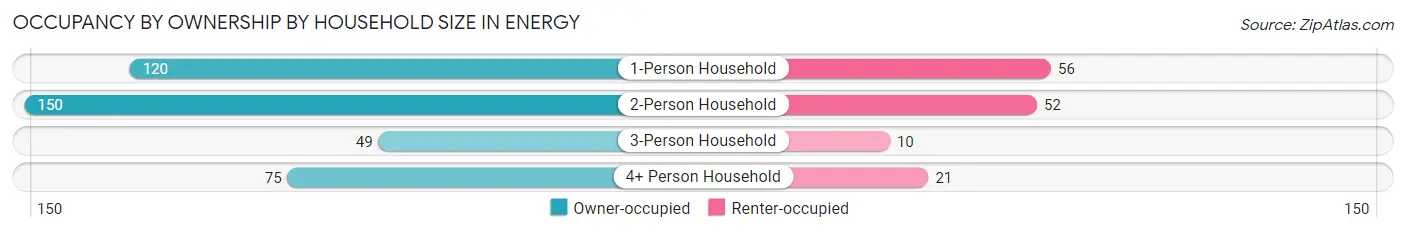
| Household Size | Owner-occupied | Renter-occupied |
| 1-Person Household | 120 (68.2%) | 56 (31.8%) |
| 2-Person Household | 150 (74.3%) | 52 (25.7%) |
| 3-Person Household | 49 (83.1%) | 10 (17.0%) |
| 4+ Person Household | 75 (78.1%) | 21 (21.9%) |
| Total Housing Units | 394 (73.9%) | 139 (26.1%) |
Occupancy by Educational Attainment in Energy
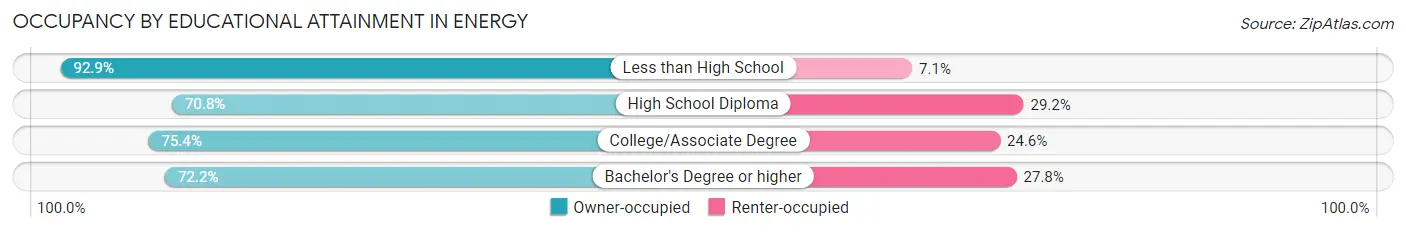
| Household Size | Owner-occupied | Renter-occupied |
| Less than High School | 26 (92.9%) | 2 (7.1%) |
| High School Diploma | 109 (70.8%) | 45 (29.2%) |
| College/Associate Degree | 132 (75.4%) | 43 (24.6%) |
| Bachelor's Degree or higher | 127 (72.2%) | 49 (27.8%) |
Occupancy by Age of Householder in Energy
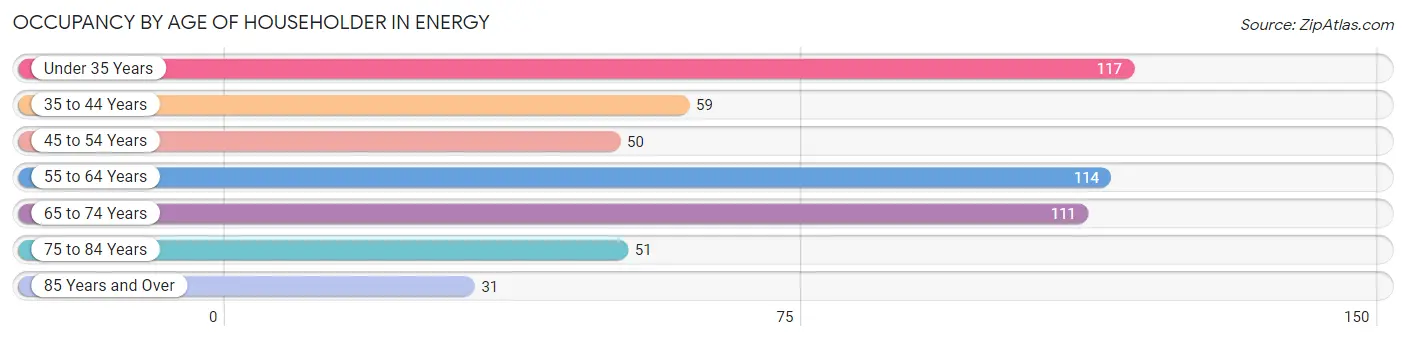
| Age Bracket | # Households | % Households |
| Under 35 Years | 117 | 22.0% |
| 35 to 44 Years | 59 | 11.1% |
| 45 to 54 Years | 50 | 9.4% |
| 55 to 64 Years | 114 | 21.4% |
| 65 to 74 Years | 111 | 20.8% |
| 75 to 84 Years | 51 | 9.6% |
| 85 Years and Over | 31 | 5.8% |
| Total | 533 | 100.0% |
Housing Finances in Energy
Median Income by Occupancy in Energy
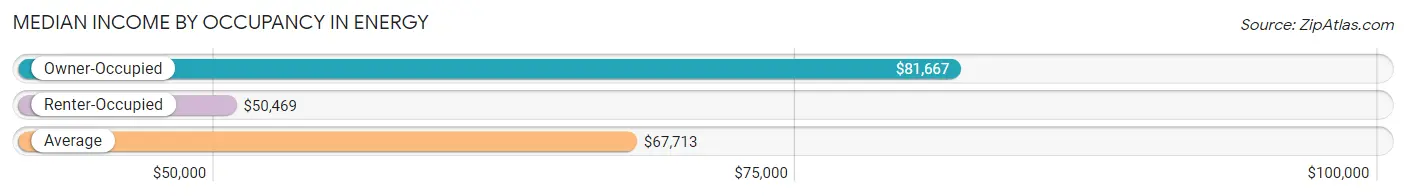
| Occupancy Type | # Households | Median Income |
| Owner-Occupied | 394 (73.9%) | $81,667 |
| Renter-Occupied | 139 (26.1%) | $50,469 |
| Average | 533 (100.0%) | $67,713 |
Occupancy by Householder Income Bracket in Energy
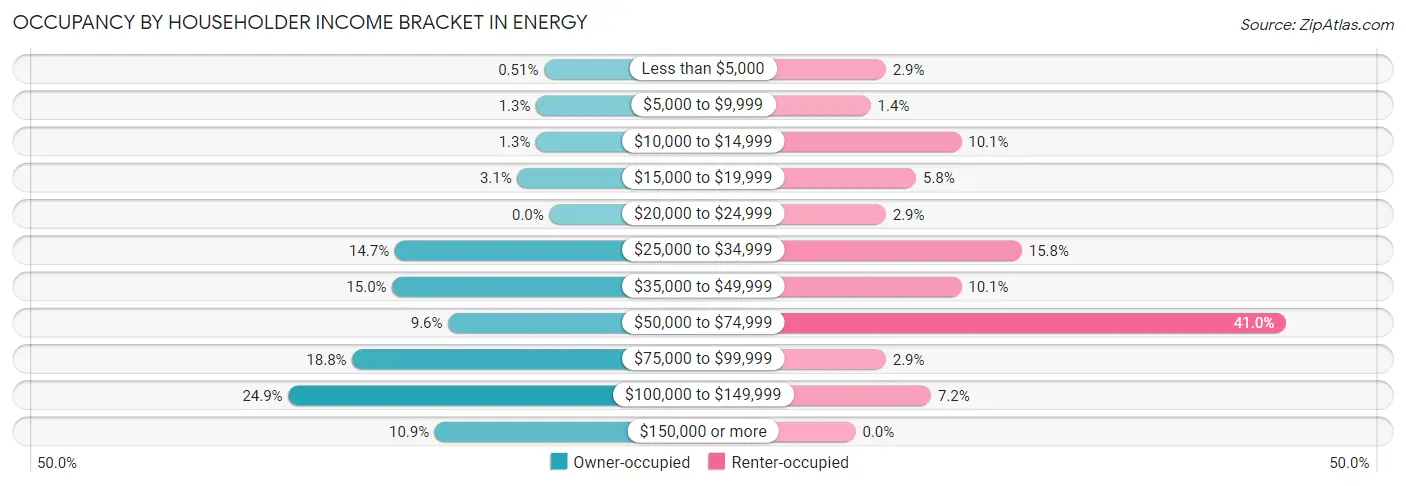
| Income Bracket | Owner-occupied | Renter-occupied |
| Less than $5,000 | 2 (0.5%) | 4 (2.9%) |
| $5,000 to $9,999 | 5 (1.3%) | 2 (1.4%) |
| $10,000 to $14,999 | 5 (1.3%) | 14 (10.1%) |
| $15,000 to $19,999 | 12 (3.0%) | 8 (5.8%) |
| $20,000 to $24,999 | 0 (0.0%) | 4 (2.9%) |
| $25,000 to $34,999 | 58 (14.7%) | 22 (15.8%) |
| $35,000 to $49,999 | 59 (15.0%) | 14 (10.1%) |
| $50,000 to $74,999 | 38 (9.6%) | 57 (41.0%) |
| $75,000 to $99,999 | 74 (18.8%) | 4 (2.9%) |
| $100,000 to $149,999 | 98 (24.9%) | 10 (7.2%) |
| $150,000 or more | 43 (10.9%) | 0 (0.0%) |
| Total | 394 (100.0%) | 139 (100.0%) |
Monthly Housing Cost Tiers in Energy
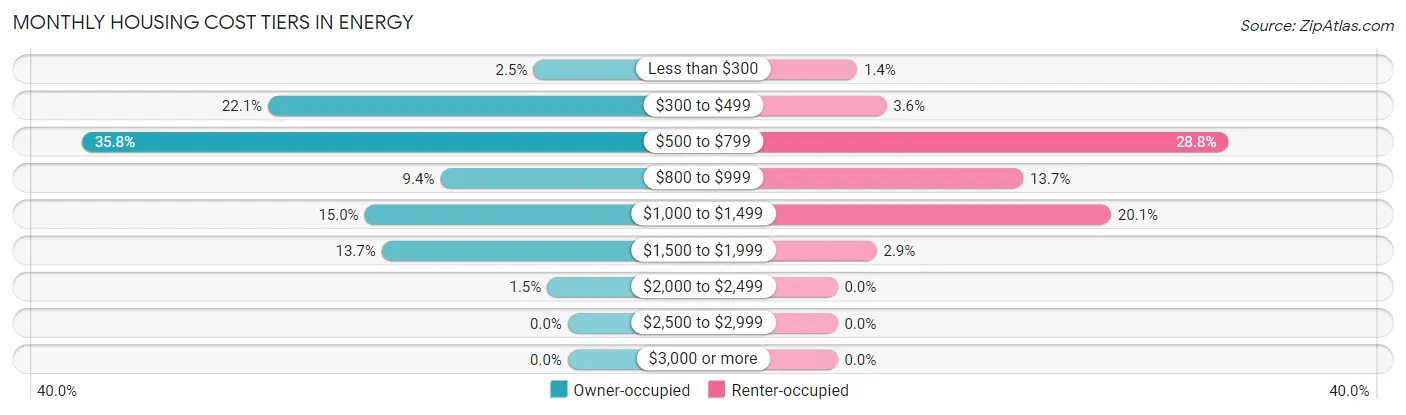
| Monthly Cost | Owner-occupied | Renter-occupied |
| Less than $300 | 10 (2.5%) | 2 (1.4%) |
| $300 to $499 | 87 (22.1%) | 5 (3.6%) |
| $500 to $799 | 141 (35.8%) | 40 (28.8%) |
| $800 to $999 | 37 (9.4%) | 19 (13.7%) |
| $1,000 to $1,499 | 59 (15.0%) | 28 (20.1%) |
| $1,500 to $1,999 | 54 (13.7%) | 4 (2.9%) |
| $2,000 to $2,499 | 6 (1.5%) | 0 (0.0%) |
| $2,500 to $2,999 | 0 (0.0%) | 0 (0.0%) |
| $3,000 or more | 0 (0.0%) | 0 (0.0%) |
| Total | 394 (100.0%) | 139 (100.0%) |
Physical Housing Characteristics in Energy
Housing Structures in Energy
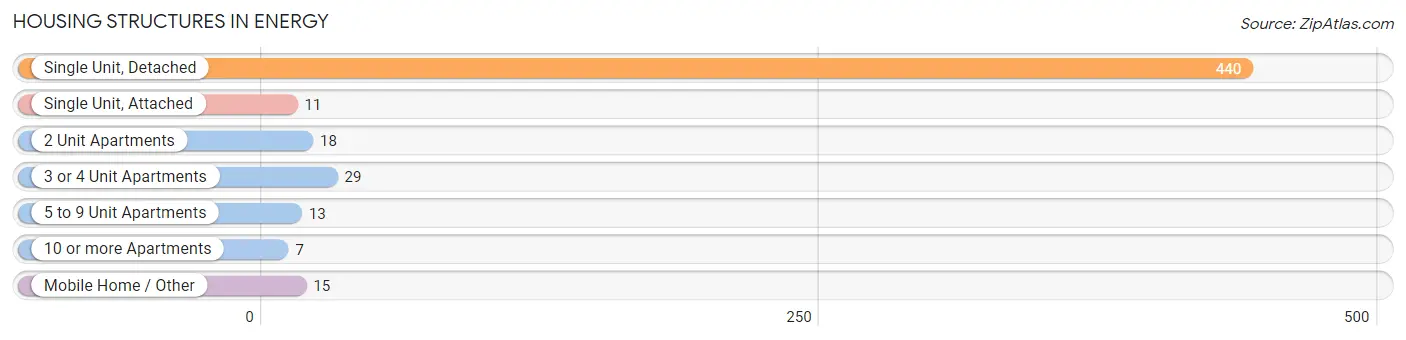
| Structure Type | # Housing Units | % Housing Units |
| Single Unit, Detached | 440 | 82.6% |
| Single Unit, Attached | 11 | 2.1% |
| 2 Unit Apartments | 18 | 3.4% |
| 3 or 4 Unit Apartments | 29 | 5.4% |
| 5 to 9 Unit Apartments | 13 | 2.4% |
| 10 or more Apartments | 7 | 1.3% |
| Mobile Home / Other | 15 | 2.8% |
| Total | 533 | 100.0% |
Housing Structures by Occupancy in Energy
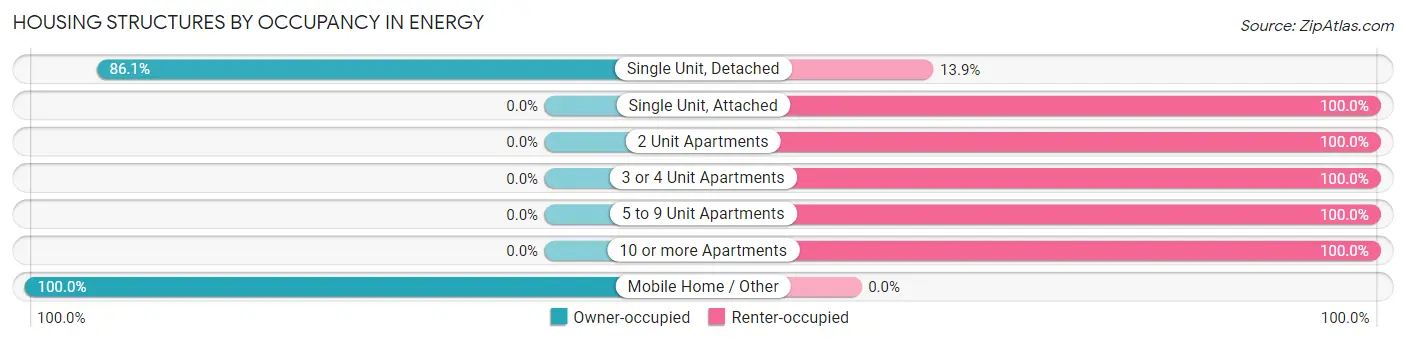
| Structure Type | Owner-occupied | Renter-occupied |
| Single Unit, Detached | 379 (86.1%) | 61 (13.9%) |
| Single Unit, Attached | 0 (0.0%) | 11 (100.0%) |
| 2 Unit Apartments | 0 (0.0%) | 18 (100.0%) |
| 3 or 4 Unit Apartments | 0 (0.0%) | 29 (100.0%) |
| 5 to 9 Unit Apartments | 0 (0.0%) | 13 (100.0%) |
| 10 or more Apartments | 0 (0.0%) | 7 (100.0%) |
| Mobile Home / Other | 15 (100.0%) | 0 (0.0%) |
| Total | 394 (73.9%) | 139 (26.1%) |
Housing Structures by Number of Rooms in Energy
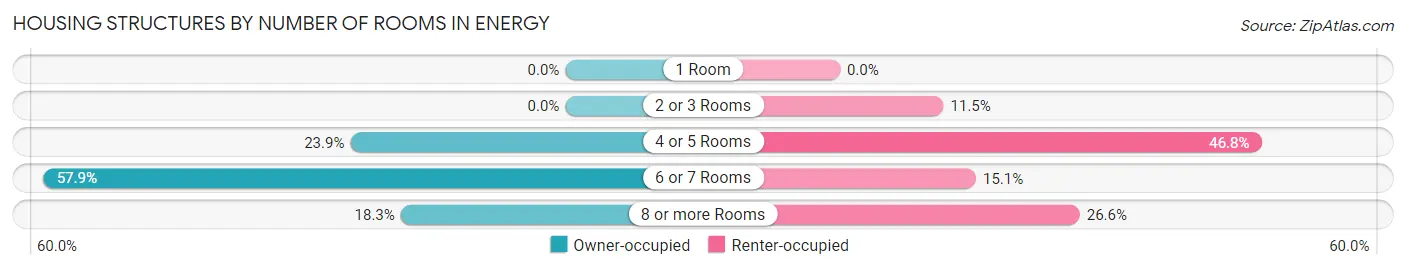
| Number of Rooms | Owner-occupied | Renter-occupied |
| 1 Room | 0 (0.0%) | 0 (0.0%) |
| 2 or 3 Rooms | 0 (0.0%) | 16 (11.5%) |
| 4 or 5 Rooms | 94 (23.9%) | 65 (46.8%) |
| 6 or 7 Rooms | 228 (57.9%) | 21 (15.1%) |
| 8 or more Rooms | 72 (18.3%) | 37 (26.6%) |
| Total | 394 (100.0%) | 139 (100.0%) |
Housing Structure by Heating Type in Energy
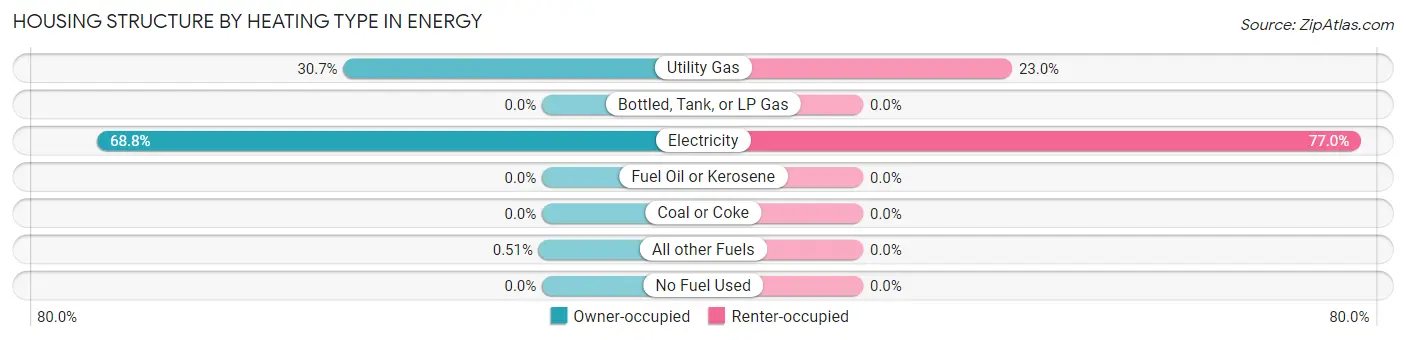
| Heating Type | Owner-occupied | Renter-occupied |
| Utility Gas | 121 (30.7%) | 32 (23.0%) |
| Bottled, Tank, or LP Gas | 0 (0.0%) | 0 (0.0%) |
| Electricity | 271 (68.8%) | 107 (77.0%) |
| Fuel Oil or Kerosene | 0 (0.0%) | 0 (0.0%) |
| Coal or Coke | 0 (0.0%) | 0 (0.0%) |
| All other Fuels | 2 (0.5%) | 0 (0.0%) |
| No Fuel Used | 0 (0.0%) | 0 (0.0%) |
| Total | 394 (100.0%) | 139 (100.0%) |
Household Vehicle Usage in Energy
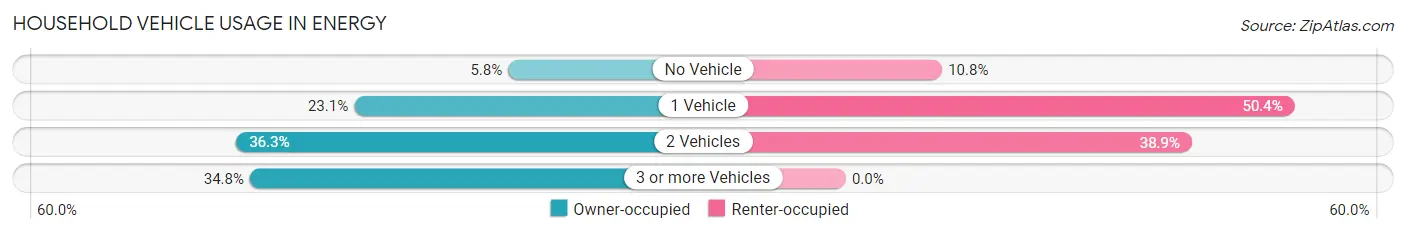
| Vehicles per Household | Owner-occupied | Renter-occupied |
| No Vehicle | 23 (5.8%) | 15 (10.8%) |
| 1 Vehicle | 91 (23.1%) | 70 (50.4%) |
| 2 Vehicles | 143 (36.3%) | 54 (38.9%) |
| 3 or more Vehicles | 137 (34.8%) | 0 (0.0%) |
| Total | 394 (100.0%) | 139 (100.0%) |
Real Estate & Mortgages in Energy
Real Estate and Mortgage Overview in Energy
| Characteristic | Without Mortgage | With Mortgage |
| Housing Units | 220 | 174 |
| Median Property Value | $122,000 | $147,900 |
| Median Household Income | $56,667 | $15 |
| Monthly Housing Costs | $539 | $0 |
| Real Estate Taxes | $1,667 | $4 |
Property Value by Mortgage Status in Energy
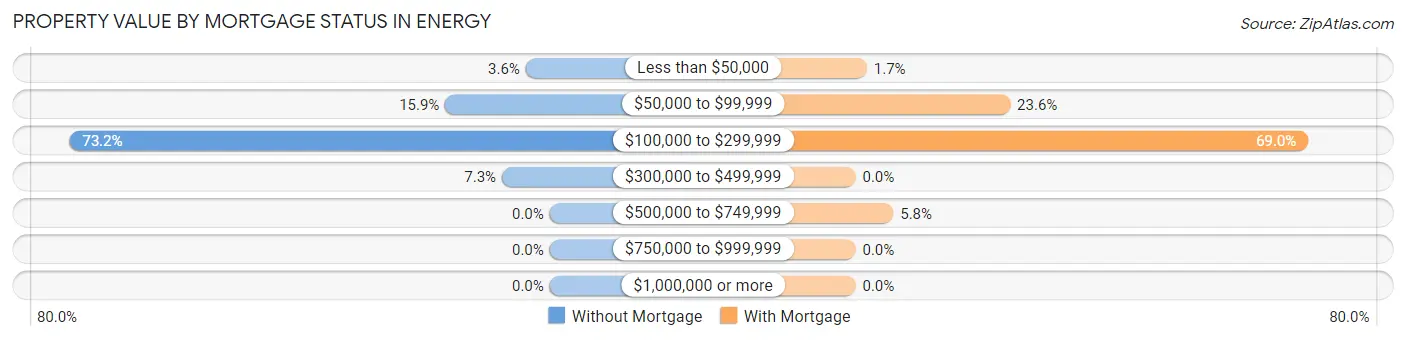
| Property Value | Without Mortgage | With Mortgage |
| Less than $50,000 | 8 (3.6%) | 3 (1.7%) |
| $50,000 to $99,999 | 35 (15.9%) | 41 (23.6%) |
| $100,000 to $299,999 | 161 (73.2%) | 120 (69.0%) |
| $300,000 to $499,999 | 16 (7.3%) | 0 (0.0%) |
| $500,000 to $749,999 | 0 (0.0%) | 10 (5.8%) |
| $750,000 to $999,999 | 0 (0.0%) | 0 (0.0%) |
| $1,000,000 or more | 0 (0.0%) | 0 (0.0%) |
| Total | 220 (100.0%) | 174 (100.0%) |
Household Income by Mortgage Status in Energy
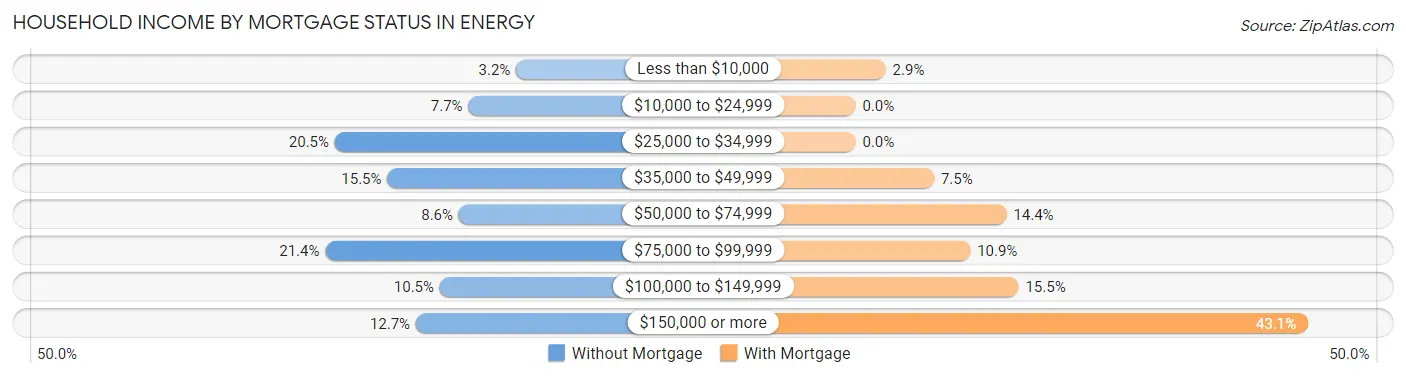
| Household Income | Without Mortgage | With Mortgage |
| Less than $10,000 | 7 (3.2%) | 5 (2.9%) |
| $10,000 to $24,999 | 17 (7.7%) | 0 (0.0%) |
| $25,000 to $34,999 | 45 (20.4%) | 0 (0.0%) |
| $35,000 to $49,999 | 34 (15.4%) | 13 (7.5%) |
| $50,000 to $74,999 | 19 (8.6%) | 25 (14.4%) |
| $75,000 to $99,999 | 47 (21.4%) | 19 (10.9%) |
| $100,000 to $149,999 | 23 (10.4%) | 27 (15.5%) |
| $150,000 or more | 28 (12.7%) | 75 (43.1%) |
| Total | 220 (100.0%) | 174 (100.0%) |
Property Value to Household Income Ratio in Energy
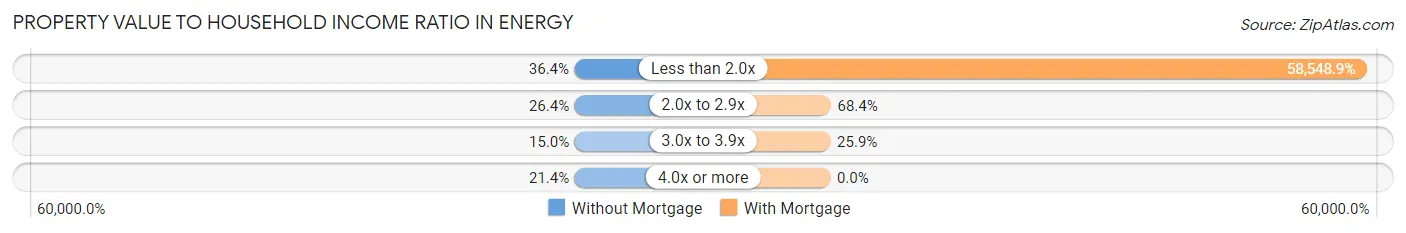
| Value-to-Income Ratio | Without Mortgage | With Mortgage |
| Less than 2.0x | 80 (36.4%) | 101,875 (58,548.9%) |
| 2.0x to 2.9x | 58 (26.4%) | 119 (68.4%) |
| 3.0x to 3.9x | 33 (15.0%) | 45 (25.9%) |
| 4.0x or more | 47 (21.4%) | 0 (0.0%) |
| Total | 220 (100.0%) | 174 (100.0%) |
Real Estate Taxes by Mortgage Status in Energy
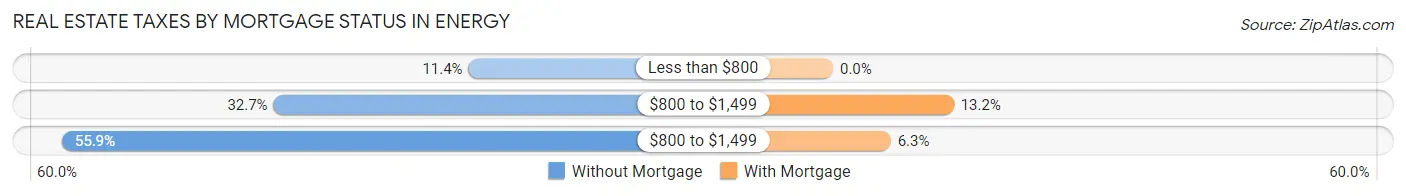
| Property Taxes | Without Mortgage | With Mortgage |
| Less than $800 | 25 (11.4%) | 0 (0.0%) |
| $800 to $1,499 | 72 (32.7%) | 23 (13.2%) |
| $800 to $1,499 | 123 (55.9%) | 11 (6.3%) |
| Total | 220 (100.0%) | 174 (100.0%) |
Health & Disability in Energy
Health Insurance Coverage by Age in Energy
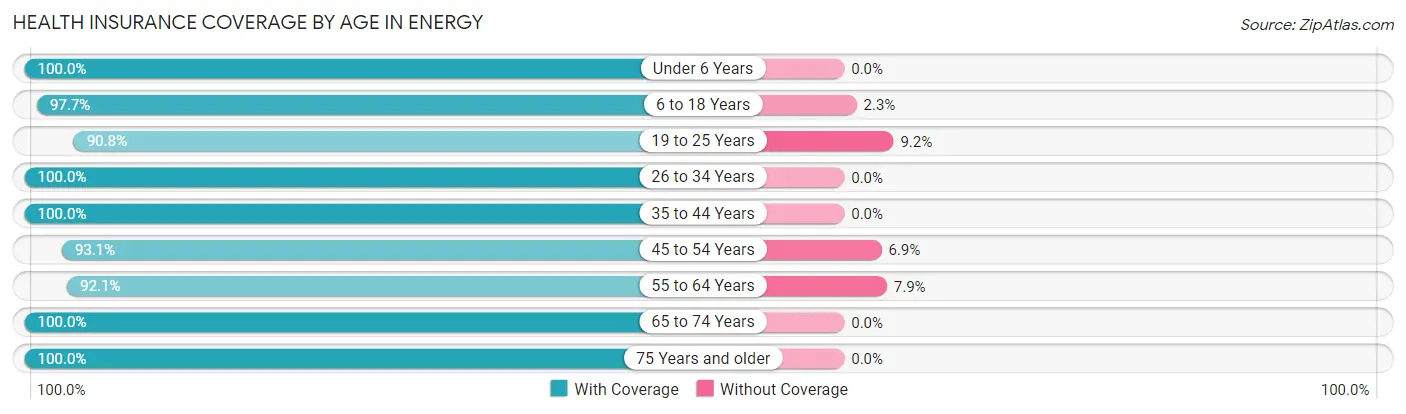
| Age Bracket | With Coverage | Without Coverage |
| Under 6 Years | 104 (100.0%) | 0 (0.0%) |
| 6 to 18 Years | 212 (97.7%) | 5 (2.3%) |
| 19 to 25 Years | 99 (90.8%) | 10 (9.2%) |
| 26 to 34 Years | 103 (100.0%) | 0 (0.0%) |
| 35 to 44 Years | 97 (100.0%) | 0 (0.0%) |
| 45 to 54 Years | 67 (93.1%) | 5 (6.9%) |
| 55 to 64 Years | 174 (92.1%) | 15 (7.9%) |
| 65 to 74 Years | 195 (100.0%) | 0 (0.0%) |
| 75 Years and older | 107 (100.0%) | 0 (0.0%) |
| Total | 1,158 (97.1%) | 35 (2.9%) |
Health Insurance Coverage by Citizenship Status in Energy
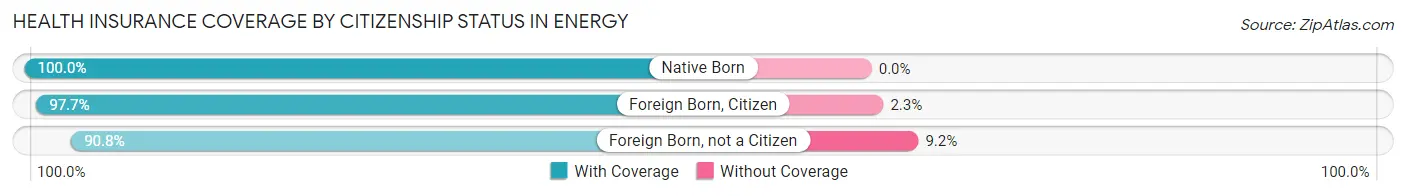
| Citizenship Status | With Coverage | Without Coverage |
| Native Born | 104 (100.0%) | 0 (0.0%) |
| Foreign Born, Citizen | 212 (97.7%) | 5 (2.3%) |
| Foreign Born, not a Citizen | 99 (90.8%) | 10 (9.2%) |
Health Insurance Coverage by Household Income in Energy
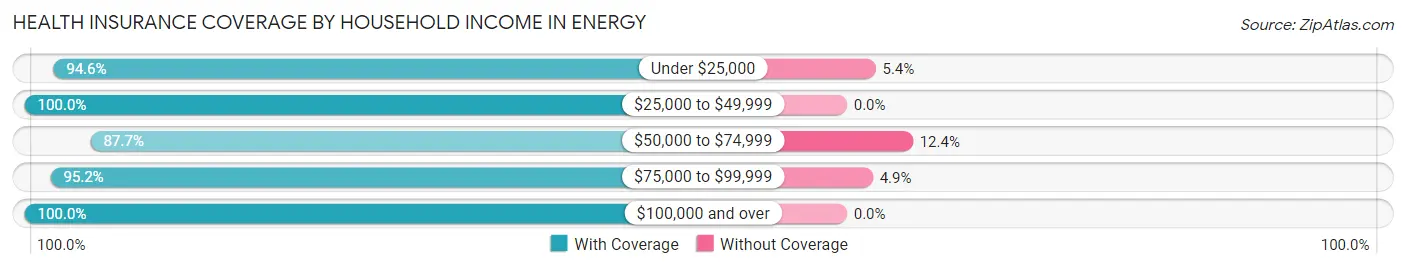
| Household Income | With Coverage | Without Coverage |
| Under $25,000 | 88 (94.6%) | 5 (5.4%) |
| $25,000 to $49,999 | 341 (100.0%) | 0 (0.0%) |
| $50,000 to $74,999 | 142 (87.6%) | 20 (12.3%) |
| $75,000 to $99,999 | 196 (95.2%) | 10 (4.9%) |
| $100,000 and over | 387 (100.0%) | 0 (0.0%) |
Public vs Private Health Insurance Coverage by Age in Energy
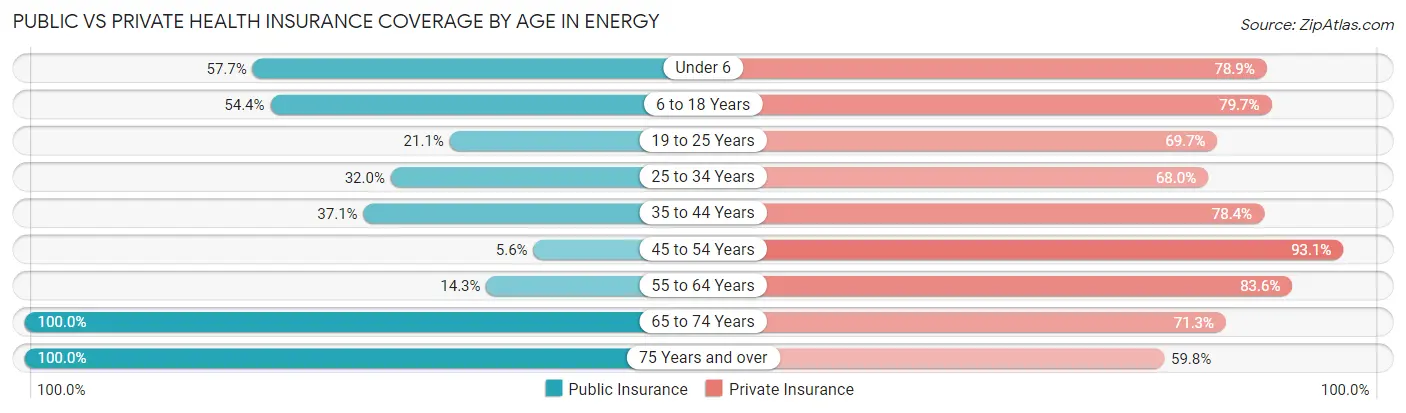
| Age Bracket | Public Insurance | Private Insurance |
| Under 6 | 60 (57.7%) | 82 (78.8%) |
| 6 to 18 Years | 118 (54.4%) | 173 (79.7%) |
| 19 to 25 Years | 23 (21.1%) | 76 (69.7%) |
| 25 to 34 Years | 33 (32.0%) | 70 (68.0%) |
| 35 to 44 Years | 36 (37.1%) | 76 (78.3%) |
| 45 to 54 Years | 4 (5.6%) | 67 (93.1%) |
| 55 to 64 Years | 27 (14.3%) | 158 (83.6%) |
| 65 to 74 Years | 195 (100.0%) | 139 (71.3%) |
| 75 Years and over | 107 (100.0%) | 64 (59.8%) |
| Total | 603 (50.5%) | 905 (75.9%) |
Disability Status by Sex by Age in Energy
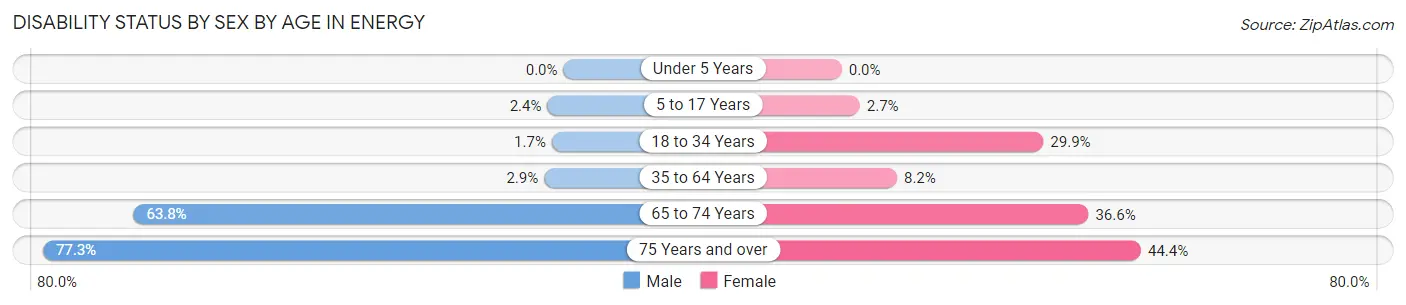
| Age Bracket | Male | Female |
| Under 5 Years | 0 (0.0%) | 0 (0.0%) |
| 5 to 17 Years | 2 (2.4%) | 4 (2.7%) |
| 18 to 34 Years | 1 (1.7%) | 47 (29.9%) |
| 35 to 64 Years | 5 (2.9%) | 15 (8.2%) |
| 65 to 74 Years | 60 (63.8%) | 37 (36.6%) |
| 75 Years and over | 34 (77.3%) | 28 (44.4%) |
Disability Class by Sex by Age in Energy
Disability Class: Hearing Difficulty
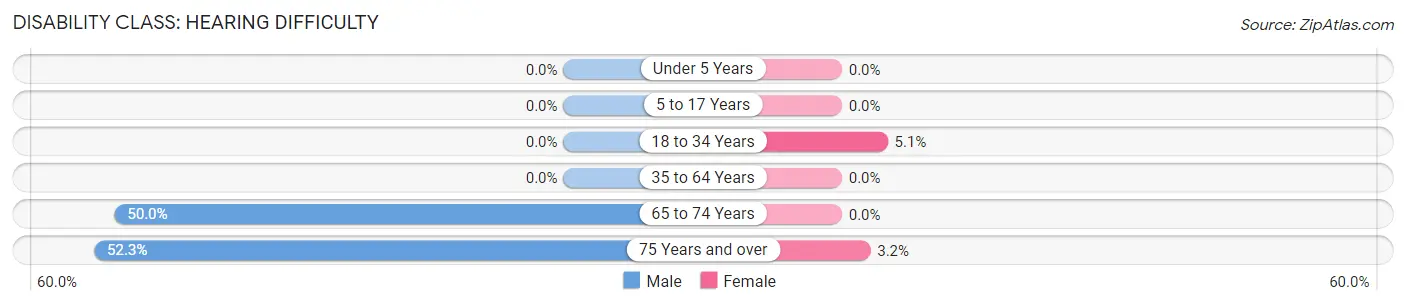
| Age Bracket | Male | Female |
| Under 5 Years | 0 (0.0%) | 0 (0.0%) |
| 5 to 17 Years | 0 (0.0%) | 0 (0.0%) |
| 18 to 34 Years | 0 (0.0%) | 8 (5.1%) |
| 35 to 64 Years | 0 (0.0%) | 0 (0.0%) |
| 65 to 74 Years | 47 (50.0%) | 0 (0.0%) |
| 75 Years and over | 23 (52.3%) | 2 (3.2%) |
Disability Class: Vision Difficulty
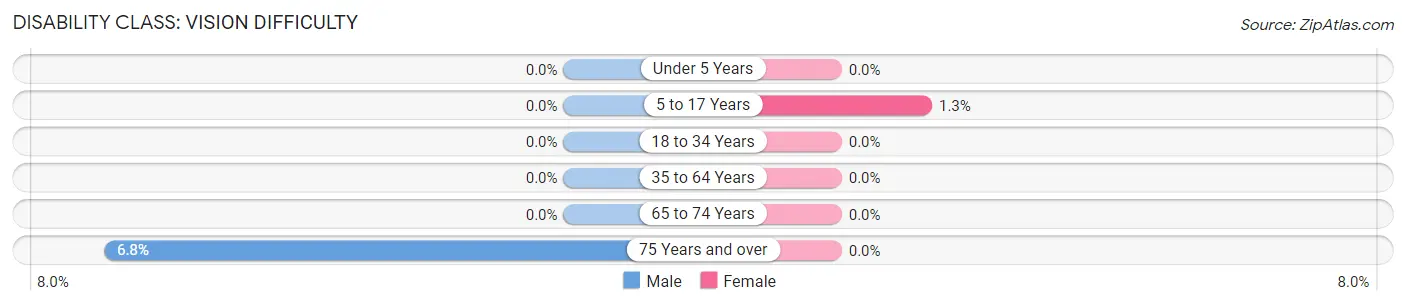
| Age Bracket | Male | Female |
| Under 5 Years | 0 (0.0%) | 0 (0.0%) |
| 5 to 17 Years | 0 (0.0%) | 2 (1.3%) |
| 18 to 34 Years | 0 (0.0%) | 0 (0.0%) |
| 35 to 64 Years | 0 (0.0%) | 0 (0.0%) |
| 65 to 74 Years | 0 (0.0%) | 0 (0.0%) |
| 75 Years and over | 3 (6.8%) | 0 (0.0%) |
Disability Class: Cognitive Difficulty
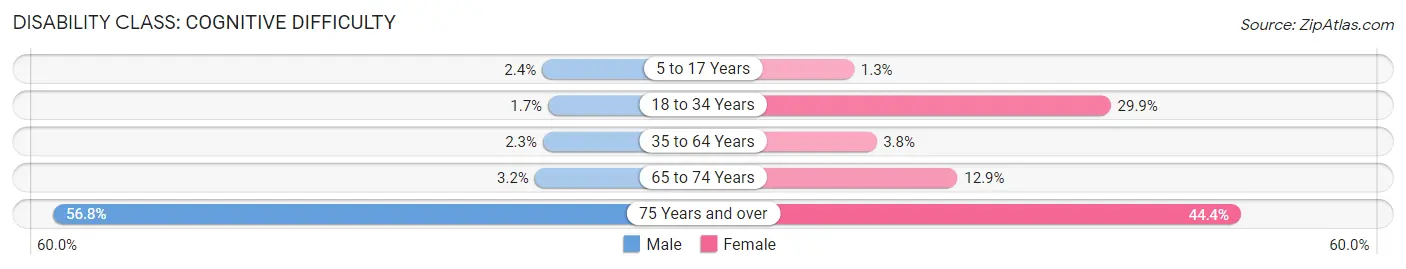
| Age Bracket | Male | Female |
| 5 to 17 Years | 2 (2.4%) | 2 (1.3%) |
| 18 to 34 Years | 1 (1.7%) | 47 (29.9%) |
| 35 to 64 Years | 4 (2.3%) | 7 (3.8%) |
| 65 to 74 Years | 3 (3.2%) | 13 (12.9%) |
| 75 Years and over | 25 (56.8%) | 28 (44.4%) |
Disability Class: Ambulatory Difficulty
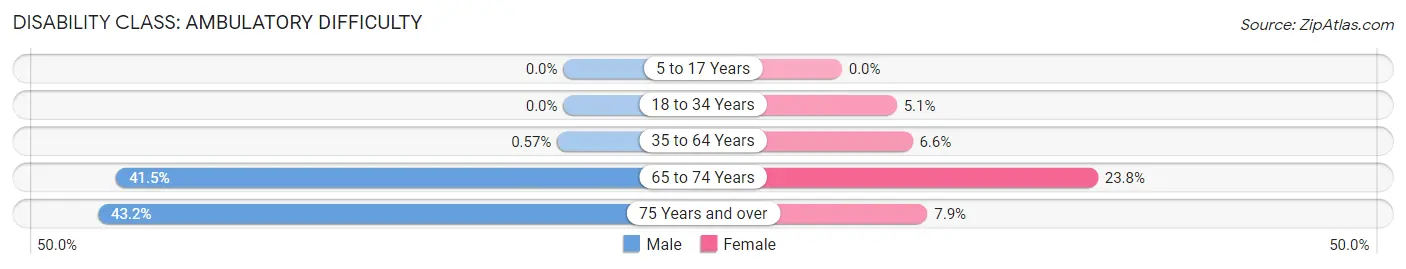
| Age Bracket | Male | Female |
| 5 to 17 Years | 0 (0.0%) | 0 (0.0%) |
| 18 to 34 Years | 0 (0.0%) | 8 (5.1%) |
| 35 to 64 Years | 1 (0.6%) | 12 (6.6%) |
| 65 to 74 Years | 39 (41.5%) | 24 (23.8%) |
| 75 Years and over | 19 (43.2%) | 5 (7.9%) |
Disability Class: Self-Care Difficulty
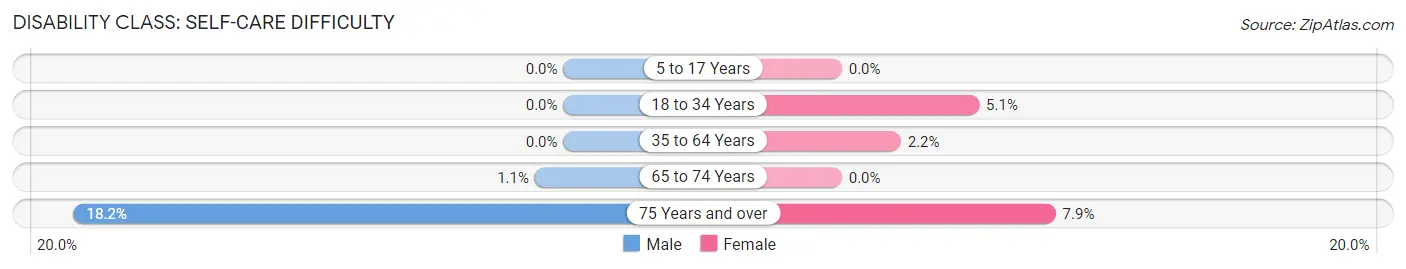
| Age Bracket | Male | Female |
| 5 to 17 Years | 0 (0.0%) | 0 (0.0%) |
| 18 to 34 Years | 0 (0.0%) | 8 (5.1%) |
| 35 to 64 Years | 0 (0.0%) | 4 (2.2%) |
| 65 to 74 Years | 1 (1.1%) | 0 (0.0%) |
| 75 Years and over | 8 (18.2%) | 5 (7.9%) |
Technology Access in Energy
Computing Device Access in Energy
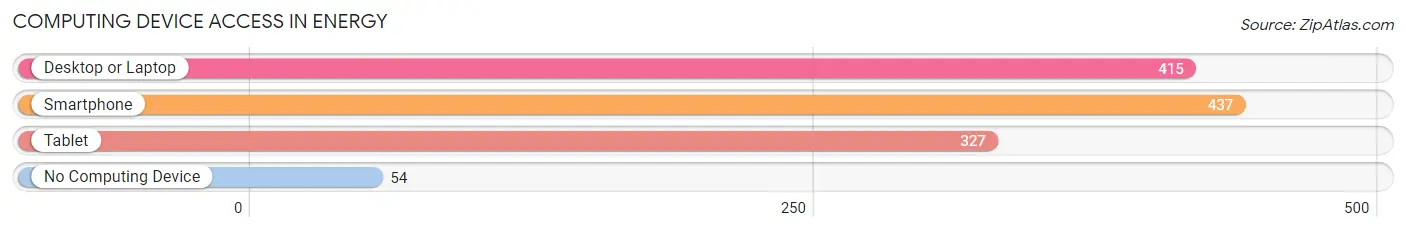
| Device Type | # Households | % Households |
| Desktop or Laptop | 415 | 77.9% |
| Smartphone | 437 | 82.0% |
| Tablet | 327 | 61.4% |
| No Computing Device | 54 | 10.1% |
| Total | 533 | 100.0% |
Internet Access in Energy
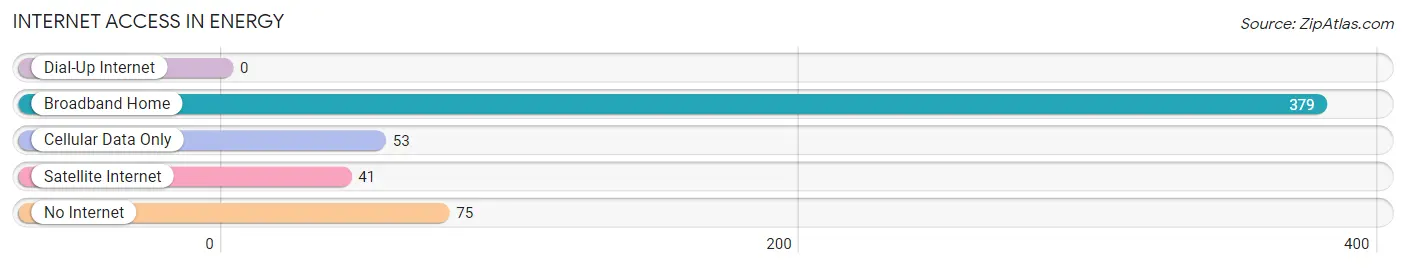
| Internet Type | # Households | % Households |
| Dial-Up Internet | 0 | 0.0% |
| Broadband Home | 379 | 71.1% |
| Cellular Data Only | 53 | 9.9% |
| Satellite Internet | 41 | 7.7% |
| No Internet | 75 | 14.1% |
| Total | 533 | 100.0% |
Energy Summary
Energy
Illinois is a major energy producer and consumer. The state is home to a variety of energy sources, including coal, natural gas, nuclear, and renewable energy. Coal is the primary source of electricity in the state, accounting for nearly half of the electricity generated in Illinois in 2018. Natural gas is the second largest source of electricity, accounting for about a third of the state’s electricity generation. Nuclear power is the third largest source of electricity in the state, accounting for about 15 percent of the state’s electricity generation. Renewable energy sources, such as wind and solar, account for a small but growing share of the state’s electricity generation.
Illinois is also a major consumer of energy. In 2018, the state consumed more than 100 million megawatt-hours of electricity, making it the fifth largest consumer of electricity in the United States. The majority of the electricity consumed in the state is used for residential and commercial purposes. The industrial sector is the second largest consumer of electricity in the state, accounting for about a quarter of the state’s electricity consumption.
History
Illinois has a long and rich history. The first inhabitants of the area were Native American tribes, including the Illiniwek, Miami, and Potawatomi. The first Europeans to explore the area were French explorers, who arrived in the late 1600s. The French established trading posts and settlements in the area, and the region eventually became part of the French colony of New France.
In 1763, the area became part of the British Empire after the French and Indian War. The British divided the area into two colonies, the Province of Quebec and the Province of Illinois. The area was ceded to the United States in 1783 after the American Revolution.
In 1818, Illinois became the 21st state in the Union. The state’s economy was largely based on agriculture, and the state quickly became a major producer of corn, wheat, and other grains. The state also became a major producer of coal, and the coal industry was a major source of employment for many residents.
In the late 19th century, the state’s economy shifted from agriculture to manufacturing. The state became a major producer of steel, automobiles, and other manufactured goods. The state also became a major transportation hub, with the construction of the Illinois and Michigan Canal and the Chicago and Northwestern Railroad.
Geography
Illinois is located in the Midwest region of the United States. It is bordered by Wisconsin to the north, Iowa to the west, Missouri to the south, and Indiana to the east. The state is divided into four distinct geographic regions: the Central Plains, the Great Lakes Plain, the Mississippi River Valley, and the Ozark Plateau.
The Central Plains region is located in the northern part of the state and is characterized by rolling hills and prairies. The Great Lakes Plain is located in the northeastern part of the state and is characterized by flat terrain and numerous lakes and rivers. The Mississippi River Valley is located in the western part of the state and is characterized by flat terrain and numerous rivers and streams. The Ozark Plateau is located in the southern part of the state and is characterized by rugged terrain and numerous caves and springs.
Economy
Illinois has a diverse and vibrant economy. The state’s economy is largely based on manufacturing, finance, and services. The state is home to several major corporations, including Boeing, Caterpillar, and Motorola. The state is also home to several major universities, including the University of Illinois at Urbana-Champaign and Northwestern University.
The state’s economy is also supported by agriculture. The state is a major producer of corn, soybeans, and other grains. The state is also a major producer of livestock, including cattle, hogs, and poultry.
Demographics
As of 2019, the population of Illinois was 12.7 million. The state is home to a diverse population, with the largest ethnic groups being White (77.2%), Black or African American (14.7%), Hispanic or Latino (7.2%), and Asian (4.9%). The state’s population is also diverse in terms of religion, with the largest religious groups being Catholic (27.2%), Protestant (25.2%), and Other (7.2%).
The median household income in the state is $62,992, and the median home value is $203,400. The state’s unemployment rate is 4.2%, and the poverty rate is 11.3%. The state’s largest cities are Chicago, Aurora, Rockford, Joliet, and Naperville.
Common Questions
What is Per Capita Income in Energy?
Per Capita income in Energy is $32,340.
What is the Median Family Income in Energy?
Median Family Income in Energy is $83,750.
What is the Median Household income in Energy?
Median Household Income in Energy is $67,713.
What is Income or Wage Gap in Energy?
Income or Wage Gap in Energy is 27.3%.
Women in Energy earn 72.7 cents for every dollar earned by a man.
What is Inequality or Gini Index in Energy?
Inequality or Gini Index in Energy is 0.36.
What is the Total Population of Energy?
Total Population of Energy is 1,227.
What is the Total Male Population of Energy?
Total Male Population of Energy is 497.
What is the Total Female Population of Energy?
Total Female Population of Energy is 730.
What is the Ratio of Males per 100 Females in Energy?
There are 68.08 Males per 100 Females in Energy.
What is the Ratio of Females per 100 Males in Energy?
There are 146.88 Females per 100 Males in Energy.
What is the Median Population Age in Energy?
Median Population Age in Energy is 43.7 Years.
What is the Average Family Size in Energy
Average Family Size in Energy is 3.0 People.
What is the Average Household Size in Energy
Average Household Size in Energy is 2.2 People.
How Large is the Labor Force in Energy?
There are 556 People in the Labor Forcein in Energy.
What is the Percentage of People in the Labor Force in Energy?
59.0% of People are in the Labor Force in Energy.
What is the Unemployment Rate in Energy?
Unemployment Rate in Energy is 5.6%.