Du Quoin, IL Map & Demographics
Du Quoin Map
Du Quoin Overview
$27,376
PER CAPITA INCOME
$54,626
AVG FAMILY INCOME
$48,770
AVG HOUSEHOLD INCOME
11.1%
WAGE / INCOME GAP [ % ]
88.9¢/ $1
WAGE / INCOME GAP [ $ ]
$9,058
FAMILY INCOME DEFICIT
0.47
INEQUALITY / GINI INDEX
5,822
TOTAL POPULATION
2,882
MALE POPULATION
2,940
FEMALE POPULATION
98.03
MALES / 100 FEMALES
102.01
FEMALES / 100 MALES
43.4
MEDIAN AGE
2.9
AVG FAMILY SIZE
2.2
AVG HOUSEHOLD SIZE
2,171
LABOR FORCE [ PEOPLE ]
44.6%
PERCENT IN LABOR FORCE
11.6%
UNEMPLOYMENT RATE
Du Quoin Zip Codes
Du Quoin Area Codes
Income in Du Quoin
Income Overview in Du Quoin
Per Capita Income in Du Quoin is $27,376, while median incomes of families and households are $54,626 and $48,770 respectively.
| Characteristic | Number | Measure |
| Per Capita Income | 5,822 | $27,376 |
| Median Family Income | 1,550 | $54,626 |
| Mean Family Income | 1,550 | $76,145 |
| Median Household Income | 2,532 | $48,770 |
| Mean Household Income | 2,532 | $60,784 |
| Income Deficit | 1,550 | $9,058 |
| Wage / Income Gap (%) | 5,822 | 11.14% |
| Wage / Income Gap ($) | 5,822 | 88.86¢ per $1 |
| Gini / Inequality Index | 5,822 | 0.47 |
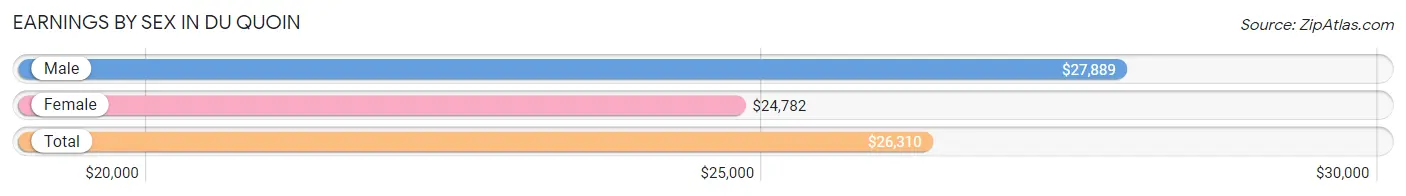
Earnings by Sex in Du Quoin
Average Earnings in Du Quoin are $26,310, $27,889 for men and $24,782 for women, a difference of 11.1%.
| Sex | Number | Average Earnings |
| Male | 1,354 (57.4%) | $27,889 |
| Female | 1,006 (42.6%) | $24,782 |
| Total | 2,360 (100.0%) | $26,310 |
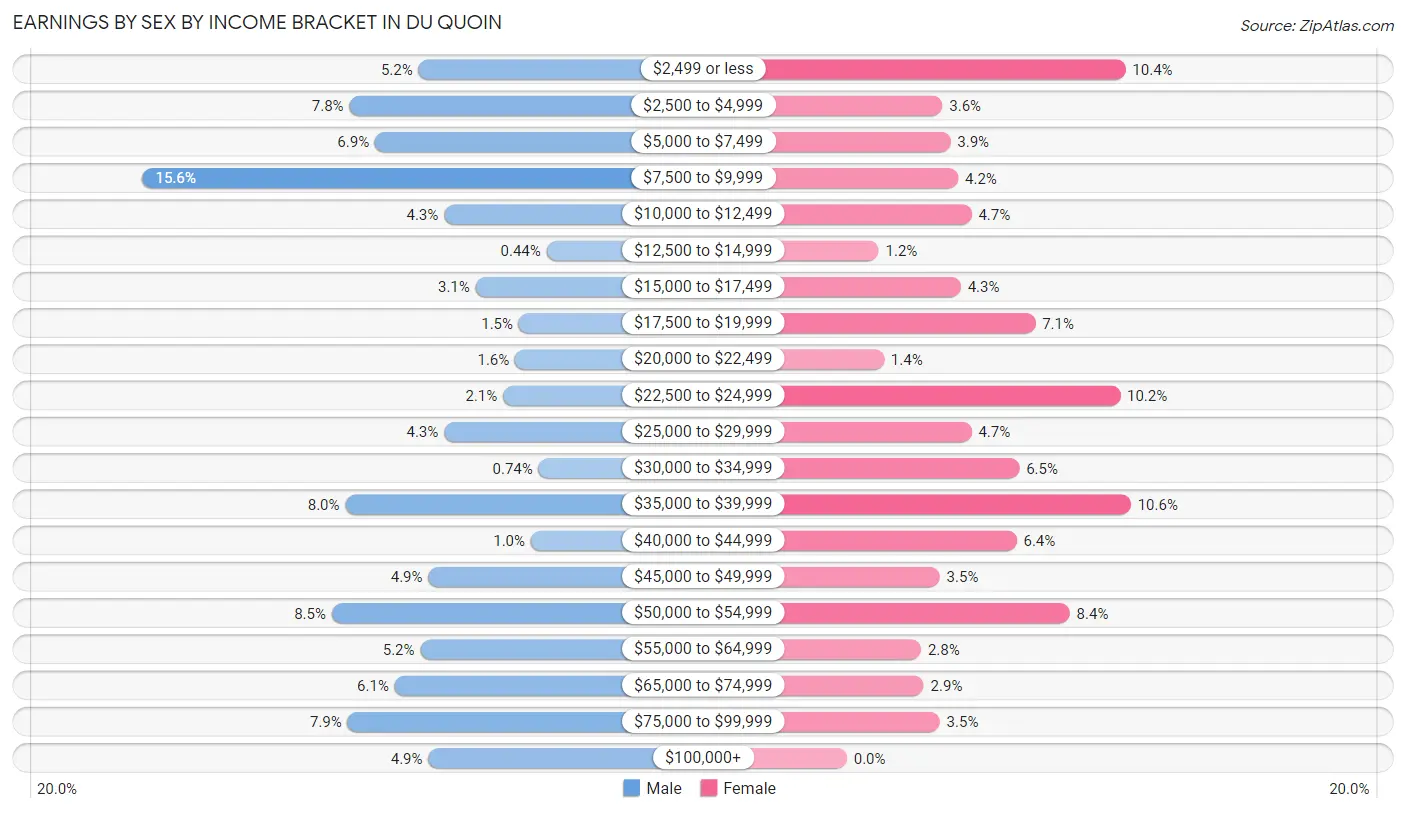
Earnings by Sex by Income Bracket in Du Quoin
The most common earnings brackets in Du Quoin are $7,500 to $9,999 for men (211 | 15.6%) and $35,000 to $39,999 for women (107 | 10.6%).
| Income | Male | Female |
| $2,499 or less | 71 (5.2%) | 105 (10.4%) |
| $2,500 to $4,999 | 106 (7.8%) | 36 (3.6%) |
| $5,000 to $7,499 | 93 (6.9%) | 39 (3.9%) |
| $7,500 to $9,999 | 211 (15.6%) | 42 (4.2%) |
| $10,000 to $12,499 | 58 (4.3%) | 47 (4.7%) |
| $12,500 to $14,999 | 6 (0.4%) | 12 (1.2%) |
| $15,000 to $17,499 | 42 (3.1%) | 43 (4.3%) |
| $17,500 to $19,999 | 20 (1.5%) | 71 (7.1%) |
| $20,000 to $22,499 | 22 (1.6%) | 14 (1.4%) |
| $22,500 to $24,999 | 28 (2.1%) | 103 (10.2%) |
| $25,000 to $29,999 | 58 (4.3%) | 47 (4.7%) |
| $30,000 to $34,999 | 10 (0.7%) | 65 (6.5%) |
| $35,000 to $39,999 | 108 (8.0%) | 107 (10.6%) |
| $40,000 to $44,999 | 14 (1.0%) | 64 (6.4%) |
| $45,000 to $49,999 | 66 (4.9%) | 35 (3.5%) |
| $50,000 to $54,999 | 115 (8.5%) | 84 (8.4%) |
| $55,000 to $64,999 | 70 (5.2%) | 28 (2.8%) |
| $65,000 to $74,999 | 83 (6.1%) | 29 (2.9%) |
| $75,000 to $99,999 | 107 (7.9%) | 35 (3.5%) |
| $100,000+ | 66 (4.9%) | 0 (0.0%) |
| Total | 1,354 (100.0%) | 1,006 (100.0%) |
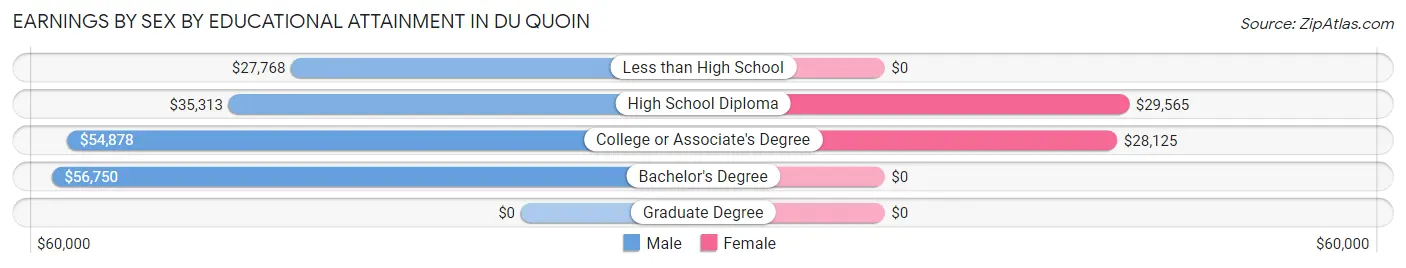
Earnings by Sex by Educational Attainment in Du Quoin
Average earnings in Du Quoin are $45,227 for men and $29,006 for women, a difference of 35.9%. Men with an educational attainment of bachelor's degree enjoy the highest average annual earnings of $56,750, while those with less than high school education earn the least with $27,768. Women with an educational attainment of high school diploma earn the most with the average annual earnings of $29,565, while those with college or associate's degree education have the smallest earnings of $28,125.
| Educational Attainment | Male Income | Female Income |
| Less than High School | $27,768 | $0 |
| High School Diploma | $35,313 | $29,565 |
| College or Associate's Degree | $54,878 | $28,125 |
| Bachelor's Degree | $56,750 | $0 |
| Graduate Degree | - | - |
| Total | $45,227 | $29,006 |
Family Income in Du Quoin
Family Income Brackets in Du Quoin
According to the Du Quoin family income data, there are 445 families falling into the $50,000 to $74,999 income range, which is the most common income bracket and makes up 28.7% of all families. Conversely, the $10,000 to $14,999 income bracket is the least frequent group with only 33 families (2.1%) belonging to this category.
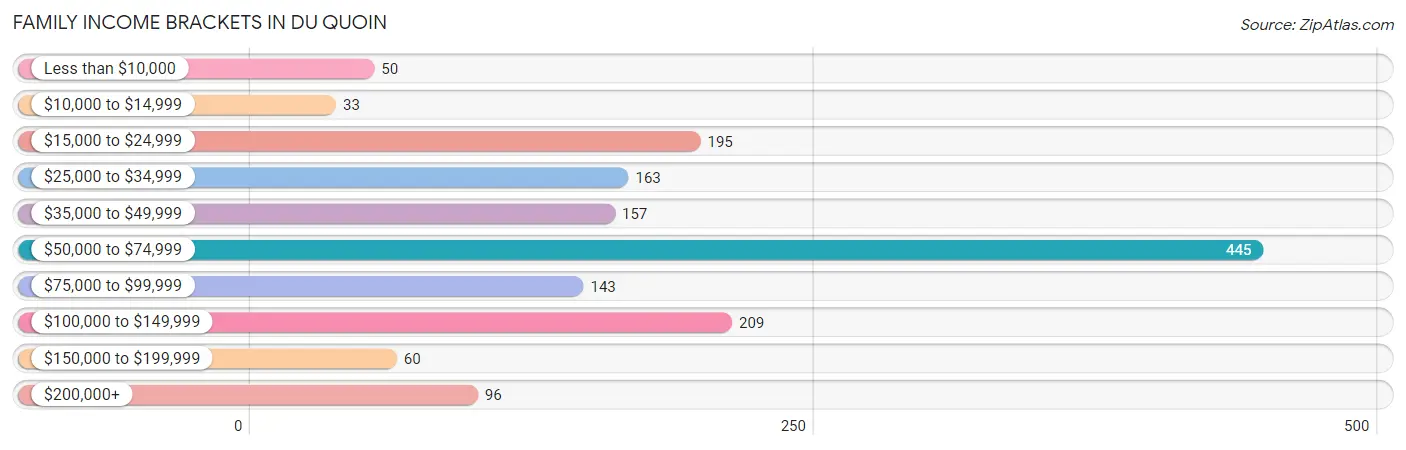
| Income Bracket | # Families | % Families |
| Less than $10,000 | 50 | 3.2% |
| $10,000 to $14,999 | 33 | 2.1% |
| $15,000 to $24,999 | 195 | 12.6% |
| $25,000 to $34,999 | 163 | 10.5% |
| $35,000 to $49,999 | 157 | 10.1% |
| $50,000 to $74,999 | 445 | 28.7% |
| $75,000 to $99,999 | 143 | 9.2% |
| $100,000 to $149,999 | 209 | 13.5% |
| $150,000 to $199,999 | 60 | 3.9% |
| $200,000+ | 96 | 6.2% |
Family Income by Famaliy Size in Du Quoin
3-person families (348 | 22.5%) account for the highest median family income in Du Quoin with $82,045 per family, while 3-person families (348 | 22.5%) have the highest median income of $27,348 per family member.
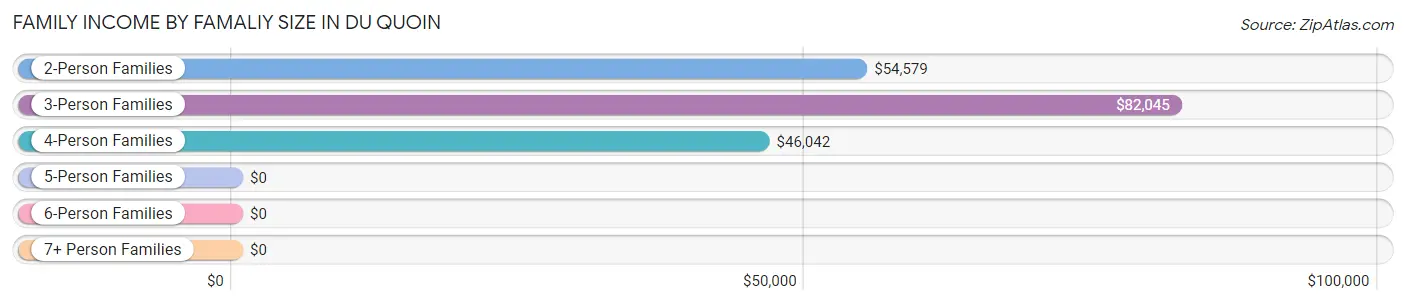
| Income Bracket | # Families | Median Income |
| 2-Person Families | 859 (55.4%) | $54,579 |
| 3-Person Families | 348 (22.5%) | $82,045 |
| 4-Person Families | 287 (18.5%) | $46,042 |
| 5-Person Families | 9 (0.6%) | $0 |
| 6-Person Families | 47 (3.0%) | $0 |
| 7+ Person Families | 0 (0.0%) | $0 |
| Total | 1,550 (100.0%) | $54,626 |
Family Income by Number of Earners in Du Quoin
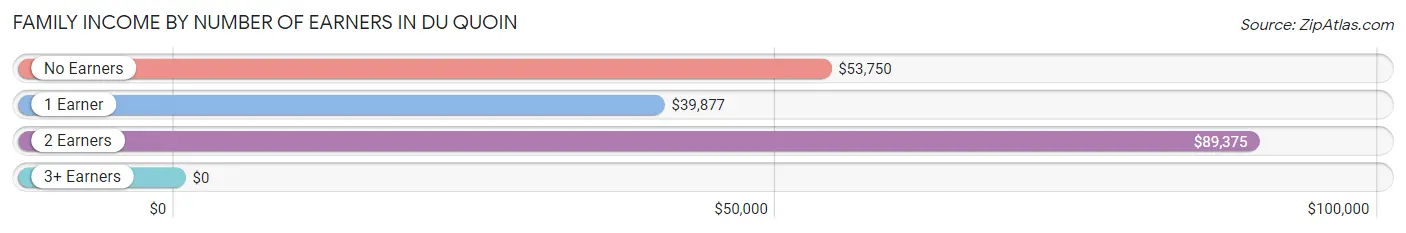
| Number of Earners | # Families | Median Income |
| No Earners | 495 (31.9%) | $53,750 |
| 1 Earner | 493 (31.8%) | $39,877 |
| 2 Earners | 493 (31.8%) | $89,375 |
| 3+ Earners | 69 (4.4%) | $0 |
| Total | 1,550 (100.0%) | $54,626 |
Household Income in Du Quoin
Household Income Brackets in Du Quoin
With 648 households falling in the category, the $50,000 to $74,999 income range is the most frequent in Du Quoin, accounting for 25.6% of all households. In contrast, only 61 households (2.4%) fall into the $150,000 to $199,999 income bracket, making it the least populous group.
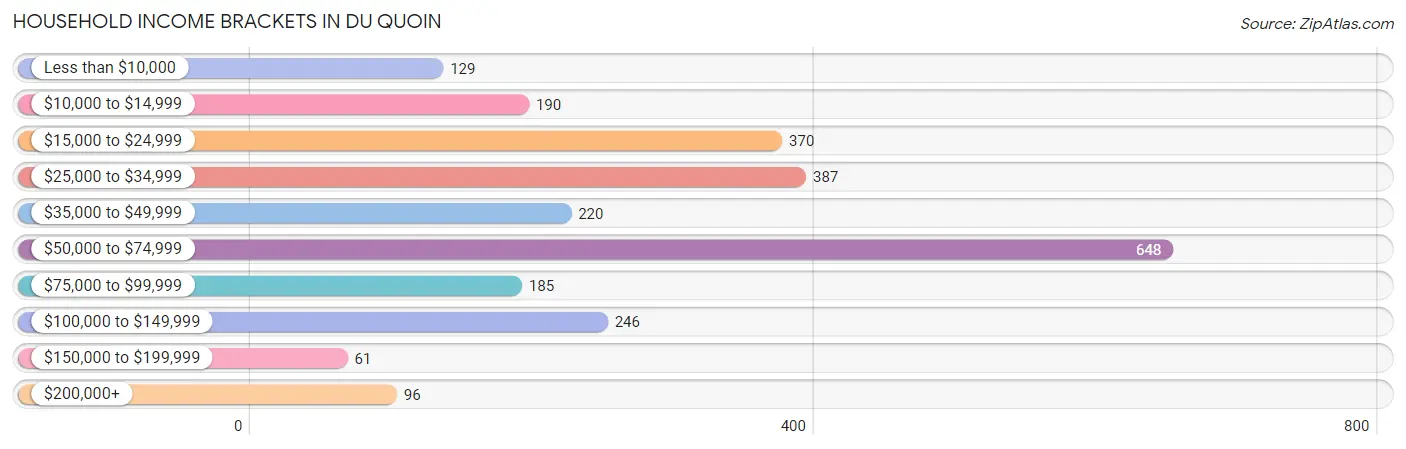
| Income Bracket | # Households | % Households |
| Less than $10,000 | 129 | 5.1% |
| $10,000 to $14,999 | 190 | 7.5% |
| $15,000 to $24,999 | 370 | 14.6% |
| $25,000 to $34,999 | 387 | 15.3% |
| $35,000 to $49,999 | 220 | 8.7% |
| $50,000 to $74,999 | 648 | 25.6% |
| $75,000 to $99,999 | 185 | 7.3% |
| $100,000 to $149,999 | 246 | 9.7% |
| $150,000 to $199,999 | 61 | 2.4% |
| $200,000+ | 96 | 3.8% |
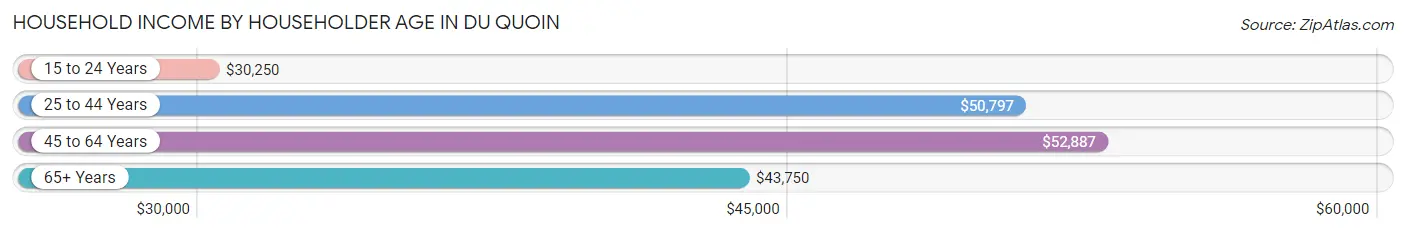
Household Income by Householder Age in Du Quoin
The median household income in Du Quoin is $48,770, with the highest median household income of $52,887 found in the 45 to 64 years age bracket for the primary householder. A total of 871 households (34.4%) fall into this category. Meanwhile, the 15 to 24 years age bracket for the primary householder has the lowest median household income of $30,250, with 156 households (6.2%) in this group.
| Income Bracket | # Households | Median Income |
| 15 to 24 Years | 156 (6.2%) | $30,250 |
| 25 to 44 Years | 747 (29.5%) | $50,797 |
| 45 to 64 Years | 871 (34.4%) | $52,887 |
| 65+ Years | 758 (29.9%) | $43,750 |
| Total | 2,532 (100.0%) | $48,770 |
Poverty in Du Quoin
Income Below Poverty by Sex and Age in Du Quoin
With 23.8% poverty level for males and 30.3% for females among the residents of Du Quoin, 16 and 17 year old males and 5 year old females are the most vulnerable to poverty, with 76 males (51.7%) and 44 females (100.0%) in their respective age groups living below the poverty level.
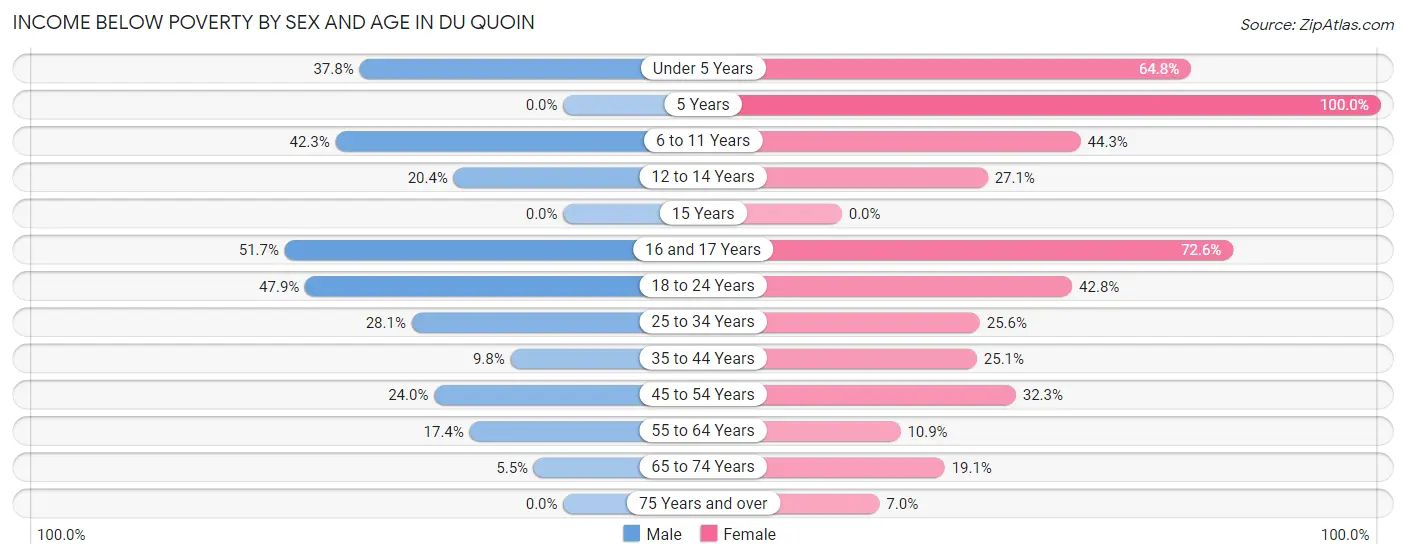
| Age Bracket | Male | Female |
| Under 5 Years | 14 (37.8%) | 129 (64.8%) |
| 5 Years | 0 (0.0%) | 44 (100.0%) |
| 6 to 11 Years | 85 (42.3%) | 98 (44.3%) |
| 12 to 14 Years | 23 (20.3%) | 13 (27.1%) |
| 15 Years | 0 (0.0%) | 0 (0.0%) |
| 16 and 17 Years | 76 (51.7%) | 77 (72.6%) |
| 18 to 24 Years | 184 (47.9%) | 65 (42.8%) |
| 25 to 34 Years | 56 (28.1%) | 93 (25.6%) |
| 35 to 44 Years | 34 (9.8%) | 86 (25.1%) |
| 45 to 54 Years | 93 (24.0%) | 146 (32.3%) |
| 55 to 64 Years | 71 (17.4%) | 28 (10.9%) |
| 65 to 74 Years | 13 (5.5%) | 64 (19.1%) |
| 75 Years and over | 0 (0.0%) | 22 (7.0%) |
| Total | 649 (23.8%) | 865 (30.3%) |
Income Above Poverty by Sex and Age in Du Quoin
According to the poverty statistics in Du Quoin, males aged 5 years and females aged 15 years are the age groups that are most secure financially, with 100.0% of males and 100.0% of females in these age groups living above the poverty line.
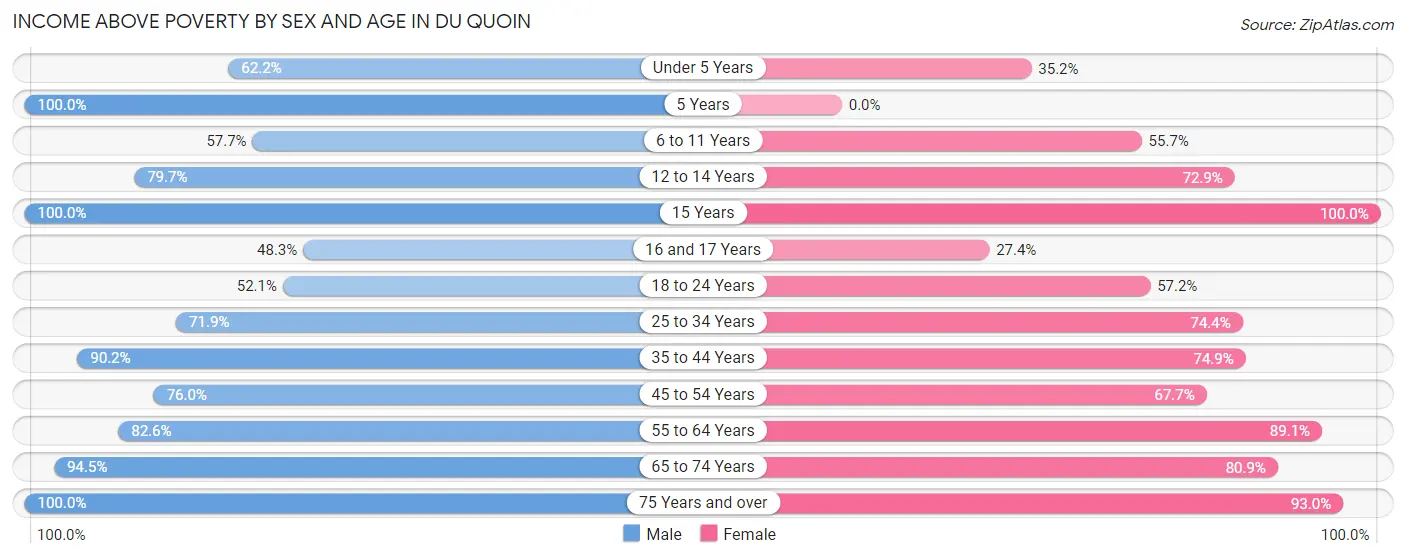
| Age Bracket | Male | Female |
| Under 5 Years | 23 (62.2%) | 70 (35.2%) |
| 5 Years | 26 (100.0%) | 0 (0.0%) |
| 6 to 11 Years | 116 (57.7%) | 123 (55.7%) |
| 12 to 14 Years | 90 (79.6%) | 35 (72.9%) |
| 15 Years | 22 (100.0%) | 22 (100.0%) |
| 16 and 17 Years | 71 (48.3%) | 29 (27.4%) |
| 18 to 24 Years | 200 (52.1%) | 87 (57.2%) |
| 25 to 34 Years | 143 (71.9%) | 270 (74.4%) |
| 35 to 44 Years | 313 (90.2%) | 257 (74.9%) |
| 45 to 54 Years | 295 (76.0%) | 306 (67.7%) |
| 55 to 64 Years | 337 (82.6%) | 229 (89.1%) |
| 65 to 74 Years | 225 (94.5%) | 271 (80.9%) |
| 75 Years and over | 211 (100.0%) | 293 (93.0%) |
| Total | 2,072 (76.1%) | 1,992 (69.7%) |
Income Below Poverty Among Married-Couple Families in Du Quoin
The poverty statistics for married-couple families in Du Quoin show that 6.4% or 62 of the total 966 families live below the poverty line. Families with 3 or 4 children have the highest poverty rate of 100.0%, comprising of 46 families. On the other hand, families with no children have the lowest poverty rate of 1.1%, which includes 7 families.
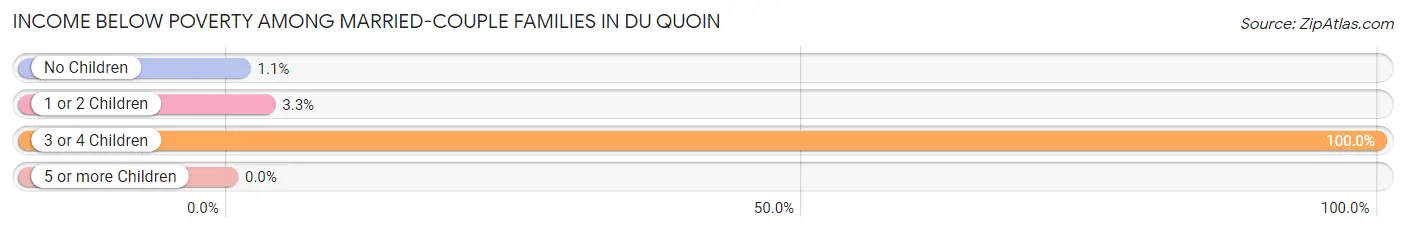
| Children | Above Poverty | Below Poverty |
| No Children | 636 (98.9%) | 7 (1.1%) |
| 1 or 2 Children | 268 (96.8%) | 9 (3.3%) |
| 3 or 4 Children | 0 (0.0%) | 46 (100.0%) |
| 5 or more Children | 0 (0.0%) | 0 (0.0%) |
| Total | 904 (93.6%) | 62 (6.4%) |
Income Below Poverty Among Single-Parent Households in Du Quoin
According to the poverty data in Du Quoin, 46.2% or 67 single-father households and 41.0% or 180 single-mother households are living below the poverty line. Among single-father households, those with 1 or 2 children have the highest poverty rate, with 67 households (75.3%) experiencing poverty. Likewise, among single-mother households, those with 3 or 4 children have the highest poverty rate, with 74 households (78.7%) falling below the poverty line.
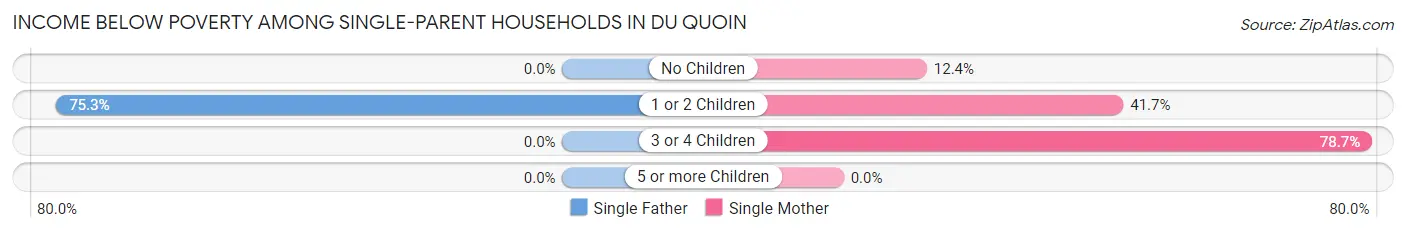
| Children | Single Father | Single Mother |
| No Children | 0 (0.0%) | 16 (12.4%) |
| 1 or 2 Children | 67 (75.3%) | 90 (41.7%) |
| 3 or 4 Children | 0 (0.0%) | 74 (78.7%) |
| 5 or more Children | 0 (0.0%) | 0 (0.0%) |
| Total | 67 (46.2%) | 180 (41.0%) |
Income Below Poverty Among Married-Couple vs Single-Parent Households in Du Quoin
The poverty data for Du Quoin shows that 62 of the married-couple family households (6.4%) and 247 of the single-parent households (42.3%) are living below the poverty level. Within the married-couple family households, those with 3 or 4 children have the highest poverty rate, with 46 households (100.0%) falling below the poverty line. Among the single-parent households, those with 3 or 4 children have the highest poverty rate, with 74 household (78.7%) living below poverty.
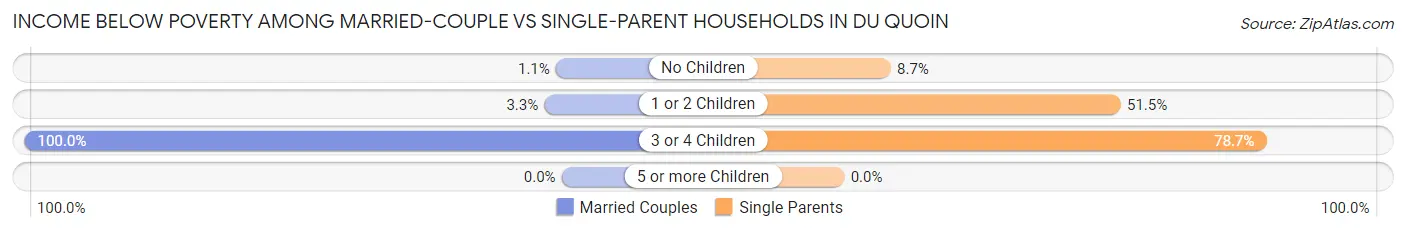
| Children | Married-Couple Families | Single-Parent Households |
| No Children | 7 (1.1%) | 16 (8.6%) |
| 1 or 2 Children | 9 (3.3%) | 157 (51.5%) |
| 3 or 4 Children | 46 (100.0%) | 74 (78.7%) |
| 5 or more Children | 0 (0.0%) | 0 (0.0%) |
| Total | 62 (6.4%) | 247 (42.3%) |
Race in Du Quoin
The most populous races in Du Quoin are White / Caucasian (5,046 | 86.7%), Black / African American (394 | 6.8%), and Hispanic or Latino (206 | 3.5%).
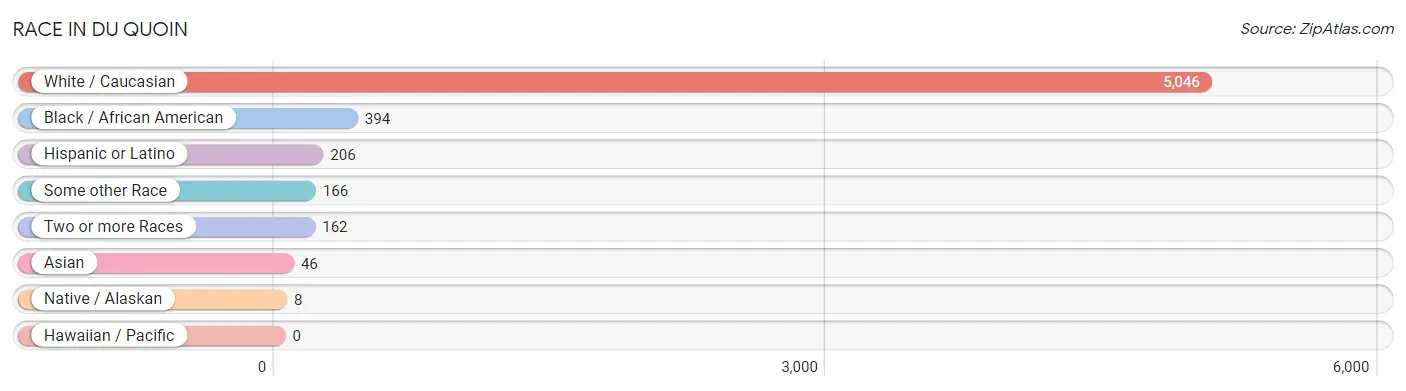
| Race | # Population | % Population |
| Asian | 46 | 0.8% |
| Black / African American | 394 | 6.8% |
| Hawaiian / Pacific | 0 | 0.0% |
| Hispanic or Latino | 206 | 3.5% |
| Native / Alaskan | 8 | 0.1% |
| White / Caucasian | 5,046 | 86.7% |
| Two or more Races | 162 | 2.8% |
| Some other Race | 166 | 2.9% |
| Total | 5,822 | 100.0% |
Ancestry in Du Quoin
The most populous ancestries reported in Du Quoin are German (1,338 | 23.0%), Irish (727 | 12.5%), English (566 | 9.7%), American (281 | 4.8%), and Mexican (206 | 3.5%), together accounting for 53.6% of all Du Quoin residents.
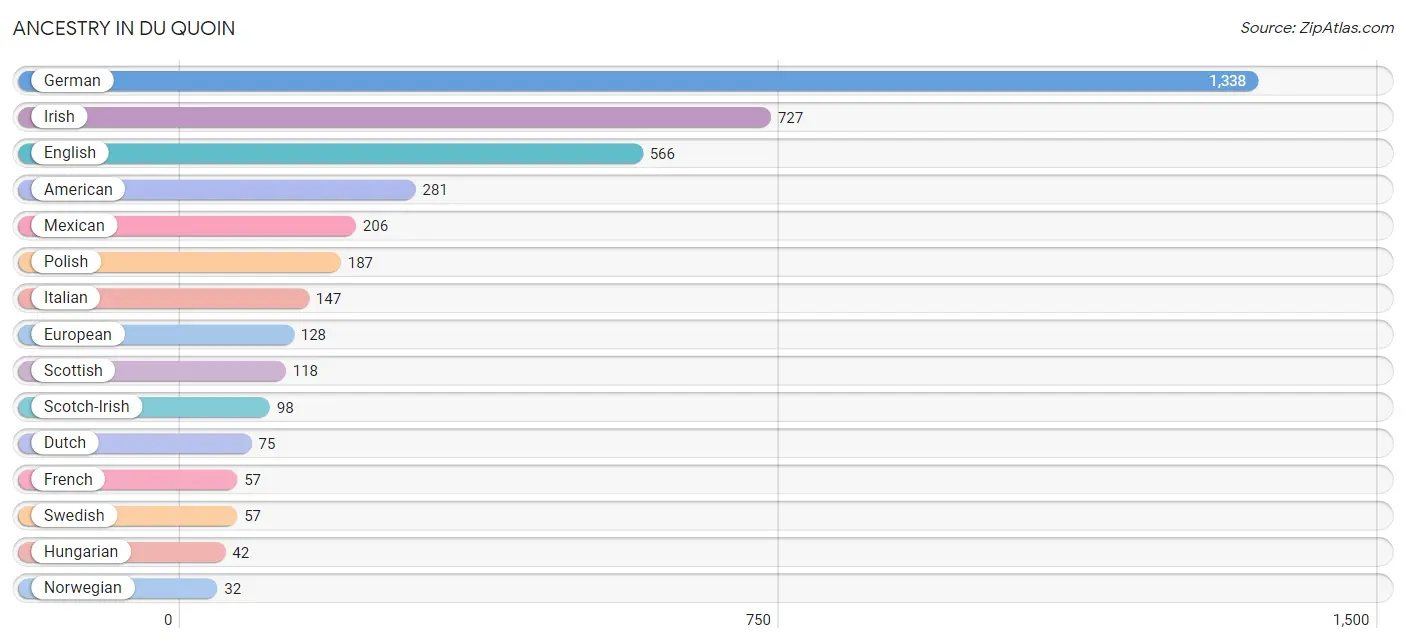
| Ancestry | # Population | % Population |
| African | 17 | 0.3% |
| American | 281 | 4.8% |
| Austrian | 15 | 0.3% |
| Bhutanese | 8 | 0.1% |
| British | 28 | 0.5% |
| Dutch | 75 | 1.3% |
| Eastern European | 15 | 0.3% |
| English | 566 | 9.7% |
| European | 128 | 2.2% |
| French | 57 | 1.0% |
| French Canadian | 21 | 0.4% |
| German | 1,338 | 23.0% |
| Greek | 7 | 0.1% |
| Hungarian | 42 | 0.7% |
| Indian (Asian) | 28 | 0.5% |
| Irish | 727 | 12.5% |
| Italian | 147 | 2.5% |
| Korean | 14 | 0.2% |
| Lithuanian | 10 | 0.2% |
| Mexican | 206 | 3.5% |
| Norwegian | 32 | 0.5% |
| Polish | 187 | 3.2% |
| Potawatomi | 8 | 0.1% |
| Russian | 26 | 0.4% |
| Scotch-Irish | 98 | 1.7% |
| Scottish | 118 | 2.0% |
| Sri Lankan | 10 | 0.2% |
| Subsaharan African | 17 | 0.3% |
| Swedish | 57 | 1.0% |
| Welsh | 26 | 0.4% | View All 30 Rows |
Immigrants in Du Quoin
The most numerous immigrant groups reported in Du Quoin came from Asia (37 | 0.6%), Eastern Asia (27 | 0.5%), China (19 | 0.3%), South Eastern Asia (10 | 0.2%), and Vietnam (10 | 0.2%), together accounting for 1.8% of all Du Quoin residents.
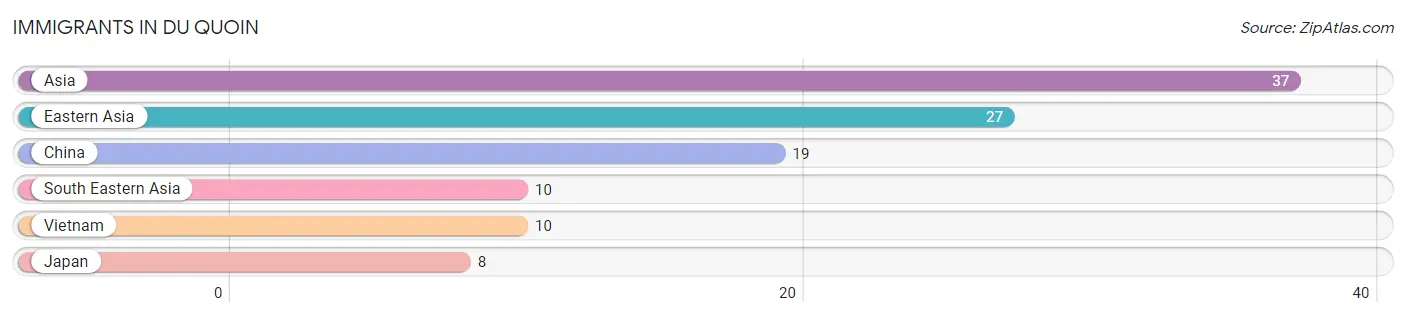
| Immigration Origin | # Population | % Population |
| Asia | 37 | 0.6% |
| China | 19 | 0.3% |
| Eastern Asia | 27 | 0.5% |
| Japan | 8 | 0.1% |
| South Eastern Asia | 10 | 0.2% |
| Vietnam | 10 | 0.2% | View All 6 Rows |
Sex and Age in Du Quoin
Sex and Age in Du Quoin
The most populous age groups in Du Quoin are 15 to 19 Years (373 | 12.9%) for men and 45 to 49 Years (242 | 8.2%) for women.
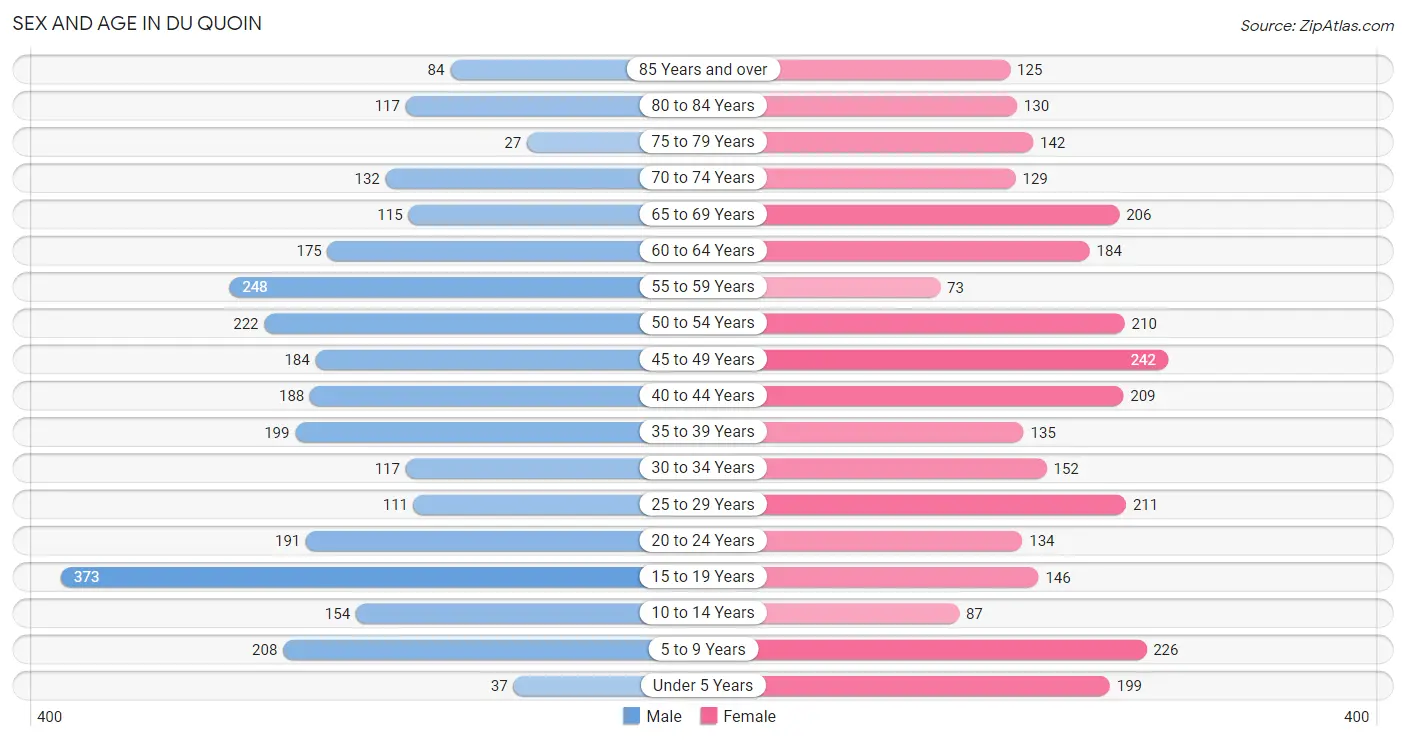
| Age Bracket | Male | Female |
| Under 5 Years | 37 (1.3%) | 199 (6.8%) |
| 5 to 9 Years | 208 (7.2%) | 226 (7.7%) |
| 10 to 14 Years | 154 (5.3%) | 87 (3.0%) |
| 15 to 19 Years | 373 (12.9%) | 146 (5.0%) |
| 20 to 24 Years | 191 (6.6%) | 134 (4.6%) |
| 25 to 29 Years | 111 (3.8%) | 211 (7.2%) |
| 30 to 34 Years | 117 (4.1%) | 152 (5.2%) |
| 35 to 39 Years | 199 (6.9%) | 135 (4.6%) |
| 40 to 44 Years | 188 (6.5%) | 209 (7.1%) |
| 45 to 49 Years | 184 (6.4%) | 242 (8.2%) |
| 50 to 54 Years | 222 (7.7%) | 210 (7.1%) |
| 55 to 59 Years | 248 (8.6%) | 73 (2.5%) |
| 60 to 64 Years | 175 (6.1%) | 184 (6.3%) |
| 65 to 69 Years | 115 (4.0%) | 206 (7.0%) |
| 70 to 74 Years | 132 (4.6%) | 129 (4.4%) |
| 75 to 79 Years | 27 (0.9%) | 142 (4.8%) |
| 80 to 84 Years | 117 (4.1%) | 130 (4.4%) |
| 85 Years and over | 84 (2.9%) | 125 (4.3%) |
| Total | 2,882 (100.0%) | 2,940 (100.0%) |
Families and Households in Du Quoin
Median Family Size in Du Quoin
The median family size in Du Quoin is 2.85 persons per family, with single female/mother families (439 | 28.3%) accounting for the largest median family size of 2.97 persons per family. On the other hand, single male/father families (145 | 9.3%) represent the smallest median family size with 2.17 persons per family.
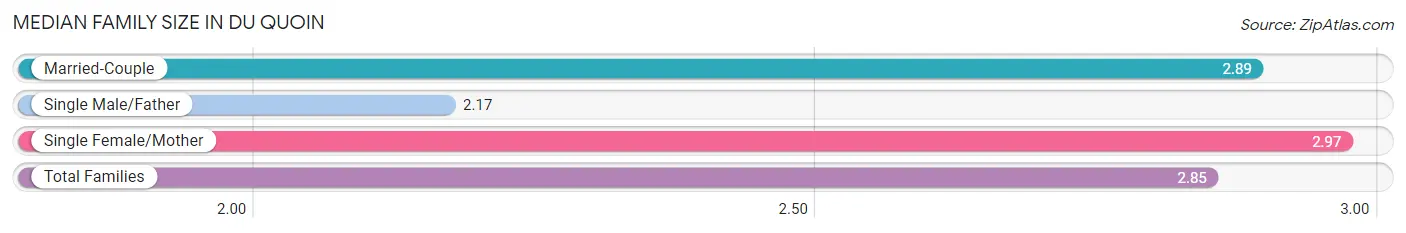
| Family Type | # Families | Family Size |
| Married-Couple | 966 (62.3%) | 2.89 |
| Single Male/Father | 145 (9.3%) | 2.17 |
| Single Female/Mother | 439 (28.3%) | 2.97 |
| Total Families | 1,550 (100.0%) | 2.85 |
Median Household Size in Du Quoin
The median household size in Du Quoin is 2.20 persons per household, with single female/mother households (439 | 17.3%) accounting for the largest median household size of 3.2 persons per household. non-family households (982 | 38.8%) represent the smallest median household size with 1.07 persons per household.
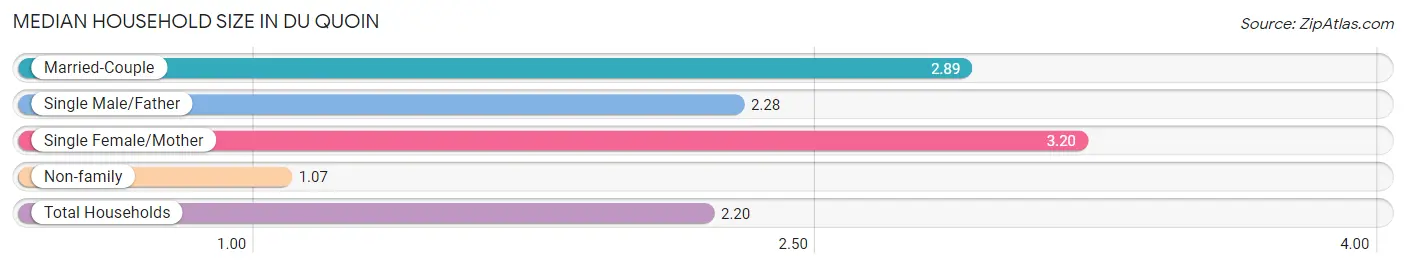
| Household Type | # Households | Household Size |
| Married-Couple | 966 (38.2%) | 2.89 |
| Single Male/Father | 145 (5.7%) | 2.28 |
| Single Female/Mother | 439 (17.3%) | 3.20 |
| Non-family | 982 (38.8%) | 1.07 |
| Total Households | 2,532 (100.0%) | 2.20 |
Household Size by Marriage Status in Du Quoin
Out of a total of 2,532 households in Du Quoin, 1,550 (61.2%) are family households, while 982 (38.8%) are nonfamily households. The most numerous type of family households are 2-person households, comprising 811, and the most common type of nonfamily households are 1-person households, comprising 919.
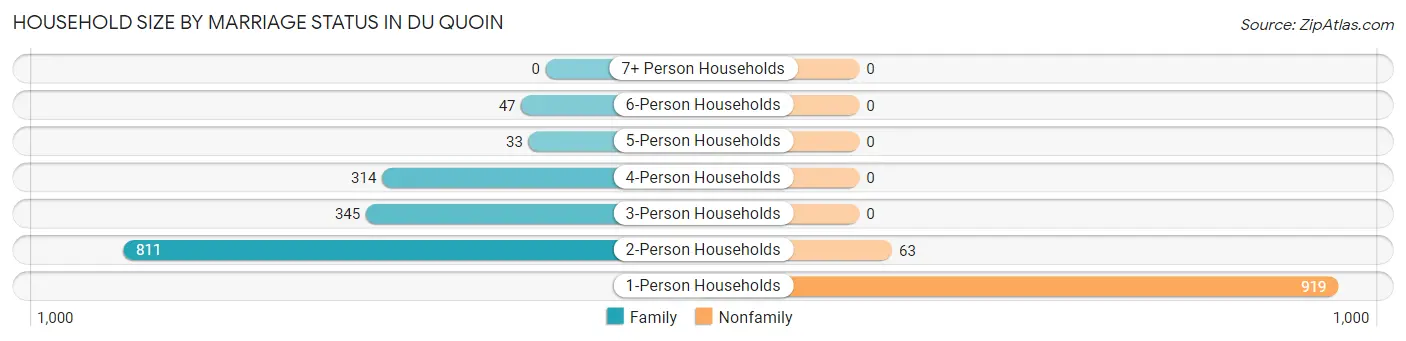
| Household Size | Family Households | Nonfamily Households |
| 1-Person Households | - | 919 (36.3%) |
| 2-Person Households | 811 (32.0%) | 63 (2.5%) |
| 3-Person Households | 345 (13.6%) | 0 (0.0%) |
| 4-Person Households | 314 (12.4%) | 0 (0.0%) |
| 5-Person Households | 33 (1.3%) | 0 (0.0%) |
| 6-Person Households | 47 (1.9%) | 0 (0.0%) |
| 7+ Person Households | 0 (0.0%) | 0 (0.0%) |
| Total | 1,550 (61.2%) | 982 (38.8%) |
Female Fertility in Du Quoin
Fertility by Age in Du Quoin
| Age Bracket | Women with Births | Births / 1,000 Women |
| 15 to 19 years | 0 (0.0%) | 0.0 |
| 20 to 34 years | 0 (0.0%) | 0.0 |
| 35 to 50 years | 0 (0.0%) | 0.0 |
| Total | 0 (0.0%) | 0.0 |
Fertility by Age by Marriage Status in Du Quoin
| Age Bracket | Married | Unmarried |
| 15 to 19 years | 0 (0.0%) | 0 (0.0%) |
| 20 to 34 years | 0 (0.0%) | 0 (0.0%) |
| 35 to 50 years | 0 (0.0%) | 0 (0.0%) |
| Total | 0 (0.0%) | 0 (0.0%) |
Fertility by Education in Du Quoin
| Educational Attainment | Women with Births | Births / 1,000 Women |
| Less than High School | 0 (0.0%) | 0.0 |
| High School Diploma | 0 (0.0%) | 0.0 |
| College or Associate's Degree | 0 (0.0%) | 0.0 |
| Bachelor's Degree | 0 (0.0%) | 0.0 |
| Graduate Degree | 0 (0.0%) | 0.0 |
| Total | 0 (0.0%) | 0.0 |
Fertility by Education by Marriage Status in Du Quoin
| Educational Attainment | Married | Unmarried |
| Less than High School | 0 (0.0%) | 0 (0.0%) |
| High School Diploma | 0 (0.0%) | 0 (0.0%) |
| College or Associate's Degree | 0 (0.0%) | 0 (0.0%) |
| Bachelor's Degree | 0 (0.0%) | 0 (0.0%) |
| Graduate Degree | 0 (0.0%) | 0 (0.0%) |
| Total | 0 (0.0%) | 0 (0.0%) |
Employment Characteristics in Du Quoin
Employment by Class of Employer in Du Quoin
Among the 1,918 employed individuals in Du Quoin, private company employees (1,177 | 61.4%), state government employees (208 | 10.8%), and not-for-profit organizations (204 | 10.6%) make up the most common classes of employment.
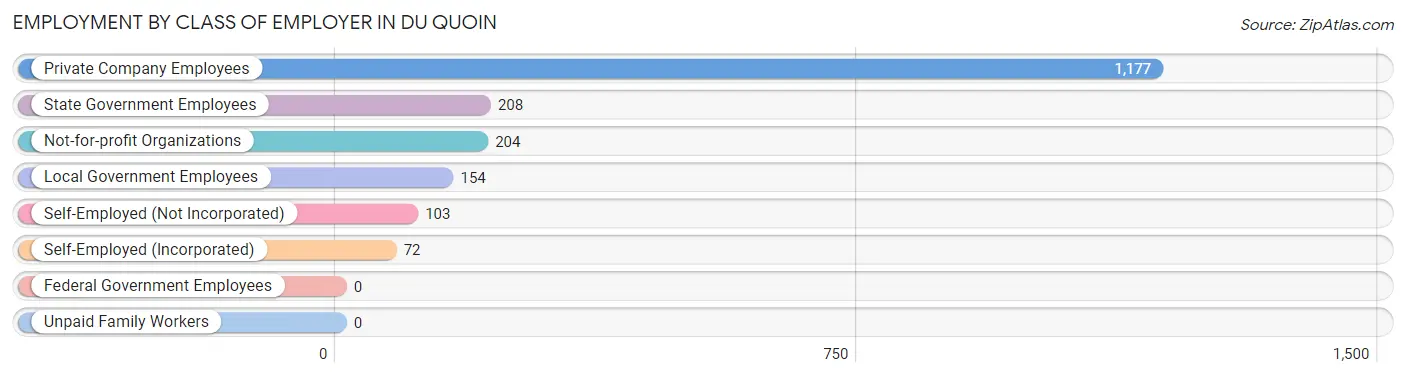
| Employer Class | # Employees | % Employees |
| Private Company Employees | 1,177 | 61.4% |
| Self-Employed (Incorporated) | 72 | 3.7% |
| Self-Employed (Not Incorporated) | 103 | 5.4% |
| Not-for-profit Organizations | 204 | 10.6% |
| Local Government Employees | 154 | 8.0% |
| State Government Employees | 208 | 10.8% |
| Federal Government Employees | 0 | 0.0% |
| Unpaid Family Workers | 0 | 0.0% |
| Total | 1,918 | 100.0% |
Employment Status by Age in Du Quoin
According to the labor force statistics for Du Quoin, out of the total population over 16 years of age (4,867), 44.6% or 2,171 individuals are in the labor force, with 11.6% or 252 of them unemployed. The age group with the highest labor force participation rate is 20 to 24 years, with 73.2% or 238 individuals in the labor force. Within the labor force, the 20 to 24 years age range has the highest percentage of unemployed individuals, with 23.5% or 56 of them being unemployed.
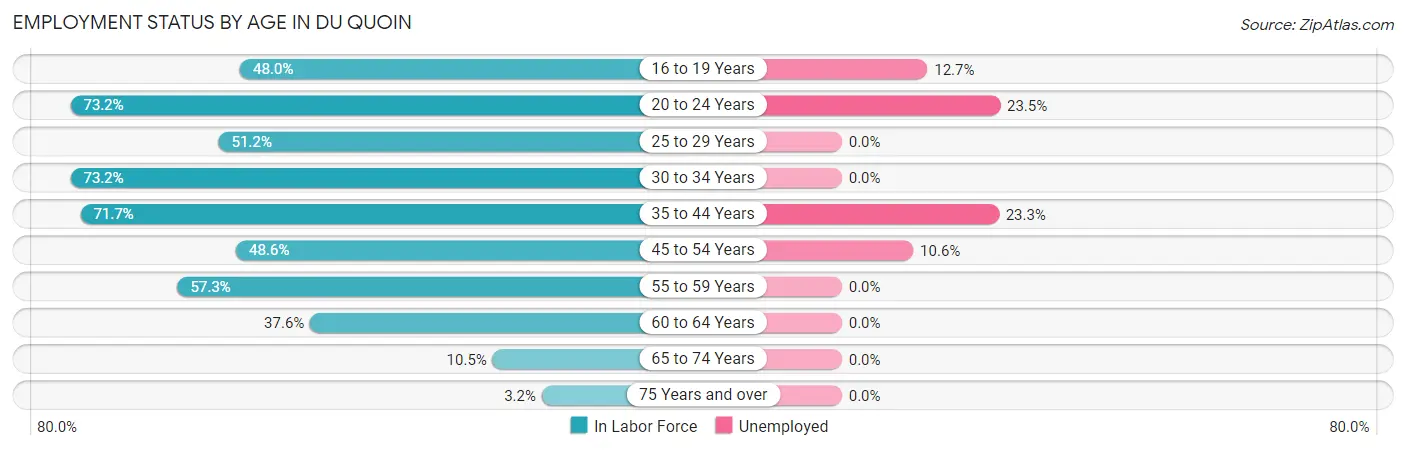
| Age Bracket | In Labor Force | Unemployed |
| 16 to 19 Years | 228 (48.0%) | 29 (12.7%) |
| 20 to 24 Years | 238 (73.2%) | 56 (23.5%) |
| 25 to 29 Years | 165 (51.2%) | 0 (0.0%) |
| 30 to 34 Years | 197 (73.2%) | 0 (0.0%) |
| 35 to 44 Years | 524 (71.7%) | 122 (23.3%) |
| 45 to 54 Years | 417 (48.6%) | 44 (10.6%) |
| 55 to 59 Years | 184 (57.3%) | 0 (0.0%) |
| 60 to 64 Years | 135 (37.6%) | 0 (0.0%) |
| 65 to 74 Years | 61 (10.5%) | 0 (0.0%) |
| 75 Years and over | 20 (3.2%) | 0 (0.0%) |
| Total | 2,171 (44.6%) | 252 (11.6%) |
Employment Status by Educational Attainment in Du Quoin
According to labor force statistics for Du Quoin, 56.7% of individuals (1,622) out of the total population between 25 and 64 years of age (2,860) are in the labor force, with 10.2% or 165 of them being unemployed. The group with the highest labor force participation rate are those with the educational attainment of bachelor's degree or higher, with 90.8% or 217 individuals in the labor force. Within the labor force, individuals with less than high school education have the highest percentage of unemployment, with 37.1% or 52 of them being unemployed.
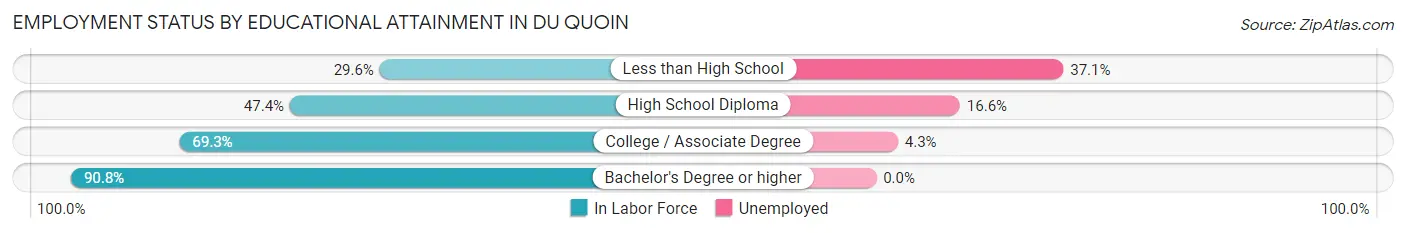
| Educational Attainment | In Labor Force | Unemployed |
| Less than High School | 140 (29.6%) | 175 (37.1%) |
| High School Diploma | 483 (47.4%) | 169 (16.6%) |
| College / Associate Degree | 782 (69.3%) | 49 (4.3%) |
| Bachelor's Degree or higher | 217 (90.8%) | 0 (0.0%) |
| Total | 1,622 (56.7%) | 292 (10.2%) |
Employment Occupations by Sex in Du Quoin
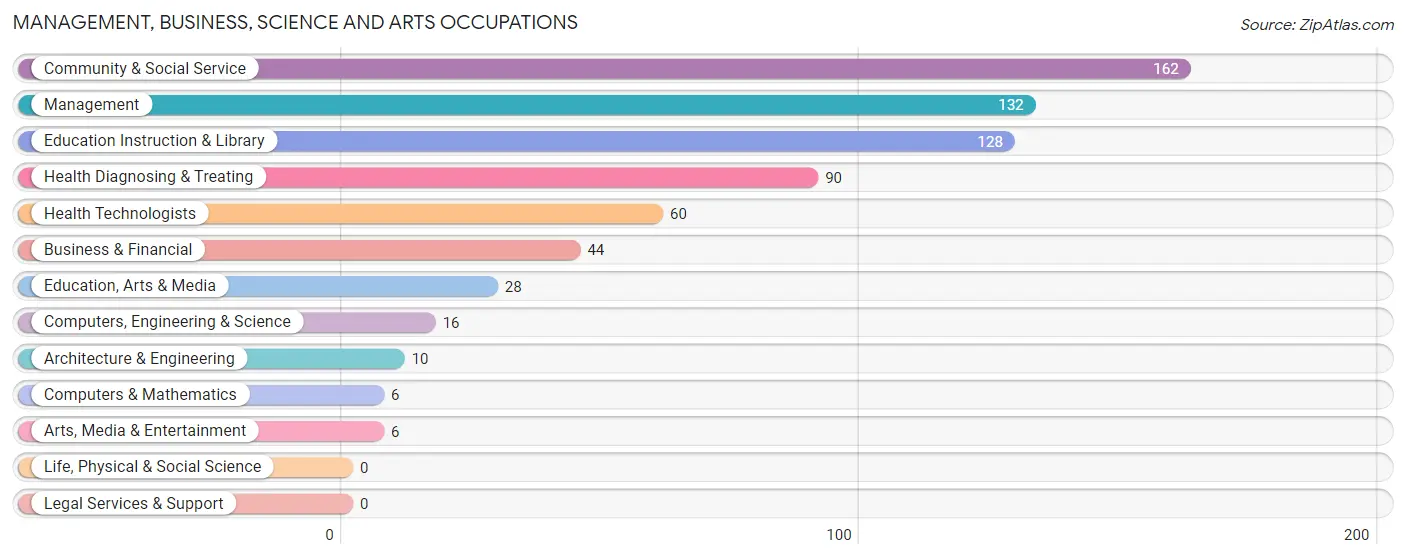
Management, Business, Science and Arts Occupations
The most common Management, Business, Science and Arts occupations in Du Quoin are Community & Social Service (162 | 8.5%), Management (132 | 6.9%), Education Instruction & Library (128 | 6.7%), Health Diagnosing & Treating (90 | 4.7%), and Health Technologists (60 | 3.1%).
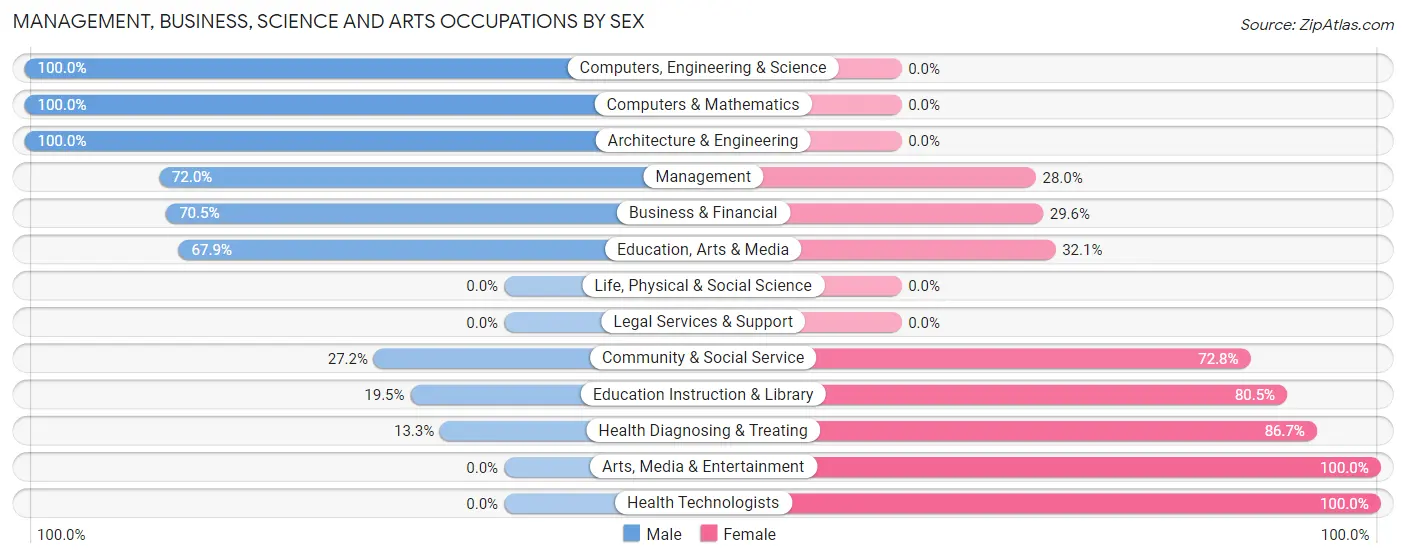
Management, Business, Science and Arts Occupations by Sex
Within the Management, Business, Science and Arts occupations in Du Quoin, the most male-oriented occupations are Computers, Engineering & Science (100.0%), Computers & Mathematics (100.0%), and Architecture & Engineering (100.0%), while the most female-oriented occupations are Arts, Media & Entertainment (100.0%), Health Technologists (100.0%), and Health Diagnosing & Treating (86.7%).
| Occupation | Male | Female |
| Management | 95 (72.0%) | 37 (28.0%) |
| Business & Financial | 31 (70.5%) | 13 (29.5%) |
| Computers, Engineering & Science | 16 (100.0%) | 0 (0.0%) |
| Computers & Mathematics | 6 (100.0%) | 0 (0.0%) |
| Architecture & Engineering | 10 (100.0%) | 0 (0.0%) |
| Life, Physical & Social Science | 0 (0.0%) | 0 (0.0%) |
| Community & Social Service | 44 (27.2%) | 118 (72.8%) |
| Education, Arts & Media | 19 (67.9%) | 9 (32.1%) |
| Legal Services & Support | 0 (0.0%) | 0 (0.0%) |
| Education Instruction & Library | 25 (19.5%) | 103 (80.5%) |
| Arts, Media & Entertainment | 0 (0.0%) | 6 (100.0%) |
| Health Diagnosing & Treating | 12 (13.3%) | 78 (86.7%) |
| Health Technologists | 0 (0.0%) | 60 (100.0%) |
| Total (Category) | 198 (44.6%) | 246 (55.4%) |
| Total (Overall) | 1,044 (54.4%) | 874 (45.6%) |
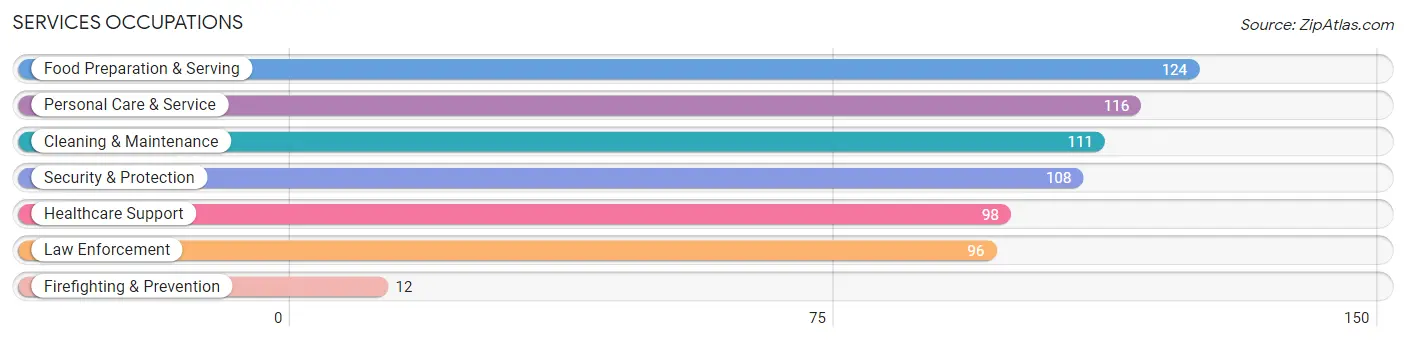
Services Occupations
The most common Services occupations in Du Quoin are Food Preparation & Serving (124 | 6.5%), Personal Care & Service (116 | 6.0%), Cleaning & Maintenance (111 | 5.8%), Security & Protection (108 | 5.6%), and Healthcare Support (98 | 5.1%).
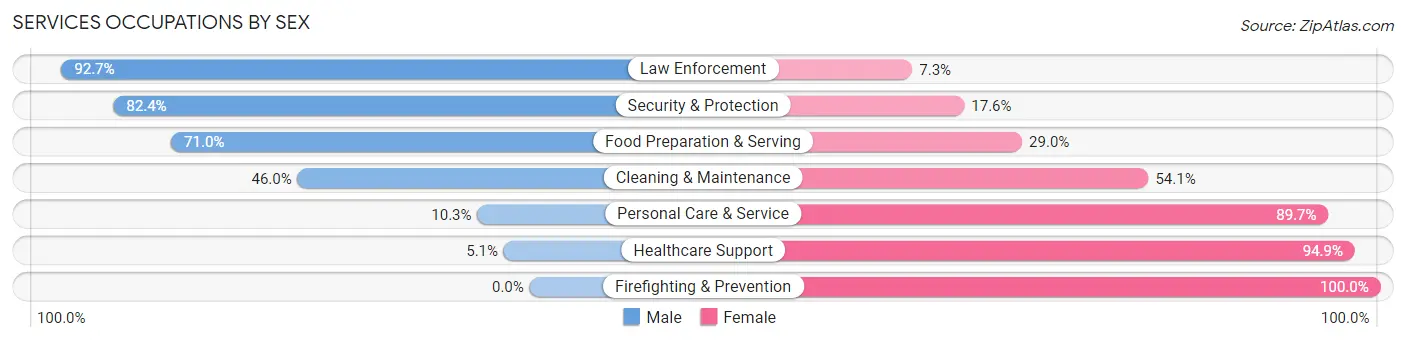
Services Occupations by Sex
Within the Services occupations in Du Quoin, the most male-oriented occupations are Law Enforcement (92.7%), Security & Protection (82.4%), and Food Preparation & Serving (71.0%), while the most female-oriented occupations are Firefighting & Prevention (100.0%), Healthcare Support (94.9%), and Personal Care & Service (89.7%).
| Occupation | Male | Female |
| Healthcare Support | 5 (5.1%) | 93 (94.9%) |
| Security & Protection | 89 (82.4%) | 19 (17.6%) |
| Firefighting & Prevention | 0 (0.0%) | 12 (100.0%) |
| Law Enforcement | 89 (92.7%) | 7 (7.3%) |
| Food Preparation & Serving | 88 (71.0%) | 36 (29.0%) |
| Cleaning & Maintenance | 51 (46.0%) | 60 (54.0%) |
| Personal Care & Service | 12 (10.3%) | 104 (89.7%) |
| Total (Category) | 245 (44.0%) | 312 (56.0%) |
| Total (Overall) | 1,044 (54.4%) | 874 (45.6%) |
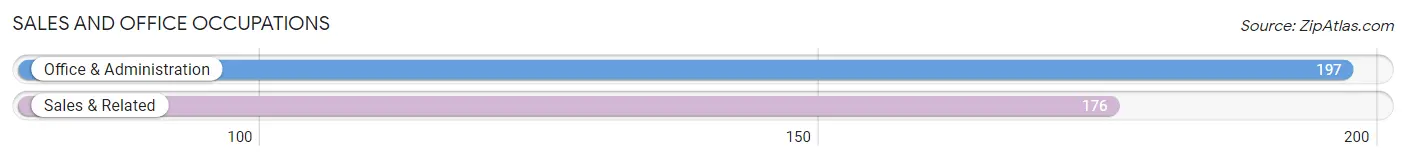
Sales and Office Occupations
The most common Sales and Office occupations in Du Quoin are Office & Administration (197 | 10.3%), and Sales & Related (176 | 9.2%).
Sales and Office Occupations by Sex
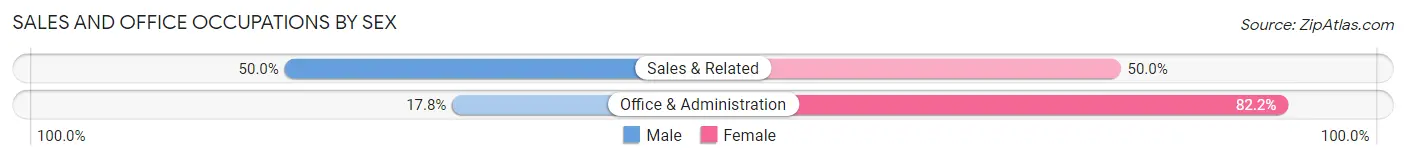
| Occupation | Male | Female |
| Sales & Related | 88 (50.0%) | 88 (50.0%) |
| Office & Administration | 35 (17.8%) | 162 (82.2%) |
| Total (Category) | 123 (33.0%) | 250 (67.0%) |
| Total (Overall) | 1,044 (54.4%) | 874 (45.6%) |
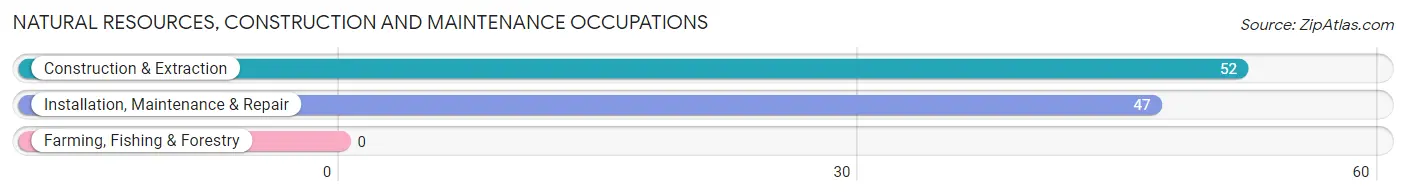
Natural Resources, Construction and Maintenance Occupations
The most common Natural Resources, Construction and Maintenance occupations in Du Quoin are Construction & Extraction (52 | 2.7%), and Installation, Maintenance & Repair (47 | 2.5%).
Natural Resources, Construction and Maintenance Occupations by Sex
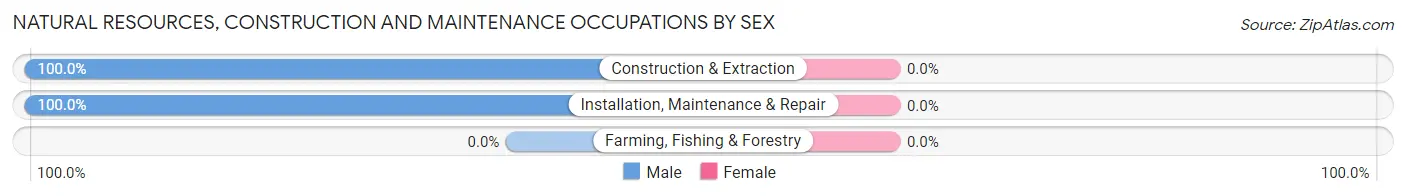
| Occupation | Male | Female |
| Farming, Fishing & Forestry | 0 (0.0%) | 0 (0.0%) |
| Construction & Extraction | 52 (100.0%) | 0 (0.0%) |
| Installation, Maintenance & Repair | 47 (100.0%) | 0 (0.0%) |
| Total (Category) | 99 (100.0%) | 0 (0.0%) |
| Total (Overall) | 1,044 (54.4%) | 874 (45.6%) |
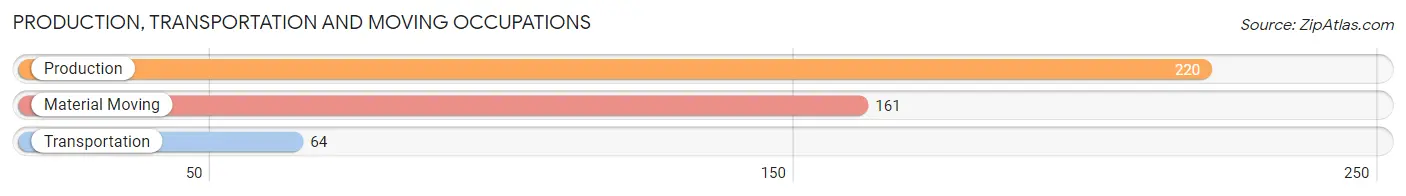
Production, Transportation and Moving Occupations
The most common Production, Transportation and Moving occupations in Du Quoin are Production (220 | 11.5%), Material Moving (161 | 8.4%), and Transportation (64 | 3.3%).
Production, Transportation and Moving Occupations by Sex
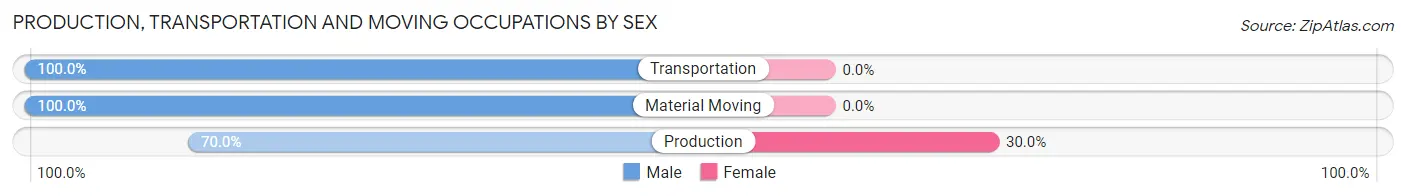
| Occupation | Male | Female |
| Production | 154 (70.0%) | 66 (30.0%) |
| Transportation | 64 (100.0%) | 0 (0.0%) |
| Material Moving | 161 (100.0%) | 0 (0.0%) |
| Total (Category) | 379 (85.2%) | 66 (14.8%) |
| Total (Overall) | 1,044 (54.4%) | 874 (45.6%) |
Employment Industries by Sex in Du Quoin
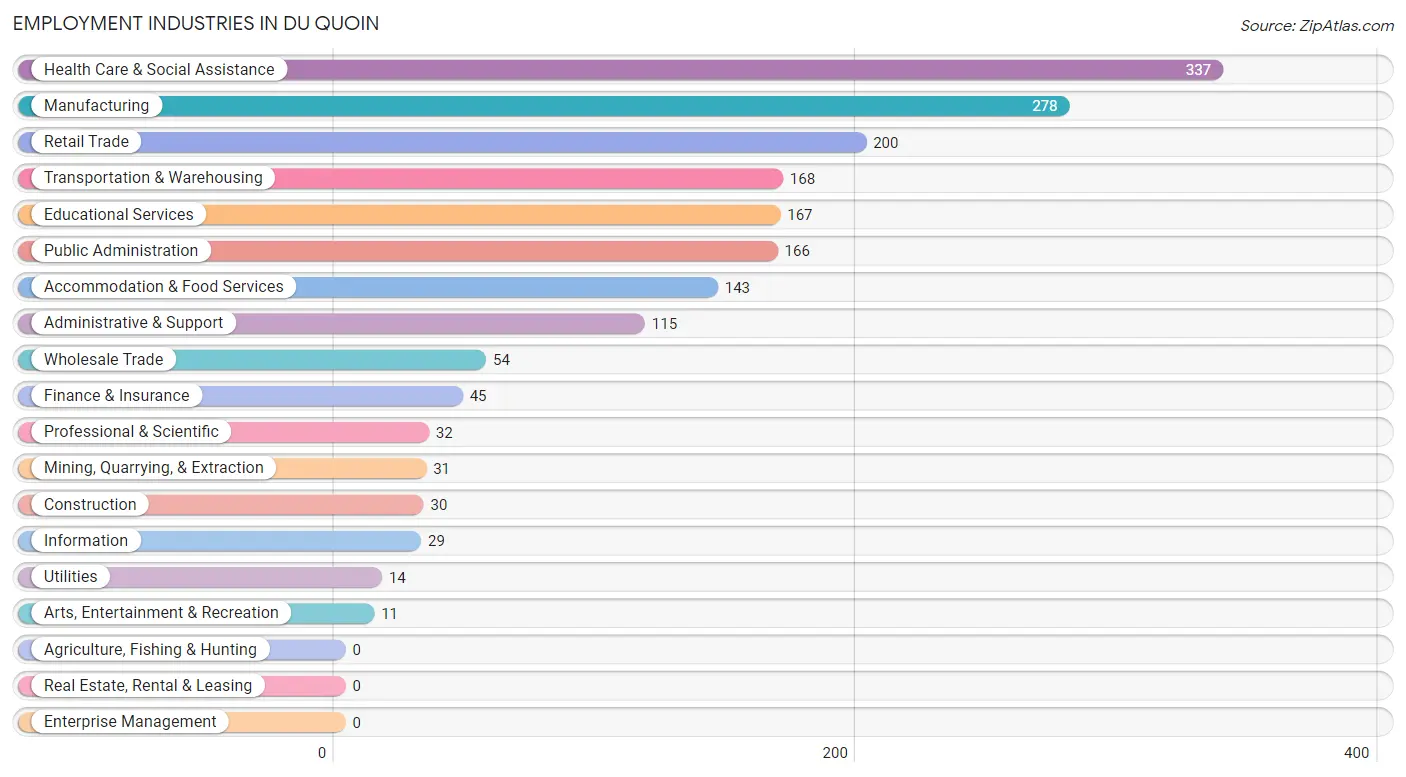
Employment Industries in Du Quoin
The major employment industries in Du Quoin include Health Care & Social Assistance (337 | 17.6%), Manufacturing (278 | 14.5%), Retail Trade (200 | 10.4%), Transportation & Warehousing (168 | 8.8%), and Educational Services (167 | 8.7%).
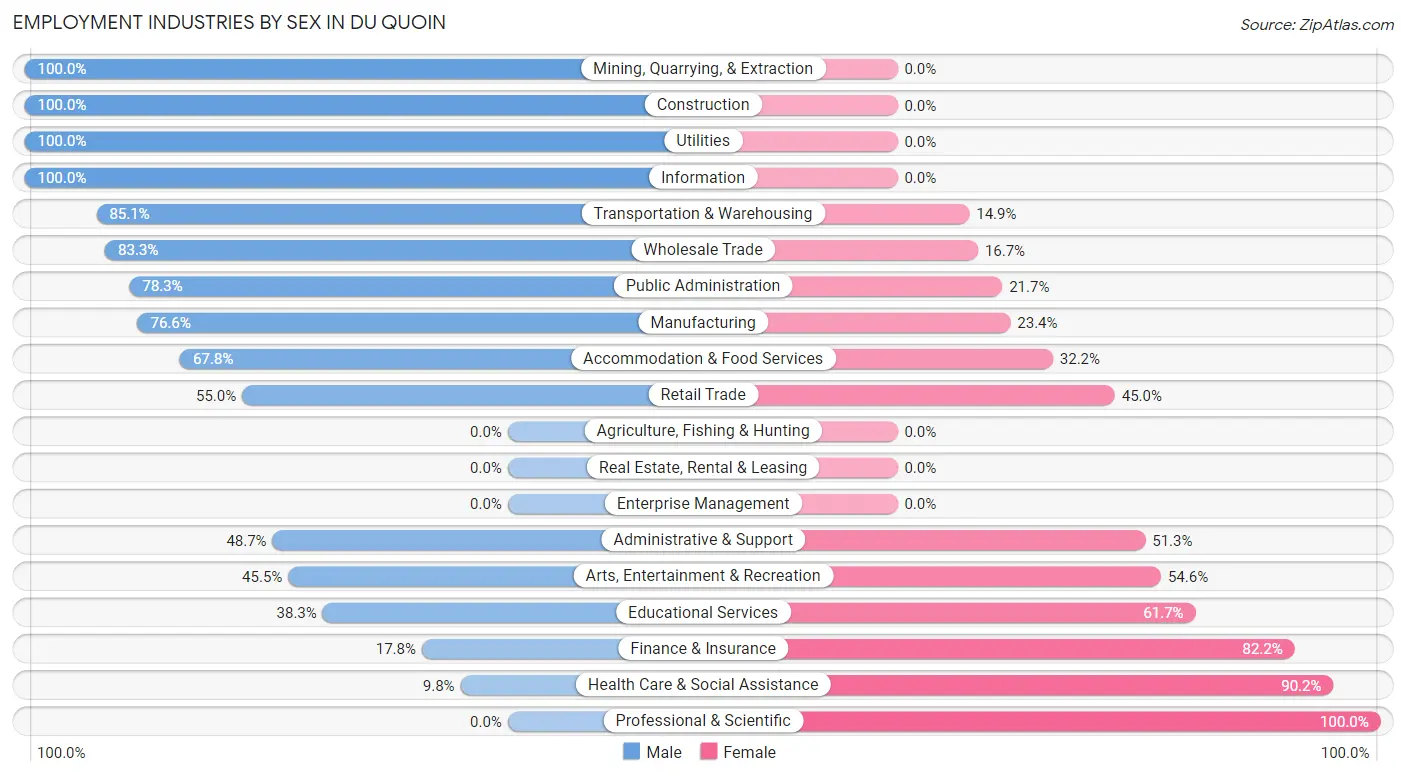
Employment Industries by Sex in Du Quoin
The Du Quoin industries that see more men than women are Mining, Quarrying, & Extraction (100.0%), Construction (100.0%), and Utilities (100.0%), whereas the industries that tend to have a higher number of women are Professional & Scientific (100.0%), Health Care & Social Assistance (90.2%), and Finance & Insurance (82.2%).
| Industry | Male | Female |
| Agriculture, Fishing & Hunting | 0 (0.0%) | 0 (0.0%) |
| Mining, Quarrying, & Extraction | 31 (100.0%) | 0 (0.0%) |
| Construction | 30 (100.0%) | 0 (0.0%) |
| Manufacturing | 213 (76.6%) | 65 (23.4%) |
| Wholesale Trade | 45 (83.3%) | 9 (16.7%) |
| Retail Trade | 110 (55.0%) | 90 (45.0%) |
| Transportation & Warehousing | 143 (85.1%) | 25 (14.9%) |
| Utilities | 14 (100.0%) | 0 (0.0%) |
| Information | 29 (100.0%) | 0 (0.0%) |
| Finance & Insurance | 8 (17.8%) | 37 (82.2%) |
| Real Estate, Rental & Leasing | 0 (0.0%) | 0 (0.0%) |
| Professional & Scientific | 0 (0.0%) | 32 (100.0%) |
| Enterprise Management | 0 (0.0%) | 0 (0.0%) |
| Administrative & Support | 56 (48.7%) | 59 (51.3%) |
| Educational Services | 64 (38.3%) | 103 (61.7%) |
| Health Care & Social Assistance | 33 (9.8%) | 304 (90.2%) |
| Arts, Entertainment & Recreation | 5 (45.5%) | 6 (54.5%) |
| Accommodation & Food Services | 97 (67.8%) | 46 (32.2%) |
| Public Administration | 130 (78.3%) | 36 (21.7%) |
| Total | 1,044 (54.4%) | 874 (45.6%) |
Education in Du Quoin
School Enrollment in Du Quoin
The most common levels of schooling among the 1,303 students in Du Quoin are high school (388 | 29.8%), elementary school (315 | 24.2%), and middle school (197 | 15.1%).
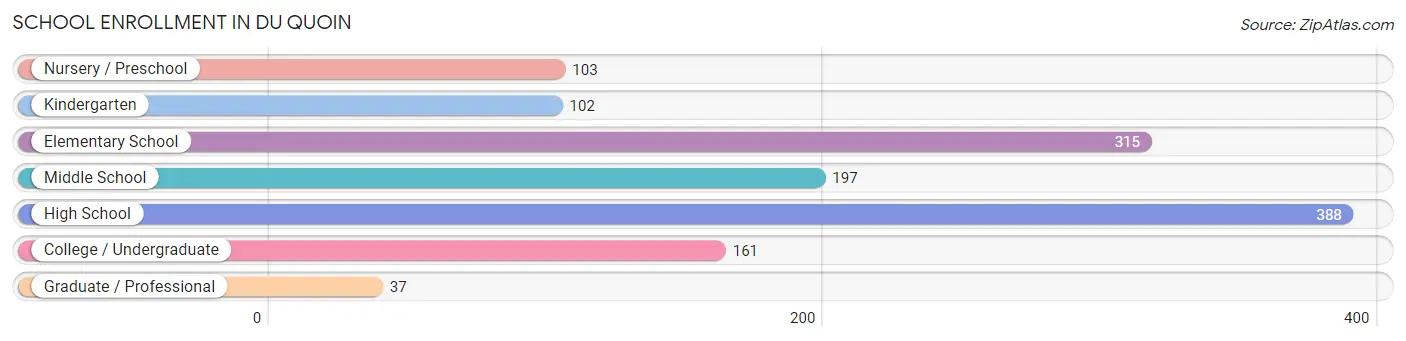
| School Level | # Students | % Students |
| Nursery / Preschool | 103 | 7.9% |
| Kindergarten | 102 | 7.8% |
| Elementary School | 315 | 24.2% |
| Middle School | 197 | 15.1% |
| High School | 388 | 29.8% |
| College / Undergraduate | 161 | 12.4% |
| Graduate / Professional | 37 | 2.8% |
| Total | 1,303 | 100.0% |
School Enrollment by Age by Funding Source in Du Quoin
Out of a total of 1,303 students who are enrolled in schools in Du Quoin, 66 (5.1%) attend a private institution, while the remaining 1,237 (94.9%) are enrolled in public schools. The age group of 25 to 34 year olds has the highest likelihood of being enrolled in private schools, with 18 (39.1% in the age bracket) enrolled. Conversely, the age group of 3 to 4 year olds has the lowest likelihood of being enrolled in a private school, with 77 (100.0% in the age bracket) attending a public institution.
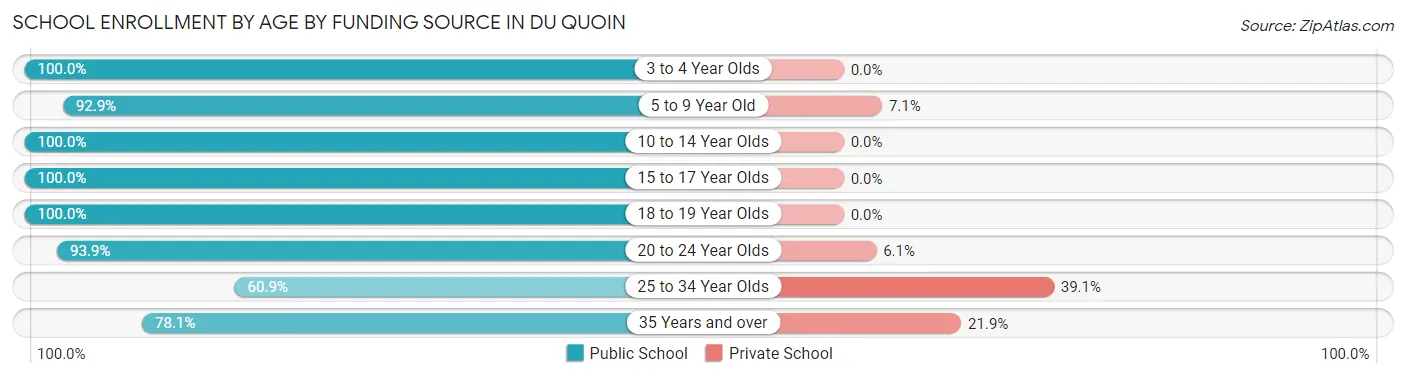
| Age Bracket | Public School | Private School |
| 3 to 4 Year Olds | 77 (100.0%) | 0 (0.0%) |
| 5 to 9 Year Old | 403 (92.9%) | 31 (7.1%) |
| 10 to 14 Year Olds | 241 (100.0%) | 0 (0.0%) |
| 15 to 17 Year Olds | 279 (100.0%) | 0 (0.0%) |
| 18 to 19 Year Olds | 96 (100.0%) | 0 (0.0%) |
| 20 to 24 Year Olds | 62 (93.9%) | 4 (6.1%) |
| 25 to 34 Year Olds | 28 (60.9%) | 18 (39.1%) |
| 35 Years and over | 50 (78.1%) | 14 (21.9%) |
| Total | 1,237 (94.9%) | 66 (5.1%) |
Educational Attainment by Field of Study in Du Quoin
Education (135 | 32.5%), arts & humanities (65 | 15.6%), business (64 | 15.4%), computers & mathematics (49 | 11.8%), and science & technology (41 | 9.9%) are the most common fields of study among 416 individuals in Du Quoin who have obtained a bachelor's degree or higher.
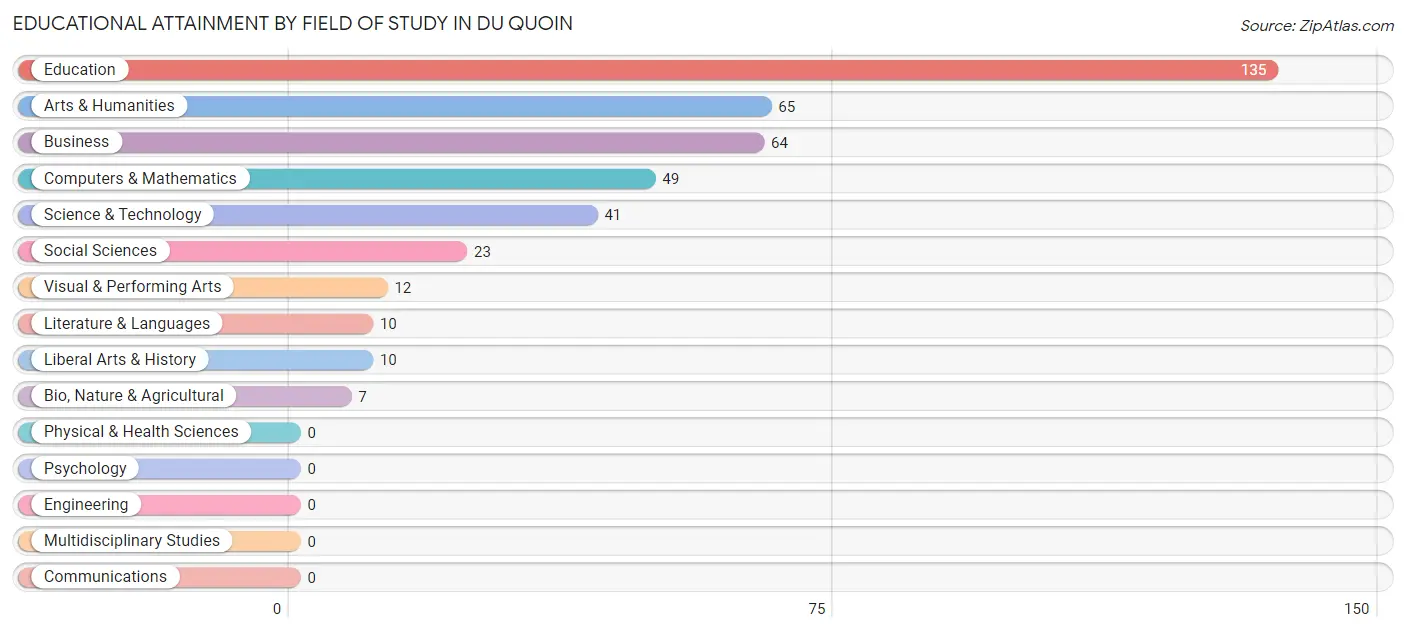
| Field of Study | # Graduates | % Graduates |
| Computers & Mathematics | 49 | 11.8% |
| Bio, Nature & Agricultural | 7 | 1.7% |
| Physical & Health Sciences | 0 | 0.0% |
| Psychology | 0 | 0.0% |
| Social Sciences | 23 | 5.5% |
| Engineering | 0 | 0.0% |
| Multidisciplinary Studies | 0 | 0.0% |
| Science & Technology | 41 | 9.9% |
| Business | 64 | 15.4% |
| Education | 135 | 32.5% |
| Literature & Languages | 10 | 2.4% |
| Liberal Arts & History | 10 | 2.4% |
| Visual & Performing Arts | 12 | 2.9% |
| Communications | 0 | 0.0% |
| Arts & Humanities | 65 | 15.6% |
| Total | 416 | 100.0% |
Transportation & Commute in Du Quoin
Vehicle Availability by Sex in Du Quoin
The most prevalent vehicle ownership categories in Du Quoin are males with 2 vehicles (453, accounting for 43.4%) and females with 2 vehicles (378, making up 52.2%).
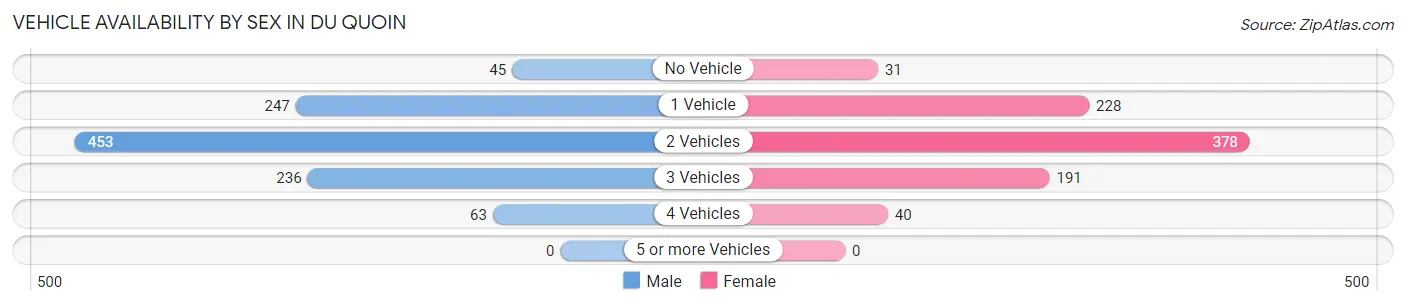
| Vehicles Available | Male | Female |
| No Vehicle | 45 (4.3%) | 31 (3.6%) |
| 1 Vehicle | 247 (23.7%) | 228 (26.3%) |
| 2 Vehicles | 453 (43.4%) | 378 (43.5%) |
| 3 Vehicles | 236 (22.6%) | 191 (22.0%) |
| 4 Vehicles | 63 (6.0%) | 40 (4.6%) |
| 5 or more Vehicles | 0 (0.0%) | 0 (0.0%) |
| Total | 1,044 (100.0%) | 868 (100.0%) |
Commute Time in Du Quoin
The most frequently occuring commute durations in Du Quoin are 5 to 9 minutes (377 commuters, 20.0%), less than 5 minutes (232 commuters, 12.3%), and 45 to 59 minutes (221 commuters, 11.7%).
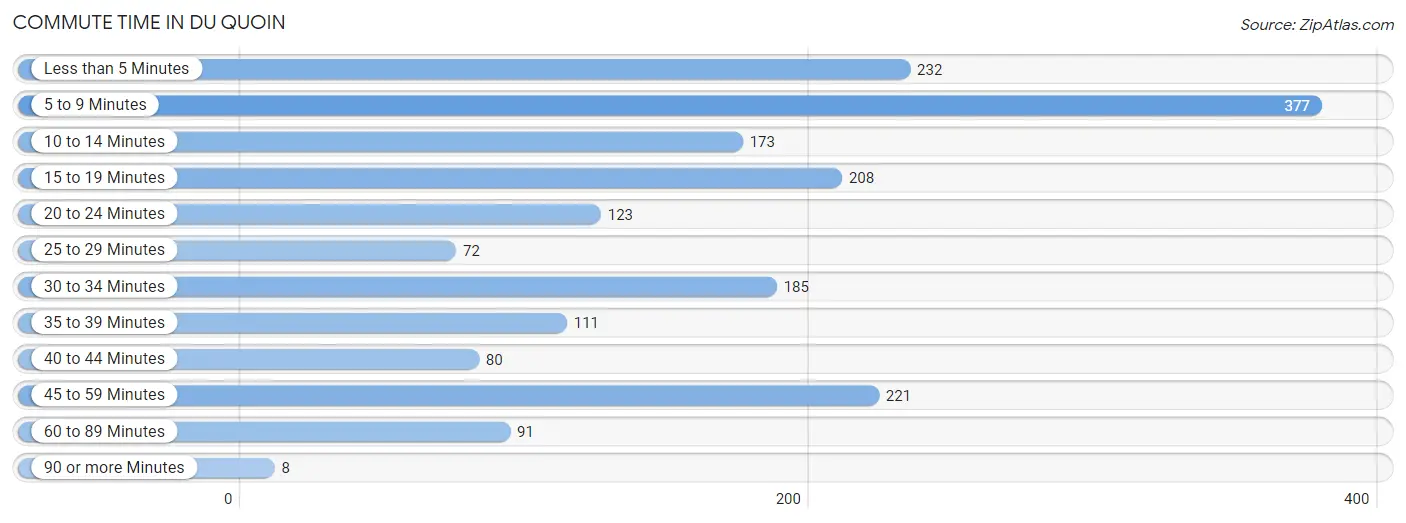
| Commute Time | # Commuters | % Commuters |
| Less than 5 Minutes | 232 | 12.3% |
| 5 to 9 Minutes | 377 | 20.0% |
| 10 to 14 Minutes | 173 | 9.2% |
| 15 to 19 Minutes | 208 | 11.1% |
| 20 to 24 Minutes | 123 | 6.5% |
| 25 to 29 Minutes | 72 | 3.8% |
| 30 to 34 Minutes | 185 | 9.8% |
| 35 to 39 Minutes | 111 | 5.9% |
| 40 to 44 Minutes | 80 | 4.3% |
| 45 to 59 Minutes | 221 | 11.7% |
| 60 to 89 Minutes | 91 | 4.8% |
| 90 or more Minutes | 8 | 0.4% |
Commute Time by Sex in Du Quoin
The most common commute times in Du Quoin are 5 to 9 minutes (270 commuters, 26.6%) for males and 30 to 34 minutes (155 commuters, 17.9%) for females.
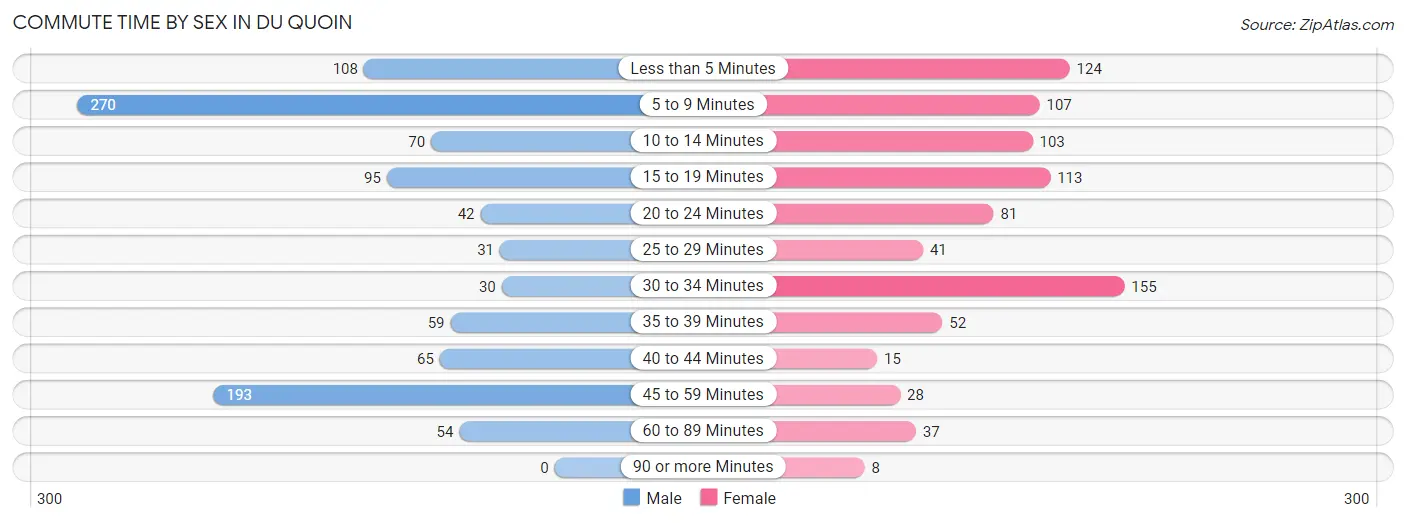
| Commute Time | Male | Female |
| Less than 5 Minutes | 108 (10.6%) | 124 (14.3%) |
| 5 to 9 Minutes | 270 (26.6%) | 107 (12.4%) |
| 10 to 14 Minutes | 70 (6.9%) | 103 (11.9%) |
| 15 to 19 Minutes | 95 (9.3%) | 113 (13.1%) |
| 20 to 24 Minutes | 42 (4.1%) | 81 (9.4%) |
| 25 to 29 Minutes | 31 (3.0%) | 41 (4.8%) |
| 30 to 34 Minutes | 30 (2.9%) | 155 (17.9%) |
| 35 to 39 Minutes | 59 (5.8%) | 52 (6.0%) |
| 40 to 44 Minutes | 65 (6.4%) | 15 (1.7%) |
| 45 to 59 Minutes | 193 (19.0%) | 28 (3.2%) |
| 60 to 89 Minutes | 54 (5.3%) | 37 (4.3%) |
| 90 or more Minutes | 0 (0.0%) | 8 (0.9%) |
Time of Departure to Work by Sex in Du Quoin
The most frequent times of departure to work in Du Quoin are 4:00 PM to 11:59 PM (252, 24.8%) for males and 7:30 AM to 7:59 AM (260, 30.1%) for females.
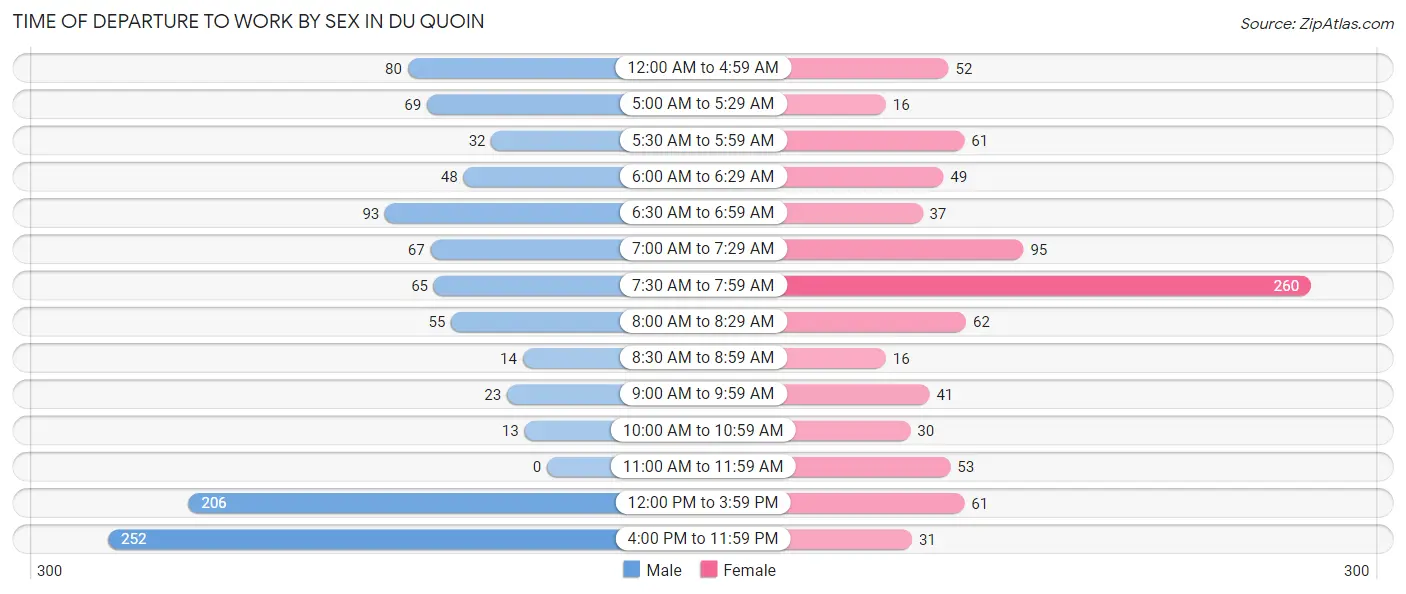
| Time of Departure | Male | Female |
| 12:00 AM to 4:59 AM | 80 (7.9%) | 52 (6.0%) |
| 5:00 AM to 5:29 AM | 69 (6.8%) | 16 (1.8%) |
| 5:30 AM to 5:59 AM | 32 (3.2%) | 61 (7.1%) |
| 6:00 AM to 6:29 AM | 48 (4.7%) | 49 (5.7%) |
| 6:30 AM to 6:59 AM | 93 (9.1%) | 37 (4.3%) |
| 7:00 AM to 7:29 AM | 67 (6.6%) | 95 (11.0%) |
| 7:30 AM to 7:59 AM | 65 (6.4%) | 260 (30.1%) |
| 8:00 AM to 8:29 AM | 55 (5.4%) | 62 (7.2%) |
| 8:30 AM to 8:59 AM | 14 (1.4%) | 16 (1.8%) |
| 9:00 AM to 9:59 AM | 23 (2.3%) | 41 (4.8%) |
| 10:00 AM to 10:59 AM | 13 (1.3%) | 30 (3.5%) |
| 11:00 AM to 11:59 AM | 0 (0.0%) | 53 (6.1%) |
| 12:00 PM to 3:59 PM | 206 (20.3%) | 61 (7.1%) |
| 4:00 PM to 11:59 PM | 252 (24.8%) | 31 (3.6%) |
| Total | 1,017 (100.0%) | 864 (100.0%) |
Housing Occupancy in Du Quoin
Occupancy by Ownership in Du Quoin
Of the total 2,532 dwellings in Du Quoin, owner-occupied units account for 1,594 (62.9%), while renter-occupied units make up 938 (37.0%).
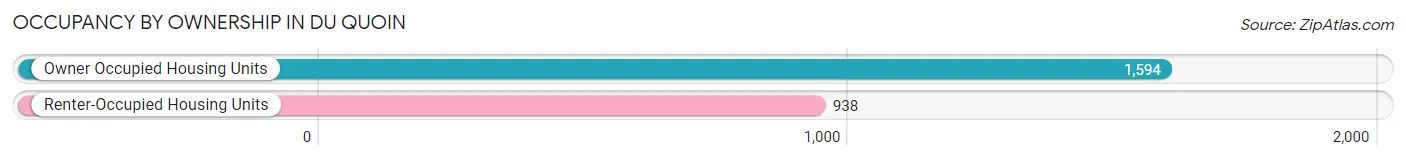
| Occupancy | # Housing Units | % Housing Units |
| Owner Occupied Housing Units | 1,594 | 62.9% |
| Renter-Occupied Housing Units | 938 | 37.0% |
| Total Occupied Housing Units | 2,532 | 100.0% |
Occupancy by Household Size in Du Quoin
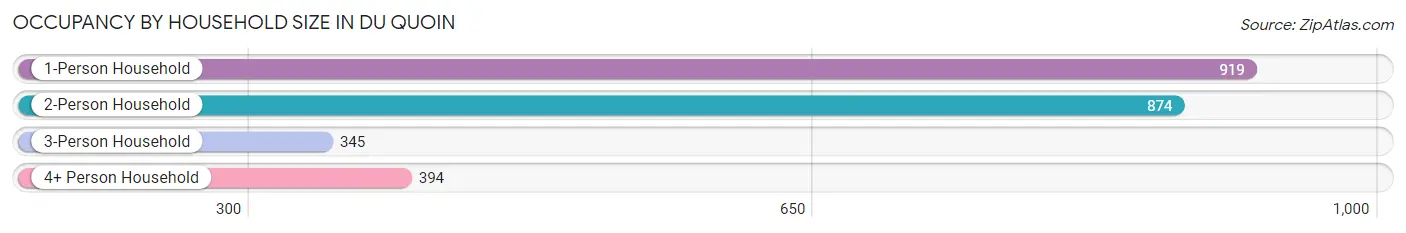
| Household Size | # Housing Units | % Housing Units |
| 1-Person Household | 919 | 36.3% |
| 2-Person Household | 874 | 34.5% |
| 3-Person Household | 345 | 13.6% |
| 4+ Person Household | 394 | 15.6% |
| Total Housing Units | 2,532 | 100.0% |
Occupancy by Ownership by Household Size in Du Quoin
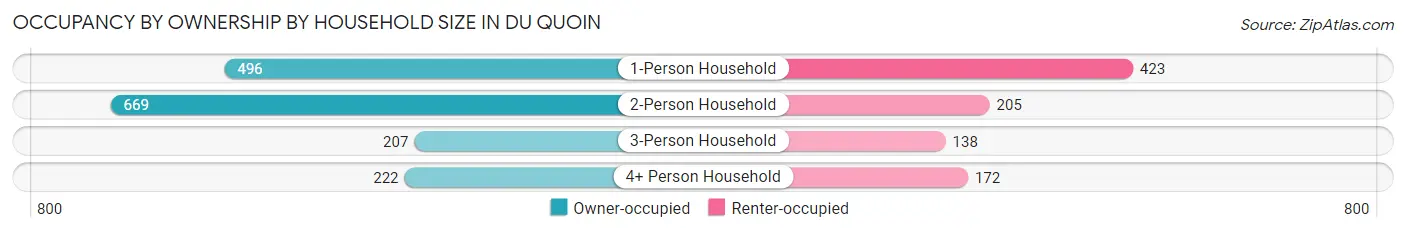
| Household Size | Owner-occupied | Renter-occupied |
| 1-Person Household | 496 (54.0%) | 423 (46.0%) |
| 2-Person Household | 669 (76.5%) | 205 (23.5%) |
| 3-Person Household | 207 (60.0%) | 138 (40.0%) |
| 4+ Person Household | 222 (56.4%) | 172 (43.6%) |
| Total Housing Units | 1,594 (62.9%) | 938 (37.0%) |
Occupancy by Educational Attainment in Du Quoin
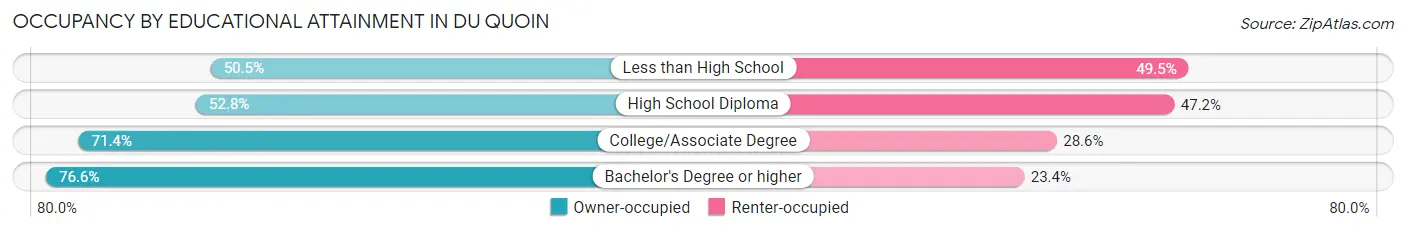
| Household Size | Owner-occupied | Renter-occupied |
| Less than High School | 162 (50.5%) | 159 (49.5%) |
| High School Diploma | 456 (52.8%) | 408 (47.2%) |
| College/Associate Degree | 770 (71.4%) | 308 (28.6%) |
| Bachelor's Degree or higher | 206 (76.6%) | 63 (23.4%) |
Occupancy by Age of Householder in Du Quoin
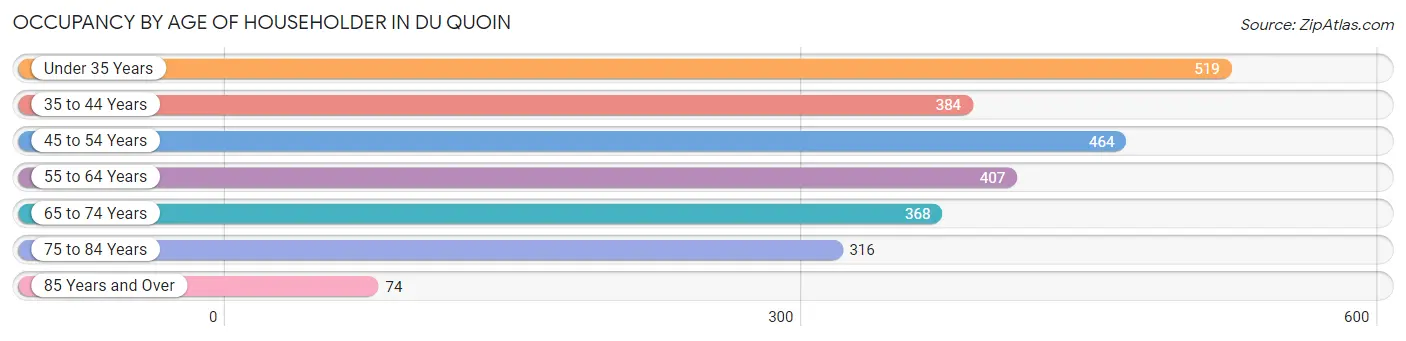
| Age Bracket | # Households | % Households |
| Under 35 Years | 519 | 20.5% |
| 35 to 44 Years | 384 | 15.2% |
| 45 to 54 Years | 464 | 18.3% |
| 55 to 64 Years | 407 | 16.1% |
| 65 to 74 Years | 368 | 14.5% |
| 75 to 84 Years | 316 | 12.5% |
| 85 Years and Over | 74 | 2.9% |
| Total | 2,532 | 100.0% |
Housing Finances in Du Quoin
Median Income by Occupancy in Du Quoin
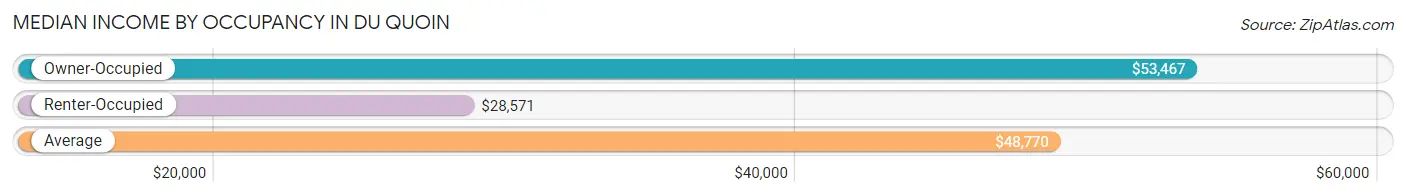
| Occupancy Type | # Households | Median Income |
| Owner-Occupied | 1,594 (62.9%) | $53,467 |
| Renter-Occupied | 938 (37.0%) | $28,571 |
| Average | 2,532 (100.0%) | $48,770 |
Occupancy by Householder Income Bracket in Du Quoin
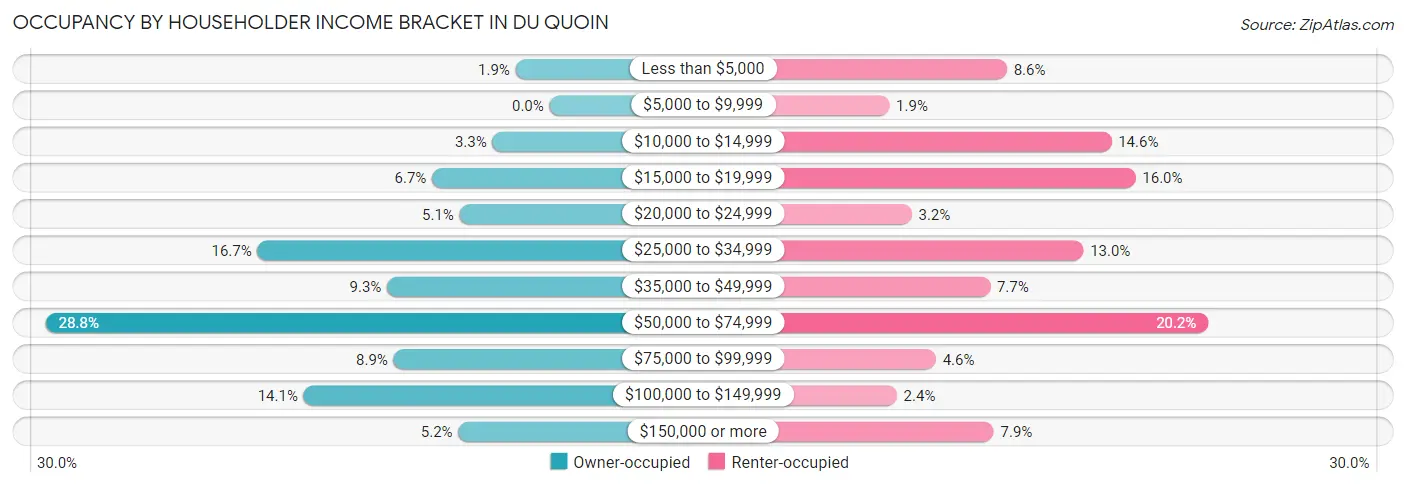
| Income Bracket | Owner-occupied | Renter-occupied |
| Less than $5,000 | 31 (1.9%) | 81 (8.6%) |
| $5,000 to $9,999 | 0 (0.0%) | 18 (1.9%) |
| $10,000 to $14,999 | 52 (3.3%) | 137 (14.6%) |
| $15,000 to $19,999 | 107 (6.7%) | 150 (16.0%) |
| $20,000 to $24,999 | 82 (5.1%) | 30 (3.2%) |
| $25,000 to $34,999 | 266 (16.7%) | 122 (13.0%) |
| $35,000 to $49,999 | 148 (9.3%) | 72 (7.7%) |
| $50,000 to $74,999 | 459 (28.8%) | 189 (20.2%) |
| $75,000 to $99,999 | 142 (8.9%) | 43 (4.6%) |
| $100,000 to $149,999 | 224 (14.1%) | 22 (2.4%) |
| $150,000 or more | 83 (5.2%) | 74 (7.9%) |
| Total | 1,594 (100.0%) | 938 (100.0%) |
Monthly Housing Cost Tiers in Du Quoin
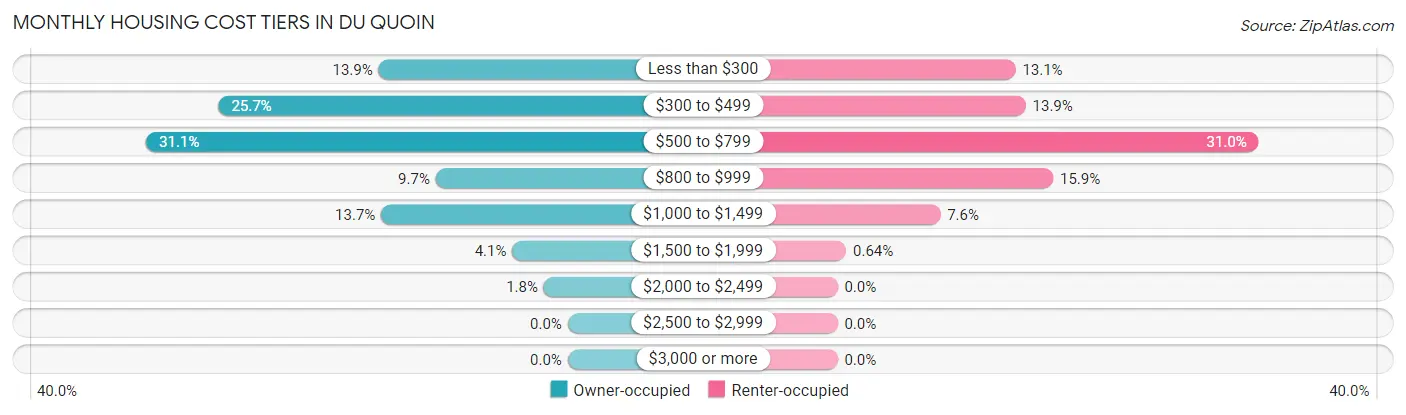
| Monthly Cost | Owner-occupied | Renter-occupied |
| Less than $300 | 222 (13.9%) | 123 (13.1%) |
| $300 to $499 | 410 (25.7%) | 130 (13.9%) |
| $500 to $799 | 495 (31.0%) | 291 (31.0%) |
| $800 to $999 | 155 (9.7%) | 149 (15.9%) |
| $1,000 to $1,499 | 219 (13.7%) | 71 (7.6%) |
| $1,500 to $1,999 | 65 (4.1%) | 6 (0.6%) |
| $2,000 to $2,499 | 28 (1.8%) | 0 (0.0%) |
| $2,500 to $2,999 | 0 (0.0%) | 0 (0.0%) |
| $3,000 or more | 0 (0.0%) | 0 (0.0%) |
| Total | 1,594 (100.0%) | 938 (100.0%) |
Physical Housing Characteristics in Du Quoin
Housing Structures in Du Quoin
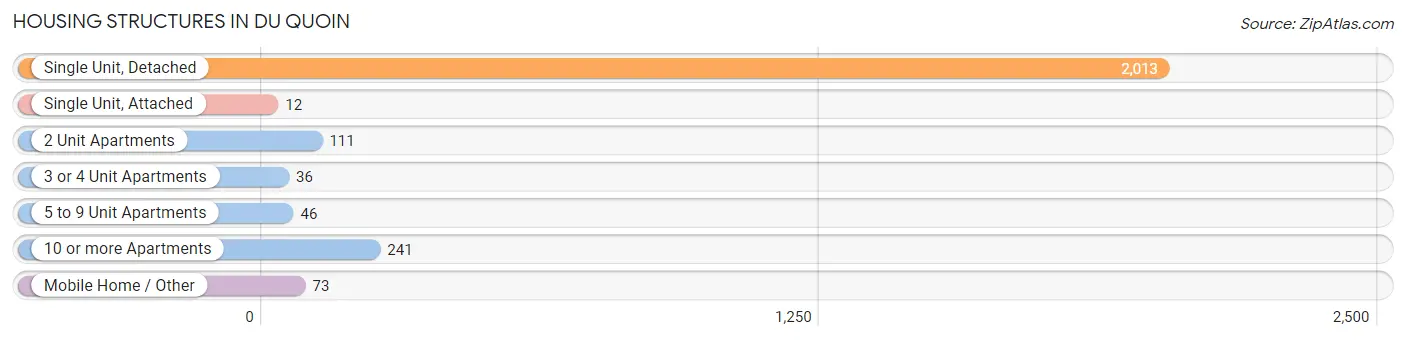
| Structure Type | # Housing Units | % Housing Units |
| Single Unit, Detached | 2,013 | 79.5% |
| Single Unit, Attached | 12 | 0.5% |
| 2 Unit Apartments | 111 | 4.4% |
| 3 or 4 Unit Apartments | 36 | 1.4% |
| 5 to 9 Unit Apartments | 46 | 1.8% |
| 10 or more Apartments | 241 | 9.5% |
| Mobile Home / Other | 73 | 2.9% |
| Total | 2,532 | 100.0% |
Housing Structures by Occupancy in Du Quoin
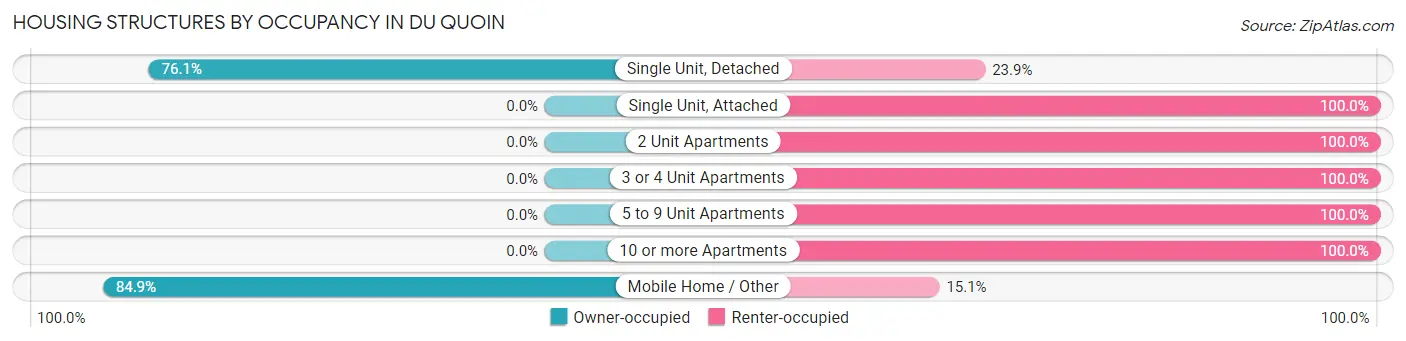
| Structure Type | Owner-occupied | Renter-occupied |
| Single Unit, Detached | 1,532 (76.1%) | 481 (23.9%) |
| Single Unit, Attached | 0 (0.0%) | 12 (100.0%) |
| 2 Unit Apartments | 0 (0.0%) | 111 (100.0%) |
| 3 or 4 Unit Apartments | 0 (0.0%) | 36 (100.0%) |
| 5 to 9 Unit Apartments | 0 (0.0%) | 46 (100.0%) |
| 10 or more Apartments | 0 (0.0%) | 241 (100.0%) |
| Mobile Home / Other | 62 (84.9%) | 11 (15.1%) |
| Total | 1,594 (62.9%) | 938 (37.0%) |
Housing Structures by Number of Rooms in Du Quoin
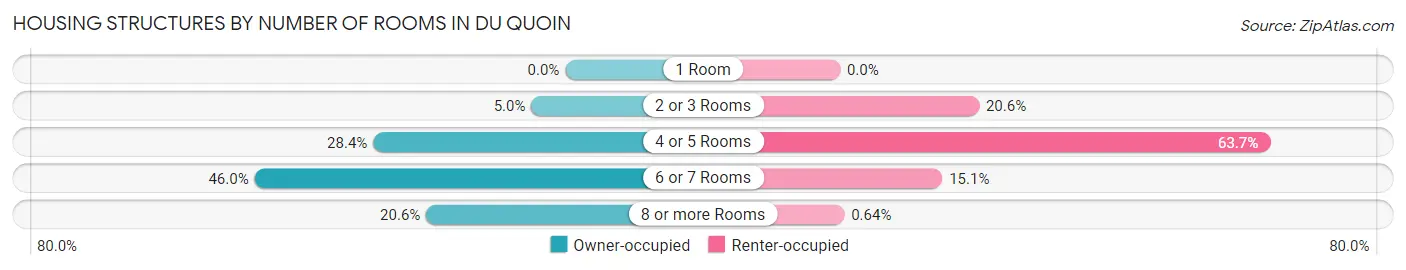
| Number of Rooms | Owner-occupied | Renter-occupied |
| 1 Room | 0 (0.0%) | 0 (0.0%) |
| 2 or 3 Rooms | 80 (5.0%) | 193 (20.6%) |
| 4 or 5 Rooms | 453 (28.4%) | 597 (63.6%) |
| 6 or 7 Rooms | 733 (46.0%) | 142 (15.1%) |
| 8 or more Rooms | 328 (20.6%) | 6 (0.6%) |
| Total | 1,594 (100.0%) | 938 (100.0%) |
Housing Structure by Heating Type in Du Quoin
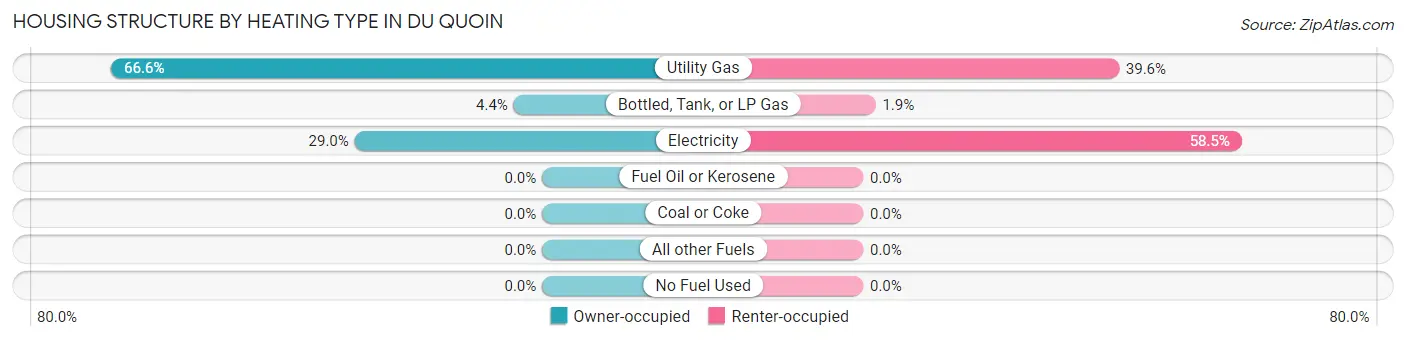
| Heating Type | Owner-occupied | Renter-occupied |
| Utility Gas | 1,062 (66.6%) | 371 (39.6%) |
| Bottled, Tank, or LP Gas | 70 (4.4%) | 18 (1.9%) |
| Electricity | 462 (29.0%) | 549 (58.5%) |
| Fuel Oil or Kerosene | 0 (0.0%) | 0 (0.0%) |
| Coal or Coke | 0 (0.0%) | 0 (0.0%) |
| All other Fuels | 0 (0.0%) | 0 (0.0%) |
| No Fuel Used | 0 (0.0%) | 0 (0.0%) |
| Total | 1,594 (100.0%) | 938 (100.0%) |
Household Vehicle Usage in Du Quoin
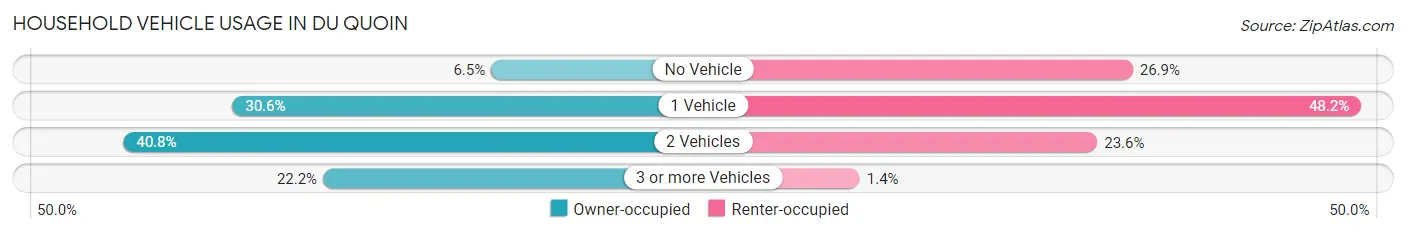
| Vehicles per Household | Owner-occupied | Renter-occupied |
| No Vehicle | 103 (6.5%) | 252 (26.9%) |
| 1 Vehicle | 488 (30.6%) | 452 (48.2%) |
| 2 Vehicles | 650 (40.8%) | 221 (23.6%) |
| 3 or more Vehicles | 353 (22.2%) | 13 (1.4%) |
| Total | 1,594 (100.0%) | 938 (100.0%) |
Real Estate & Mortgages in Du Quoin
Real Estate and Mortgage Overview in Du Quoin
| Characteristic | Without Mortgage | With Mortgage |
| Housing Units | 966 | 628 |
| Median Property Value | $84,200 | $78,700 |
| Median Household Income | $48,810 | $53 |
| Monthly Housing Costs | $442 | $0 |
| Real Estate Taxes | $1,460 | $22 |
Property Value by Mortgage Status in Du Quoin
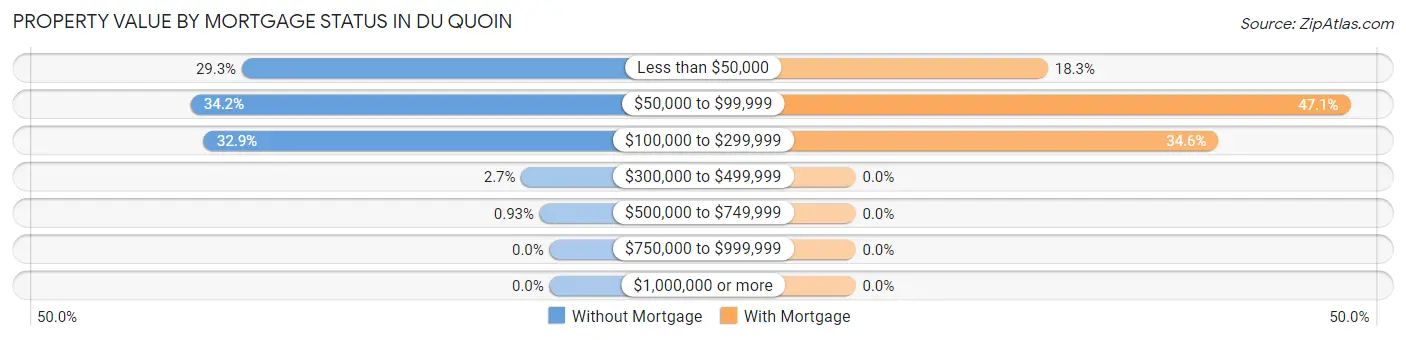
| Property Value | Without Mortgage | With Mortgage |
| Less than $50,000 | 283 (29.3%) | 115 (18.3%) |
| $50,000 to $99,999 | 330 (34.2%) | 296 (47.1%) |
| $100,000 to $299,999 | 318 (32.9%) | 217 (34.5%) |
| $300,000 to $499,999 | 26 (2.7%) | 0 (0.0%) |
| $500,000 to $749,999 | 9 (0.9%) | 0 (0.0%) |
| $750,000 to $999,999 | 0 (0.0%) | 0 (0.0%) |
| $1,000,000 or more | 0 (0.0%) | 0 (0.0%) |
| Total | 966 (100.0%) | 628 (100.0%) |
Household Income by Mortgage Status in Du Quoin
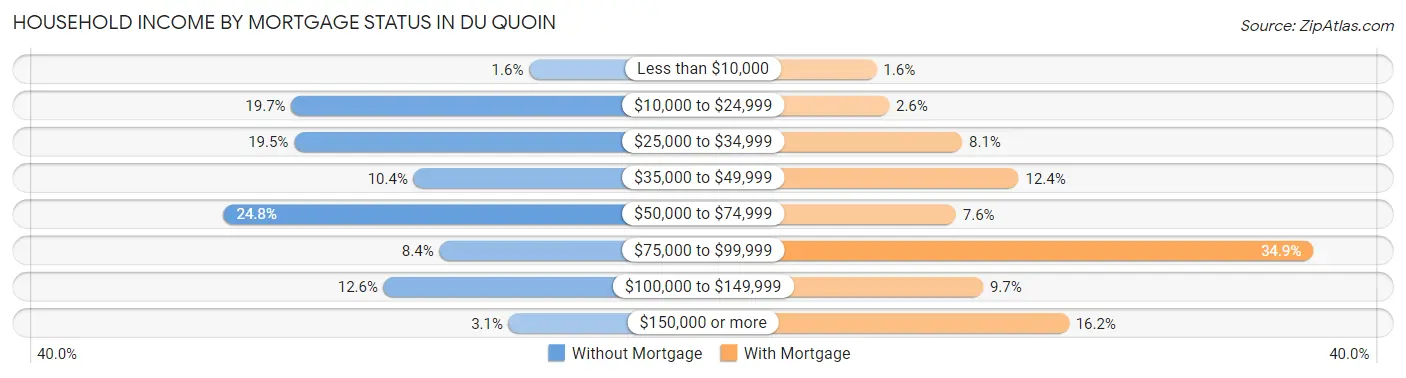
| Household Income | Without Mortgage | With Mortgage |
| Less than $10,000 | 15 (1.5%) | 10 (1.6%) |
| $10,000 to $24,999 | 190 (19.7%) | 16 (2.5%) |
| $25,000 to $34,999 | 188 (19.5%) | 51 (8.1%) |
| $35,000 to $49,999 | 100 (10.3%) | 78 (12.4%) |
| $50,000 to $74,999 | 240 (24.8%) | 48 (7.6%) |
| $75,000 to $99,999 | 81 (8.4%) | 219 (34.9%) |
| $100,000 to $149,999 | 122 (12.6%) | 61 (9.7%) |
| $150,000 or more | 30 (3.1%) | 102 (16.2%) |
| Total | 966 (100.0%) | 628 (100.0%) |
Property Value to Household Income Ratio in Du Quoin
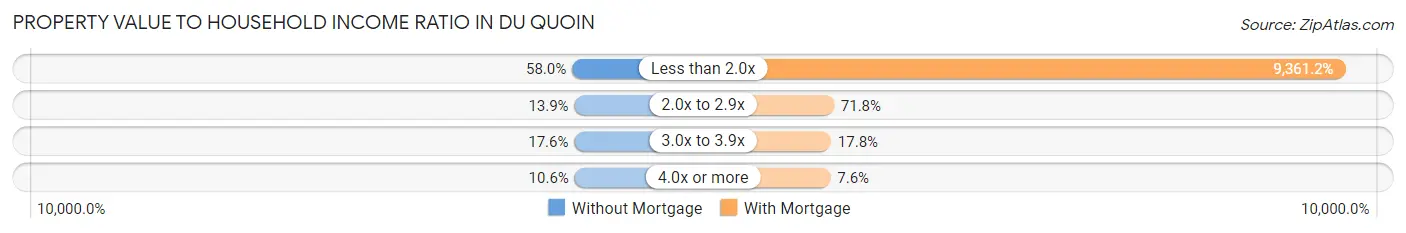
| Value-to-Income Ratio | Without Mortgage | With Mortgage |
| Less than 2.0x | 560 (58.0%) | 58,788 (9,361.2%) |
| 2.0x to 2.9x | 134 (13.9%) | 451 (71.8%) |
| 3.0x to 3.9x | 170 (17.6%) | 112 (17.8%) |
| 4.0x or more | 102 (10.6%) | 48 (7.6%) |
| Total | 966 (100.0%) | 628 (100.0%) |
Real Estate Taxes by Mortgage Status in Du Quoin
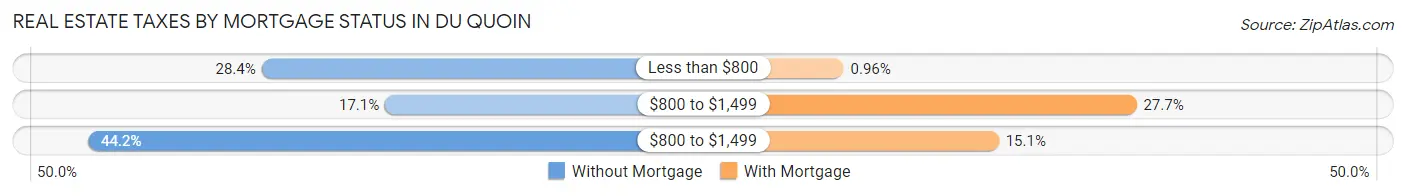
| Property Taxes | Without Mortgage | With Mortgage |
| Less than $800 | 274 (28.4%) | 6 (1.0%) |
| $800 to $1,499 | 165 (17.1%) | 174 (27.7%) |
| $800 to $1,499 | 427 (44.2%) | 95 (15.1%) |
| Total | 966 (100.0%) | 628 (100.0%) |
Health & Disability in Du Quoin
Health Insurance Coverage by Age in Du Quoin
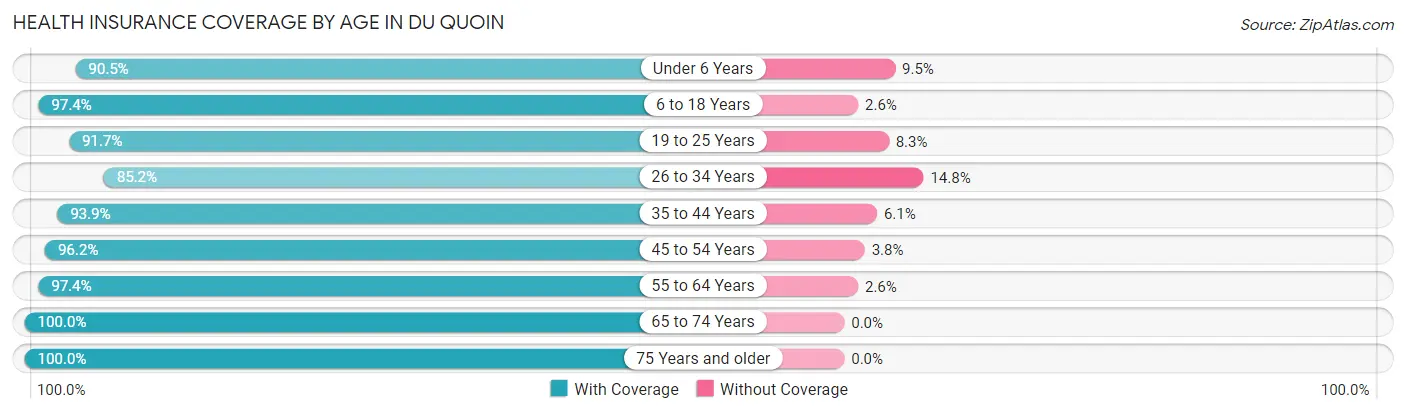
| Age Bracket | With Coverage | Without Coverage |
| Under 6 Years | 277 (90.5%) | 29 (9.5%) |
| 6 to 18 Years | 943 (97.4%) | 25 (2.6%) |
| 19 to 25 Years | 543 (91.7%) | 49 (8.3%) |
| 26 to 34 Years | 375 (85.2%) | 65 (14.8%) |
| 35 to 44 Years | 648 (93.9%) | 42 (6.1%) |
| 45 to 54 Years | 808 (96.2%) | 32 (3.8%) |
| 55 to 64 Years | 648 (97.4%) | 17 (2.6%) |
| 65 to 74 Years | 573 (100.0%) | 0 (0.0%) |
| 75 Years and older | 526 (100.0%) | 0 (0.0%) |
| Total | 5,341 (95.4%) | 259 (4.6%) |
Health Insurance Coverage by Citizenship Status in Du Quoin
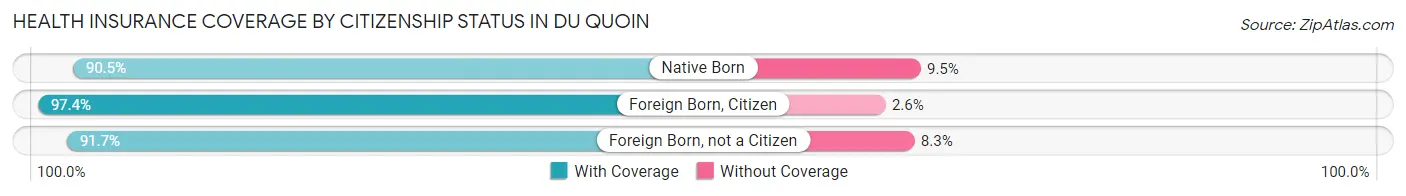
| Citizenship Status | With Coverage | Without Coverage |
| Native Born | 277 (90.5%) | 29 (9.5%) |
| Foreign Born, Citizen | 943 (97.4%) | 25 (2.6%) |
| Foreign Born, not a Citizen | 543 (91.7%) | 49 (8.3%) |
Health Insurance Coverage by Household Income in Du Quoin
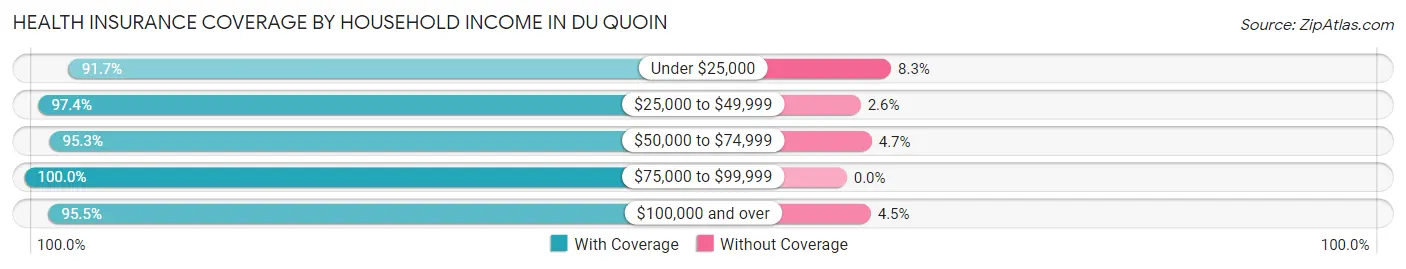
| Household Income | With Coverage | Without Coverage |
| Under $25,000 | 1,193 (91.7%) | 108 (8.3%) |
| $25,000 to $49,999 | 1,304 (97.4%) | 35 (2.6%) |
| $50,000 to $74,999 | 1,366 (95.3%) | 67 (4.7%) |
| $75,000 to $99,999 | 419 (100.0%) | 0 (0.0%) |
| $100,000 and over | 1,040 (95.5%) | 49 (4.5%) |
Public vs Private Health Insurance Coverage by Age in Du Quoin
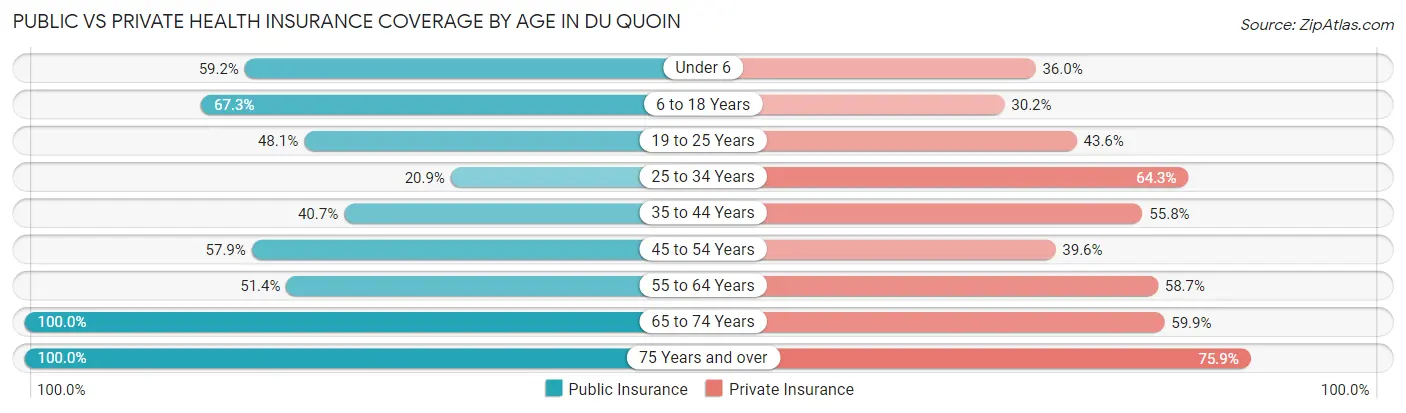
| Age Bracket | Public Insurance | Private Insurance |
| Under 6 | 181 (59.2%) | 110 (35.9%) |
| 6 to 18 Years | 651 (67.2%) | 292 (30.2%) |
| 19 to 25 Years | 285 (48.1%) | 258 (43.6%) |
| 25 to 34 Years | 92 (20.9%) | 283 (64.3%) |
| 35 to 44 Years | 281 (40.7%) | 385 (55.8%) |
| 45 to 54 Years | 486 (57.9%) | 333 (39.6%) |
| 55 to 64 Years | 342 (51.4%) | 390 (58.7%) |
| 65 to 74 Years | 573 (100.0%) | 343 (59.9%) |
| 75 Years and over | 526 (100.0%) | 399 (75.9%) |
| Total | 3,417 (61.0%) | 2,793 (49.9%) |
Disability Status by Sex by Age in Du Quoin
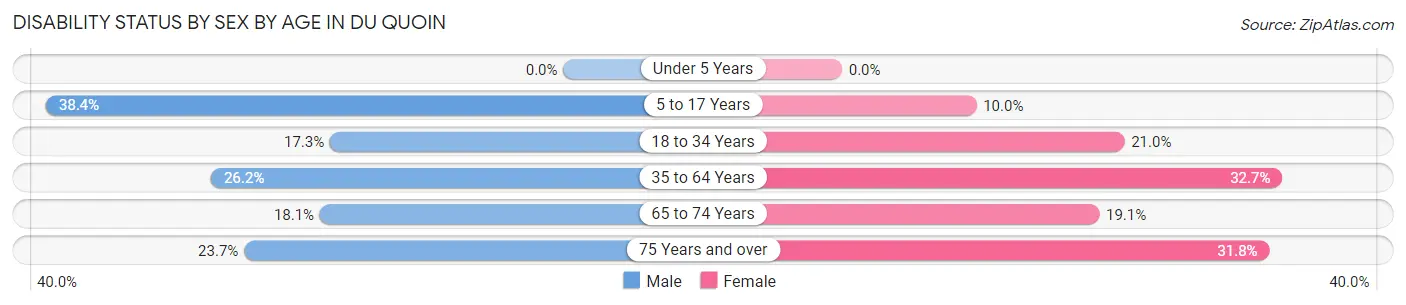
| Age Bracket | Male | Female |
| Under 5 Years | 0 (0.0%) | 0 (0.0%) |
| 5 to 17 Years | 204 (38.4%) | 44 (10.0%) |
| 18 to 34 Years | 101 (17.3%) | 108 (21.0%) |
| 35 to 64 Years | 299 (26.2%) | 344 (32.7%) |
| 65 to 74 Years | 43 (18.1%) | 64 (19.1%) |
| 75 Years and over | 50 (23.7%) | 100 (31.8%) |
Disability Class by Sex by Age in Du Quoin
Disability Class: Hearing Difficulty
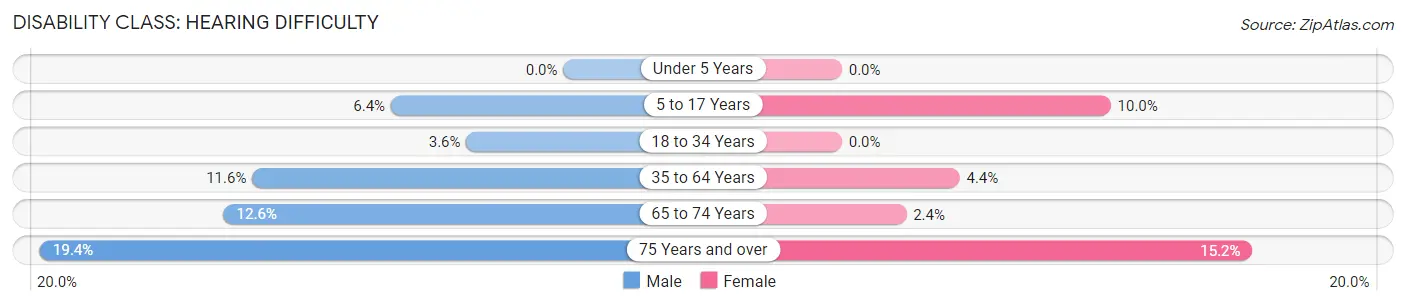
| Age Bracket | Male | Female |
| Under 5 Years | 0 (0.0%) | 0 (0.0%) |
| 5 to 17 Years | 34 (6.4%) | 44 (10.0%) |
| 18 to 34 Years | 21 (3.6%) | 0 (0.0%) |
| 35 to 64 Years | 132 (11.6%) | 46 (4.4%) |
| 65 to 74 Years | 30 (12.6%) | 8 (2.4%) |
| 75 Years and over | 41 (19.4%) | 48 (15.2%) |
Disability Class: Vision Difficulty
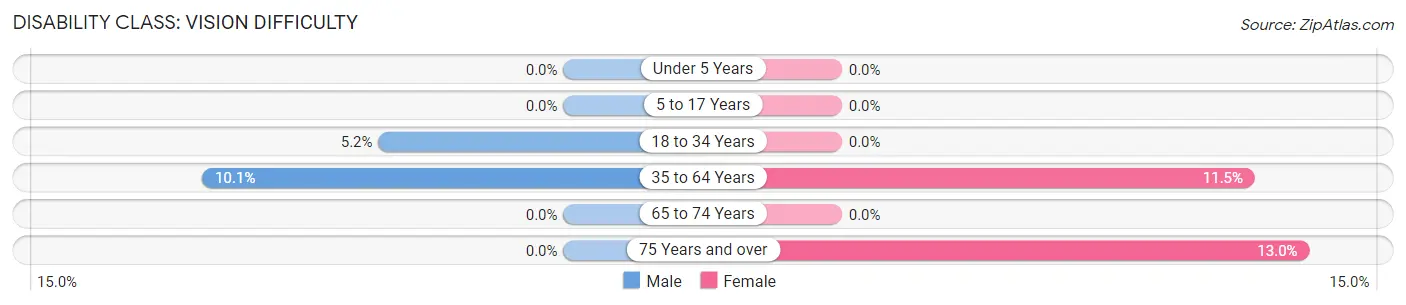
| Age Bracket | Male | Female |
| Under 5 Years | 0 (0.0%) | 0 (0.0%) |
| 5 to 17 Years | 0 (0.0%) | 0 (0.0%) |
| 18 to 34 Years | 30 (5.1%) | 0 (0.0%) |
| 35 to 64 Years | 115 (10.1%) | 121 (11.5%) |
| 65 to 74 Years | 0 (0.0%) | 0 (0.0%) |
| 75 Years and over | 0 (0.0%) | 41 (13.0%) |
Disability Class: Cognitive Difficulty
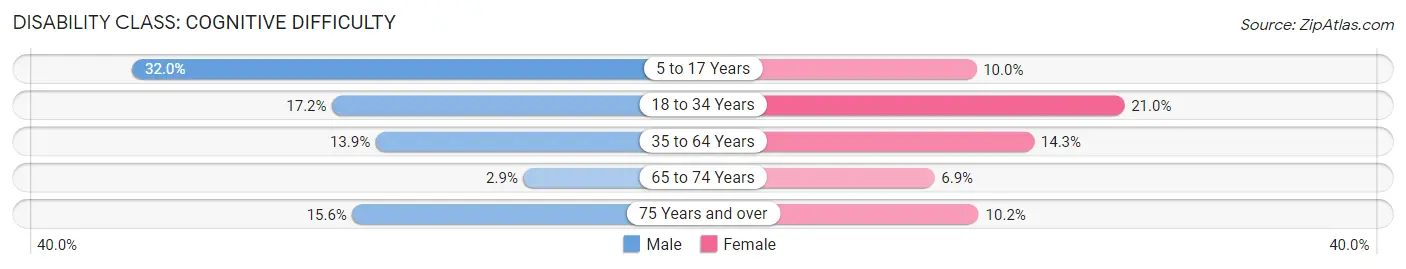
| Age Bracket | Male | Female |
| 5 to 17 Years | 170 (32.0%) | 44 (10.0%) |
| 18 to 34 Years | 100 (17.2%) | 108 (21.0%) |
| 35 to 64 Years | 159 (13.9%) | 150 (14.3%) |
| 65 to 74 Years | 7 (2.9%) | 23 (6.9%) |
| 75 Years and over | 33 (15.6%) | 32 (10.2%) |
Disability Class: Ambulatory Difficulty
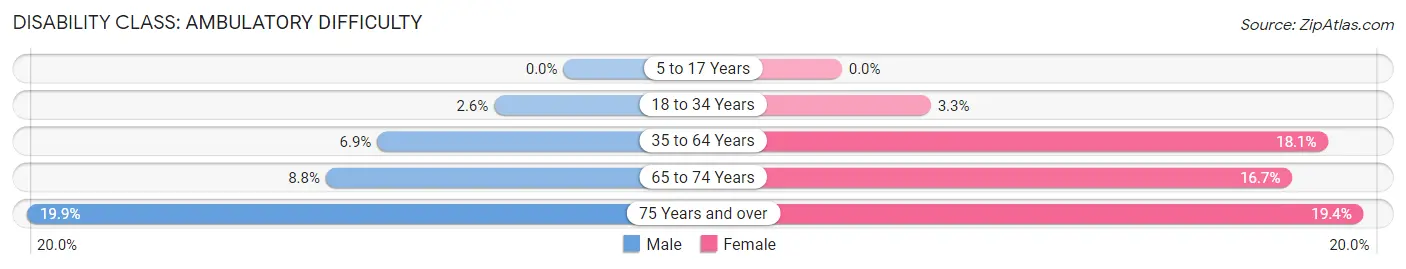
| Age Bracket | Male | Female |
| 5 to 17 Years | 0 (0.0%) | 0 (0.0%) |
| 18 to 34 Years | 15 (2.6%) | 17 (3.3%) |
| 35 to 64 Years | 79 (6.9%) | 190 (18.1%) |
| 65 to 74 Years | 21 (8.8%) | 56 (16.7%) |
| 75 Years and over | 42 (19.9%) | 61 (19.4%) |
Disability Class: Self-Care Difficulty
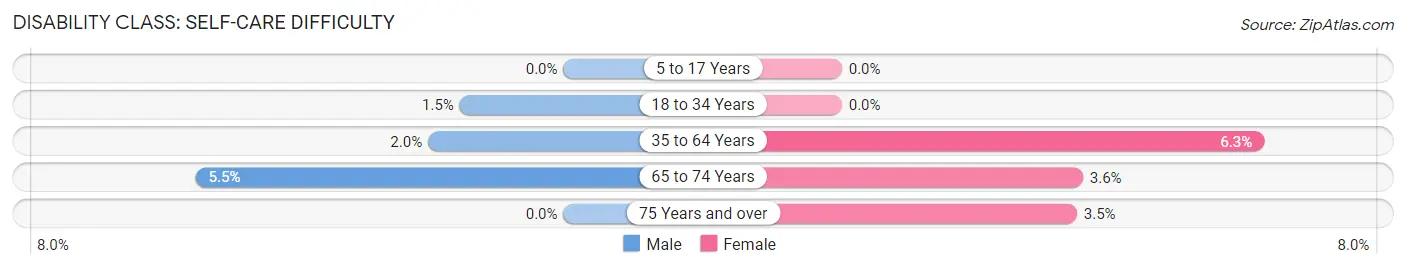
| Age Bracket | Male | Female |
| 5 to 17 Years | 0 (0.0%) | 0 (0.0%) |
| 18 to 34 Years | 9 (1.5%) | 0 (0.0%) |
| 35 to 64 Years | 23 (2.0%) | 66 (6.3%) |
| 65 to 74 Years | 13 (5.5%) | 12 (3.6%) |
| 75 Years and over | 0 (0.0%) | 11 (3.5%) |
Technology Access in Du Quoin
Computing Device Access in Du Quoin
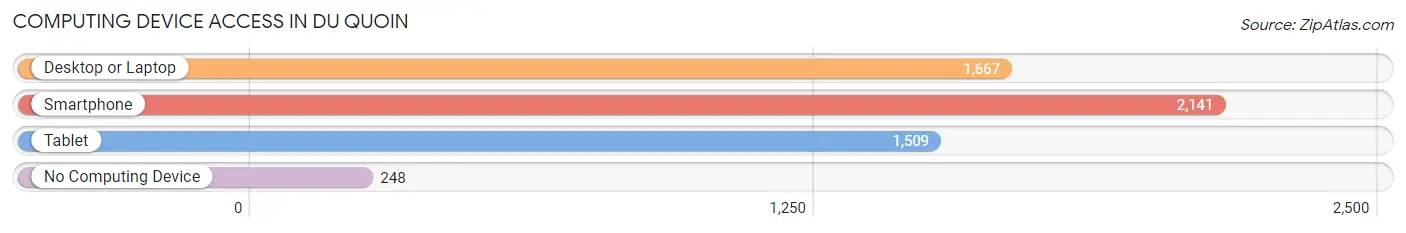
| Device Type | # Households | % Households |
| Desktop or Laptop | 1,667 | 65.8% |
| Smartphone | 2,141 | 84.6% |
| Tablet | 1,509 | 59.6% |
| No Computing Device | 248 | 9.8% |
| Total | 2,532 | 100.0% |
Internet Access in Du Quoin
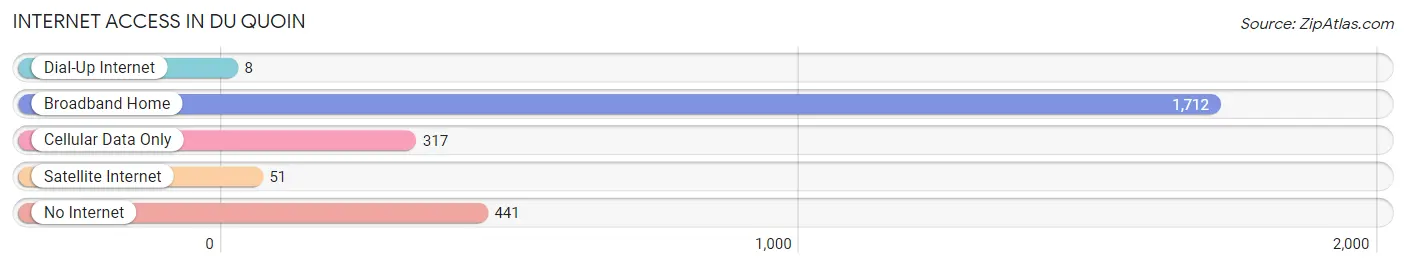
| Internet Type | # Households | % Households |
| Dial-Up Internet | 8 | 0.3% |
| Broadband Home | 1,712 | 67.6% |
| Cellular Data Only | 317 | 12.5% |
| Satellite Internet | 51 | 2.0% |
| No Internet | 441 | 17.4% |
| Total | 2,532 | 100.0% |
Du Quoin Summary
Du Quoin is a city located in Perry County, Illinois, United States. The population was 6,109 at the 2010 census. It is the county seat of Perry County. The city is located along the Big Muddy River and is part of the Metro East region of the St. Louis metropolitan area.
History
Du Quoin was founded in 1853 by William and Mary Du Quoin, who named the city after their family. The city was incorporated in 1855 and was the county seat of Perry County. The city was a major stop on the Cairo and St. Louis Railroad, which connected the city to St. Louis and Cairo, Illinois. The railroad was a major factor in the city's growth and development.
In the late 19th century, Du Quoin was a major center for coal mining and the city was home to several coal mines. The city was also home to several brickyards and other industries.
In the early 20th century, Du Quoin was a major center for the production of agricultural products, including corn, wheat, and soybeans. The city was also home to several manufacturing plants, including a glass factory and a furniture factory.
Geography
Du Quoin is located at 38°1′45″N 89°17′45″W (38.029167, -89.295833). According to the 2010 census, the city has a total area of 4.2 square miles (10.9 km2), all land.
The city is located along the Big Muddy River and is part of the Metro East region of the St. Louis metropolitan area. The city is located approximately 50 miles (80 km) southeast of St. Louis and approximately 30 miles (48 km) northwest of Carbondale.
Economy
Du Quoin is a major center for agriculture and is home to several large farms. The city is also home to several manufacturing plants, including a glass factory and a furniture factory. The city is also home to several retail stores and restaurants.
Demographics
As of the census of 2010, there were 6,109 people, 2,541 households, and 1,619 families residing in the city. The population density was 1,457.2 people per square mile (563.3/km2). There were 2,845 housing units at an average density of 681.2 per square mile (263.3/km2). The racial makeup of the city was 97.2% White, 0.7% African American, 0.2% Native American, 0.3% Asian, 0.2% from other races, and 1.4% from two or more races. Hispanic or Latino of any race were 1.2% of the population.
There were 2,541 households, out of which 28.2% had children under the age of 18 living with them, 44.2% were married couples living together, 14.2% had a female householder with no husband present, and 36.7% were non-families. 32.2% of all households were made up of individuals, and 15.2% had someone living alone who was 65 years of age or older. The average household size was 2.35 and the average family size was 2.94.
In the city, the population was spread out, with 24.2% under the age of 18, 8.2% from 18 to 24, 25.7% from 25 to 44, 23.2% from 45 to 64, and 18.7% who were 65 years of age or older. The median age was 38 years. For every 100 females, there were 87.3 males. For every 100 females age 18 and over, there were 83.2 males.
The median income for a household in the city was $30,917, and the median income for a family was $37,917. Males had a median income of $30,917 versus $20,917 for females. The per capita income for the city was $16,917. About 11.2% of families and 14.2% of the population were below the poverty line, including 19.2% of those under age 18 and 10.2% of those age 65 or over.
Common Questions
What is Per Capita Income in Du Quoin?
Per Capita income in Du Quoin is $27,376.
What is the Median Family Income in Du Quoin?
Median Family Income in Du Quoin is $54,626.
What is the Median Household income in Du Quoin?
Median Household Income in Du Quoin is $48,770.
What is Income or Wage Gap in Du Quoin?
Income or Wage Gap in Du Quoin is 11.1%.
Women in Du Quoin earn 88.9 cents for every dollar earned by a man.
What is Family Income Deficit in Du Quoin?
Family Income Deficit in Du Quoin is $9,058.
Families that are below poverty line in Du Quoin earn $9,058 less on average than the poverty threshold level.
What is Inequality or Gini Index in Du Quoin?
Inequality or Gini Index in Du Quoin is 0.47.
What is the Total Population of Du Quoin?
Total Population of Du Quoin is 5,822.
What is the Total Male Population of Du Quoin?
Total Male Population of Du Quoin is 2,882.
What is the Total Female Population of Du Quoin?
Total Female Population of Du Quoin is 2,940.
What is the Ratio of Males per 100 Females in Du Quoin?
There are 98.03 Males per 100 Females in Du Quoin.
What is the Ratio of Females per 100 Males in Du Quoin?
There are 102.01 Females per 100 Males in Du Quoin.
What is the Median Population Age in Du Quoin?
Median Population Age in Du Quoin is 43.4 Years.
What is the Average Family Size in Du Quoin
Average Family Size in Du Quoin is 2.9 People.
What is the Average Household Size in Du Quoin
Average Household Size in Du Quoin is 2.2 People.
How Large is the Labor Force in Du Quoin?
There are 2,171 People in the Labor Forcein in Du Quoin.
What is the Percentage of People in the Labor Force in Du Quoin?
44.6% of People are in the Labor Force in Du Quoin.
What is the Unemployment Rate in Du Quoin?
Unemployment Rate in Du Quoin is 11.6%.