Delavan, IL Map & Demographics
Delavan Map
Delavan Overview
$30,138
PER CAPITA INCOME
$71,477
AVG FAMILY INCOME
$68,170
AVG HOUSEHOLD INCOME
55.0%
WAGE / INCOME GAP [ % ]
45.0¢/ $1
WAGE / INCOME GAP [ $ ]
$10,685
FAMILY INCOME DEFICIT
0.37
INEQUALITY / GINI INDEX
1,708
TOTAL POPULATION
809
MALE POPULATION
899
FEMALE POPULATION
89.99
MALES / 100 FEMALES
111.12
FEMALES / 100 MALES
40.1
MEDIAN AGE
2.9
AVG FAMILY SIZE
2.6
AVG HOUSEHOLD SIZE
723
LABOR FORCE [ PEOPLE ]
56.1%
PERCENT IN LABOR FORCE
7.8%
UNEMPLOYMENT RATE
Delavan Zip Codes
Delavan Area Codes
Income in Delavan
Income Overview in Delavan
Per Capita Income in Delavan is $30,138, while median incomes of families and households are $71,477 and $68,170 respectively.
| Characteristic | Number | Measure |
| Per Capita Income | 1,708 | $30,138 |
| Median Family Income | 491 | $71,477 |
| Mean Family Income | 491 | $84,819 |
| Median Household Income | 667 | $68,170 |
| Mean Household Income | 667 | $76,349 |
| Income Deficit | 491 | $10,685 |
| Wage / Income Gap (%) | 1,708 | 55.05% |
| Wage / Income Gap ($) | 1,708 | 44.95¢ per $1 |
| Gini / Inequality Index | 1,708 | 0.37 |
Earnings by Sex in Delavan
Average Earnings in Delavan are $39,448, $57,250 for men and $25,735 for women, a difference of 55.0%.
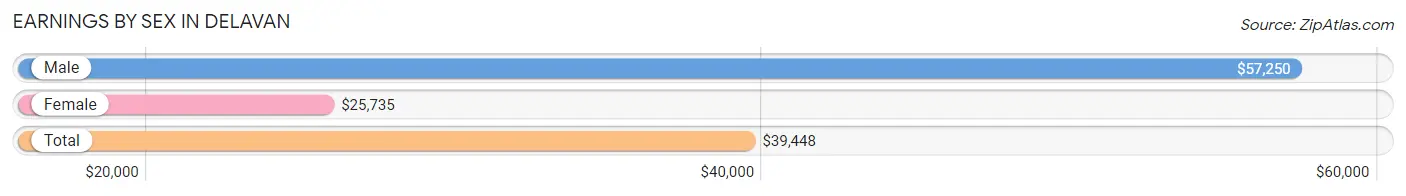
| Sex | Number | Average Earnings |
| Male | 325 (45.0%) | $57,250 |
| Female | 398 (55.0%) | $25,735 |
| Total | 723 (100.0%) | $39,448 |
Earnings by Sex by Income Bracket in Delavan
The most common earnings brackets in Delavan are $100,000+ for men (64 | 19.7%) and $12,500 to $14,999 for women (57 | 14.3%).
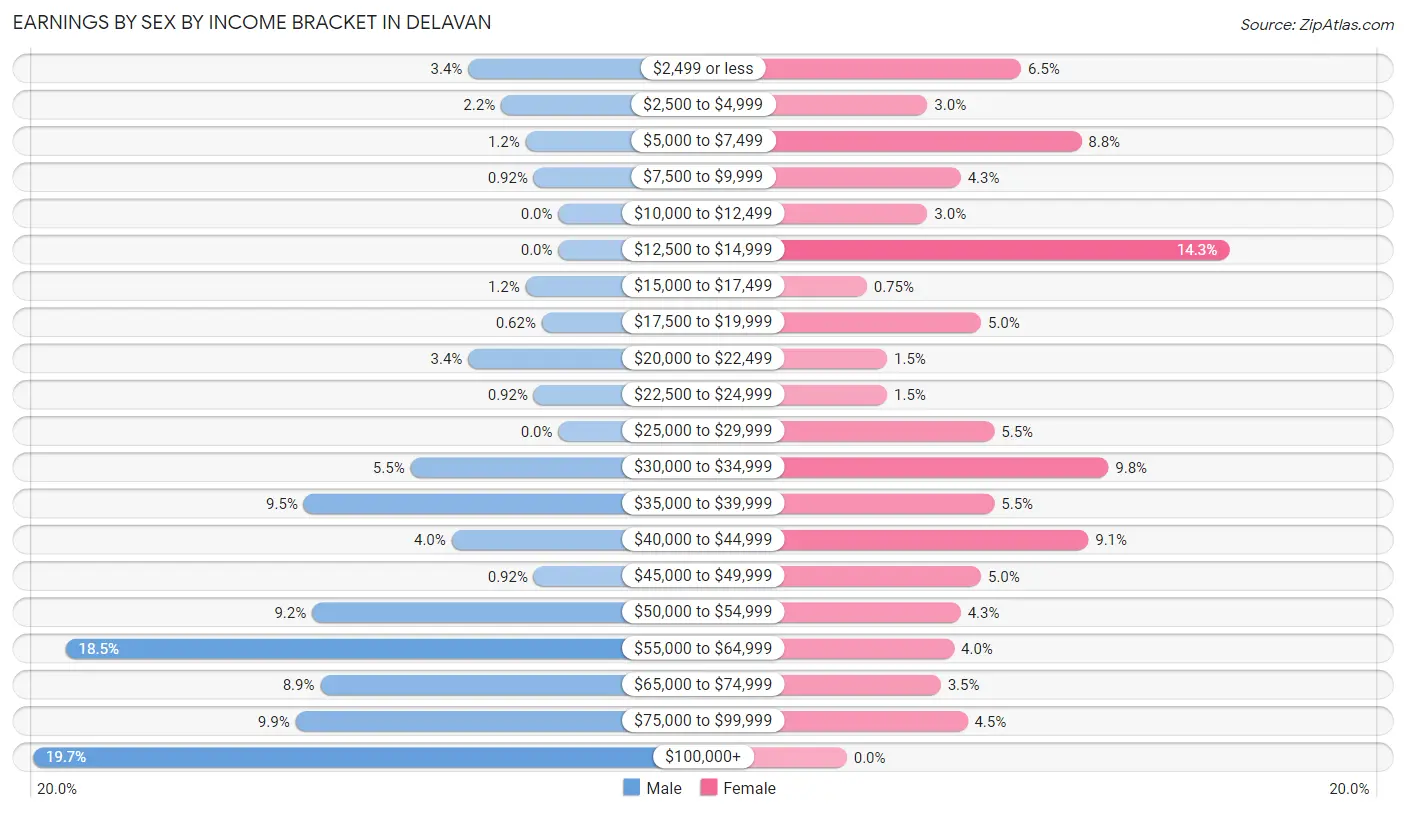
| Income | Male | Female |
| $2,499 or less | 11 (3.4%) | 26 (6.5%) |
| $2,500 to $4,999 | 7 (2.1%) | 12 (3.0%) |
| $5,000 to $7,499 | 4 (1.2%) | 35 (8.8%) |
| $7,500 to $9,999 | 3 (0.9%) | 17 (4.3%) |
| $10,000 to $12,499 | 0 (0.0%) | 12 (3.0%) |
| $12,500 to $14,999 | 0 (0.0%) | 57 (14.3%) |
| $15,000 to $17,499 | 4 (1.2%) | 3 (0.7%) |
| $17,500 to $19,999 | 2 (0.6%) | 20 (5.0%) |
| $20,000 to $22,499 | 11 (3.4%) | 6 (1.5%) |
| $22,500 to $24,999 | 3 (0.9%) | 6 (1.5%) |
| $25,000 to $29,999 | 0 (0.0%) | 22 (5.5%) |
| $30,000 to $34,999 | 18 (5.5%) | 39 (9.8%) |
| $35,000 to $39,999 | 31 (9.5%) | 22 (5.5%) |
| $40,000 to $44,999 | 13 (4.0%) | 36 (9.0%) |
| $45,000 to $49,999 | 3 (0.9%) | 20 (5.0%) |
| $50,000 to $54,999 | 30 (9.2%) | 17 (4.3%) |
| $55,000 to $64,999 | 60 (18.5%) | 16 (4.0%) |
| $65,000 to $74,999 | 29 (8.9%) | 14 (3.5%) |
| $75,000 to $99,999 | 32 (9.9%) | 18 (4.5%) |
| $100,000+ | 64 (19.7%) | 0 (0.0%) |
| Total | 325 (100.0%) | 398 (100.0%) |
Earnings by Sex by Educational Attainment in Delavan
Average earnings in Delavan are $57,782 for men and $32,578 for women, a difference of 43.6%. Men with an educational attainment of high school diploma enjoy the highest average annual earnings of $59,150, while those with bachelor's degree education earn the least with $55,469. Women with an educational attainment of graduate degree earn the most with the average annual earnings of $53,750, while those with less than high school education have the smallest earnings of $18,125.
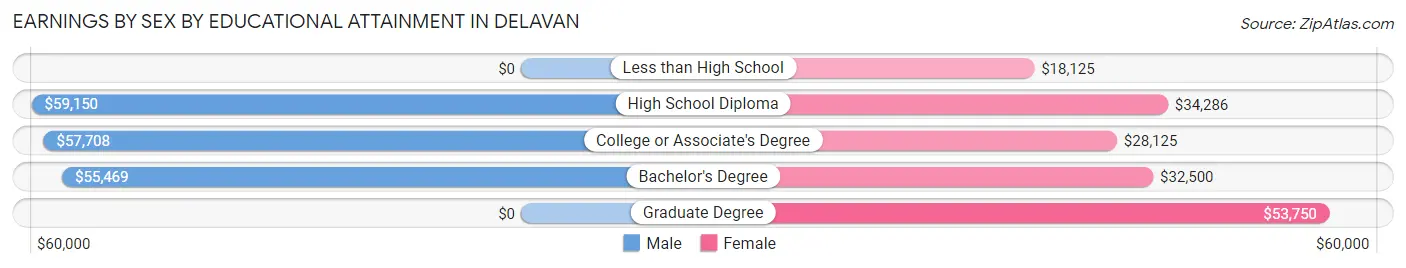
| Educational Attainment | Male Income | Female Income |
| Less than High School | - | - |
| High School Diploma | $59,150 | $34,286 |
| College or Associate's Degree | $57,708 | $28,125 |
| Bachelor's Degree | $55,469 | $32,500 |
| Graduate Degree | - | - |
| Total | $57,782 | $32,578 |
Family Income in Delavan
Family Income Brackets in Delavan
According to the Delavan family income data, there are 118 families falling into the $100,000 to $149,999 income range, which is the most common income bracket and makes up 24.0% of all families. Conversely, the $25,000 to $34,999 income bracket is the least frequent group with only 10 families (2.0%) belonging to this category.
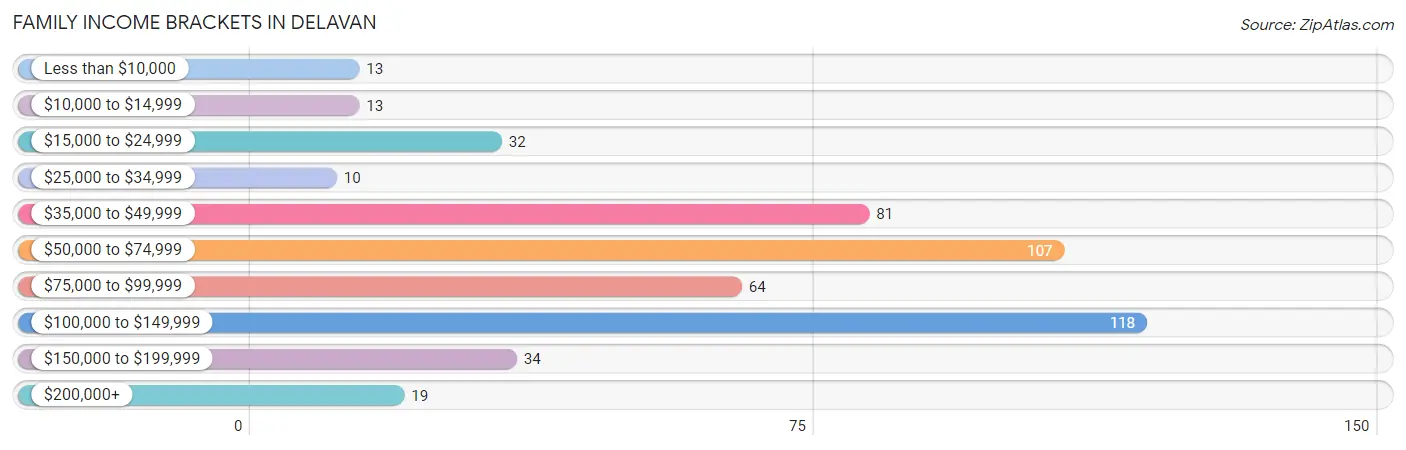
| Income Bracket | # Families | % Families |
| Less than $10,000 | 13 | 2.6% |
| $10,000 to $14,999 | 13 | 2.6% |
| $15,000 to $24,999 | 32 | 6.5% |
| $25,000 to $34,999 | 10 | 2.0% |
| $35,000 to $49,999 | 81 | 16.5% |
| $50,000 to $74,999 | 107 | 21.8% |
| $75,000 to $99,999 | 64 | 13.0% |
| $100,000 to $149,999 | 118 | 24.0% |
| $150,000 to $199,999 | 34 | 6.9% |
| $200,000+ | 19 | 3.9% |
Family Income by Famaliy Size in Delavan
4-person families (105 | 21.4%) account for the highest median family income in Delavan with $105,662 per family, while 2-person families (257 | 52.3%) have the highest median income of $32,456 per family member.
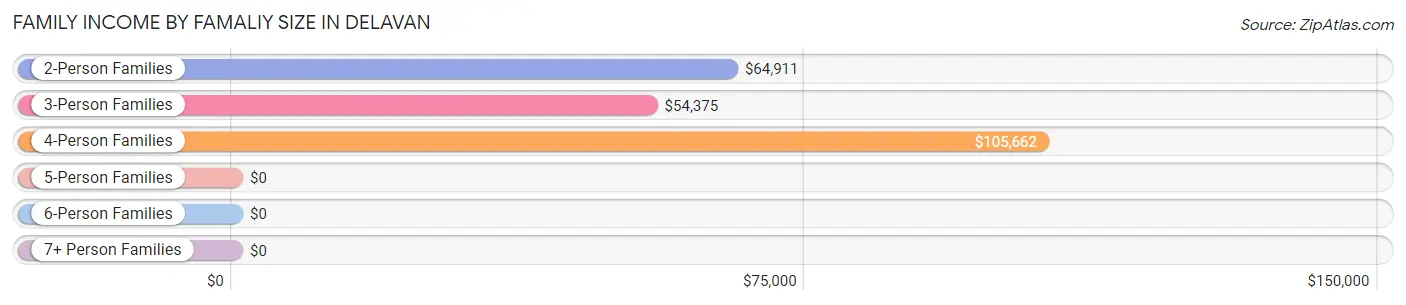
| Income Bracket | # Families | Median Income |
| 2-Person Families | 257 (52.3%) | $64,911 |
| 3-Person Families | 95 (19.4%) | $54,375 |
| 4-Person Families | 105 (21.4%) | $105,662 |
| 5-Person Families | 11 (2.2%) | $0 |
| 6-Person Families | 17 (3.5%) | $0 |
| 7+ Person Families | 6 (1.2%) | $0 |
| Total | 491 (100.0%) | $71,477 |
Family Income by Number of Earners in Delavan
The median family income in Delavan is $71,477, with families comprising 3+ earners (16) having the highest median family income of $143,333, while families with 1 earner (155) have the lowest median family income of $55,417, accounting for 3.3% and 31.6% of families, respectively.
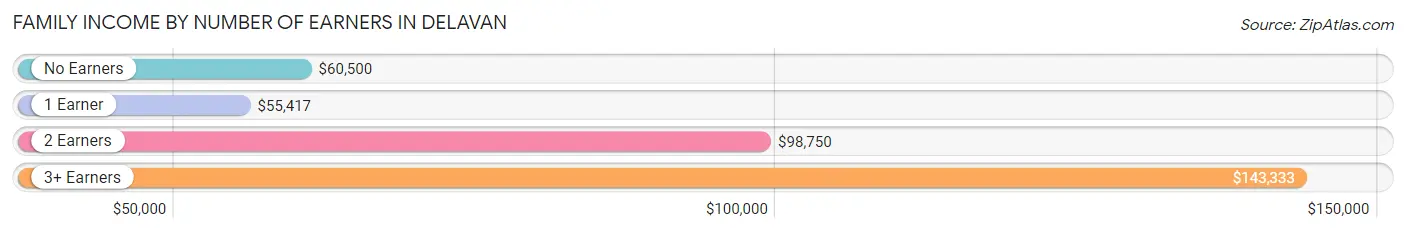
| Number of Earners | # Families | Median Income |
| No Earners | 138 (28.1%) | $60,500 |
| 1 Earner | 155 (31.6%) | $55,417 |
| 2 Earners | 182 (37.1%) | $98,750 |
| 3+ Earners | 16 (3.3%) | $143,333 |
| Total | 491 (100.0%) | $71,477 |
Household Income in Delavan
Household Income Brackets in Delavan
With 137 households falling in the category, the $50,000 to $74,999 income range is the most frequent in Delavan, accounting for 20.5% of all households. In contrast, only 11 households (1.7%) fall into the $10,000 to $14,999 income bracket, making it the least populous group.
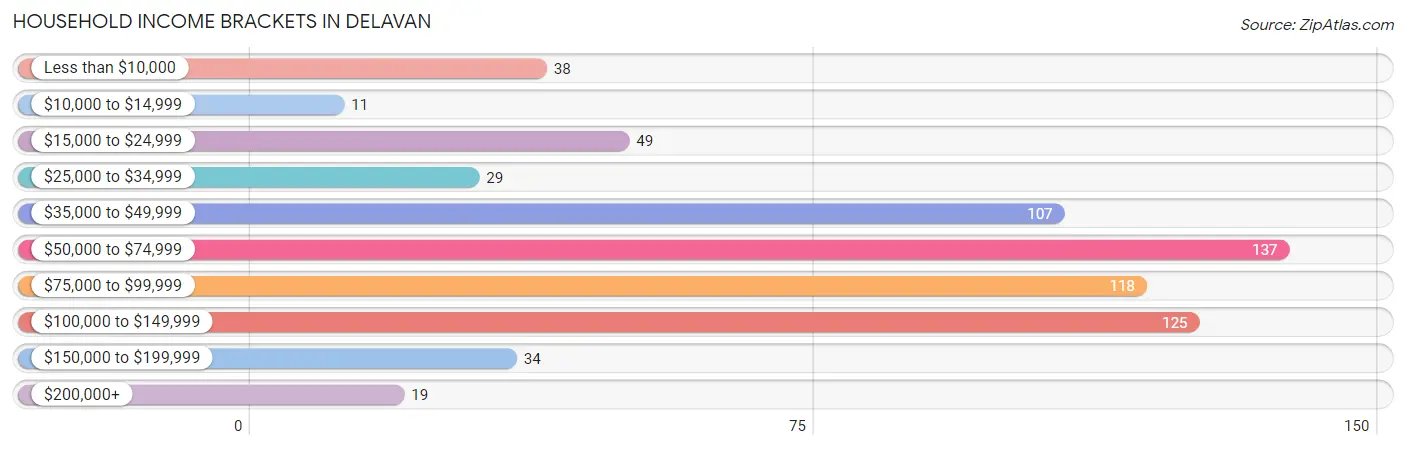
| Income Bracket | # Households | % Households |
| Less than $10,000 | 38 | 5.7% |
| $10,000 to $14,999 | 11 | 1.6% |
| $15,000 to $24,999 | 49 | 7.3% |
| $25,000 to $34,999 | 29 | 4.3% |
| $35,000 to $49,999 | 107 | 16.0% |
| $50,000 to $74,999 | 137 | 20.5% |
| $75,000 to $99,999 | 118 | 17.7% |
| $100,000 to $149,999 | 125 | 18.7% |
| $150,000 to $199,999 | 34 | 5.1% |
| $200,000+ | 19 | 2.8% |
Household Income by Householder Age in Delavan
The median household income in Delavan is $68,170, with the highest median household income of $71,136 found in the 25 to 44 years age bracket for the primary householder. A total of 212 households (31.8%) fall into this category. Meanwhile, the 15 to 24 years age bracket for the primary householder has the lowest median household income of $0, with 6 households (0.9%) in this group.
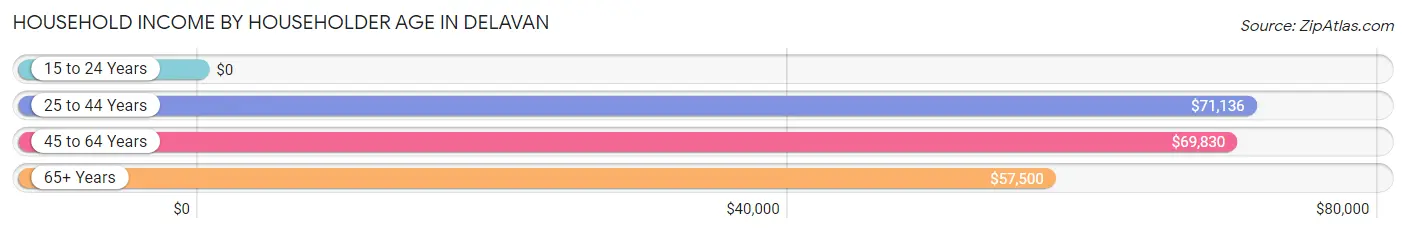
| Income Bracket | # Households | Median Income |
| 15 to 24 Years | 6 (0.9%) | $0 |
| 25 to 44 Years | 212 (31.8%) | $71,136 |
| 45 to 64 Years | 259 (38.8%) | $69,830 |
| 65+ Years | 190 (28.5%) | $57,500 |
| Total | 667 (100.0%) | $68,170 |
Poverty in Delavan
Income Below Poverty by Sex and Age in Delavan
With 8.6% poverty level for males and 15.1% for females among the residents of Delavan, 15 year old males and under 5 year old females are the most vulnerable to poverty, with 10 males (100.0%) and 7 females (63.6%) in their respective age groups living below the poverty level.
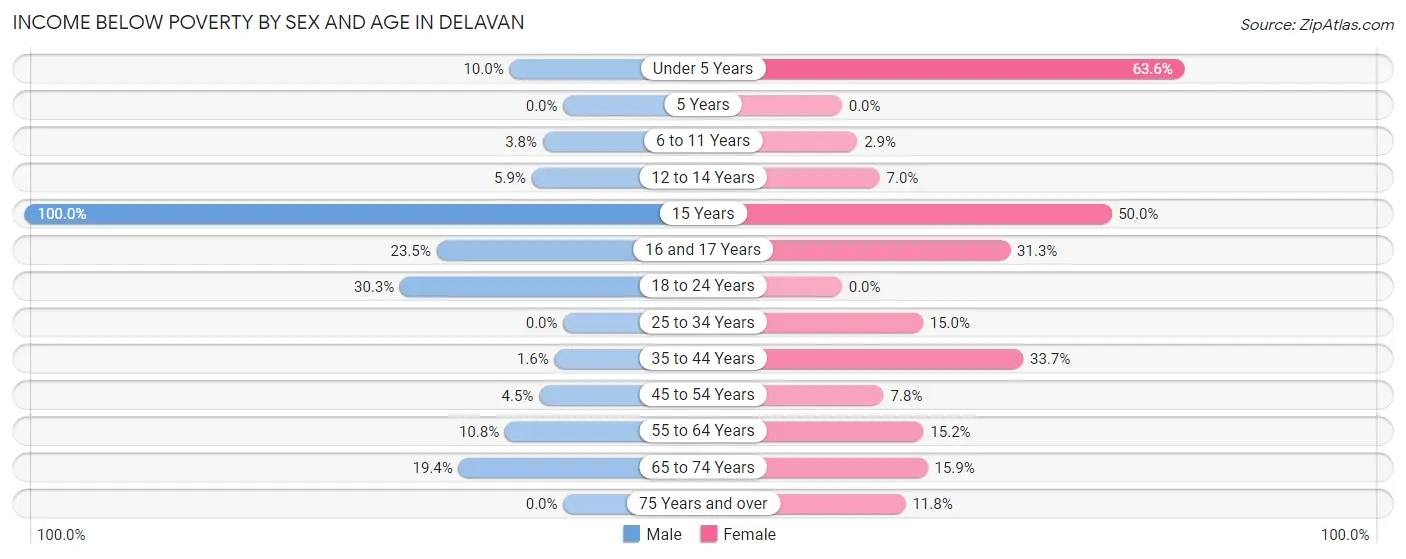
| Age Bracket | Male | Female |
| Under 5 Years | 5 (10.0%) | 7 (63.6%) |
| 5 Years | 0 (0.0%) | 0 (0.0%) |
| 6 to 11 Years | 4 (3.8%) | 3 (2.9%) |
| 12 to 14 Years | 3 (5.9%) | 4 (7.0%) |
| 15 Years | 10 (100.0%) | 10 (50.0%) |
| 16 and 17 Years | 4 (23.5%) | 10 (31.2%) |
| 18 to 24 Years | 10 (30.3%) | 0 (0.0%) |
| 25 to 34 Years | 0 (0.0%) | 20 (15.0%) |
| 35 to 44 Years | 2 (1.6%) | 34 (33.7%) |
| 45 to 54 Years | 4 (4.5%) | 8 (7.8%) |
| 55 to 64 Years | 13 (10.8%) | 20 (15.1%) |
| 65 to 74 Years | 14 (19.4%) | 7 (15.9%) |
| 75 Years and over | 0 (0.0%) | 13 (11.8%) |
| Total | 69 (8.6%) | 136 (15.1%) |
Income Above Poverty by Sex and Age in Delavan
According to the poverty statistics in Delavan, males aged 25 to 34 years and females aged 5 years are the age groups that are most secure financially, with 100.0% of males and 100.0% of females in these age groups living above the poverty line.
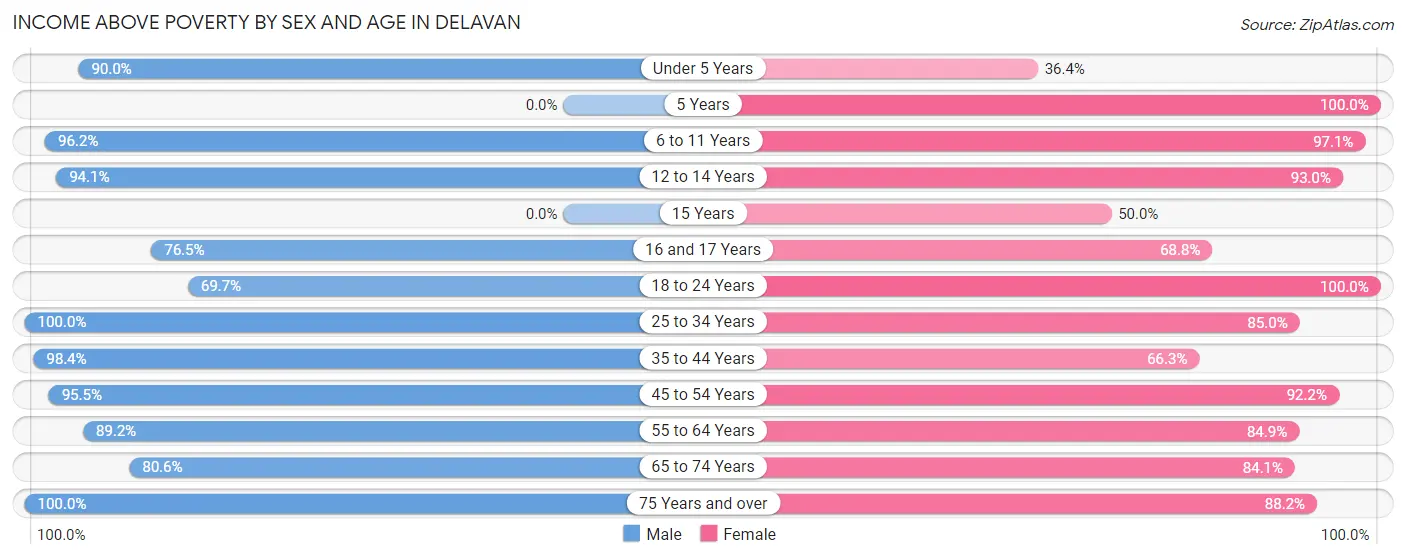
| Age Bracket | Male | Female |
| Under 5 Years | 45 (90.0%) | 4 (36.4%) |
| 5 Years | 0 (0.0%) | 4 (100.0%) |
| 6 to 11 Years | 101 (96.2%) | 102 (97.1%) |
| 12 to 14 Years | 48 (94.1%) | 53 (93.0%) |
| 15 Years | 0 (0.0%) | 10 (50.0%) |
| 16 and 17 Years | 13 (76.5%) | 22 (68.8%) |
| 18 to 24 Years | 23 (69.7%) | 47 (100.0%) |
| 25 to 34 Years | 57 (100.0%) | 113 (85.0%) |
| 35 to 44 Years | 121 (98.4%) | 67 (66.3%) |
| 45 to 54 Years | 85 (95.5%) | 95 (92.2%) |
| 55 to 64 Years | 107 (89.2%) | 112 (84.9%) |
| 65 to 74 Years | 58 (80.6%) | 37 (84.1%) |
| 75 Years and over | 75 (100.0%) | 97 (88.2%) |
| Total | 733 (91.4%) | 763 (84.9%) |
Income Below Poverty Among Married-Couple Families in Delavan
The poverty statistics for married-couple families in Delavan show that 2.8% or 10 of the total 357 families live below the poverty line. Families with no children have the highest poverty rate of 3.1%, comprising of 7 families. On the other hand, families with 3 or 4 children have the lowest poverty rate of 0.0%, which includes 0 families.
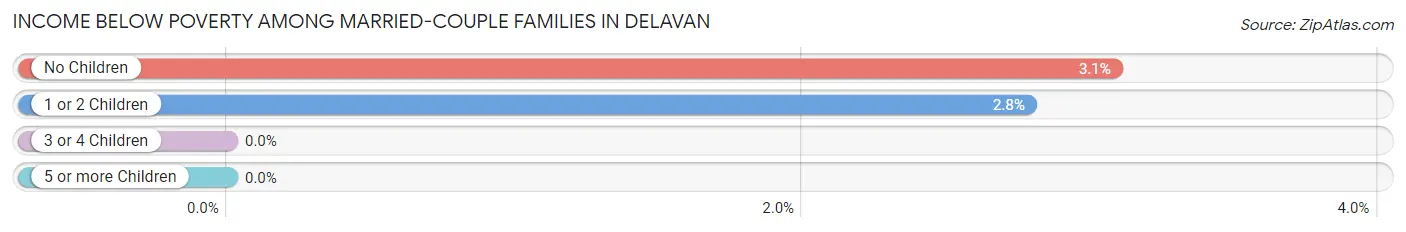
| Children | Above Poverty | Below Poverty |
| No Children | 220 (96.9%) | 7 (3.1%) |
| 1 or 2 Children | 105 (97.2%) | 3 (2.8%) |
| 3 or 4 Children | 16 (100.0%) | 0 (0.0%) |
| 5 or more Children | 6 (100.0%) | 0 (0.0%) |
| Total | 347 (97.2%) | 10 (2.8%) |
Income Below Poverty Among Single-Parent Households in Delavan
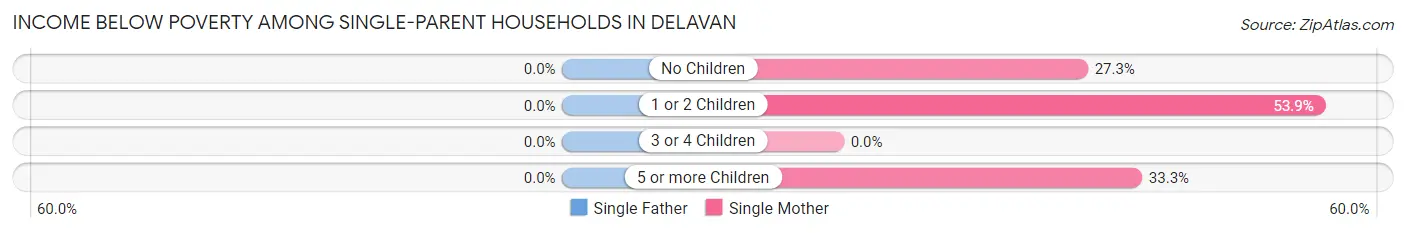
| Children | Single Father | Single Mother |
| No Children | 0 (0.0%) | 6 (27.3%) |
| 1 or 2 Children | 0 (0.0%) | 21 (53.8%) |
| 3 or 4 Children | 0 (0.0%) | 0 (0.0%) |
| 5 or more Children | 0 (0.0%) | 4 (33.3%) |
| Total | 0 (0.0%) | 31 (40.8%) |
Income Below Poverty Among Married-Couple vs Single-Parent Households in Delavan
The poverty data for Delavan shows that 10 of the married-couple family households (2.8%) and 31 of the single-parent households (23.1%) are living below the poverty level. Within the married-couple family households, those with no children have the highest poverty rate, with 7 households (3.1%) falling below the poverty line. Among the single-parent households, those with 1 or 2 children have the highest poverty rate, with 21 household (42.9%) living below poverty.
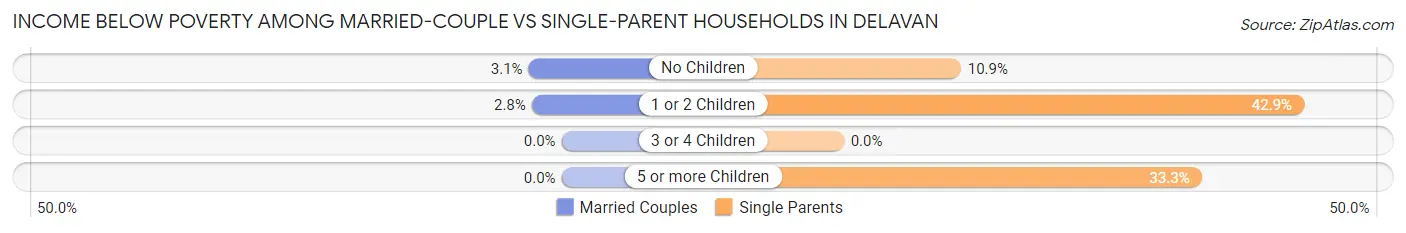
| Children | Married-Couple Families | Single-Parent Households |
| No Children | 7 (3.1%) | 6 (10.9%) |
| 1 or 2 Children | 3 (2.8%) | 21 (42.9%) |
| 3 or 4 Children | 0 (0.0%) | 0 (0.0%) |
| 5 or more Children | 0 (0.0%) | 4 (33.3%) |
| Total | 10 (2.8%) | 31 (23.1%) |
Race in Delavan
The most populous races in Delavan are White / Caucasian (1,632 | 95.6%), Hispanic or Latino (91 | 5.3%), and Two or more Races (47 | 2.8%).
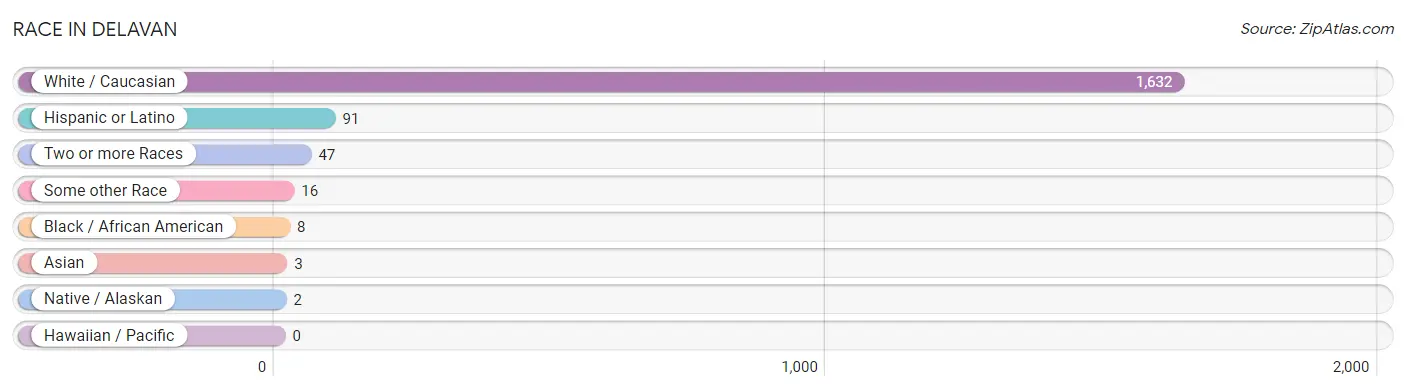
| Race | # Population | % Population |
| Asian | 3 | 0.2% |
| Black / African American | 8 | 0.5% |
| Hawaiian / Pacific | 0 | 0.0% |
| Hispanic or Latino | 91 | 5.3% |
| Native / Alaskan | 2 | 0.1% |
| White / Caucasian | 1,632 | 95.6% |
| Two or more Races | 47 | 2.8% |
| Some other Race | 16 | 0.9% |
| Total | 1,708 | 100.0% |
Ancestry in Delavan
The most populous ancestries reported in Delavan are German (677 | 39.6%), Irish (209 | 12.2%), Polish (127 | 7.4%), English (125 | 7.3%), and Mexican (76 | 4.4%), together accounting for 71.1% of all Delavan residents.
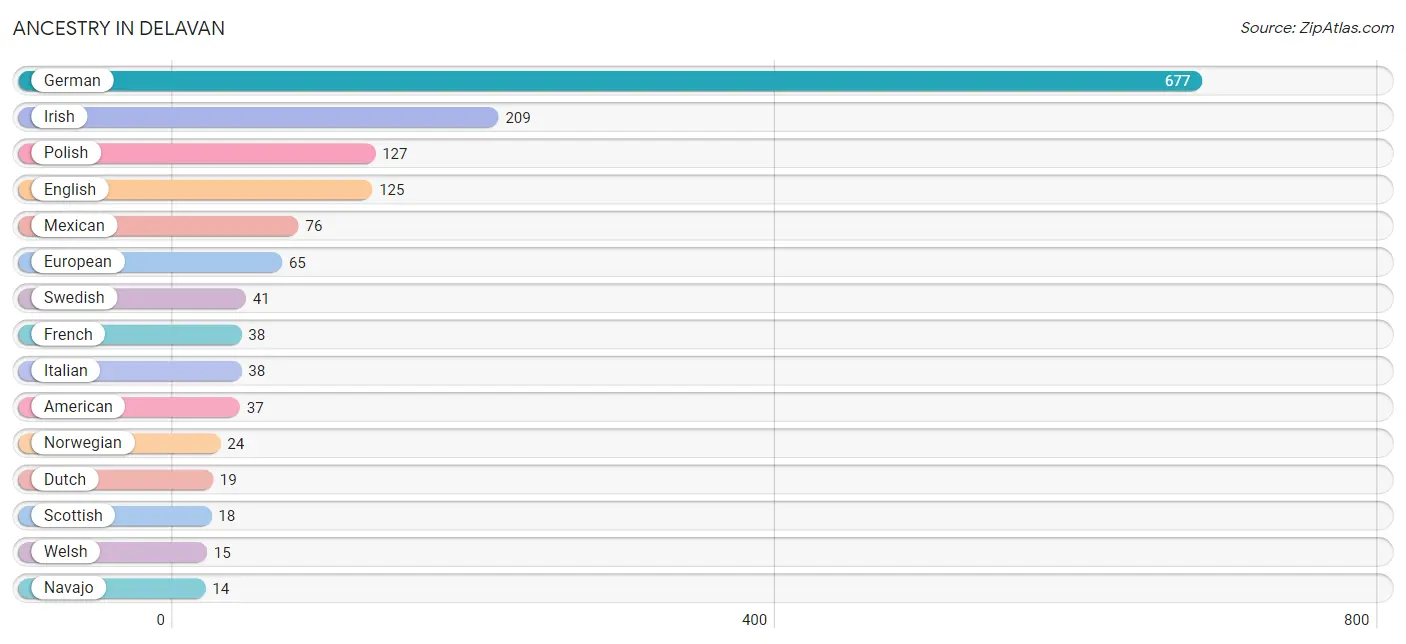
| Ancestry | # Population | % Population |
| African | 1 | 0.1% |
| American | 37 | 2.2% |
| British | 9 | 0.5% |
| Central American | 3 | 0.2% |
| Dutch | 19 | 1.1% |
| English | 125 | 7.3% |
| European | 65 | 3.8% |
| French | 38 | 2.2% |
| German | 677 | 39.6% |
| Guamanian / Chamorro | 1 | 0.1% |
| Guatemalan | 3 | 0.2% |
| Inupiat | 1 | 0.1% |
| Irish | 209 | 12.2% |
| Italian | 38 | 2.2% |
| Korean | 4 | 0.2% |
| Mexican | 76 | 4.4% |
| Navajo | 14 | 0.8% |
| Northern European | 4 | 0.2% |
| Norwegian | 24 | 1.4% |
| Polish | 127 | 7.4% |
| Puerto Rican | 12 | 0.7% |
| Russian | 4 | 0.2% |
| Scotch-Irish | 13 | 0.8% |
| Scottish | 18 | 1.1% |
| Subsaharan African | 1 | 0.1% |
| Swedish | 41 | 2.4% |
| Swiss | 6 | 0.4% |
| Welsh | 15 | 0.9% | View All 28 Rows |
Immigrants in Delavan
The most numerous immigrant groups reported in Delavan came from Asia (3 | 0.2%), Canada (3 | 0.2%), Philippines (3 | 0.2%), South Eastern Asia (3 | 0.2%), and Central America (2 | 0.1%), together accounting for 0.8% of all Delavan residents.
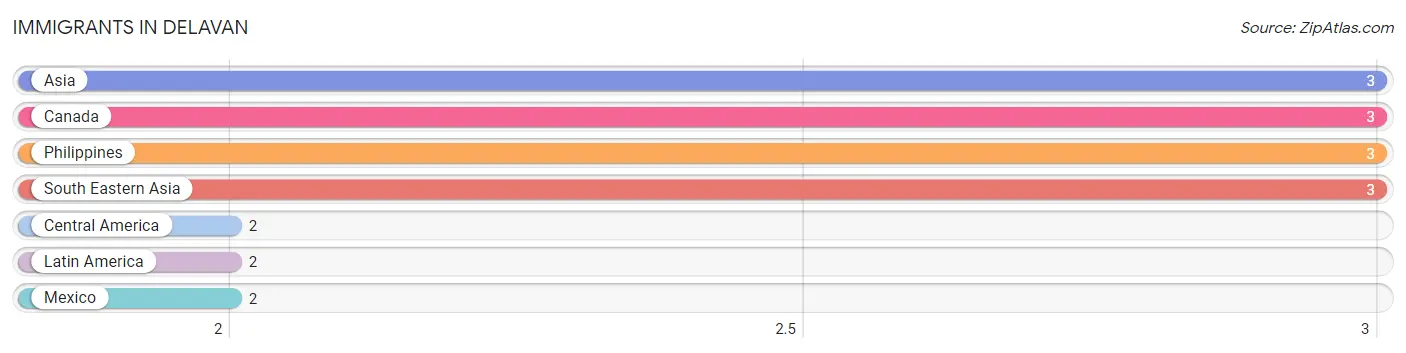
| Immigration Origin | # Population | % Population |
| Asia | 3 | 0.2% |
| Canada | 3 | 0.2% |
| Central America | 2 | 0.1% |
| Latin America | 2 | 0.1% |
| Mexico | 2 | 0.1% |
| Philippines | 3 | 0.2% |
| South Eastern Asia | 3 | 0.2% | View All 7 Rows |
Sex and Age in Delavan
Sex and Age in Delavan
The most populous age groups in Delavan are 10 to 14 Years (83 | 10.3%) for men and 10 to 14 Years (123 | 13.7%) for women.
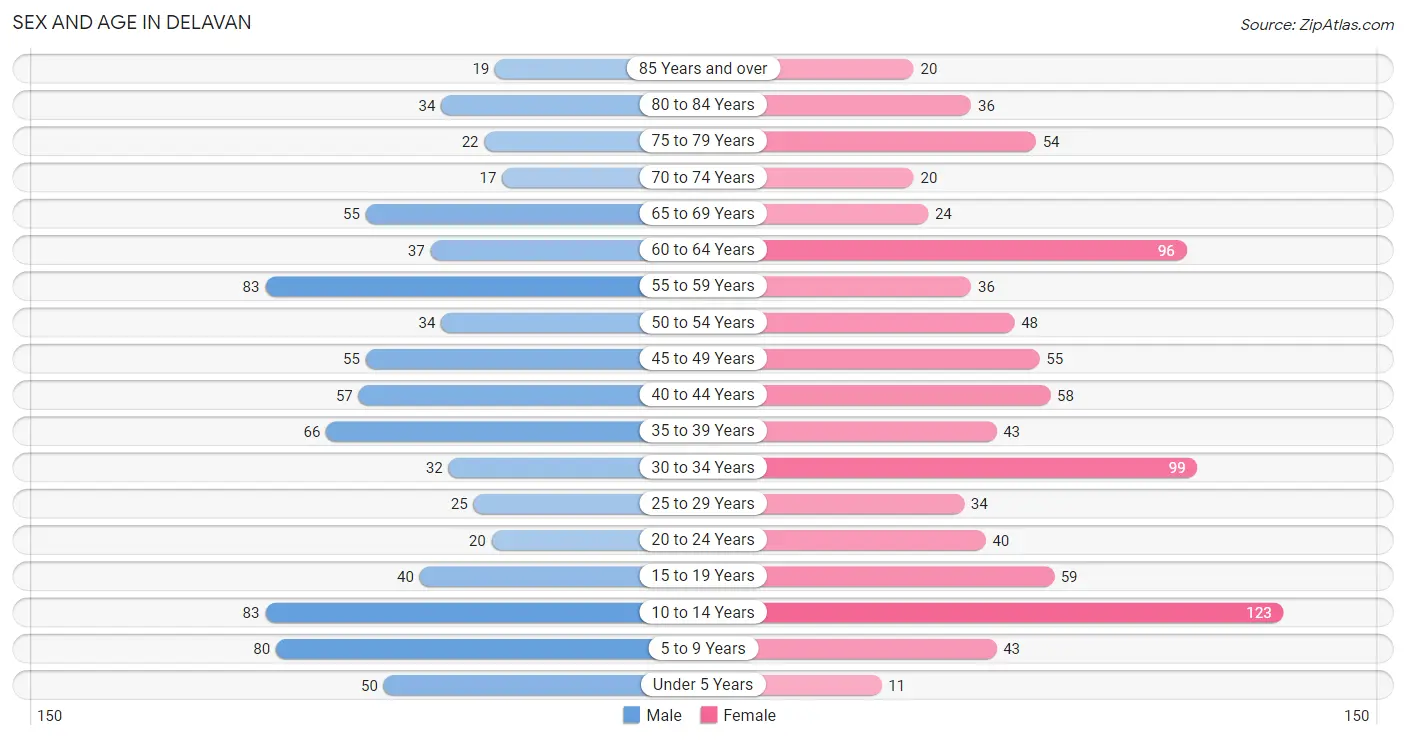
| Age Bracket | Male | Female |
| Under 5 Years | 50 (6.2%) | 11 (1.2%) |
| 5 to 9 Years | 80 (9.9%) | 43 (4.8%) |
| 10 to 14 Years | 83 (10.3%) | 123 (13.7%) |
| 15 to 19 Years | 40 (4.9%) | 59 (6.6%) |
| 20 to 24 Years | 20 (2.5%) | 40 (4.4%) |
| 25 to 29 Years | 25 (3.1%) | 34 (3.8%) |
| 30 to 34 Years | 32 (4.0%) | 99 (11.0%) |
| 35 to 39 Years | 66 (8.2%) | 43 (4.8%) |
| 40 to 44 Years | 57 (7.0%) | 58 (6.5%) |
| 45 to 49 Years | 55 (6.8%) | 55 (6.1%) |
| 50 to 54 Years | 34 (4.2%) | 48 (5.3%) |
| 55 to 59 Years | 83 (10.3%) | 36 (4.0%) |
| 60 to 64 Years | 37 (4.6%) | 96 (10.7%) |
| 65 to 69 Years | 55 (6.8%) | 24 (2.7%) |
| 70 to 74 Years | 17 (2.1%) | 20 (2.2%) |
| 75 to 79 Years | 22 (2.7%) | 54 (6.0%) |
| 80 to 84 Years | 34 (4.2%) | 36 (4.0%) |
| 85 Years and over | 19 (2.4%) | 20 (2.2%) |
| Total | 809 (100.0%) | 899 (100.0%) |
Families and Households in Delavan
Median Family Size in Delavan
The median family size in Delavan is 2.94 persons per family, with single female/mother families (76 | 15.5%) accounting for the largest median family size of 3.34 persons per family. On the other hand, single male/father families (58 | 11.8%) represent the smallest median family size with 2.64 persons per family.

| Family Type | # Families | Family Size |
| Married-Couple | 357 (72.7%) | 2.90 |
| Single Male/Father | 58 (11.8%) | 2.64 |
| Single Female/Mother | 76 (15.5%) | 3.34 |
| Total Families | 491 (100.0%) | 2.94 |
Median Household Size in Delavan
The median household size in Delavan is 2.56 persons per household, with single female/mother households (76 | 11.4%) accounting for the largest median household size of 3.75 persons per household. non-family households (176 | 26.4%) represent the smallest median household size with 1.09 persons per household.
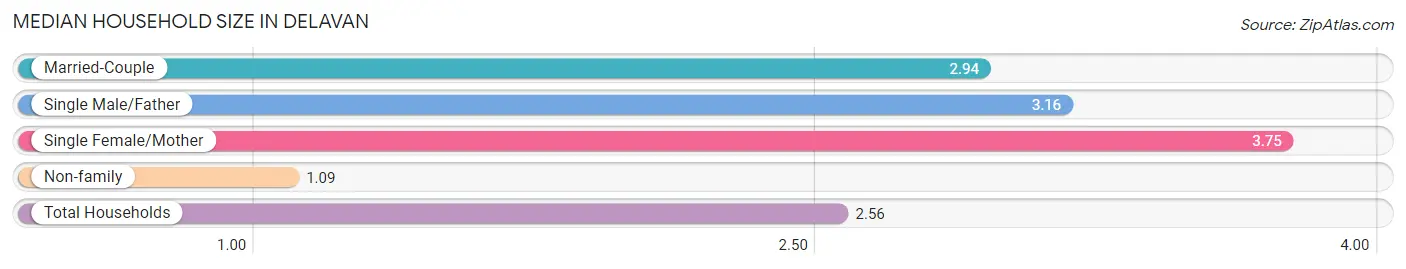
| Household Type | # Households | Household Size |
| Married-Couple | 357 (53.5%) | 2.94 |
| Single Male/Father | 58 (8.7%) | 3.16 |
| Single Female/Mother | 76 (11.4%) | 3.75 |
| Non-family | 176 (26.4%) | 1.09 |
| Total Households | 667 (100.0%) | 2.56 |
Household Size by Marriage Status in Delavan
Out of a total of 667 households in Delavan, 491 (73.6%) are family households, while 176 (26.4%) are nonfamily households. The most numerous type of family households are 2-person households, comprising 228, and the most common type of nonfamily households are 1-person households, comprising 161.
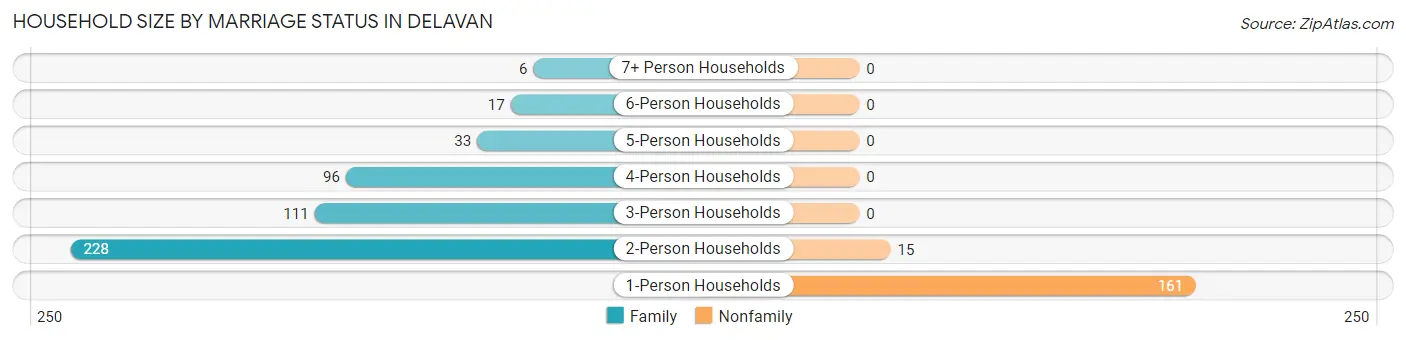
| Household Size | Family Households | Nonfamily Households |
| 1-Person Households | - | 161 (24.1%) |
| 2-Person Households | 228 (34.2%) | 15 (2.2%) |
| 3-Person Households | 111 (16.6%) | 0 (0.0%) |
| 4-Person Households | 96 (14.4%) | 0 (0.0%) |
| 5-Person Households | 33 (5.0%) | 0 (0.0%) |
| 6-Person Households | 17 (2.5%) | 0 (0.0%) |
| 7+ Person Households | 6 (0.9%) | 0 (0.0%) |
| Total | 491 (73.6%) | 176 (26.4%) |
Female Fertility in Delavan
Fertility by Age in Delavan
Average fertility rate in Delavan is 17.0 births per 1,000 women. Women in the age bracket of 20 to 34 years have the highest fertility rate with 40.0 births per 1,000 women. Women in the age bracket of 20 to 34 years acount for 100.0% of all women with births.
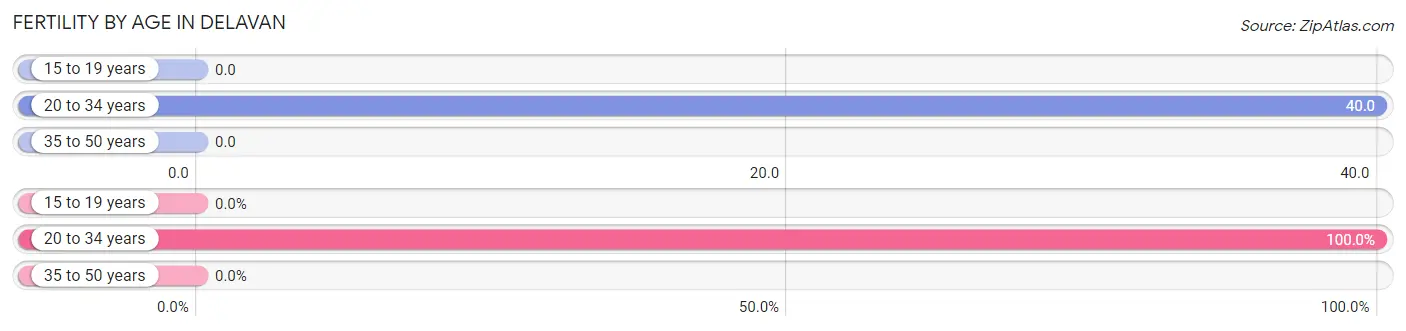
| Age Bracket | Women with Births | Births / 1,000 Women |
| 15 to 19 years | 0 (0.0%) | 0.0 |
| 20 to 34 years | 7 (100.0%) | 40.0 |
| 35 to 50 years | 0 (0.0%) | 0.0 |
| Total | 7 (100.0%) | 17.0 |
Fertility by Age by Marriage Status in Delavan
42.9% of women with births (7) in Delavan are married. The highest percentage of unmarried women with births falls into 20 to 34 years age bracket with 57.1% of them unmarried at the time of birth, while the lowest percentage of unmarried women with births belong to 20 to 34 years age bracket with 57.1% of them unmarried.
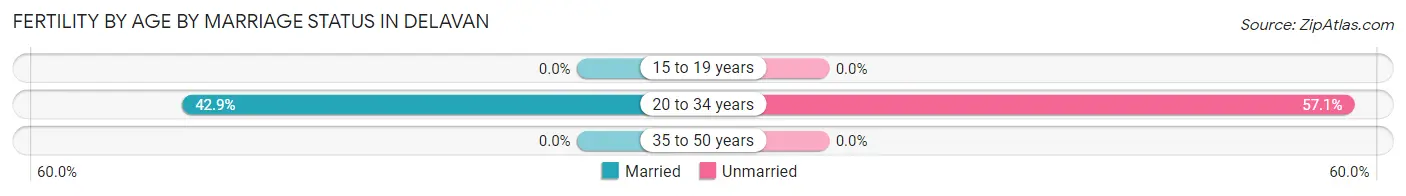
| Age Bracket | Married | Unmarried |
| 15 to 19 years | 0 (0.0%) | 0 (0.0%) |
| 20 to 34 years | 3 (42.9%) | 4 (57.1%) |
| 35 to 50 years | 0 (0.0%) | 0 (0.0%) |
| Total | 3 (42.9%) | 4 (57.1%) |
Fertility by Education in Delavan
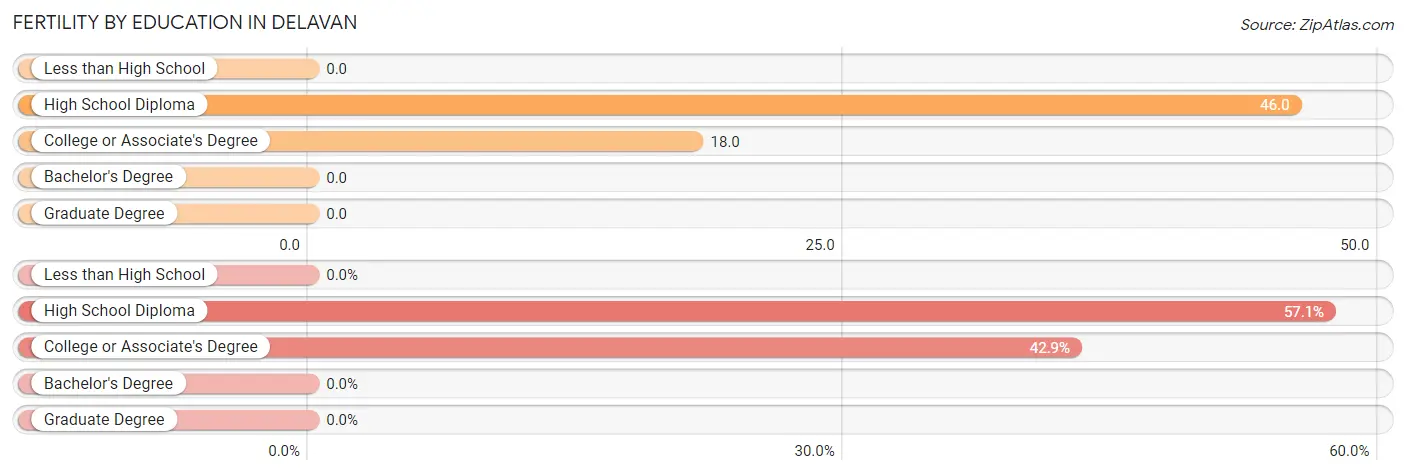
| Educational Attainment | Women with Births | Births / 1,000 Women |
| Less than High School | 0 (0.0%) | 0.0 |
| High School Diploma | 4 (57.1%) | 46.0 |
| College or Associate's Degree | 3 (42.9%) | 18.0 |
| Bachelor's Degree | 0 (0.0%) | 0.0 |
| Graduate Degree | 0 (0.0%) | 0.0 |
| Total | 7 (100.0%) | 17.0 |
Fertility by Education by Marriage Status in Delavan
57.1% of women with births in Delavan are unmarried. Women with the educational attainment of college or associate's degree are most likely to be married with 100.0% of them married at childbirth, while women with the educational attainment of high school diploma are least likely to be married with 100.0% of them unmarried at childbirth.
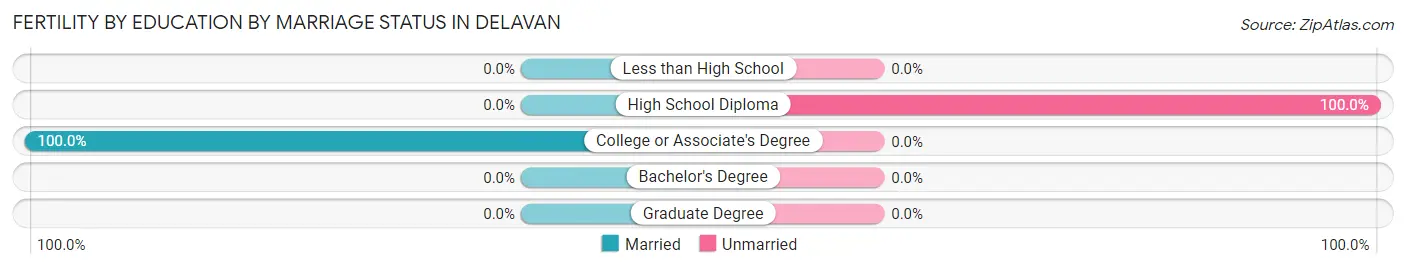
| Educational Attainment | Married | Unmarried |
| Less than High School | 0 (0.0%) | 0 (0.0%) |
| High School Diploma | 0 (0.0%) | 4 (100.0%) |
| College or Associate's Degree | 3 (100.0%) | 0 (0.0%) |
| Bachelor's Degree | 0 (0.0%) | 0 (0.0%) |
| Graduate Degree | 0 (0.0%) | 0 (0.0%) |
| Total | 3 (42.9%) | 4 (57.1%) |
Employment Characteristics in Delavan
Employment by Class of Employer in Delavan
Among the 648 employed individuals in Delavan, private company employees (506 | 78.1%), not-for-profit organizations (57 | 8.8%), and local government employees (27 | 4.2%) make up the most common classes of employment.
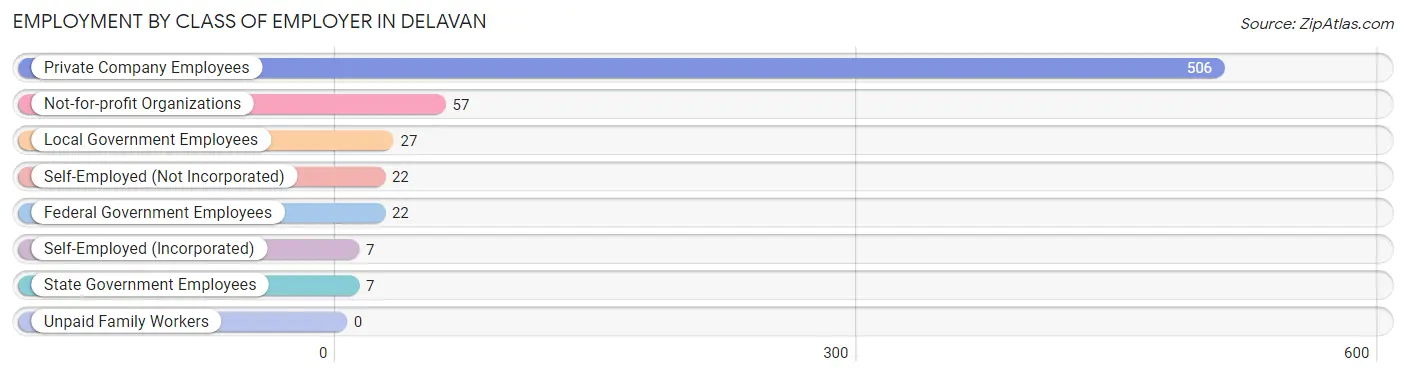
| Employer Class | # Employees | % Employees |
| Private Company Employees | 506 | 78.1% |
| Self-Employed (Incorporated) | 7 | 1.1% |
| Self-Employed (Not Incorporated) | 22 | 3.4% |
| Not-for-profit Organizations | 57 | 8.8% |
| Local Government Employees | 27 | 4.2% |
| State Government Employees | 7 | 1.1% |
| Federal Government Employees | 22 | 3.4% |
| Unpaid Family Workers | 0 | 0.0% |
| Total | 648 | 100.0% |
Employment Status by Age in Delavan
According to the labor force statistics for Delavan, out of the total population over 16 years of age (1,288), 56.1% or 723 individuals are in the labor force, with 7.8% or 56 of them unemployed. The age group with the highest labor force participation rate is 35 to 44 years, with 93.8% or 210 individuals in the labor force. Within the labor force, the 20 to 24 years age range has the highest percentage of unemployed individuals, with 37.5% or 21 of them being unemployed.
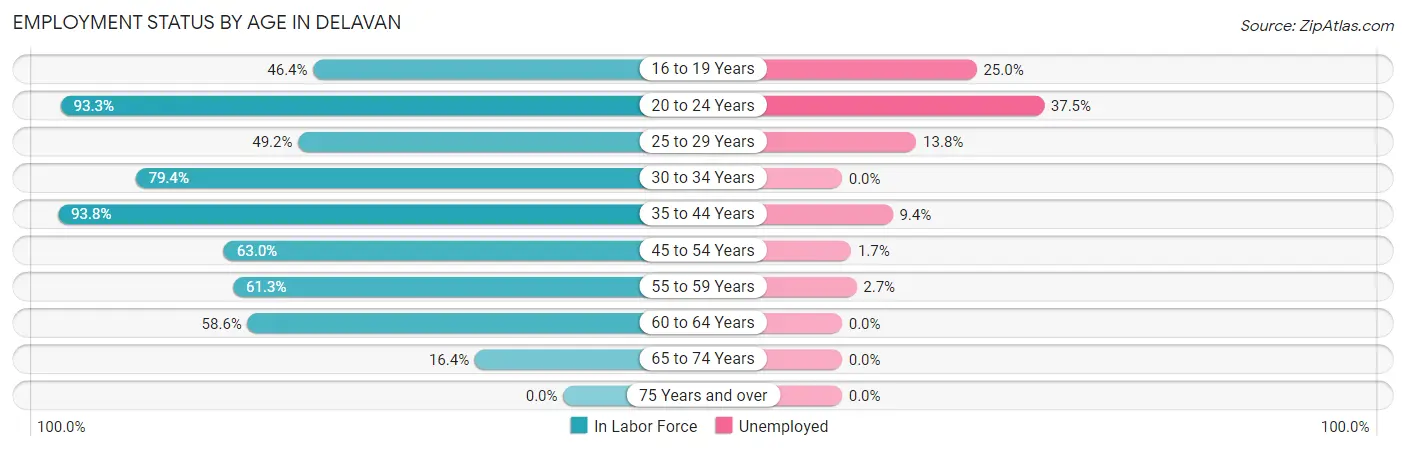
| Age Bracket | In Labor Force | Unemployed |
| 16 to 19 Years | 32 (46.4%) | 8 (25.0%) |
| 20 to 24 Years | 56 (93.3%) | 21 (37.5%) |
| 25 to 29 Years | 29 (49.2%) | 4 (13.8%) |
| 30 to 34 Years | 104 (79.4%) | 0 (0.0%) |
| 35 to 44 Years | 210 (93.8%) | 20 (9.4%) |
| 45 to 54 Years | 121 (63.0%) | 2 (1.7%) |
| 55 to 59 Years | 73 (61.3%) | 2 (2.7%) |
| 60 to 64 Years | 78 (58.6%) | 0 (0.0%) |
| 65 to 74 Years | 19 (16.4%) | 0 (0.0%) |
| 75 Years and over | 0 (0.0%) | 0 (0.0%) |
| Total | 723 (56.1%) | 56 (7.8%) |
Employment Status by Educational Attainment in Delavan
According to labor force statistics for Delavan, 71.7% of individuals (615) out of the total population between 25 and 64 years of age (858) are in the labor force, with 4.4% or 27 of them being unemployed. The group with the highest labor force participation rate are those with the educational attainment of college / associate degree, with 80.6% or 254 individuals in the labor force. Within the labor force, individuals with college / associate degree education have the highest percentage of unemployment, with 7.9% or 20 of them being unemployed.
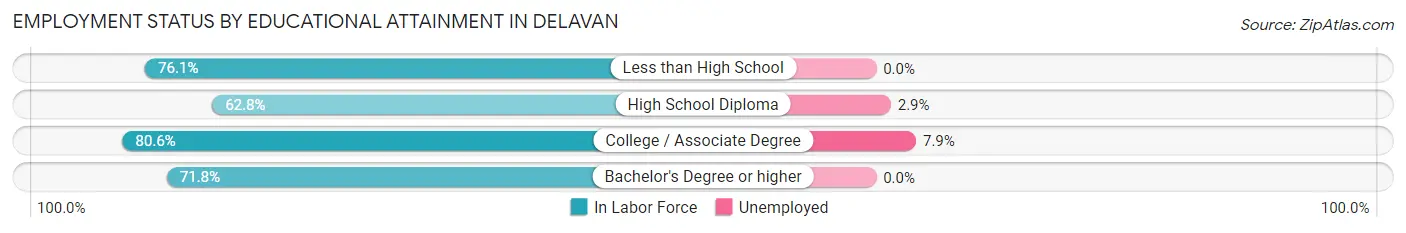
| Educational Attainment | In Labor Force | Unemployed |
| Less than High School | 54 (76.1%) | 0 (0.0%) |
| High School Diploma | 223 (62.8%) | 10 (2.9%) |
| College / Associate Degree | 254 (80.6%) | 25 (7.9%) |
| Bachelor's Degree or higher | 84 (71.8%) | 0 (0.0%) |
| Total | 615 (71.7%) | 38 (4.4%) |
Employment Occupations by Sex in Delavan
Management, Business, Science and Arts Occupations
The most common Management, Business, Science and Arts occupations in Delavan are Management (79 | 12.2%), Health Diagnosing & Treating (29 | 4.5%), Community & Social Service (25 | 3.8%), Business & Financial (24 | 3.7%), and Education Instruction & Library (21 | 3.2%).
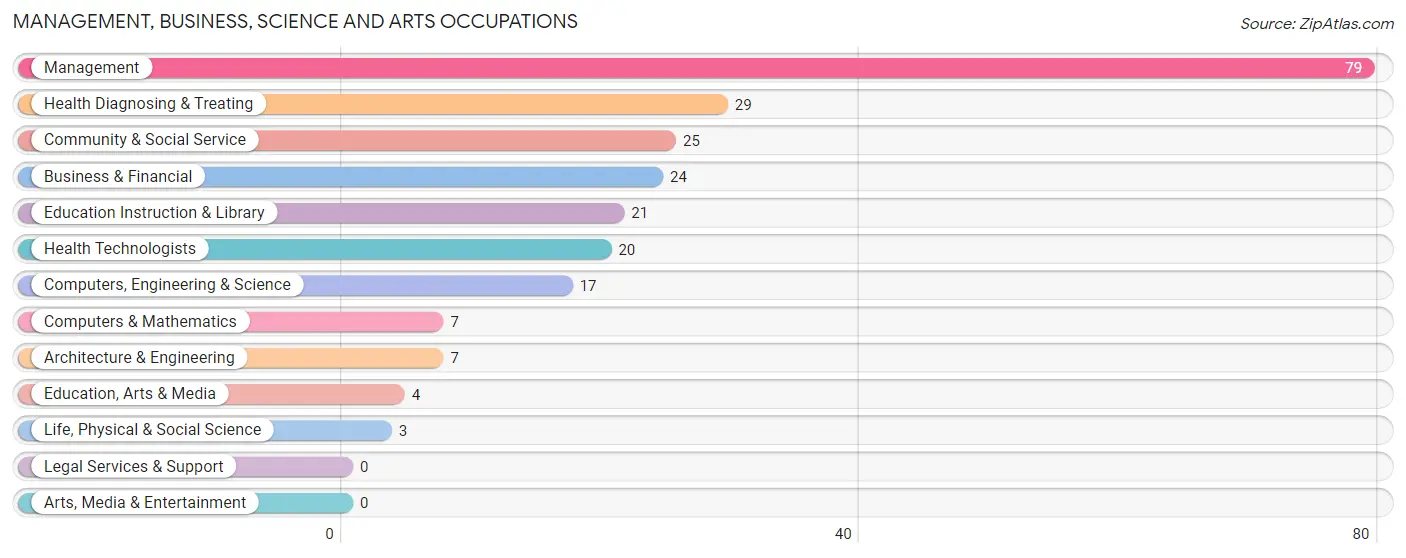
Management, Business, Science and Arts Occupations by Sex
Within the Management, Business, Science and Arts occupations in Delavan, the most male-oriented occupations are Life, Physical & Social Science (100.0%), Education, Arts & Media (100.0%), and Computers & Mathematics (57.1%), while the most female-oriented occupations are Health Diagnosing & Treating (100.0%), Health Technologists (100.0%), and Business & Financial (79.2%).
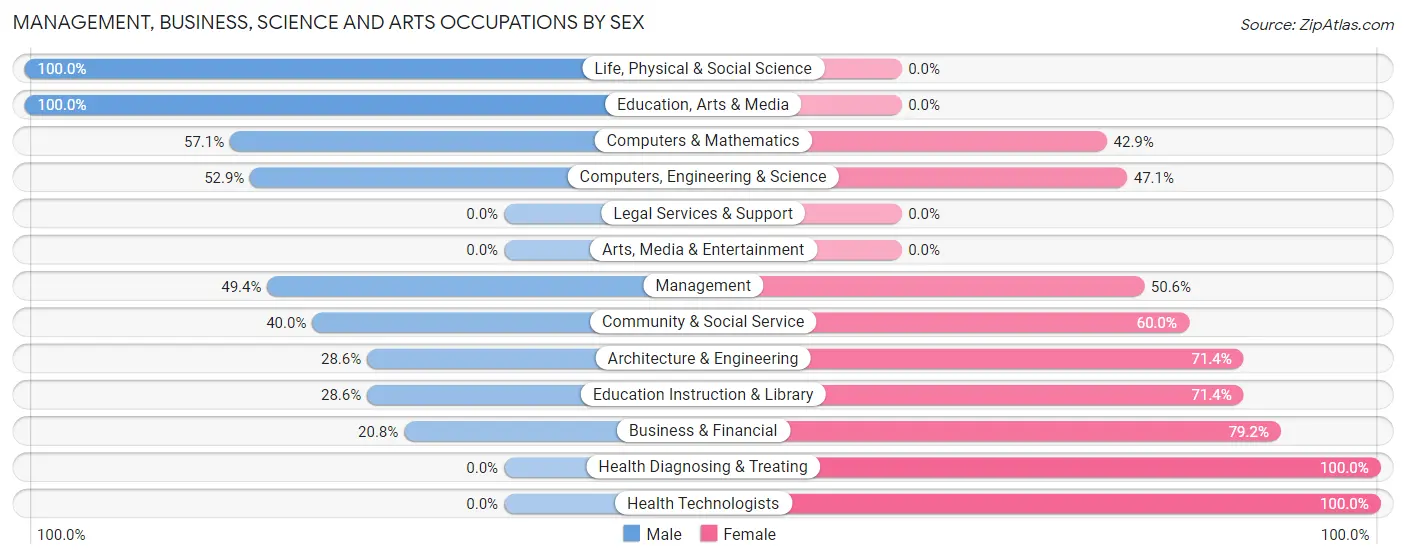
| Occupation | Male | Female |
| Management | 39 (49.4%) | 40 (50.6%) |
| Business & Financial | 5 (20.8%) | 19 (79.2%) |
| Computers, Engineering & Science | 9 (52.9%) | 8 (47.1%) |
| Computers & Mathematics | 4 (57.1%) | 3 (42.9%) |
| Architecture & Engineering | 2 (28.6%) | 5 (71.4%) |
| Life, Physical & Social Science | 3 (100.0%) | 0 (0.0%) |
| Community & Social Service | 10 (40.0%) | 15 (60.0%) |
| Education, Arts & Media | 4 (100.0%) | 0 (0.0%) |
| Legal Services & Support | 0 (0.0%) | 0 (0.0%) |
| Education Instruction & Library | 6 (28.6%) | 15 (71.4%) |
| Arts, Media & Entertainment | 0 (0.0%) | 0 (0.0%) |
| Health Diagnosing & Treating | 0 (0.0%) | 29 (100.0%) |
| Health Technologists | 0 (0.0%) | 20 (100.0%) |
| Total (Category) | 63 (36.2%) | 111 (63.8%) |
| Total (Overall) | 291 (44.8%) | 358 (55.2%) |
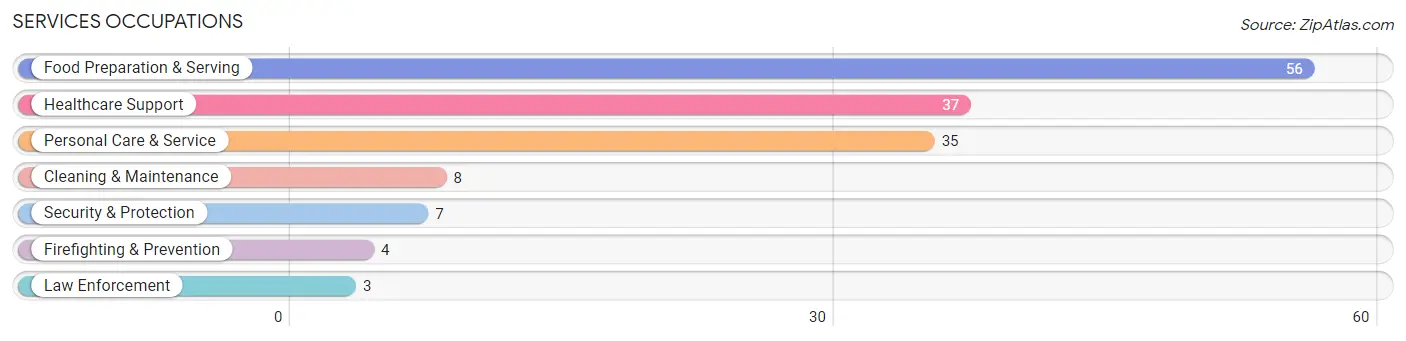
Services Occupations
The most common Services occupations in Delavan are Food Preparation & Serving (56 | 8.6%), Healthcare Support (37 | 5.7%), Personal Care & Service (35 | 5.4%), Cleaning & Maintenance (8 | 1.2%), and Security & Protection (7 | 1.1%).
Services Occupations by Sex
Within the Services occupations in Delavan, the most male-oriented occupations are Law Enforcement (100.0%), Security & Protection (42.9%), and Personal Care & Service (11.4%), while the most female-oriented occupations are Healthcare Support (100.0%), Firefighting & Prevention (100.0%), and Cleaning & Maintenance (100.0%).
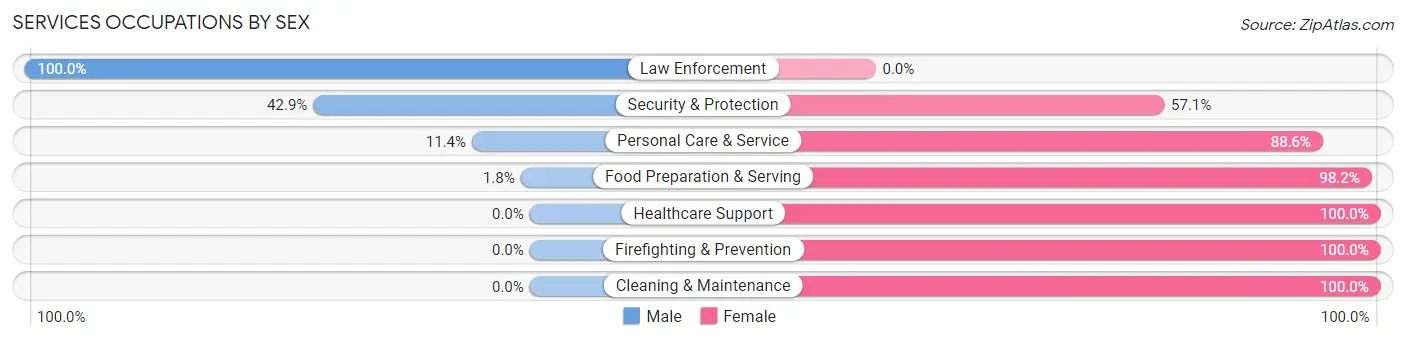
| Occupation | Male | Female |
| Healthcare Support | 0 (0.0%) | 37 (100.0%) |
| Security & Protection | 3 (42.9%) | 4 (57.1%) |
| Firefighting & Prevention | 0 (0.0%) | 4 (100.0%) |
| Law Enforcement | 3 (100.0%) | 0 (0.0%) |
| Food Preparation & Serving | 1 (1.8%) | 55 (98.2%) |
| Cleaning & Maintenance | 0 (0.0%) | 8 (100.0%) |
| Personal Care & Service | 4 (11.4%) | 31 (88.6%) |
| Total (Category) | 8 (5.6%) | 135 (94.4%) |
| Total (Overall) | 291 (44.8%) | 358 (55.2%) |
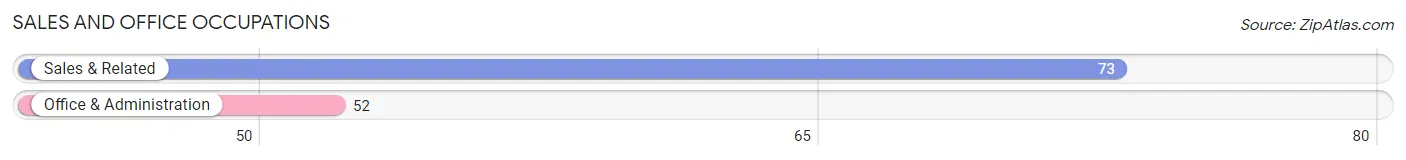
Sales and Office Occupations
The most common Sales and Office occupations in Delavan are Sales & Related (73 | 11.3%), and Office & Administration (52 | 8.0%).
Sales and Office Occupations by Sex
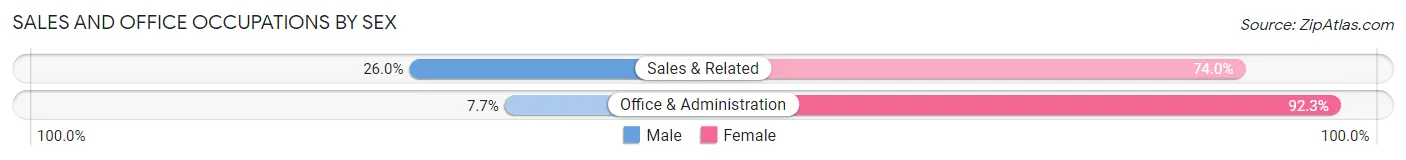
| Occupation | Male | Female |
| Sales & Related | 19 (26.0%) | 54 (74.0%) |
| Office & Administration | 4 (7.7%) | 48 (92.3%) |
| Total (Category) | 23 (18.4%) | 102 (81.6%) |
| Total (Overall) | 291 (44.8%) | 358 (55.2%) |
Natural Resources, Construction and Maintenance Occupations
The most common Natural Resources, Construction and Maintenance occupations in Delavan are Construction & Extraction (53 | 8.2%), and Installation, Maintenance & Repair (21 | 3.2%).
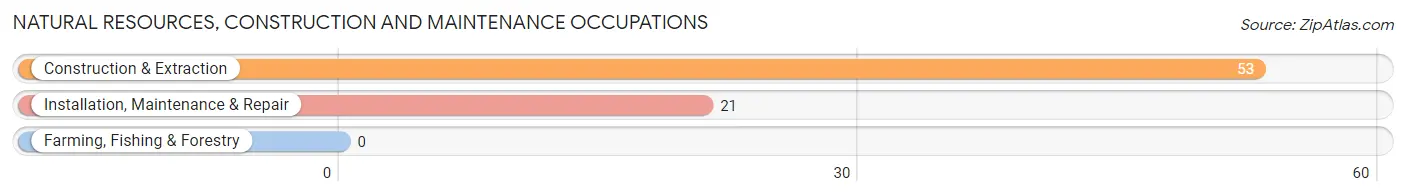
Natural Resources, Construction and Maintenance Occupations by Sex
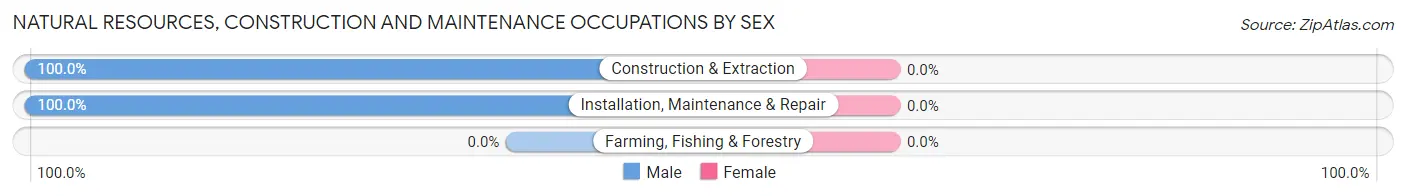
| Occupation | Male | Female |
| Farming, Fishing & Forestry | 0 (0.0%) | 0 (0.0%) |
| Construction & Extraction | 53 (100.0%) | 0 (0.0%) |
| Installation, Maintenance & Repair | 21 (100.0%) | 0 (0.0%) |
| Total (Category) | 74 (100.0%) | 0 (0.0%) |
| Total (Overall) | 291 (44.8%) | 358 (55.2%) |
Production, Transportation and Moving Occupations
The most common Production, Transportation and Moving occupations in Delavan are Production (93 | 14.3%), Transportation (30 | 4.6%), and Material Moving (10 | 1.5%).
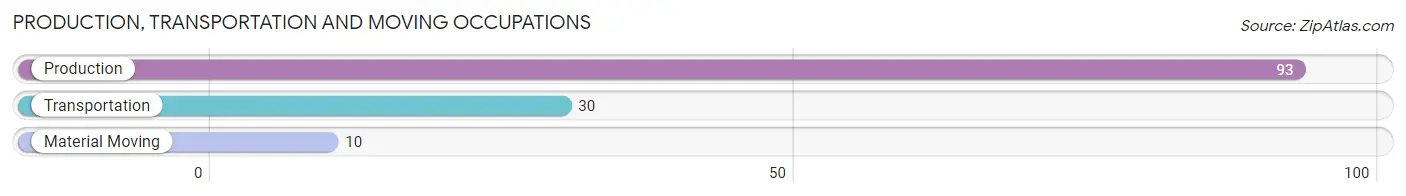
Production, Transportation and Moving Occupations by Sex
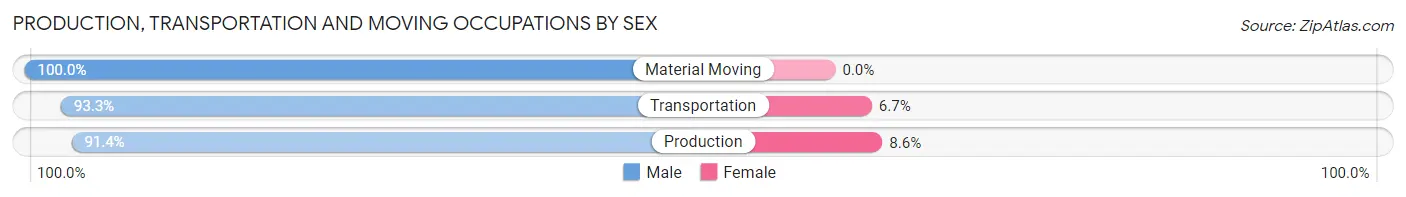
| Occupation | Male | Female |
| Production | 85 (91.4%) | 8 (8.6%) |
| Transportation | 28 (93.3%) | 2 (6.7%) |
| Material Moving | 10 (100.0%) | 0 (0.0%) |
| Total (Category) | 123 (92.5%) | 10 (7.5%) |
| Total (Overall) | 291 (44.8%) | 358 (55.2%) |
Employment Industries by Sex in Delavan
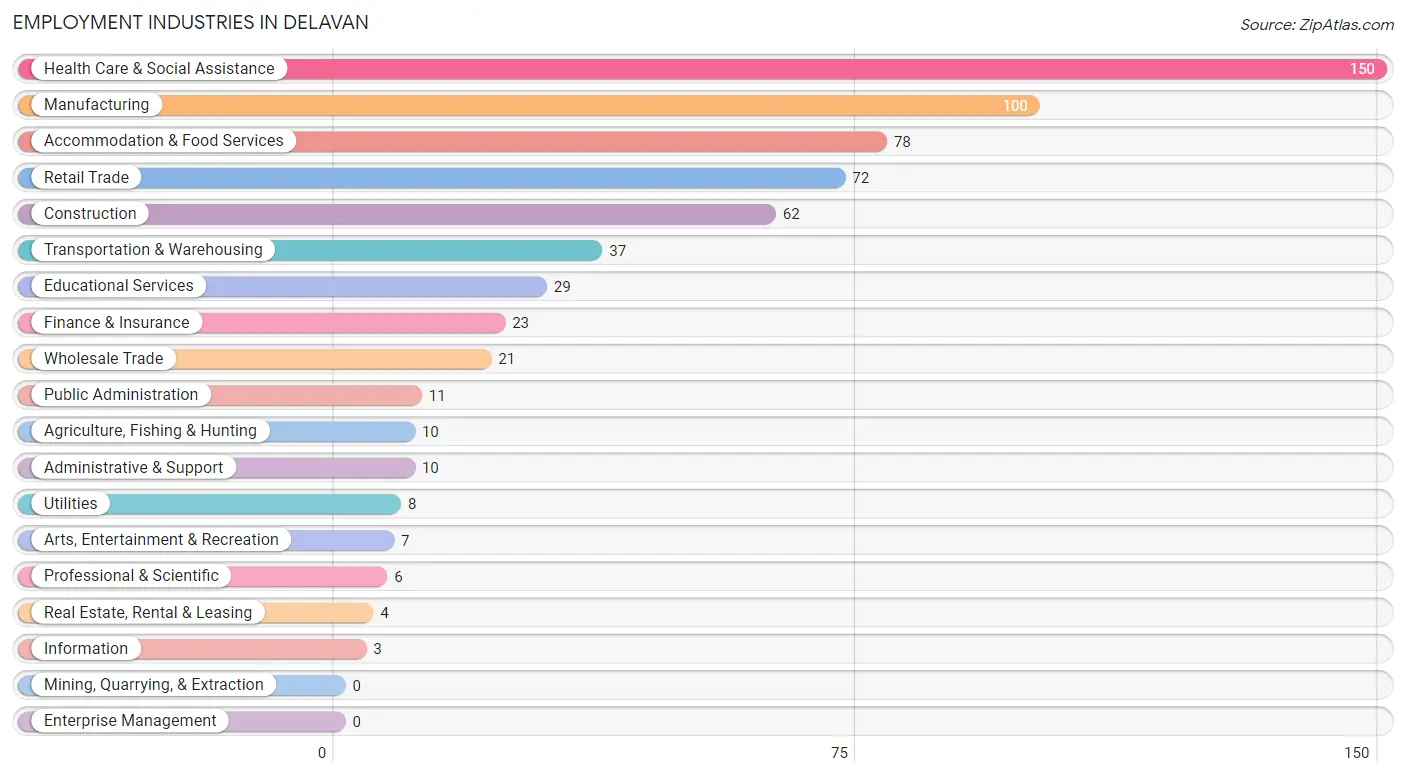
Employment Industries in Delavan
The major employment industries in Delavan include Health Care & Social Assistance (150 | 23.1%), Manufacturing (100 | 15.4%), Accommodation & Food Services (78 | 12.0%), Retail Trade (72 | 11.1%), and Construction (62 | 9.6%).
Employment Industries by Sex in Delavan
The Delavan industries that see more men than women are Transportation & Warehousing (100.0%), Utilities (100.0%), and Real Estate, Rental & Leasing (100.0%), whereas the industries that tend to have a higher number of women are Information (100.0%), Administrative & Support (100.0%), and Accommodation & Food Services (93.6%).
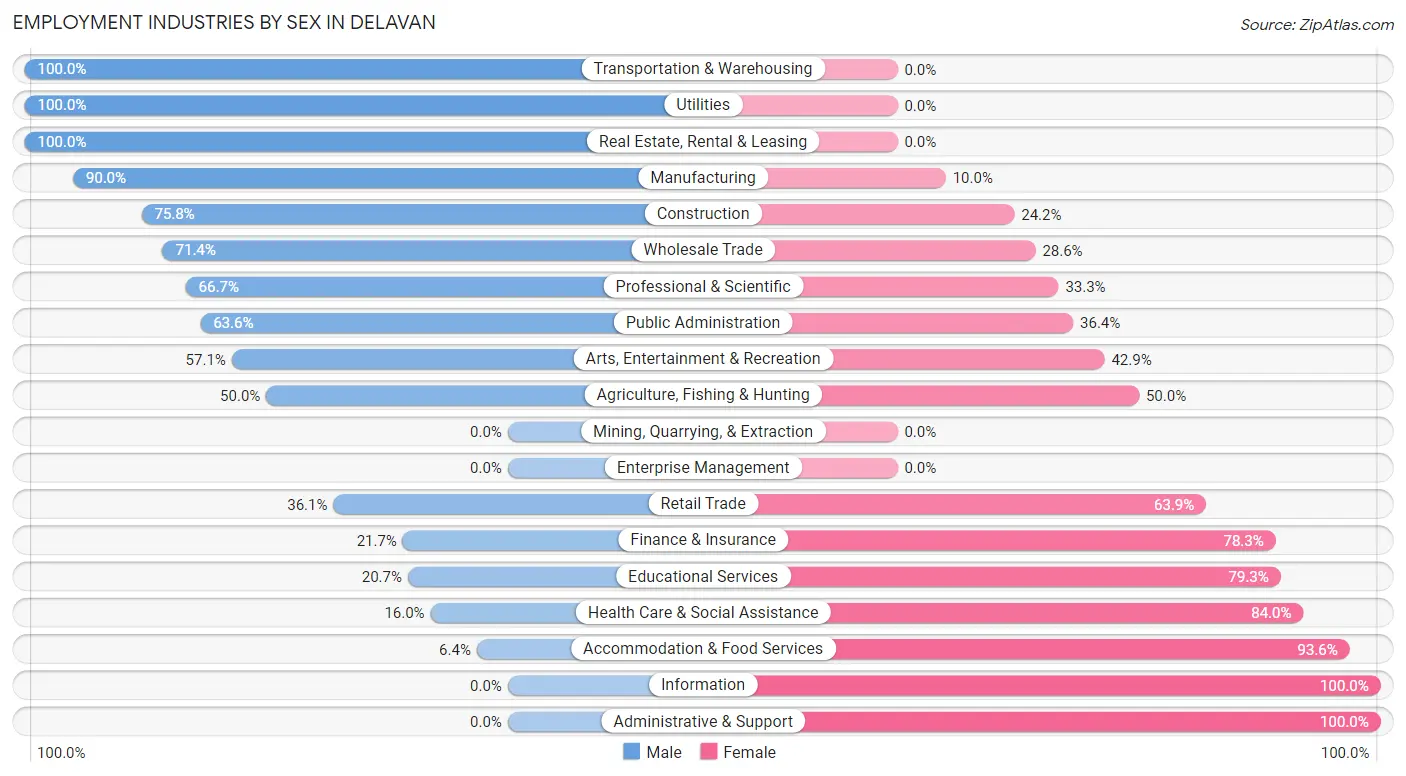
| Industry | Male | Female |
| Agriculture, Fishing & Hunting | 5 (50.0%) | 5 (50.0%) |
| Mining, Quarrying, & Extraction | 0 (0.0%) | 0 (0.0%) |
| Construction | 47 (75.8%) | 15 (24.2%) |
| Manufacturing | 90 (90.0%) | 10 (10.0%) |
| Wholesale Trade | 15 (71.4%) | 6 (28.6%) |
| Retail Trade | 26 (36.1%) | 46 (63.9%) |
| Transportation & Warehousing | 37 (100.0%) | 0 (0.0%) |
| Utilities | 8 (100.0%) | 0 (0.0%) |
| Information | 0 (0.0%) | 3 (100.0%) |
| Finance & Insurance | 5 (21.7%) | 18 (78.3%) |
| Real Estate, Rental & Leasing | 4 (100.0%) | 0 (0.0%) |
| Professional & Scientific | 4 (66.7%) | 2 (33.3%) |
| Enterprise Management | 0 (0.0%) | 0 (0.0%) |
| Administrative & Support | 0 (0.0%) | 10 (100.0%) |
| Educational Services | 6 (20.7%) | 23 (79.3%) |
| Health Care & Social Assistance | 24 (16.0%) | 126 (84.0%) |
| Arts, Entertainment & Recreation | 4 (57.1%) | 3 (42.9%) |
| Accommodation & Food Services | 5 (6.4%) | 73 (93.6%) |
| Public Administration | 7 (63.6%) | 4 (36.4%) |
| Total | 291 (44.8%) | 358 (55.2%) |
Education in Delavan
School Enrollment in Delavan
The most common levels of schooling among the 481 students in Delavan are middle school (183 | 38.1%), elementary school (116 | 24.1%), and high school (106 | 22.0%).
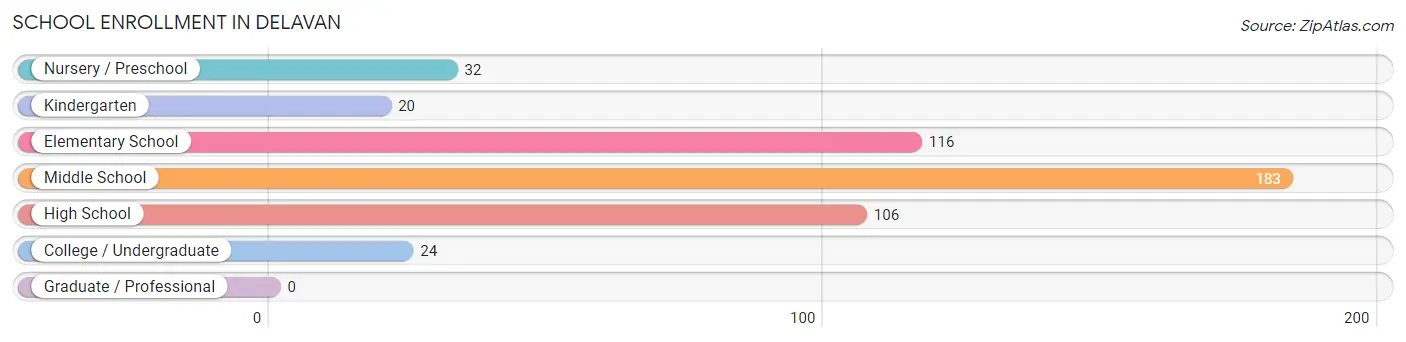
| School Level | # Students | % Students |
| Nursery / Preschool | 32 | 6.7% |
| Kindergarten | 20 | 4.2% |
| Elementary School | 116 | 24.1% |
| Middle School | 183 | 38.1% |
| High School | 106 | 22.0% |
| College / Undergraduate | 24 | 5.0% |
| Graduate / Professional | 0 | 0.0% |
| Total | 481 | 100.0% |
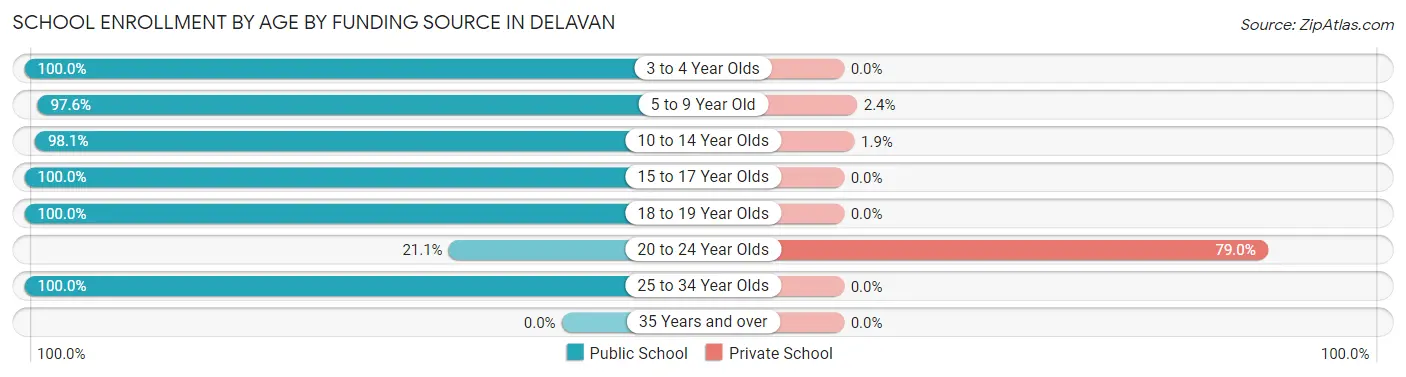
School Enrollment by Age by Funding Source in Delavan
Out of a total of 481 students who are enrolled in schools in Delavan, 22 (4.6%) attend a private institution, while the remaining 459 (95.4%) are enrolled in public schools. The age group of 20 to 24 year olds has the highest likelihood of being enrolled in private schools, with 15 (78.9% in the age bracket) enrolled. Conversely, the age group of 3 to 4 year olds has the lowest likelihood of being enrolled in a private school, with 32 (100.0% in the age bracket) attending a public institution.
| Age Bracket | Public School | Private School |
| 3 to 4 Year Olds | 32 (100.0%) | 0 (0.0%) |
| 5 to 9 Year Old | 120 (97.6%) | 3 (2.4%) |
| 10 to 14 Year Olds | 202 (98.1%) | 4 (1.9%) |
| 15 to 17 Year Olds | 79 (100.0%) | 0 (0.0%) |
| 18 to 19 Year Olds | 17 (100.0%) | 0 (0.0%) |
| 20 to 24 Year Olds | 4 (21.0%) | 15 (78.9%) |
| 25 to 34 Year Olds | 5 (100.0%) | 0 (0.0%) |
| 35 Years and over | 0 (0.0%) | 0 (0.0%) |
| Total | 459 (95.4%) | 22 (4.6%) |
Educational Attainment by Field of Study in Delavan
Bio, nature & agricultural (39 | 22.8%), science & technology (29 | 17.0%), education (28 | 16.4%), engineering (15 | 8.8%), and business (14 | 8.2%) are the most common fields of study among 171 individuals in Delavan who have obtained a bachelor's degree or higher.
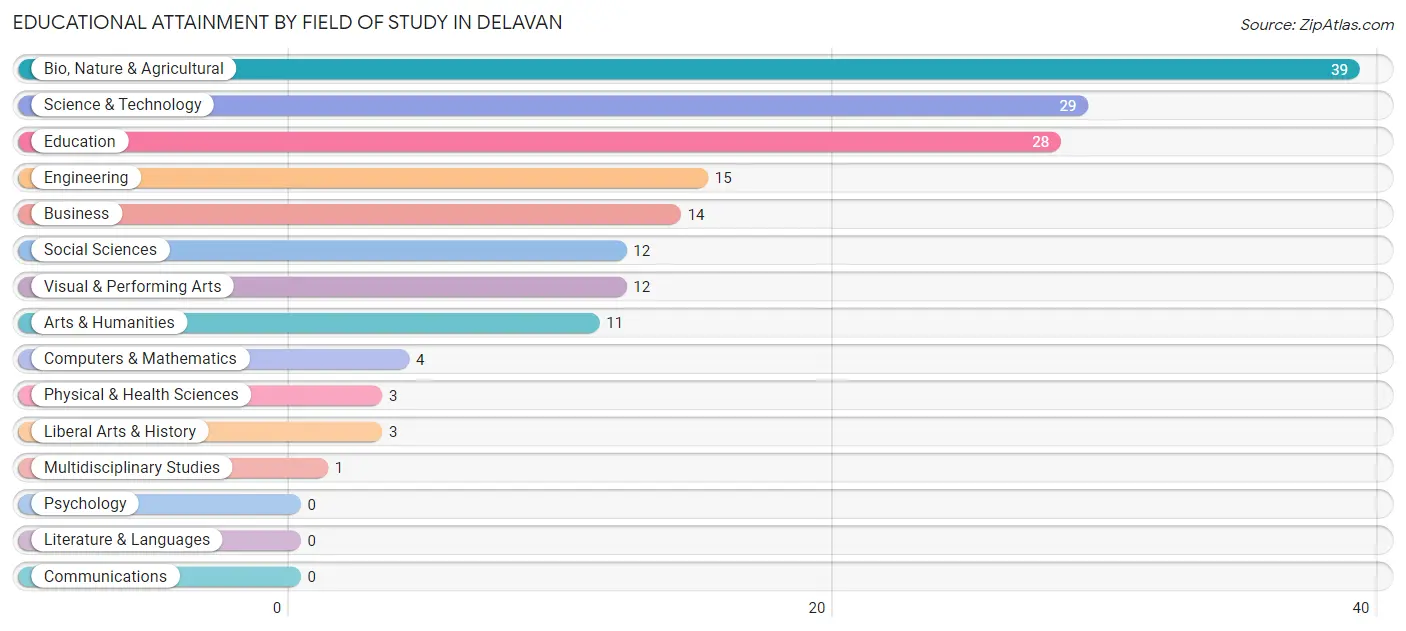
| Field of Study | # Graduates | % Graduates |
| Computers & Mathematics | 4 | 2.3% |
| Bio, Nature & Agricultural | 39 | 22.8% |
| Physical & Health Sciences | 3 | 1.8% |
| Psychology | 0 | 0.0% |
| Social Sciences | 12 | 7.0% |
| Engineering | 15 | 8.8% |
| Multidisciplinary Studies | 1 | 0.6% |
| Science & Technology | 29 | 17.0% |
| Business | 14 | 8.2% |
| Education | 28 | 16.4% |
| Literature & Languages | 0 | 0.0% |
| Liberal Arts & History | 3 | 1.8% |
| Visual & Performing Arts | 12 | 7.0% |
| Communications | 0 | 0.0% |
| Arts & Humanities | 11 | 6.4% |
| Total | 171 | 100.0% |
Transportation & Commute in Delavan
Vehicle Availability by Sex in Delavan
The most prevalent vehicle ownership categories in Delavan are males with 2 vehicles (135, accounting for 46.4%) and females with 2 vehicles (133, making up 37.8%).
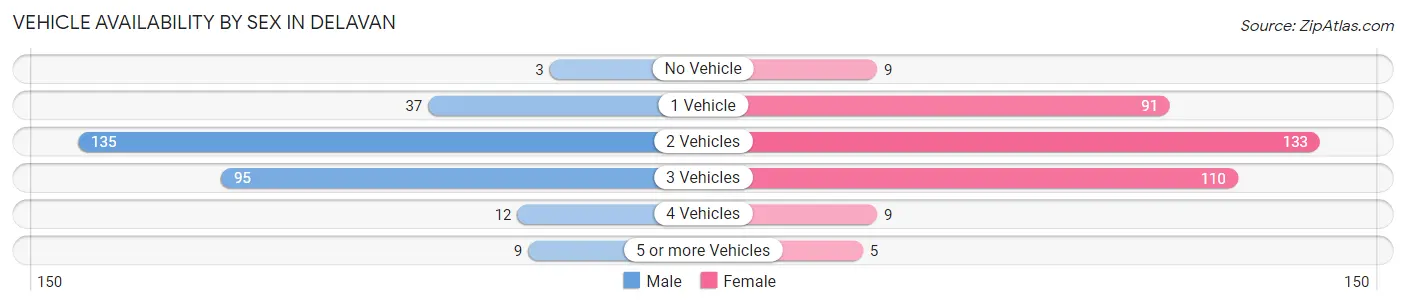
| Vehicles Available | Male | Female |
| No Vehicle | 3 (1.0%) | 9 (2.5%) |
| 1 Vehicle | 37 (12.7%) | 91 (25.5%) |
| 2 Vehicles | 135 (46.4%) | 133 (37.2%) |
| 3 Vehicles | 95 (32.7%) | 110 (30.8%) |
| 4 Vehicles | 12 (4.1%) | 9 (2.5%) |
| 5 or more Vehicles | 9 (3.1%) | 5 (1.4%) |
| Total | 291 (100.0%) | 357 (100.0%) |
Commute Time in Delavan
The most frequently occuring commute durations in Delavan are 30 to 34 minutes (107 commuters, 17.0%), 25 to 29 minutes (88 commuters, 14.0%), and 15 to 19 minutes (78 commuters, 12.4%).
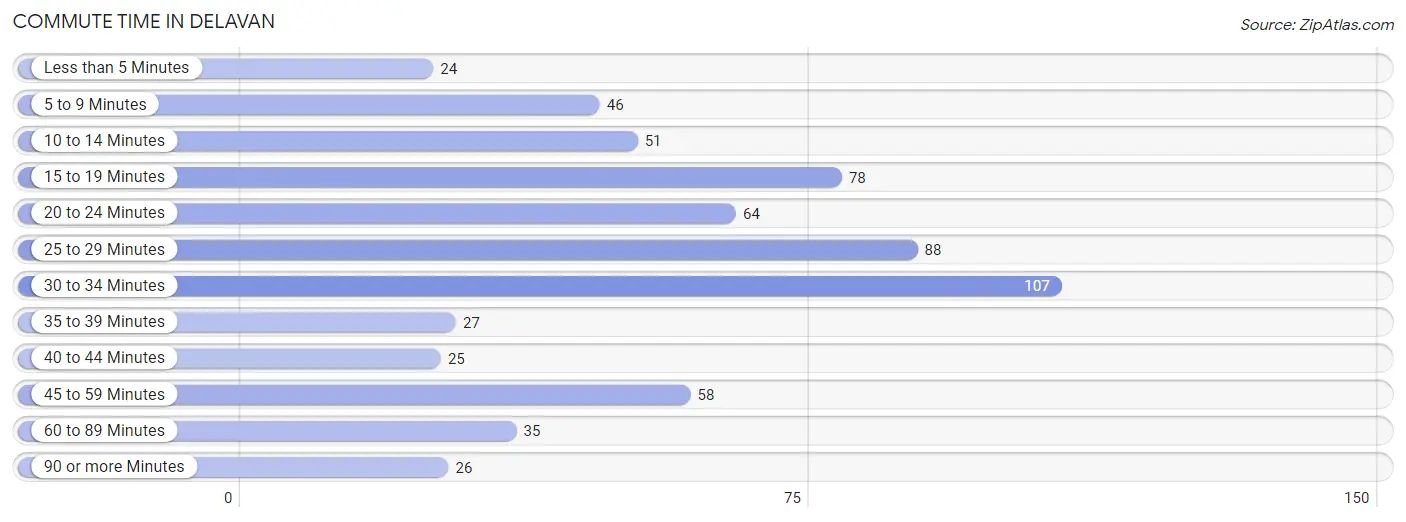
| Commute Time | # Commuters | % Commuters |
| Less than 5 Minutes | 24 | 3.8% |
| 5 to 9 Minutes | 46 | 7.3% |
| 10 to 14 Minutes | 51 | 8.1% |
| 15 to 19 Minutes | 78 | 12.4% |
| 20 to 24 Minutes | 64 | 10.2% |
| 25 to 29 Minutes | 88 | 14.0% |
| 30 to 34 Minutes | 107 | 17.0% |
| 35 to 39 Minutes | 27 | 4.3% |
| 40 to 44 Minutes | 25 | 4.0% |
| 45 to 59 Minutes | 58 | 9.2% |
| 60 to 89 Minutes | 35 | 5.6% |
| 90 or more Minutes | 26 | 4.1% |
Commute Time by Sex in Delavan
The most common commute times in Delavan are 30 to 34 minutes (51 commuters, 17.6%) for males and 30 to 34 minutes (56 commuters, 16.5%) for females.
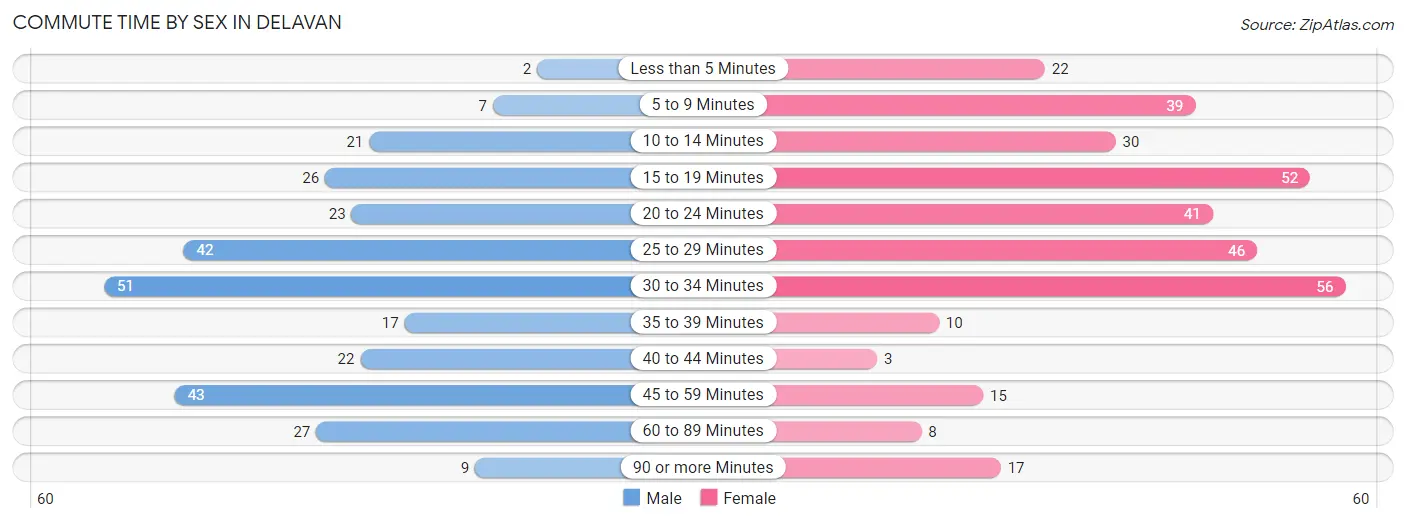
| Commute Time | Male | Female |
| Less than 5 Minutes | 2 (0.7%) | 22 (6.5%) |
| 5 to 9 Minutes | 7 (2.4%) | 39 (11.5%) |
| 10 to 14 Minutes | 21 (7.2%) | 30 (8.8%) |
| 15 to 19 Minutes | 26 (9.0%) | 52 (15.3%) |
| 20 to 24 Minutes | 23 (7.9%) | 41 (12.1%) |
| 25 to 29 Minutes | 42 (14.5%) | 46 (13.6%) |
| 30 to 34 Minutes | 51 (17.6%) | 56 (16.5%) |
| 35 to 39 Minutes | 17 (5.9%) | 10 (2.9%) |
| 40 to 44 Minutes | 22 (7.6%) | 3 (0.9%) |
| 45 to 59 Minutes | 43 (14.8%) | 15 (4.4%) |
| 60 to 89 Minutes | 27 (9.3%) | 8 (2.4%) |
| 90 or more Minutes | 9 (3.1%) | 17 (5.0%) |
Time of Departure to Work by Sex in Delavan
The most frequent times of departure to work in Delavan are 6:30 AM to 6:59 AM (47, 16.2%) for males and 7:30 AM to 7:59 AM (64, 18.9%) for females.
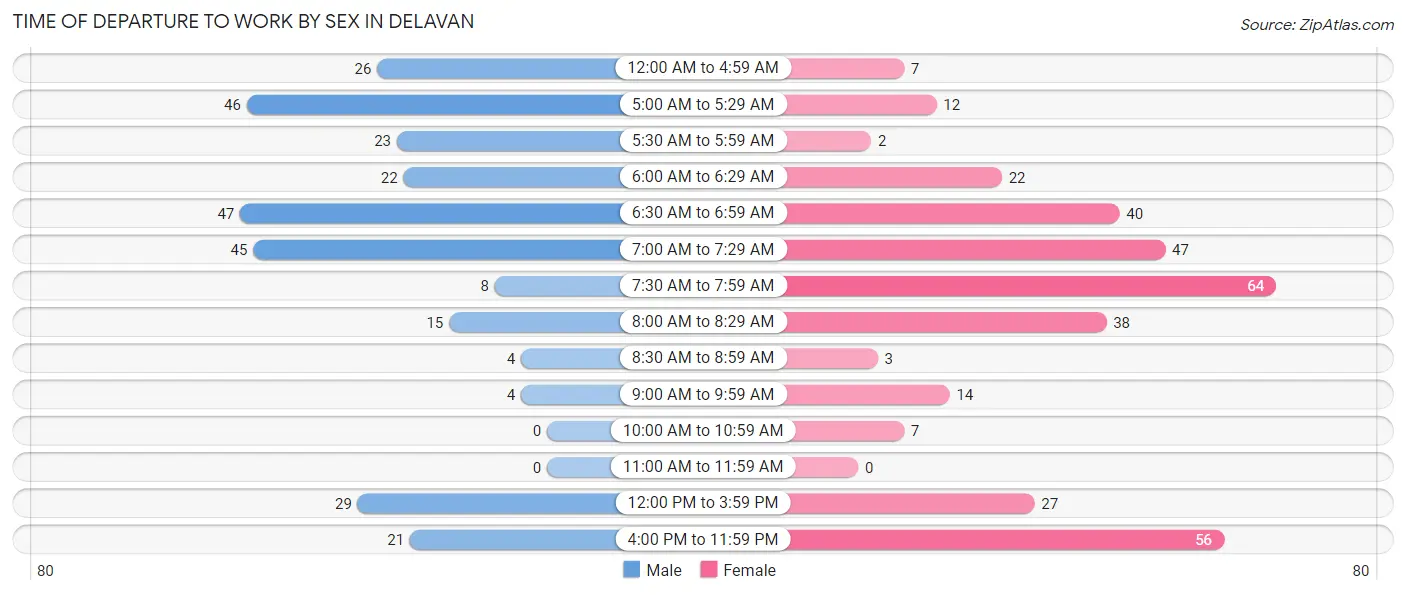
| Time of Departure | Male | Female |
| 12:00 AM to 4:59 AM | 26 (9.0%) | 7 (2.1%) |
| 5:00 AM to 5:29 AM | 46 (15.9%) | 12 (3.5%) |
| 5:30 AM to 5:59 AM | 23 (7.9%) | 2 (0.6%) |
| 6:00 AM to 6:29 AM | 22 (7.6%) | 22 (6.5%) |
| 6:30 AM to 6:59 AM | 47 (16.2%) | 40 (11.8%) |
| 7:00 AM to 7:29 AM | 45 (15.5%) | 47 (13.9%) |
| 7:30 AM to 7:59 AM | 8 (2.8%) | 64 (18.9%) |
| 8:00 AM to 8:29 AM | 15 (5.2%) | 38 (11.2%) |
| 8:30 AM to 8:59 AM | 4 (1.4%) | 3 (0.9%) |
| 9:00 AM to 9:59 AM | 4 (1.4%) | 14 (4.1%) |
| 10:00 AM to 10:59 AM | 0 (0.0%) | 7 (2.1%) |
| 11:00 AM to 11:59 AM | 0 (0.0%) | 0 (0.0%) |
| 12:00 PM to 3:59 PM | 29 (10.0%) | 27 (8.0%) |
| 4:00 PM to 11:59 PM | 21 (7.2%) | 56 (16.5%) |
| Total | 290 (100.0%) | 339 (100.0%) |
Housing Occupancy in Delavan
Occupancy by Ownership in Delavan
Of the total 667 dwellings in Delavan, owner-occupied units account for 524 (78.6%), while renter-occupied units make up 143 (21.4%).
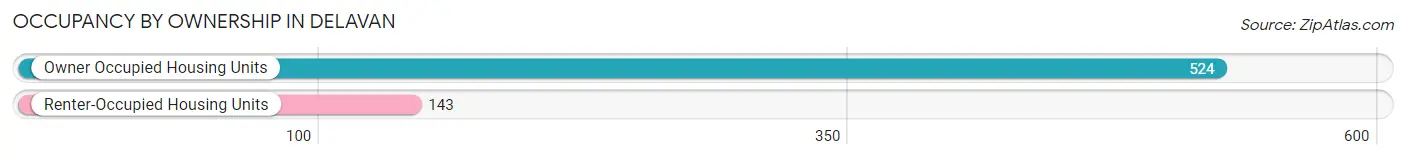
| Occupancy | # Housing Units | % Housing Units |
| Owner Occupied Housing Units | 524 | 78.6% |
| Renter-Occupied Housing Units | 143 | 21.4% |
| Total Occupied Housing Units | 667 | 100.0% |
Occupancy by Household Size in Delavan
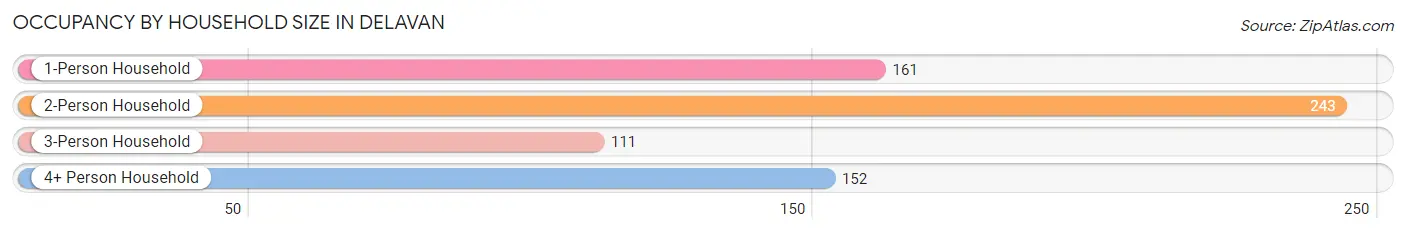
| Household Size | # Housing Units | % Housing Units |
| 1-Person Household | 161 | 24.1% |
| 2-Person Household | 243 | 36.4% |
| 3-Person Household | 111 | 16.6% |
| 4+ Person Household | 152 | 22.8% |
| Total Housing Units | 667 | 100.0% |
Occupancy by Ownership by Household Size in Delavan
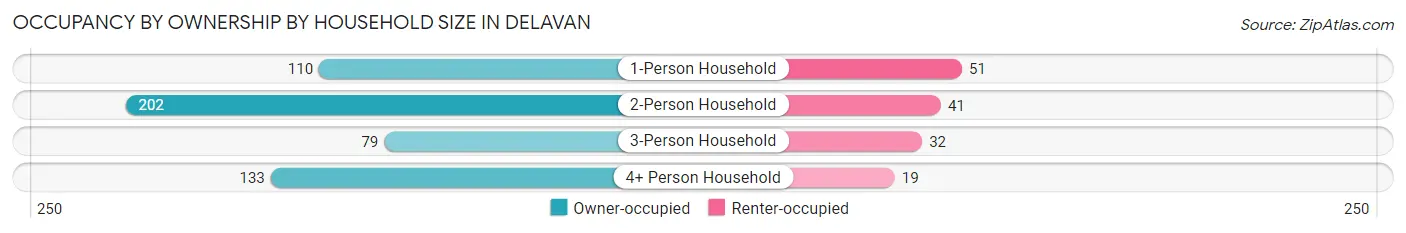
| Household Size | Owner-occupied | Renter-occupied |
| 1-Person Household | 110 (68.3%) | 51 (31.7%) |
| 2-Person Household | 202 (83.1%) | 41 (16.9%) |
| 3-Person Household | 79 (71.2%) | 32 (28.8%) |
| 4+ Person Household | 133 (87.5%) | 19 (12.5%) |
| Total Housing Units | 524 (78.6%) | 143 (21.4%) |
Occupancy by Educational Attainment in Delavan
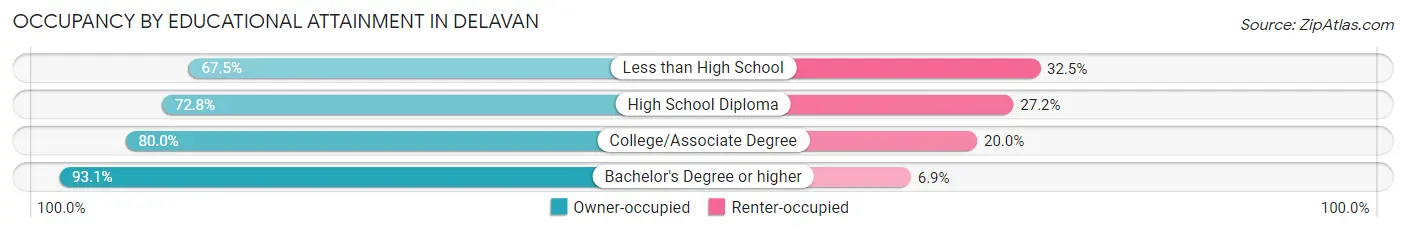
| Household Size | Owner-occupied | Renter-occupied |
| Less than High School | 27 (67.5%) | 13 (32.5%) |
| High School Diploma | 182 (72.8%) | 68 (27.2%) |
| College/Associate Degree | 220 (80.0%) | 55 (20.0%) |
| Bachelor's Degree or higher | 95 (93.1%) | 7 (6.9%) |
Occupancy by Age of Householder in Delavan
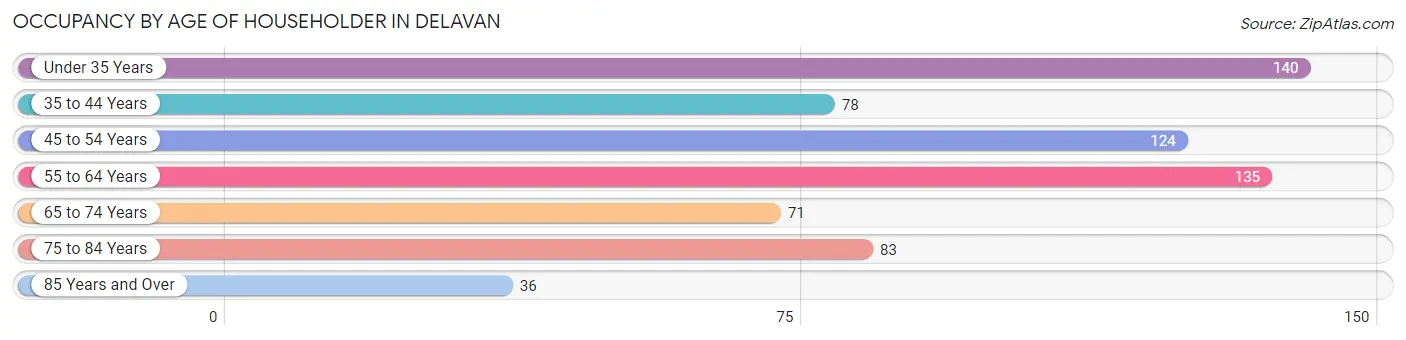
| Age Bracket | # Households | % Households |
| Under 35 Years | 140 | 21.0% |
| 35 to 44 Years | 78 | 11.7% |
| 45 to 54 Years | 124 | 18.6% |
| 55 to 64 Years | 135 | 20.2% |
| 65 to 74 Years | 71 | 10.6% |
| 75 to 84 Years | 83 | 12.4% |
| 85 Years and Over | 36 | 5.4% |
| Total | 667 | 100.0% |
Housing Finances in Delavan
Median Income by Occupancy in Delavan
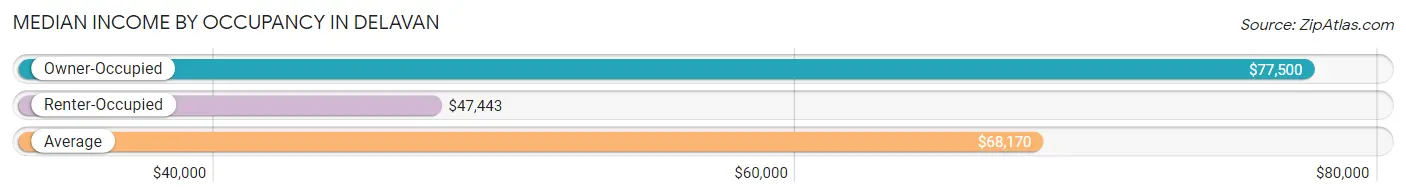
| Occupancy Type | # Households | Median Income |
| Owner-Occupied | 524 (78.6%) | $77,500 |
| Renter-Occupied | 143 (21.4%) | $47,443 |
| Average | 667 (100.0%) | $68,170 |
Occupancy by Householder Income Bracket in Delavan
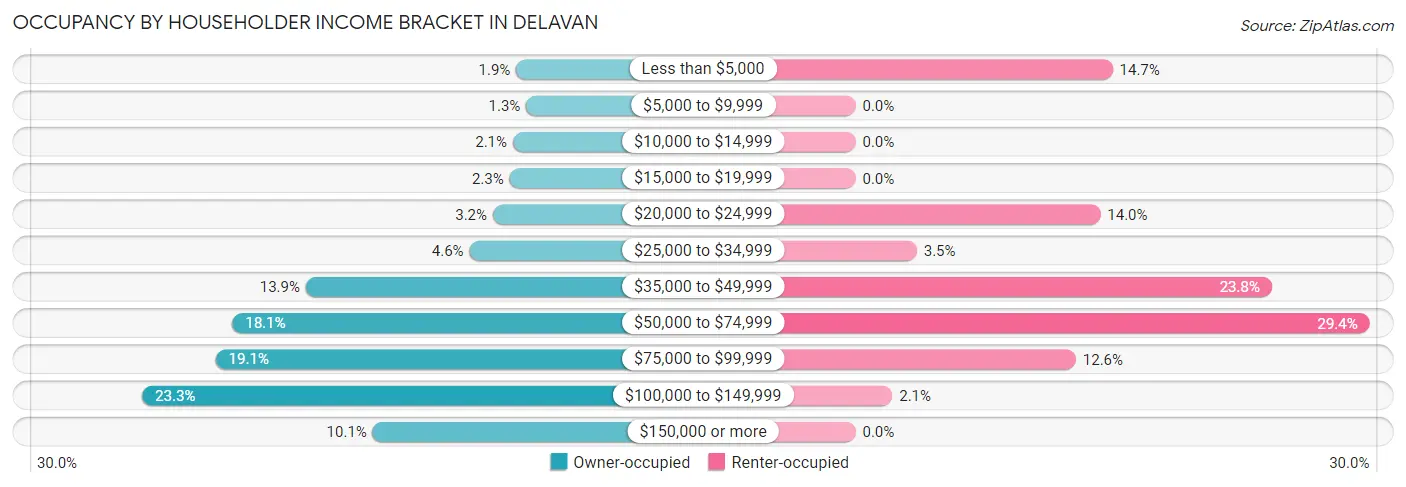
| Income Bracket | Owner-occupied | Renter-occupied |
| Less than $5,000 | 10 (1.9%) | 21 (14.7%) |
| $5,000 to $9,999 | 7 (1.3%) | 0 (0.0%) |
| $10,000 to $14,999 | 11 (2.1%) | 0 (0.0%) |
| $15,000 to $19,999 | 12 (2.3%) | 0 (0.0%) |
| $20,000 to $24,999 | 17 (3.2%) | 20 (14.0%) |
| $25,000 to $34,999 | 24 (4.6%) | 5 (3.5%) |
| $35,000 to $49,999 | 73 (13.9%) | 34 (23.8%) |
| $50,000 to $74,999 | 95 (18.1%) | 42 (29.4%) |
| $75,000 to $99,999 | 100 (19.1%) | 18 (12.6%) |
| $100,000 to $149,999 | 122 (23.3%) | 3 (2.1%) |
| $150,000 or more | 53 (10.1%) | 0 (0.0%) |
| Total | 524 (100.0%) | 143 (100.0%) |
Monthly Housing Cost Tiers in Delavan
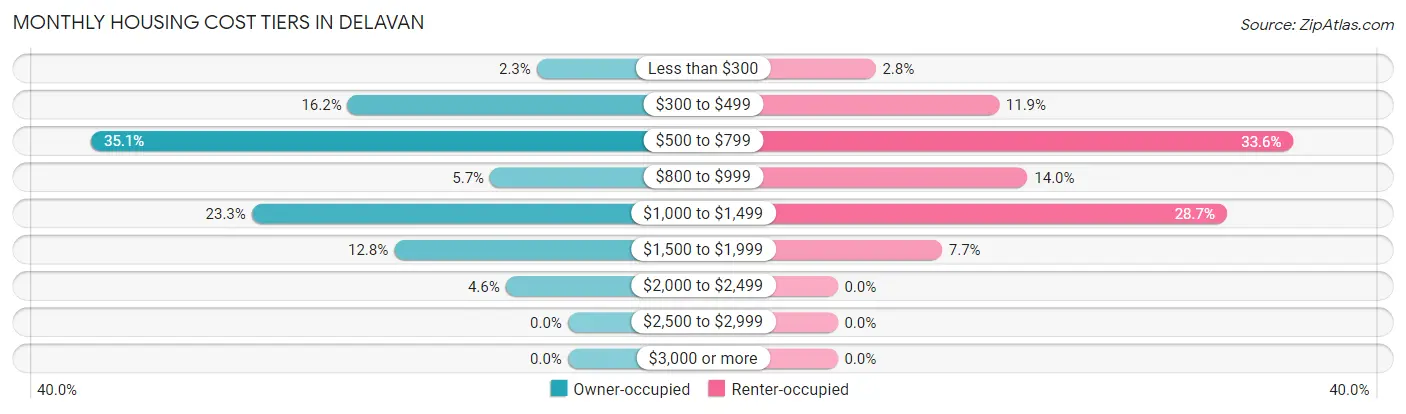
| Monthly Cost | Owner-occupied | Renter-occupied |
| Less than $300 | 12 (2.3%) | 4 (2.8%) |
| $300 to $499 | 85 (16.2%) | 17 (11.9%) |
| $500 to $799 | 184 (35.1%) | 48 (33.6%) |
| $800 to $999 | 30 (5.7%) | 20 (14.0%) |
| $1,000 to $1,499 | 122 (23.3%) | 41 (28.7%) |
| $1,500 to $1,999 | 67 (12.8%) | 11 (7.7%) |
| $2,000 to $2,499 | 24 (4.6%) | 0 (0.0%) |
| $2,500 to $2,999 | 0 (0.0%) | 0 (0.0%) |
| $3,000 or more | 0 (0.0%) | 0 (0.0%) |
| Total | 524 (100.0%) | 143 (100.0%) |
Physical Housing Characteristics in Delavan
Housing Structures in Delavan
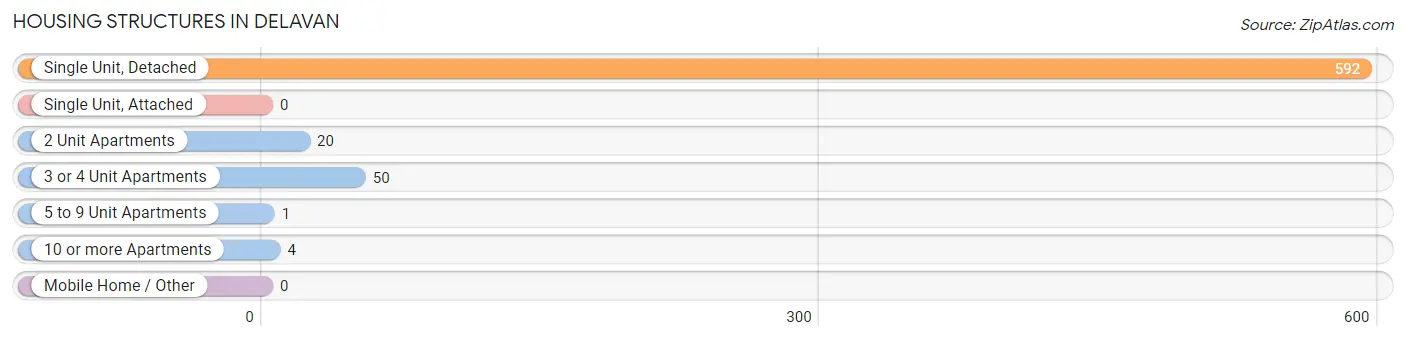
| Structure Type | # Housing Units | % Housing Units |
| Single Unit, Detached | 592 | 88.8% |
| Single Unit, Attached | 0 | 0.0% |
| 2 Unit Apartments | 20 | 3.0% |
| 3 or 4 Unit Apartments | 50 | 7.5% |
| 5 to 9 Unit Apartments | 1 | 0.2% |
| 10 or more Apartments | 4 | 0.6% |
| Mobile Home / Other | 0 | 0.0% |
| Total | 667 | 100.0% |
Housing Structures by Occupancy in Delavan
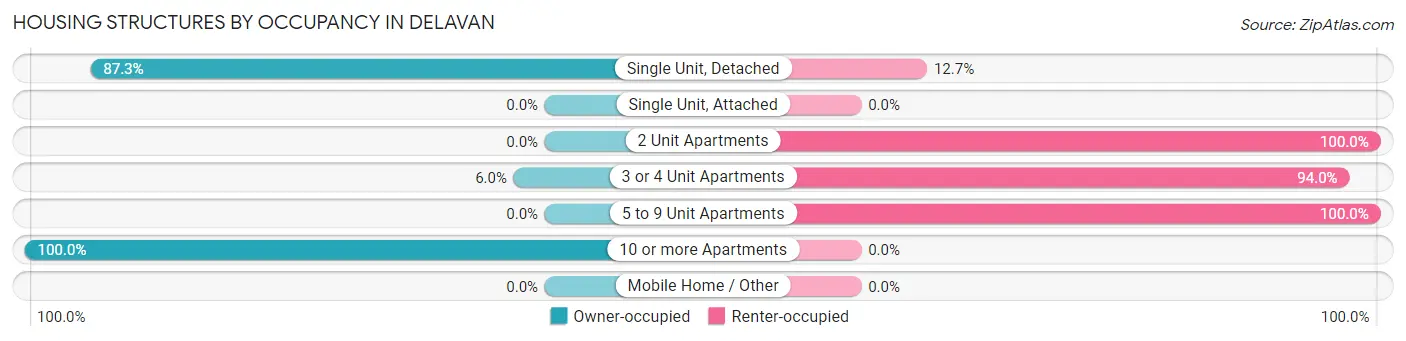
| Structure Type | Owner-occupied | Renter-occupied |
| Single Unit, Detached | 517 (87.3%) | 75 (12.7%) |
| Single Unit, Attached | 0 (0.0%) | 0 (0.0%) |
| 2 Unit Apartments | 0 (0.0%) | 20 (100.0%) |
| 3 or 4 Unit Apartments | 3 (6.0%) | 47 (94.0%) |
| 5 to 9 Unit Apartments | 0 (0.0%) | 1 (100.0%) |
| 10 or more Apartments | 4 (100.0%) | 0 (0.0%) |
| Mobile Home / Other | 0 (0.0%) | 0 (0.0%) |
| Total | 524 (78.6%) | 143 (21.4%) |
Housing Structures by Number of Rooms in Delavan
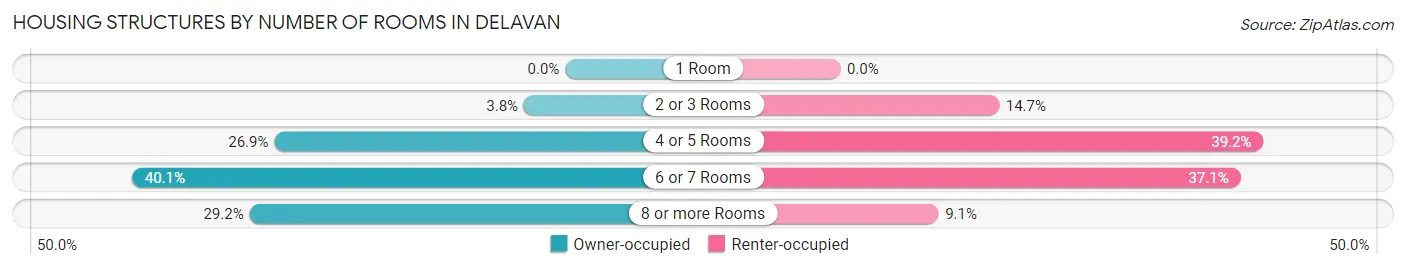
| Number of Rooms | Owner-occupied | Renter-occupied |
| 1 Room | 0 (0.0%) | 0 (0.0%) |
| 2 or 3 Rooms | 20 (3.8%) | 21 (14.7%) |
| 4 or 5 Rooms | 141 (26.9%) | 56 (39.2%) |
| 6 or 7 Rooms | 210 (40.1%) | 53 (37.1%) |
| 8 or more Rooms | 153 (29.2%) | 13 (9.1%) |
| Total | 524 (100.0%) | 143 (100.0%) |
Housing Structure by Heating Type in Delavan
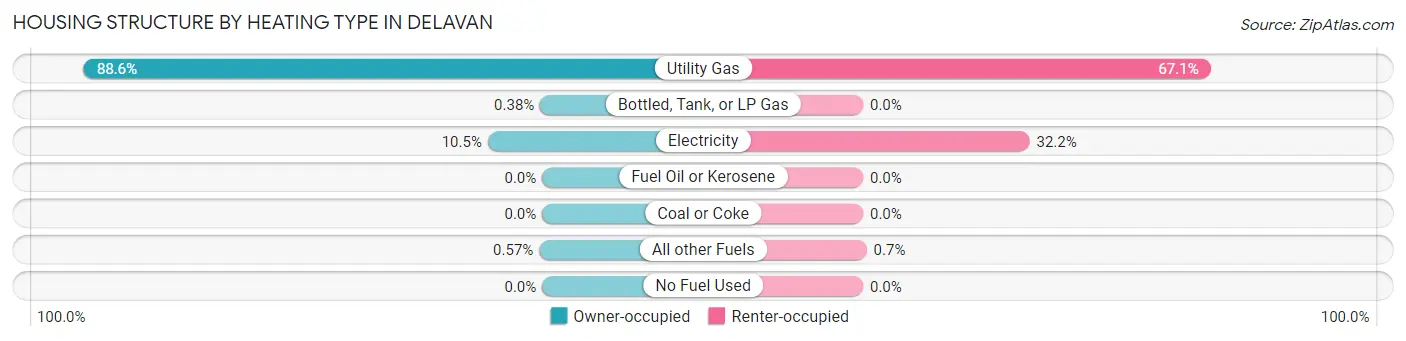
| Heating Type | Owner-occupied | Renter-occupied |
| Utility Gas | 464 (88.5%) | 96 (67.1%) |
| Bottled, Tank, or LP Gas | 2 (0.4%) | 0 (0.0%) |
| Electricity | 55 (10.5%) | 46 (32.2%) |
| Fuel Oil or Kerosene | 0 (0.0%) | 0 (0.0%) |
| Coal or Coke | 0 (0.0%) | 0 (0.0%) |
| All other Fuels | 3 (0.6%) | 1 (0.7%) |
| No Fuel Used | 0 (0.0%) | 0 (0.0%) |
| Total | 524 (100.0%) | 143 (100.0%) |
Household Vehicle Usage in Delavan
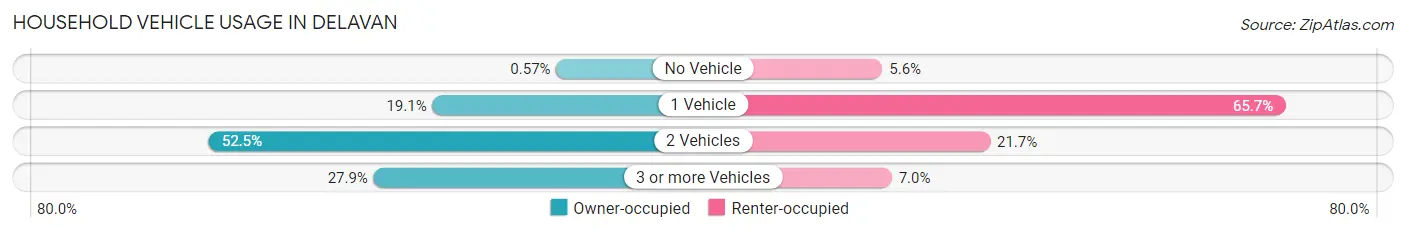
| Vehicles per Household | Owner-occupied | Renter-occupied |
| No Vehicle | 3 (0.6%) | 8 (5.6%) |
| 1 Vehicle | 100 (19.1%) | 94 (65.7%) |
| 2 Vehicles | 275 (52.5%) | 31 (21.7%) |
| 3 or more Vehicles | 146 (27.9%) | 10 (7.0%) |
| Total | 524 (100.0%) | 143 (100.0%) |
Real Estate & Mortgages in Delavan
Real Estate and Mortgage Overview in Delavan
| Characteristic | Without Mortgage | With Mortgage |
| Housing Units | 252 | 272 |
| Median Property Value | $133,800 | $118,000 |
| Median Household Income | $73,750 | $9 |
| Monthly Housing Costs | $550 | $0 |
| Real Estate Taxes | $2,564 | $8 |
Property Value by Mortgage Status in Delavan
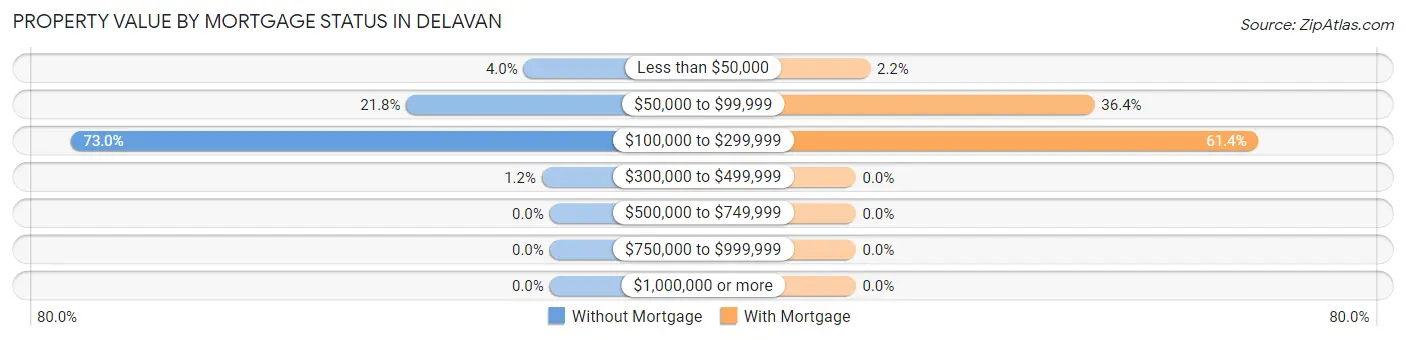
| Property Value | Without Mortgage | With Mortgage |
| Less than $50,000 | 10 (4.0%) | 6 (2.2%) |
| $50,000 to $99,999 | 55 (21.8%) | 99 (36.4%) |
| $100,000 to $299,999 | 184 (73.0%) | 167 (61.4%) |
| $300,000 to $499,999 | 3 (1.2%) | 0 (0.0%) |
| $500,000 to $749,999 | 0 (0.0%) | 0 (0.0%) |
| $750,000 to $999,999 | 0 (0.0%) | 0 (0.0%) |
| $1,000,000 or more | 0 (0.0%) | 0 (0.0%) |
| Total | 252 (100.0%) | 272 (100.0%) |
Household Income by Mortgage Status in Delavan
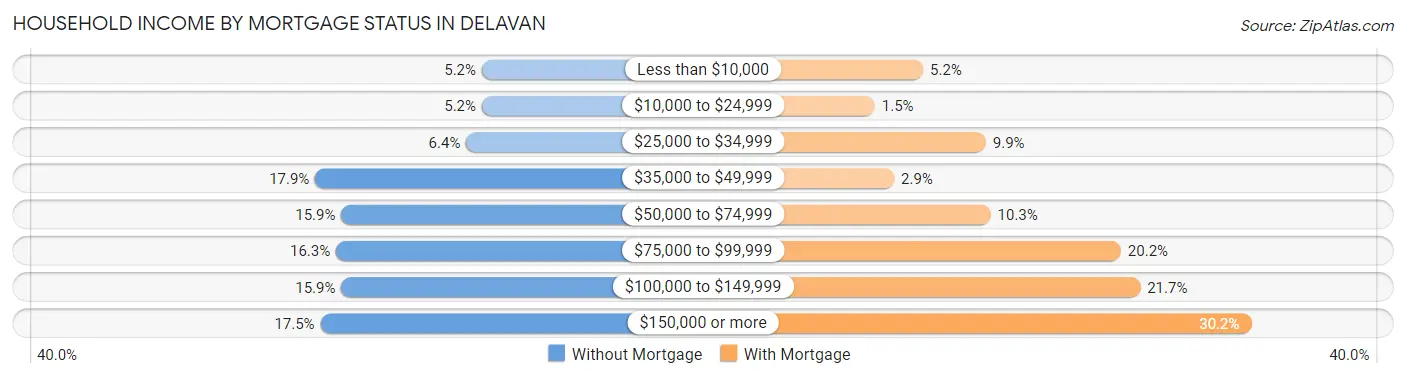
| Household Income | Without Mortgage | With Mortgage |
| Less than $10,000 | 13 (5.2%) | 14 (5.1%) |
| $10,000 to $24,999 | 13 (5.2%) | 4 (1.5%) |
| $25,000 to $34,999 | 16 (6.4%) | 27 (9.9%) |
| $35,000 to $49,999 | 45 (17.9%) | 8 (2.9%) |
| $50,000 to $74,999 | 40 (15.9%) | 28 (10.3%) |
| $75,000 to $99,999 | 41 (16.3%) | 55 (20.2%) |
| $100,000 to $149,999 | 40 (15.9%) | 59 (21.7%) |
| $150,000 or more | 44 (17.5%) | 82 (30.1%) |
| Total | 252 (100.0%) | 272 (100.0%) |
Property Value to Household Income Ratio in Delavan
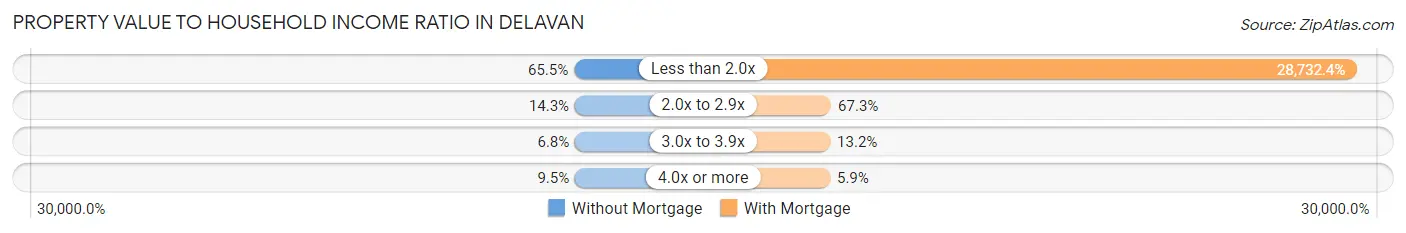
| Value-to-Income Ratio | Without Mortgage | With Mortgage |
| Less than 2.0x | 165 (65.5%) | 78,152 (28,732.4%) |
| 2.0x to 2.9x | 36 (14.3%) | 183 (67.3%) |
| 3.0x to 3.9x | 17 (6.8%) | 36 (13.2%) |
| 4.0x or more | 24 (9.5%) | 16 (5.9%) |
| Total | 252 (100.0%) | 272 (100.0%) |
Real Estate Taxes by Mortgage Status in Delavan
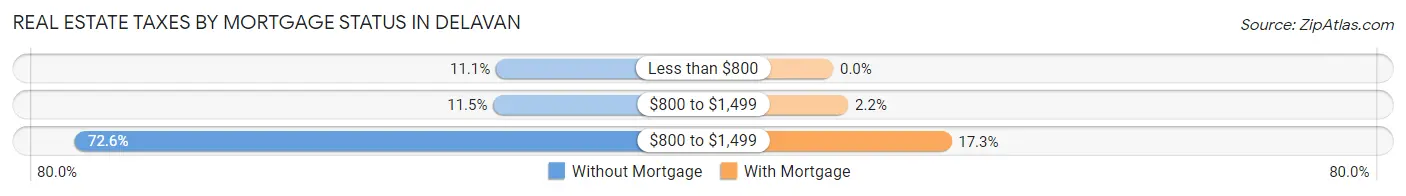
| Property Taxes | Without Mortgage | With Mortgage |
| Less than $800 | 28 (11.1%) | 0 (0.0%) |
| $800 to $1,499 | 29 (11.5%) | 6 (2.2%) |
| $800 to $1,499 | 183 (72.6%) | 47 (17.3%) |
| Total | 252 (100.0%) | 272 (100.0%) |
Health & Disability in Delavan
Health Insurance Coverage by Age in Delavan
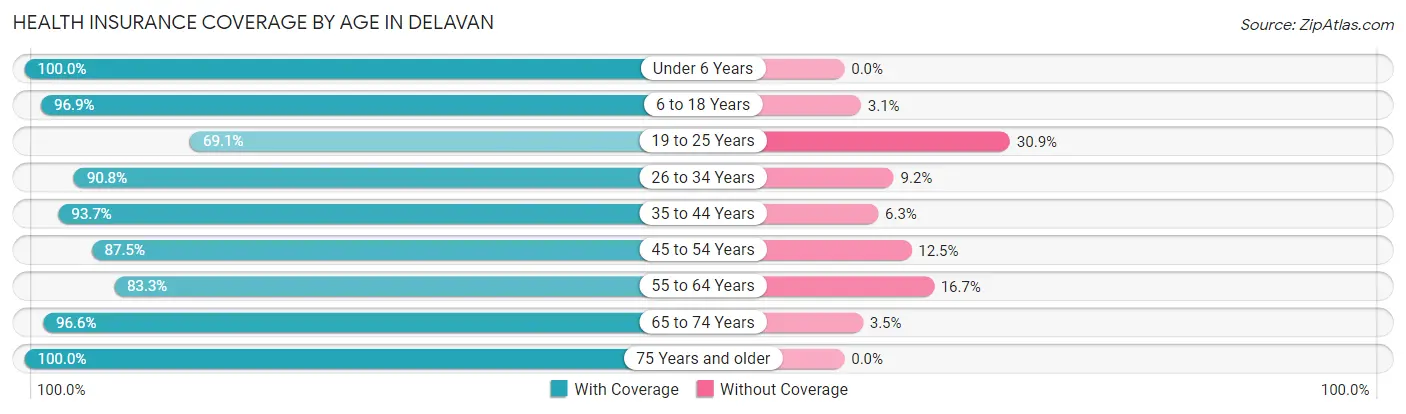
| Age Bracket | With Coverage | Without Coverage |
| Under 6 Years | 65 (100.0%) | 0 (0.0%) |
| 6 to 18 Years | 408 (96.9%) | 13 (3.1%) |
| 19 to 25 Years | 47 (69.1%) | 21 (30.9%) |
| 26 to 34 Years | 168 (90.8%) | 17 (9.2%) |
| 35 to 44 Years | 193 (93.7%) | 13 (6.3%) |
| 45 to 54 Years | 168 (87.5%) | 24 (12.5%) |
| 55 to 64 Years | 210 (83.3%) | 42 (16.7%) |
| 65 to 74 Years | 112 (96.6%) | 4 (3.5%) |
| 75 Years and older | 185 (100.0%) | 0 (0.0%) |
| Total | 1,556 (92.1%) | 134 (7.9%) |
Health Insurance Coverage by Citizenship Status in Delavan
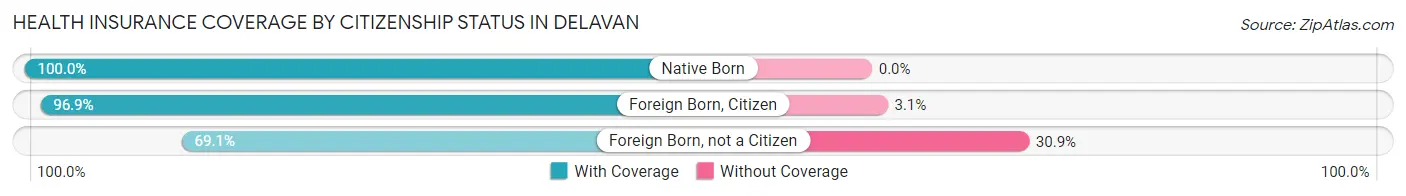
| Citizenship Status | With Coverage | Without Coverage |
| Native Born | 65 (100.0%) | 0 (0.0%) |
| Foreign Born, Citizen | 408 (96.9%) | 13 (3.1%) |
| Foreign Born, not a Citizen | 47 (69.1%) | 21 (30.9%) |
Health Insurance Coverage by Household Income in Delavan
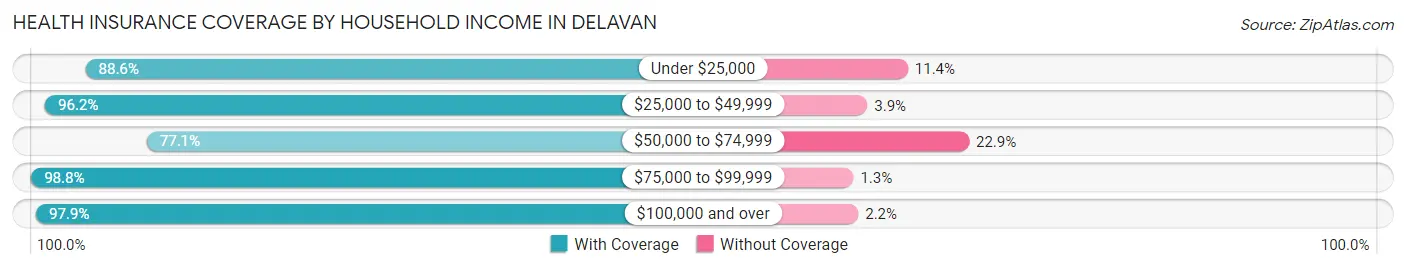
| Household Income | With Coverage | Without Coverage |
| Under $25,000 | 178 (88.6%) | 23 (11.4%) |
| $25,000 to $49,999 | 275 (96.2%) | 11 (3.8%) |
| $50,000 to $74,999 | 286 (77.1%) | 85 (22.9%) |
| $75,000 to $99,999 | 316 (98.8%) | 4 (1.3%) |
| $100,000 and over | 501 (97.9%) | 11 (2.1%) |
Public vs Private Health Insurance Coverage by Age in Delavan
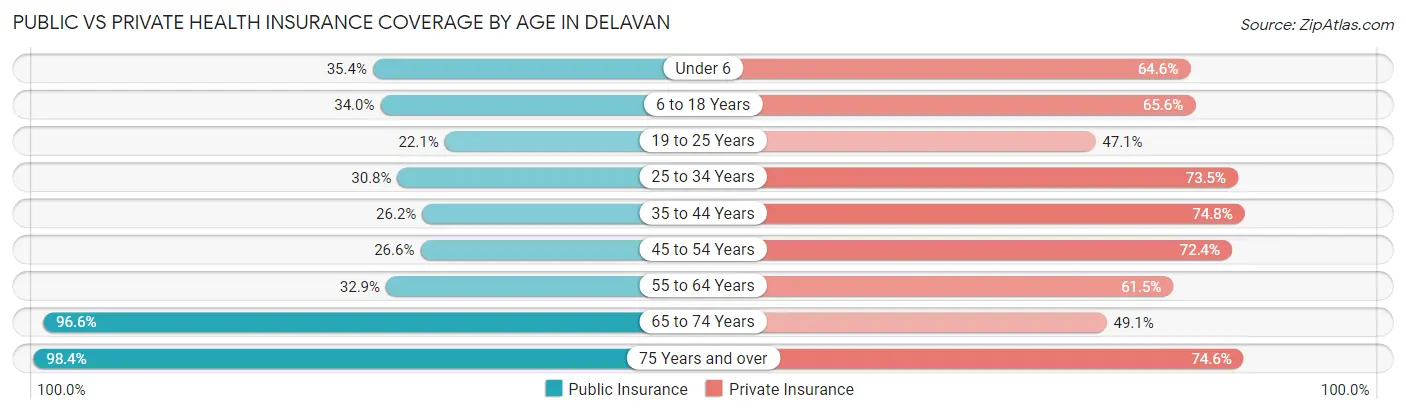
| Age Bracket | Public Insurance | Private Insurance |
| Under 6 | 23 (35.4%) | 42 (64.6%) |
| 6 to 18 Years | 143 (34.0%) | 276 (65.6%) |
| 19 to 25 Years | 15 (22.1%) | 32 (47.1%) |
| 25 to 34 Years | 57 (30.8%) | 136 (73.5%) |
| 35 to 44 Years | 54 (26.2%) | 154 (74.8%) |
| 45 to 54 Years | 51 (26.6%) | 139 (72.4%) |
| 55 to 64 Years | 83 (32.9%) | 155 (61.5%) |
| 65 to 74 Years | 112 (96.6%) | 57 (49.1%) |
| 75 Years and over | 182 (98.4%) | 138 (74.6%) |
| Total | 720 (42.6%) | 1,129 (66.8%) |
Disability Status by Sex by Age in Delavan
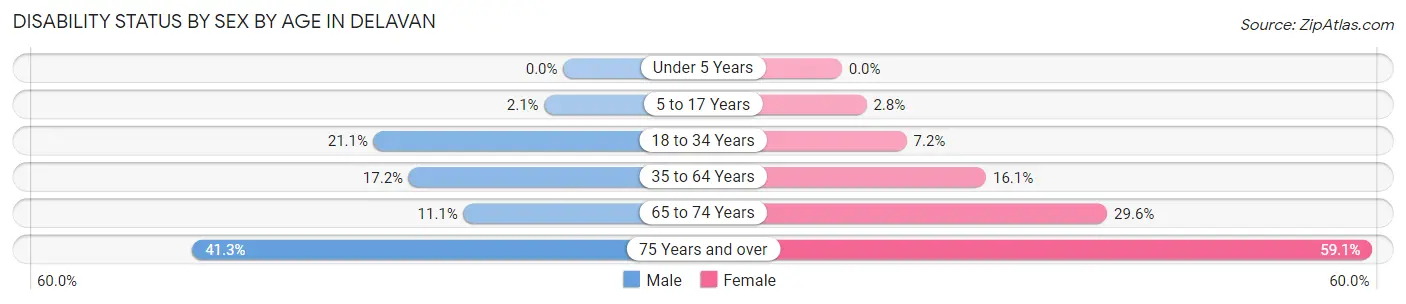
| Age Bracket | Male | Female |
| Under 5 Years | 0 (0.0%) | 0 (0.0%) |
| 5 to 17 Years | 4 (2.1%) | 6 (2.8%) |
| 18 to 34 Years | 19 (21.1%) | 13 (7.2%) |
| 35 to 64 Years | 54 (17.2%) | 54 (16.1%) |
| 65 to 74 Years | 8 (11.1%) | 13 (29.5%) |
| 75 Years and over | 31 (41.3%) | 65 (59.1%) |
Disability Class by Sex by Age in Delavan
Disability Class: Hearing Difficulty
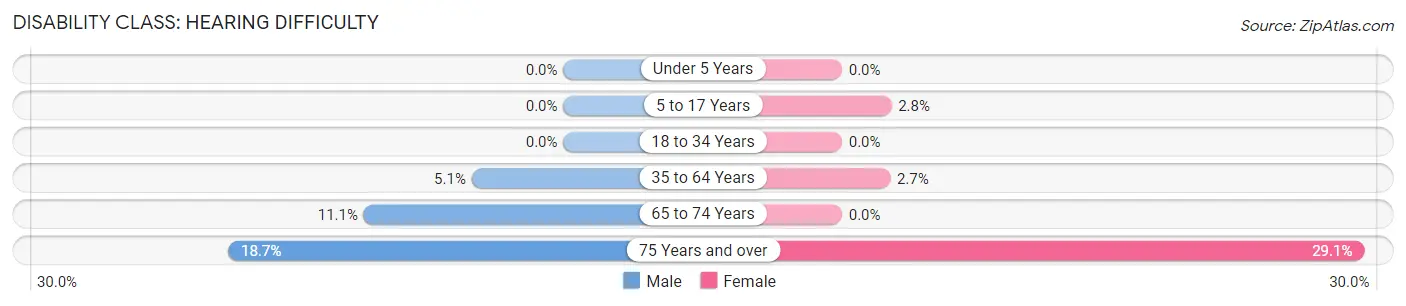
| Age Bracket | Male | Female |
| Under 5 Years | 0 (0.0%) | 0 (0.0%) |
| 5 to 17 Years | 0 (0.0%) | 6 (2.8%) |
| 18 to 34 Years | 0 (0.0%) | 0 (0.0%) |
| 35 to 64 Years | 16 (5.1%) | 9 (2.7%) |
| 65 to 74 Years | 8 (11.1%) | 0 (0.0%) |
| 75 Years and over | 14 (18.7%) | 32 (29.1%) |
Disability Class: Vision Difficulty
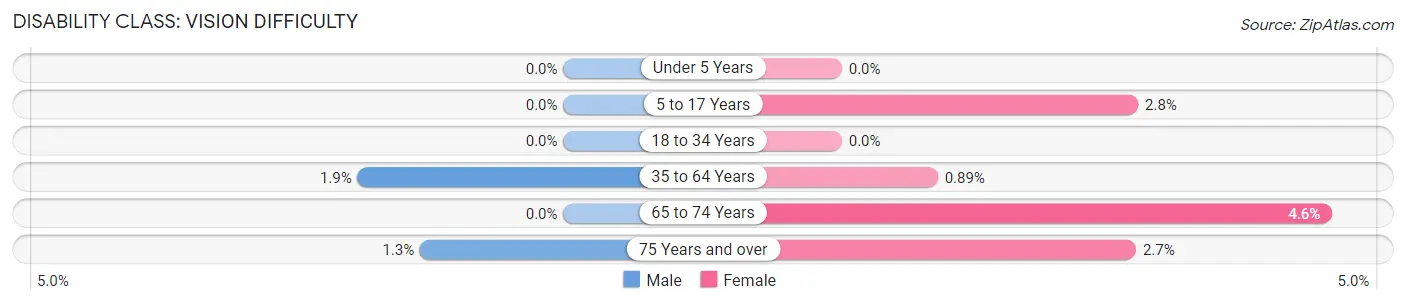
| Age Bracket | Male | Female |
| Under 5 Years | 0 (0.0%) | 0 (0.0%) |
| 5 to 17 Years | 0 (0.0%) | 6 (2.8%) |
| 18 to 34 Years | 0 (0.0%) | 0 (0.0%) |
| 35 to 64 Years | 6 (1.9%) | 3 (0.9%) |
| 65 to 74 Years | 0 (0.0%) | 2 (4.5%) |
| 75 Years and over | 1 (1.3%) | 3 (2.7%) |
Disability Class: Cognitive Difficulty
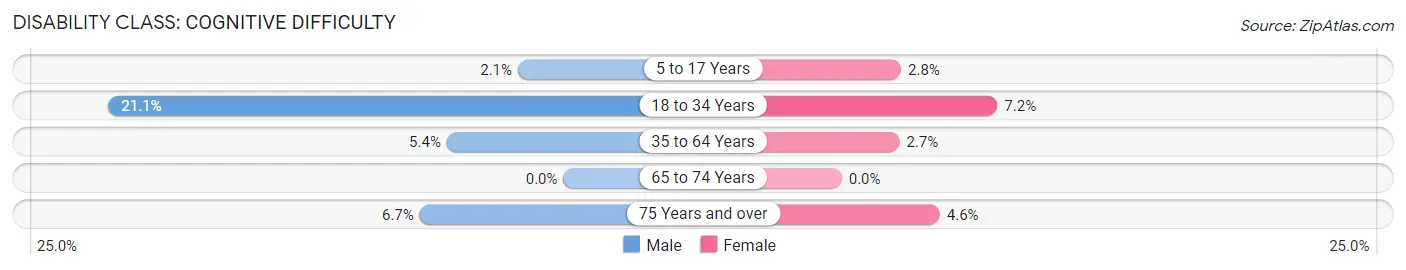
| Age Bracket | Male | Female |
| 5 to 17 Years | 4 (2.1%) | 6 (2.8%) |
| 18 to 34 Years | 19 (21.1%) | 13 (7.2%) |
| 35 to 64 Years | 17 (5.4%) | 9 (2.7%) |
| 65 to 74 Years | 0 (0.0%) | 0 (0.0%) |
| 75 Years and over | 5 (6.7%) | 5 (4.5%) |
Disability Class: Ambulatory Difficulty
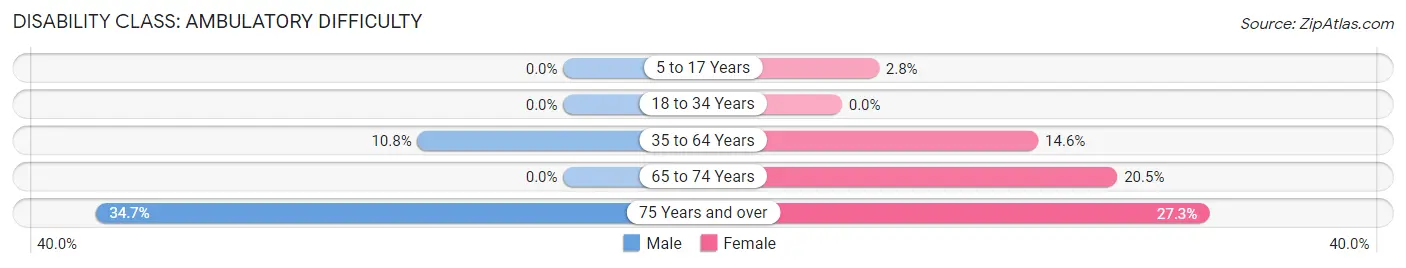
| Age Bracket | Male | Female |
| 5 to 17 Years | 0 (0.0%) | 6 (2.8%) |
| 18 to 34 Years | 0 (0.0%) | 0 (0.0%) |
| 35 to 64 Years | 34 (10.8%) | 49 (14.6%) |
| 65 to 74 Years | 0 (0.0%) | 9 (20.4%) |
| 75 Years and over | 26 (34.7%) | 30 (27.3%) |
Disability Class: Self-Care Difficulty
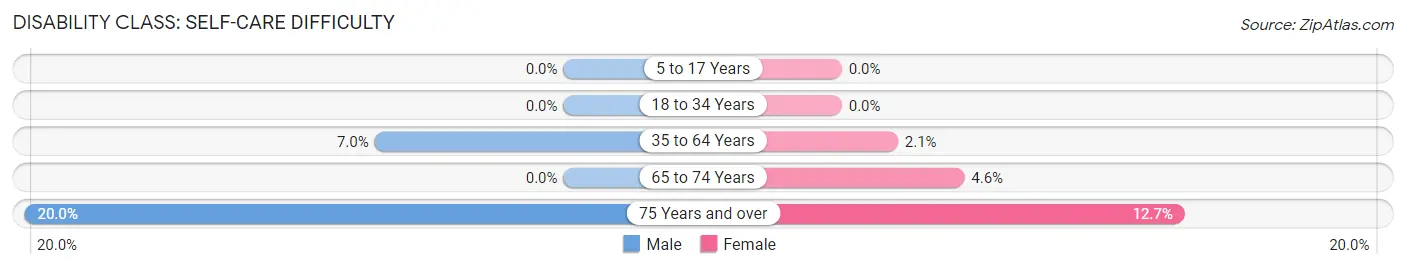
| Age Bracket | Male | Female |
| 5 to 17 Years | 0 (0.0%) | 0 (0.0%) |
| 18 to 34 Years | 0 (0.0%) | 0 (0.0%) |
| 35 to 64 Years | 22 (7.0%) | 7 (2.1%) |
| 65 to 74 Years | 0 (0.0%) | 2 (4.5%) |
| 75 Years and over | 15 (20.0%) | 14 (12.7%) |
Technology Access in Delavan
Computing Device Access in Delavan
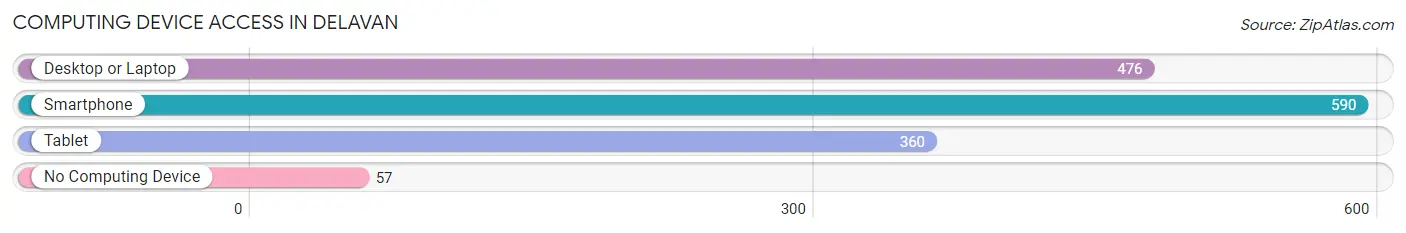
| Device Type | # Households | % Households |
| Desktop or Laptop | 476 | 71.4% |
| Smartphone | 590 | 88.5% |
| Tablet | 360 | 54.0% |
| No Computing Device | 57 | 8.6% |
| Total | 667 | 100.0% |
Internet Access in Delavan
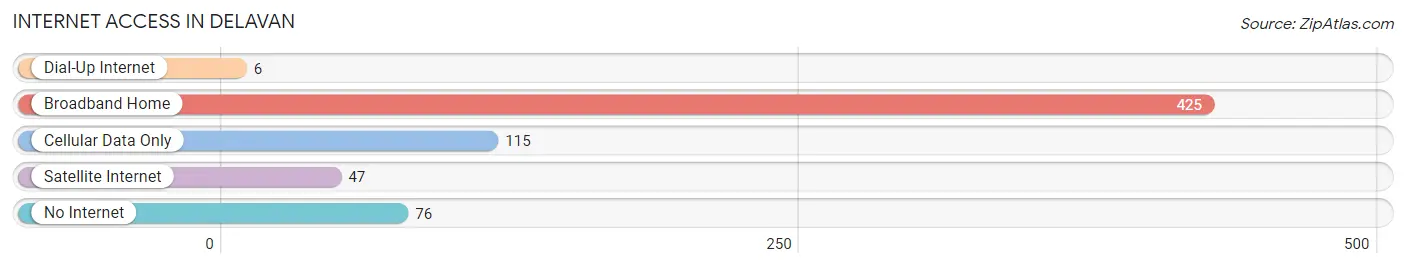
| Internet Type | # Households | % Households |
| Dial-Up Internet | 6 | 0.9% |
| Broadband Home | 425 | 63.7% |
| Cellular Data Only | 115 | 17.2% |
| Satellite Internet | 47 | 7.0% |
| No Internet | 76 | 11.4% |
| Total | 667 | 100.0% |
Delavan Summary
Delavan, Illinois is a small village located in Tazewell County, Illinois. It is situated on the banks of the Mackinaw River, about 25 miles northwest of Peoria. The village has a population of approximately 1,000 people and is part of the Peoria, IL Metropolitan Statistical Area.
History
Delavan was founded in 1837 by a group of settlers from New York. The village was named after the Delavan family, who were among the first settlers. The Delavan family had a long history in the area, having been among the first settlers in the area in the early 1800s.
The village was originally a farming community, but in the late 1800s, the railroad came to town and the village began to grow. The railroad brought new businesses and industries to the area, and the village began to thrive.
In the early 1900s, Delavan was a bustling town with a variety of businesses and industries. The village had a number of stores, a bank, a hotel, a post office, a blacksmith shop, a livery stable, a sawmill, a grist mill, a creamery, a canning factory, and a number of other businesses.
The village also had a number of churches, including the Methodist Episcopal Church, the Presbyterian Church, the Baptist Church, and the Catholic Church.
In the late 1900s, the village began to decline as the railroad left town and businesses began to close. The village has since become a quiet, rural community.
Geography
Delavan is located in Tazewell County, Illinois. It is situated on the banks of the Mackinaw River, about 25 miles northwest of Peoria. The village is surrounded by rolling hills and farmland.
The village has a total area of 0.7 square miles, all of which is land. The village is located at an elevation of 690 feet above sea level.
Economy
The economy of Delavan is largely based on agriculture. The village is home to a number of farms, which produce a variety of crops, including corn, soybeans, wheat, and hay.
The village also has a number of small businesses, including a grocery store, a hardware store, a restaurant, and a few other small businesses.
Demographics
As of the 2010 census, the population of Delavan was 1,000. The racial makeup of the village was 97.7% White, 0.7% African American, 0.2% Native American, 0.2% Asian, and 1.2% from other races.
The median household income in Delavan was $45,000, and the median family income was $50,000. The per capita income in the village was $20,000. About 8.7% of the population was below the poverty line.
Conclusion
Delavan, Illinois is a small village located in Tazewell County, Illinois. It is situated on the banks of the Mackinaw River, about 25 miles northwest of Peoria. The village has a population of approximately 1,000 people and is part of the Peoria, IL Metropolitan Statistical Area. The economy of Delavan is largely based on agriculture, and the village is home to a number of small businesses. The racial makeup of the village is predominantly White, with a small percentage of African American, Native American, and Asian residents. The median household income in Delavan is $45,000, and the per capita income is $20,000.
Common Questions
What is Per Capita Income in Delavan?
Per Capita income in Delavan is $30,138.
What is the Median Family Income in Delavan?
Median Family Income in Delavan is $71,477.
What is the Median Household income in Delavan?
Median Household Income in Delavan is $68,170.
What is Income or Wage Gap in Delavan?
Income or Wage Gap in Delavan is 55.0%.
Women in Delavan earn 45.0 cents for every dollar earned by a man.
What is Family Income Deficit in Delavan?
Family Income Deficit in Delavan is $10,685.
Families that are below poverty line in Delavan earn $10,685 less on average than the poverty threshold level.
What is Inequality or Gini Index in Delavan?
Inequality or Gini Index in Delavan is 0.37.
What is the Total Population of Delavan?
Total Population of Delavan is 1,708.
What is the Total Male Population of Delavan?
Total Male Population of Delavan is 809.
What is the Total Female Population of Delavan?
Total Female Population of Delavan is 899.
What is the Ratio of Males per 100 Females in Delavan?
There are 89.99 Males per 100 Females in Delavan.
What is the Ratio of Females per 100 Males in Delavan?
There are 111.12 Females per 100 Males in Delavan.
What is the Median Population Age in Delavan?
Median Population Age in Delavan is 40.1 Years.
What is the Average Family Size in Delavan
Average Family Size in Delavan is 2.9 People.
What is the Average Household Size in Delavan
Average Household Size in Delavan is 2.6 People.
How Large is the Labor Force in Delavan?
There are 723 People in the Labor Forcein in Delavan.
What is the Percentage of People in the Labor Force in Delavan?
56.1% of People are in the Labor Force in Delavan.
What is the Unemployment Rate in Delavan?
Unemployment Rate in Delavan is 7.8%.