Cuba, IL Map & Demographics
Cuba Map
Cuba Overview
$32,883
PER CAPITA INCOME
$73,750
AVG FAMILY INCOME
$43,750
AVG HOUSEHOLD INCOME
28.1%
WAGE / INCOME GAP [ % ]
71.9¢/ $1
WAGE / INCOME GAP [ $ ]
0.45
INEQUALITY / GINI INDEX
903
TOTAL POPULATION
436
MALE POPULATION
467
FEMALE POPULATION
93.36
MALES / 100 FEMALES
107.11
FEMALES / 100 MALES
50.9
MEDIAN AGE
2.9
AVG FAMILY SIZE
2.0
AVG HOUSEHOLD SIZE
436
LABOR FORCE [ PEOPLE ]
54.7%
PERCENT IN LABOR FORCE
4.1%
UNEMPLOYMENT RATE
Cuba Zip Codes
Cuba Area Codes
Income in Cuba
Income Overview in Cuba
Per Capita Income in Cuba is $32,883, while median incomes of families and households are $73,750 and $43,750 respectively.
| Characteristic | Number | Measure |
| Per Capita Income | 903 | $32,883 |
| Median Family Income | 194 | $73,750 |
| Mean Family Income | 194 | $94,739 |
| Median Household Income | 434 | $43,750 |
| Mean Household Income | 434 | $64,903 |
| Income Deficit | 194 | $0 |
| Wage / Income Gap (%) | 903 | 28.11% |
| Wage / Income Gap ($) | 903 | 71.89¢ per $1 |
| Gini / Inequality Index | 903 | 0.45 |
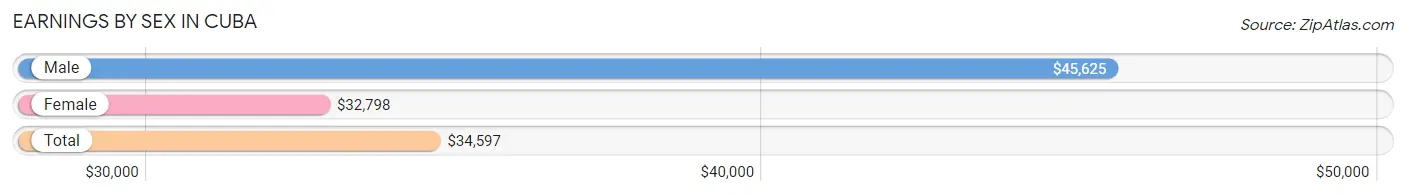
Earnings by Sex in Cuba
Average Earnings in Cuba are $34,597, $45,625 for men and $32,798 for women, a difference of 28.1%.
| Sex | Number | Average Earnings |
| Male | 233 (53.2%) | $45,625 |
| Female | 205 (46.8%) | $32,798 |
| Total | 438 (100.0%) | $34,597 |
Earnings by Sex by Income Bracket in Cuba
The most common earnings brackets in Cuba are $75,000 to $99,999 for men (35 | 15.0%) and $30,000 to $34,999 for women (38 | 18.5%).
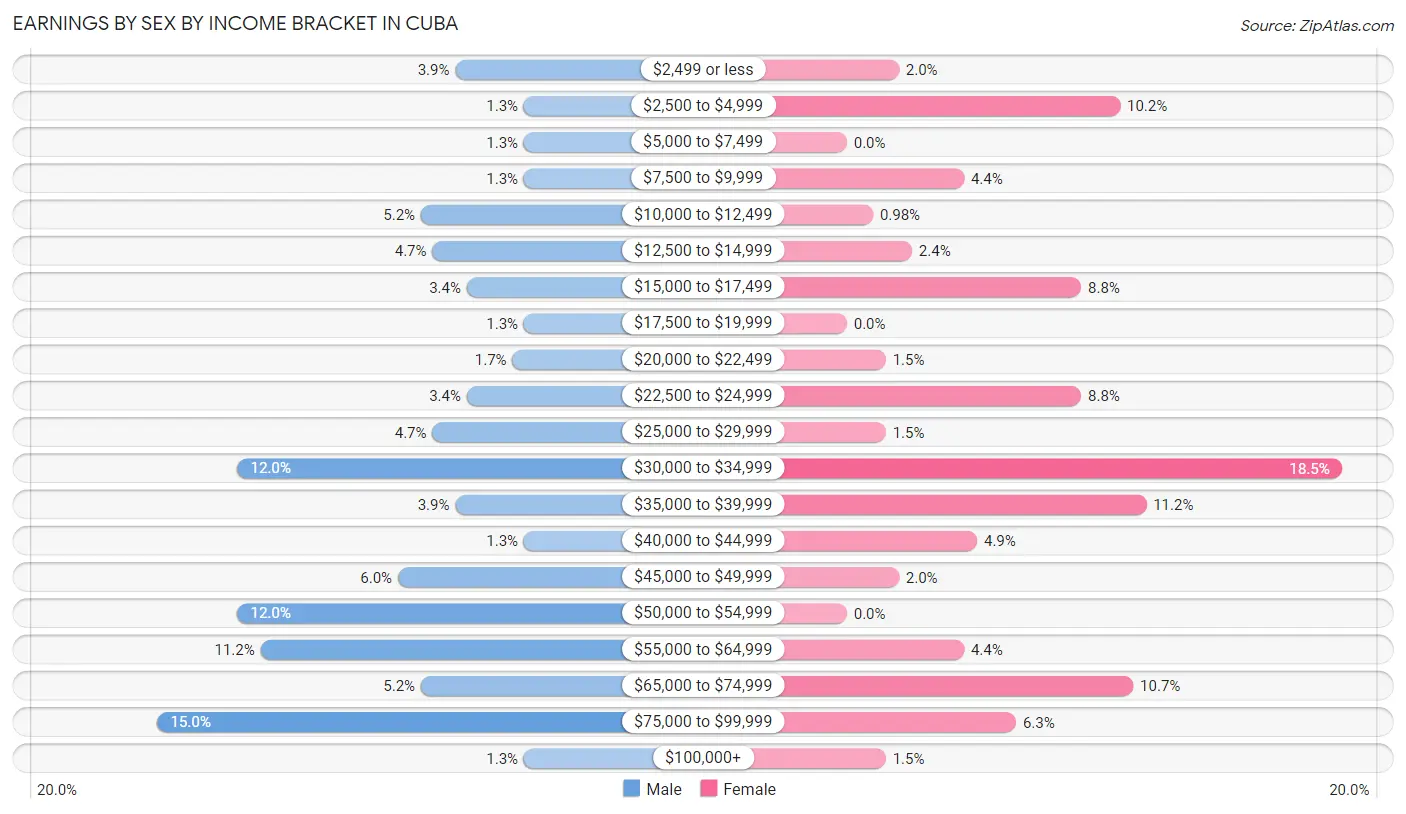
| Income | Male | Female |
| $2,499 or less | 9 (3.9%) | 4 (1.9%) |
| $2,500 to $4,999 | 3 (1.3%) | 21 (10.2%) |
| $5,000 to $7,499 | 3 (1.3%) | 0 (0.0%) |
| $7,500 to $9,999 | 3 (1.3%) | 9 (4.4%) |
| $10,000 to $12,499 | 12 (5.1%) | 2 (1.0%) |
| $12,500 to $14,999 | 11 (4.7%) | 5 (2.4%) |
| $15,000 to $17,499 | 8 (3.4%) | 18 (8.8%) |
| $17,500 to $19,999 | 3 (1.3%) | 0 (0.0%) |
| $20,000 to $22,499 | 4 (1.7%) | 3 (1.5%) |
| $22,500 to $24,999 | 8 (3.4%) | 18 (8.8%) |
| $25,000 to $29,999 | 11 (4.7%) | 3 (1.5%) |
| $30,000 to $34,999 | 28 (12.0%) | 38 (18.5%) |
| $35,000 to $39,999 | 9 (3.9%) | 23 (11.2%) |
| $40,000 to $44,999 | 3 (1.3%) | 10 (4.9%) |
| $45,000 to $49,999 | 14 (6.0%) | 4 (1.9%) |
| $50,000 to $54,999 | 28 (12.0%) | 0 (0.0%) |
| $55,000 to $64,999 | 26 (11.2%) | 9 (4.4%) |
| $65,000 to $74,999 | 12 (5.1%) | 22 (10.7%) |
| $75,000 to $99,999 | 35 (15.0%) | 13 (6.3%) |
| $100,000+ | 3 (1.3%) | 3 (1.5%) |
| Total | 233 (100.0%) | 205 (100.0%) |
Earnings by Sex by Educational Attainment in Cuba
Average earnings in Cuba are $50,192 for men and $34,464 for women, a difference of 31.3%. Men with an educational attainment of less than high school enjoy the highest average annual earnings of $55,833, while those with college or associate's degree education earn the least with $46,250. Women with an educational attainment of bachelor's degree earn the most with the average annual earnings of $57,917, while those with high school diploma education have the smallest earnings of $31,250.
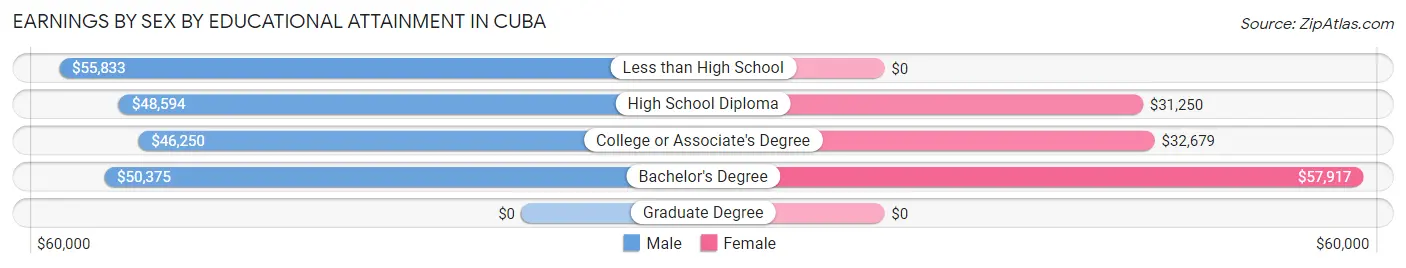
| Educational Attainment | Male Income | Female Income |
| Less than High School | $55,833 | $0 |
| High School Diploma | $48,594 | $31,250 |
| College or Associate's Degree | $46,250 | $32,679 |
| Bachelor's Degree | $50,375 | $57,917 |
| Graduate Degree | - | - |
| Total | $50,192 | $34,464 |
Family Income in Cuba
Family Income Brackets in Cuba
According to the Cuba family income data, there are 53 families falling into the $75,000 to $99,999 income range, which is the most common income bracket and makes up 27.3% of all families. Conversely, the $10,000 to $14,999 income bracket is the least frequent group with only 3 families (1.5%) belonging to this category.
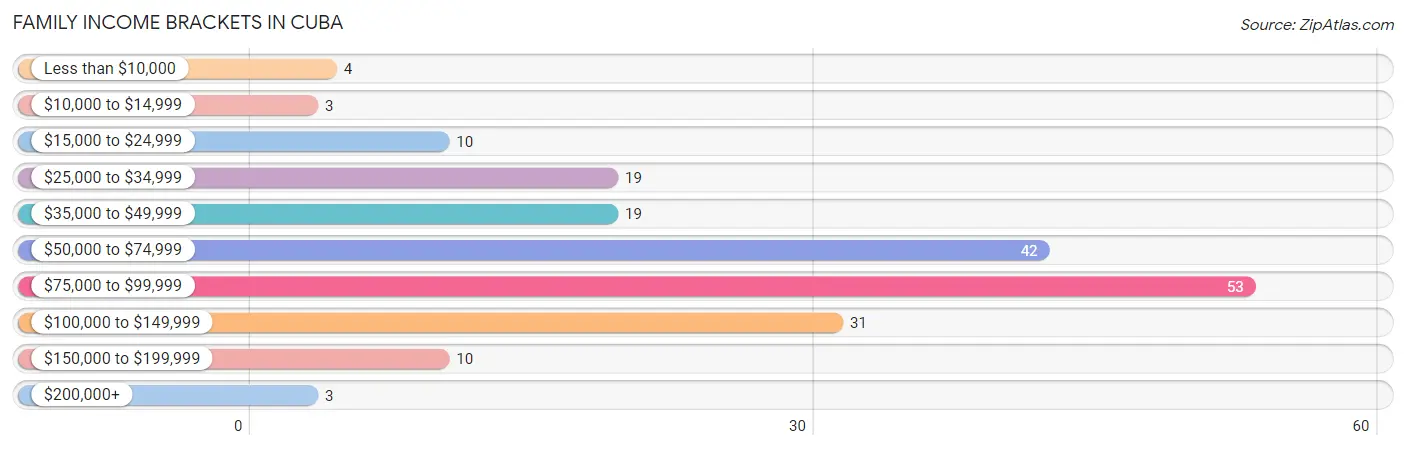
| Income Bracket | # Families | % Families |
| Less than $10,000 | 4 | 2.1% |
| $10,000 to $14,999 | 3 | 1.5% |
| $15,000 to $24,999 | 10 | 5.2% |
| $25,000 to $34,999 | 19 | 9.8% |
| $35,000 to $49,999 | 19 | 9.8% |
| $50,000 to $74,999 | 42 | 21.6% |
| $75,000 to $99,999 | 53 | 27.3% |
| $100,000 to $149,999 | 31 | 16.0% |
| $150,000 to $199,999 | 10 | 5.2% |
| $200,000+ | 3 | 1.5% |
Family Income by Famaliy Size in Cuba
4-person families (52 | 26.8%) account for the highest median family income in Cuba with $91,000 per family, while 2-person families (100 | 51.5%) have the highest median income of $32,916 per family member.
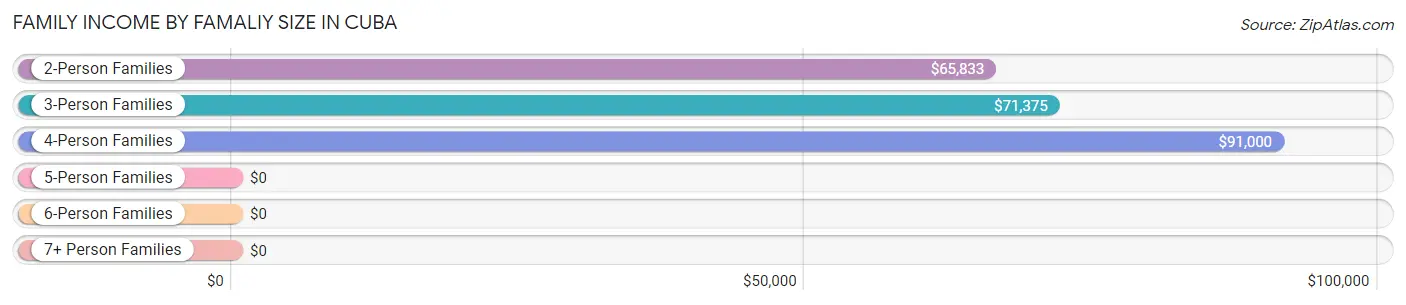
| Income Bracket | # Families | Median Income |
| 2-Person Families | 100 (51.5%) | $65,833 |
| 3-Person Families | 39 (20.1%) | $71,375 |
| 4-Person Families | 52 (26.8%) | $91,000 |
| 5-Person Families | 0 (0.0%) | $0 |
| 6-Person Families | 3 (1.5%) | $0 |
| 7+ Person Families | 0 (0.0%) | $0 |
| Total | 194 (100.0%) | $73,750 |
Family Income by Number of Earners in Cuba
The median family income in Cuba is $73,750, with families comprising 3+ earners (17) having the highest median family income of $142,917, while families with no earners (38) have the lowest median family income of $33,214, accounting for 8.8% and 19.6% of families, respectively.
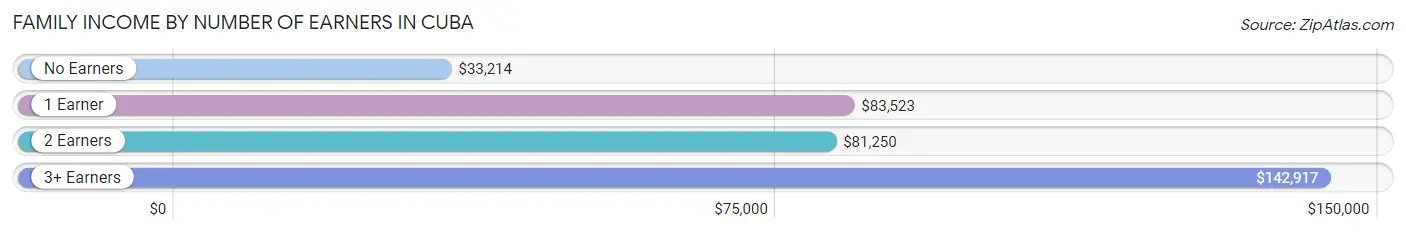
| Number of Earners | # Families | Median Income |
| No Earners | 38 (19.6%) | $33,214 |
| 1 Earner | 87 (44.9%) | $83,523 |
| 2 Earners | 52 (26.8%) | $81,250 |
| 3+ Earners | 17 (8.8%) | $142,917 |
| Total | 194 (100.0%) | $73,750 |
Household Income in Cuba
Household Income Brackets in Cuba
With 98 households falling in the category, the $25,000 to $34,999 income range is the most frequent in Cuba, accounting for 22.6% of all households. In contrast, only 3 households (0.7%) fall into the $200,000+ income bracket, making it the least populous group.
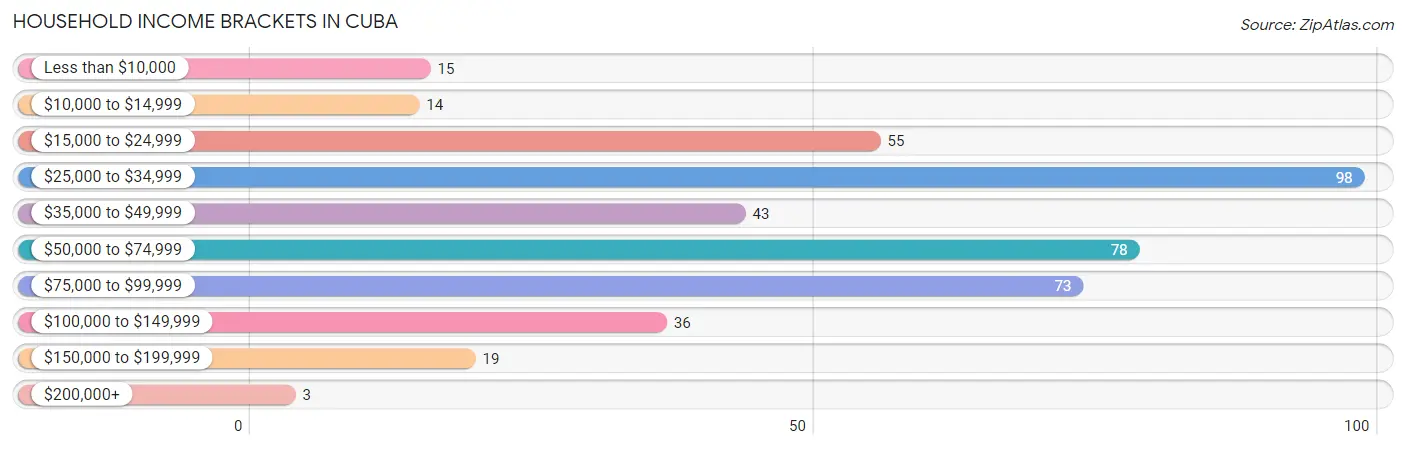
| Income Bracket | # Households | % Households |
| Less than $10,000 | 15 | 3.5% |
| $10,000 to $14,999 | 14 | 3.2% |
| $15,000 to $24,999 | 55 | 12.7% |
| $25,000 to $34,999 | 98 | 22.6% |
| $35,000 to $49,999 | 43 | 9.9% |
| $50,000 to $74,999 | 78 | 18.0% |
| $75,000 to $99,999 | 73 | 16.8% |
| $100,000 to $149,999 | 36 | 8.3% |
| $150,000 to $199,999 | 19 | 4.4% |
| $200,000+ | 3 | 0.7% |
Household Income by Householder Age in Cuba
The median household income in Cuba is $43,750, with the highest median household income of $85,682 found in the 25 to 44 years age bracket for the primary householder. A total of 64 households (14.7%) fall into this category. Meanwhile, the 15 to 24 years age bracket for the primary householder has the lowest median household income of $31,250, with 28 households (6.5%) in this group.
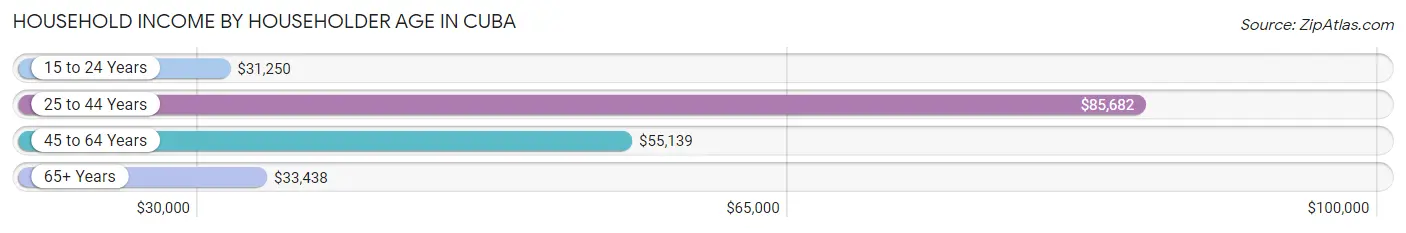
| Income Bracket | # Households | Median Income |
| 15 to 24 Years | 28 (6.5%) | $31,250 |
| 25 to 44 Years | 64 (14.7%) | $85,682 |
| 45 to 64 Years | 225 (51.8%) | $55,139 |
| 65+ Years | 117 (27.0%) | $33,438 |
| Total | 434 (100.0%) | $43,750 |
Poverty in Cuba
Income Below Poverty by Sex and Age in Cuba
With 12.0% poverty level for males and 16.6% for females among the residents of Cuba, 6 to 11 year old males and 12 to 14 year old females are the most vulnerable to poverty, with 3 males (100.0%) and 16 females (76.2%) in their respective age groups living below the poverty level.
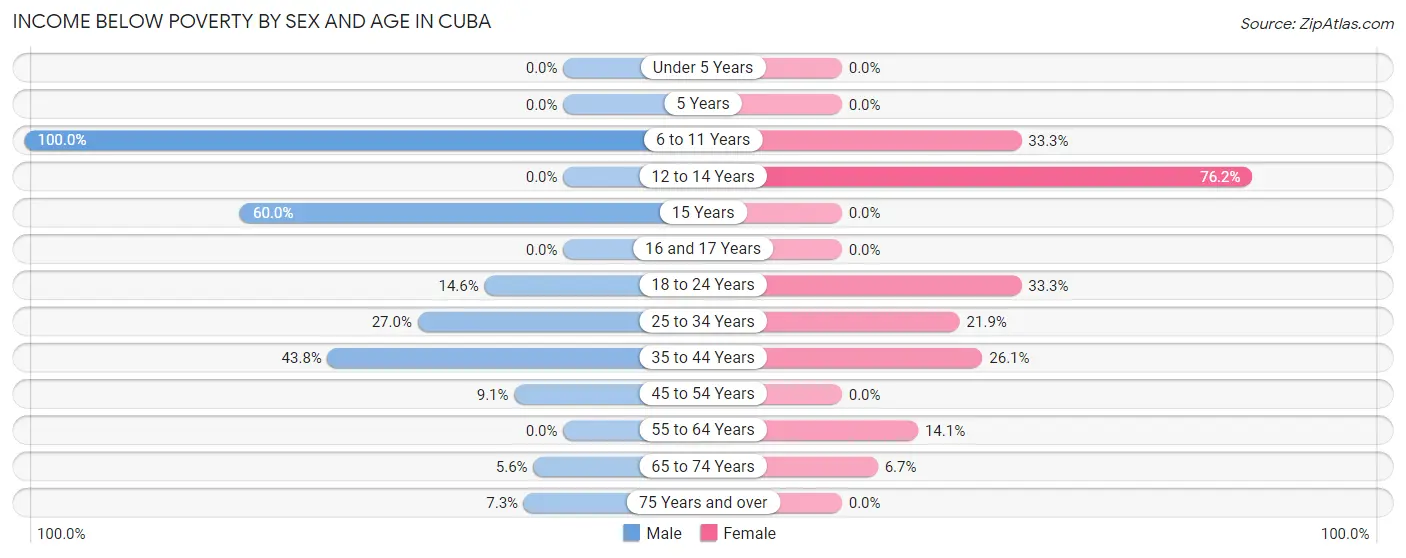
| Age Bracket | Male | Female |
| Under 5 Years | 0 (0.0%) | 0 (0.0%) |
| 5 Years | 0 (0.0%) | 0 (0.0%) |
| 6 to 11 Years | 3 (100.0%) | 11 (33.3%) |
| 12 to 14 Years | 0 (0.0%) | 16 (76.2%) |
| 15 Years | 3 (60.0%) | 0 (0.0%) |
| 16 and 17 Years | 0 (0.0%) | 0 (0.0%) |
| 18 to 24 Years | 6 (14.6%) | 16 (33.3%) |
| 25 to 34 Years | 10 (27.0%) | 7 (21.9%) |
| 35 to 44 Years | 14 (43.8%) | 6 (26.1%) |
| 45 to 54 Years | 8 (9.1%) | 0 (0.0%) |
| 55 to 64 Years | 0 (0.0%) | 14 (14.1%) |
| 65 to 74 Years | 3 (5.6%) | 3 (6.7%) |
| 75 Years and over | 3 (7.3%) | 0 (0.0%) |
| Total | 50 (12.0%) | 73 (16.6%) |
Income Above Poverty by Sex and Age in Cuba
According to the poverty statistics in Cuba, males aged under 5 years and females aged 16 and 17 years are the age groups that are most secure financially, with 100.0% of males and 100.0% of females in these age groups living above the poverty line.
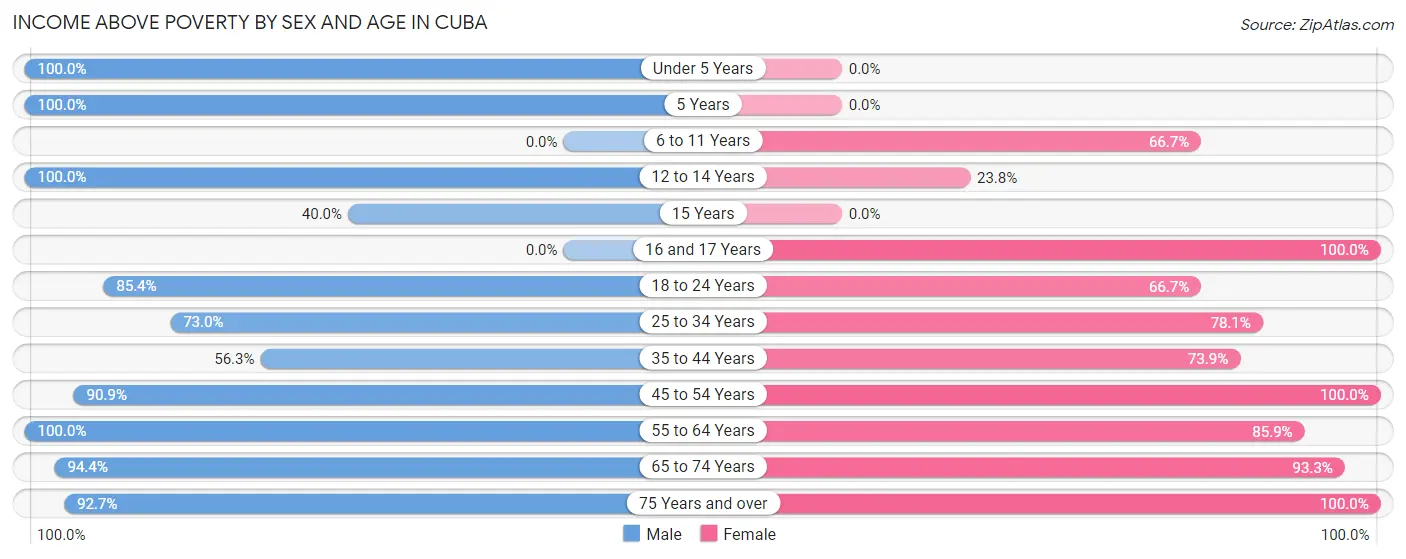
| Age Bracket | Male | Female |
| Under 5 Years | 28 (100.0%) | 0 (0.0%) |
| 5 Years | 8 (100.0%) | 0 (0.0%) |
| 6 to 11 Years | 0 (0.0%) | 22 (66.7%) |
| 12 to 14 Years | 8 (100.0%) | 5 (23.8%) |
| 15 Years | 2 (40.0%) | 0 (0.0%) |
| 16 and 17 Years | 0 (0.0%) | 12 (100.0%) |
| 18 to 24 Years | 35 (85.4%) | 32 (66.7%) |
| 25 to 34 Years | 27 (73.0%) | 25 (78.1%) |
| 35 to 44 Years | 18 (56.2%) | 17 (73.9%) |
| 45 to 54 Years | 80 (90.9%) | 91 (100.0%) |
| 55 to 64 Years | 71 (100.0%) | 85 (85.9%) |
| 65 to 74 Years | 51 (94.4%) | 42 (93.3%) |
| 75 Years and over | 38 (92.7%) | 35 (100.0%) |
| Total | 366 (88.0%) | 366 (83.4%) |
Income Below Poverty Among Married-Couple Families in Cuba
The poverty statistics for married-couple families in Cuba show that 4.1% or 6 of the total 146 families live below the poverty line. Families with 1 or 2 children have the highest poverty rate of 5.0%, comprising of 3 families. On the other hand, families with no children have the lowest poverty rate of 3.5%, which includes 3 families.
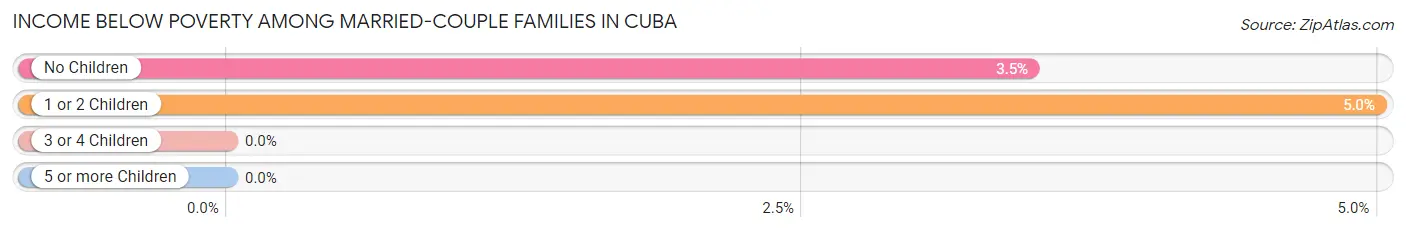
| Children | Above Poverty | Below Poverty |
| No Children | 83 (96.5%) | 3 (3.5%) |
| 1 or 2 Children | 57 (95.0%) | 3 (5.0%) |
| 3 or 4 Children | 0 (0.0%) | 0 (0.0%) |
| 5 or more Children | 0 (0.0%) | 0 (0.0%) |
| Total | 140 (95.9%) | 6 (4.1%) |
Income Below Poverty Among Single-Parent Households in Cuba
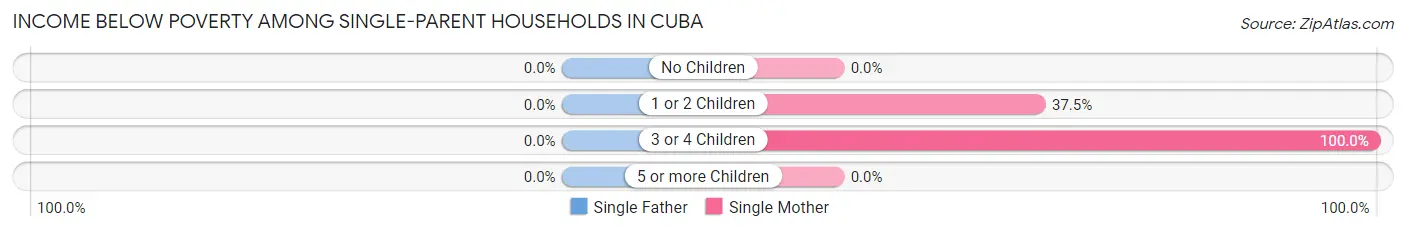
| Children | Single Father | Single Mother |
| No Children | 0 (0.0%) | 0 (0.0%) |
| 1 or 2 Children | 0 (0.0%) | 6 (37.5%) |
| 3 or 4 Children | 0 (0.0%) | 4 (100.0%) |
| 5 or more Children | 0 (0.0%) | 0 (0.0%) |
| Total | 0 (0.0%) | 10 (22.7%) |
Income Below Poverty Among Married-Couple vs Single-Parent Households in Cuba
The poverty data for Cuba shows that 6 of the married-couple family households (4.1%) and 10 of the single-parent households (20.8%) are living below the poverty level. Within the married-couple family households, those with 1 or 2 children have the highest poverty rate, with 3 households (5.0%) falling below the poverty line. Among the single-parent households, those with 3 or 4 children have the highest poverty rate, with 4 household (100.0%) living below poverty.
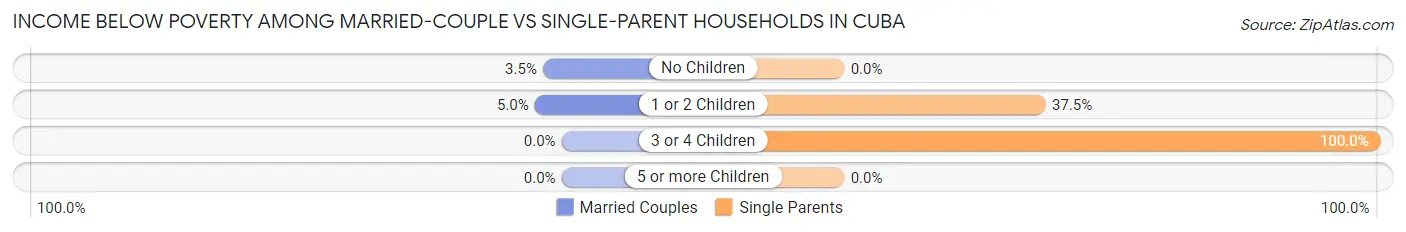
| Children | Married-Couple Families | Single-Parent Households |
| No Children | 3 (3.5%) | 0 (0.0%) |
| 1 or 2 Children | 3 (5.0%) | 6 (37.5%) |
| 3 or 4 Children | 0 (0.0%) | 4 (100.0%) |
| 5 or more Children | 0 (0.0%) | 0 (0.0%) |
| Total | 6 (4.1%) | 10 (20.8%) |
Race in Cuba
The most populous races in Cuba are White / Caucasian (847 | 93.8%), Two or more Races (35 | 3.9%), and Black / African American (21 | 2.3%).
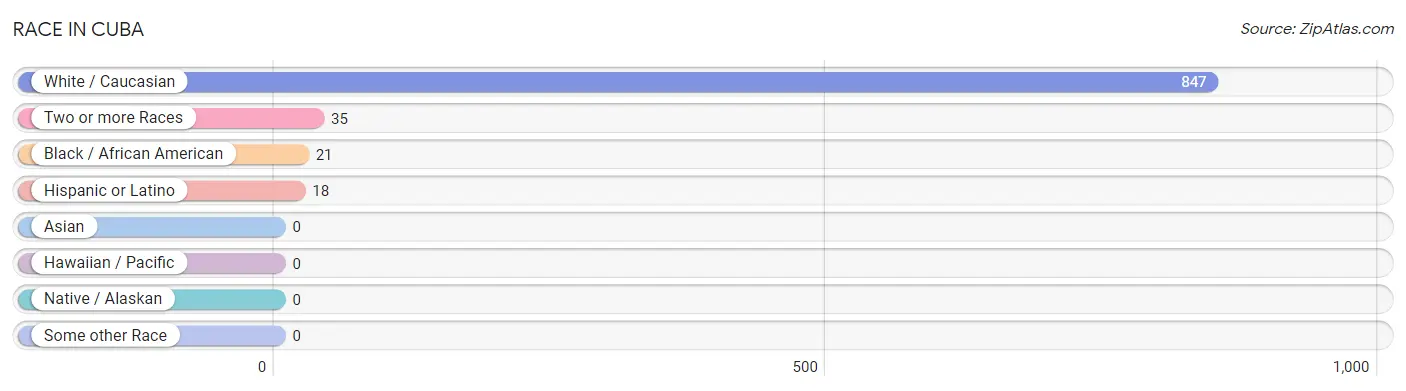
| Race | # Population | % Population |
| Asian | 0 | 0.0% |
| Black / African American | 21 | 2.3% |
| Hawaiian / Pacific | 0 | 0.0% |
| Hispanic or Latino | 18 | 2.0% |
| Native / Alaskan | 0 | 0.0% |
| White / Caucasian | 847 | 93.8% |
| Two or more Races | 35 | 3.9% |
| Some other Race | 0 | 0.0% |
| Total | 903 | 100.0% |
Ancestry in Cuba
The most populous ancestries reported in Cuba are English (191 | 21.1%), German (165 | 18.3%), American (130 | 14.4%), Irish (120 | 13.3%), and Italian (40 | 4.4%), together accounting for 71.5% of all Cuba residents.
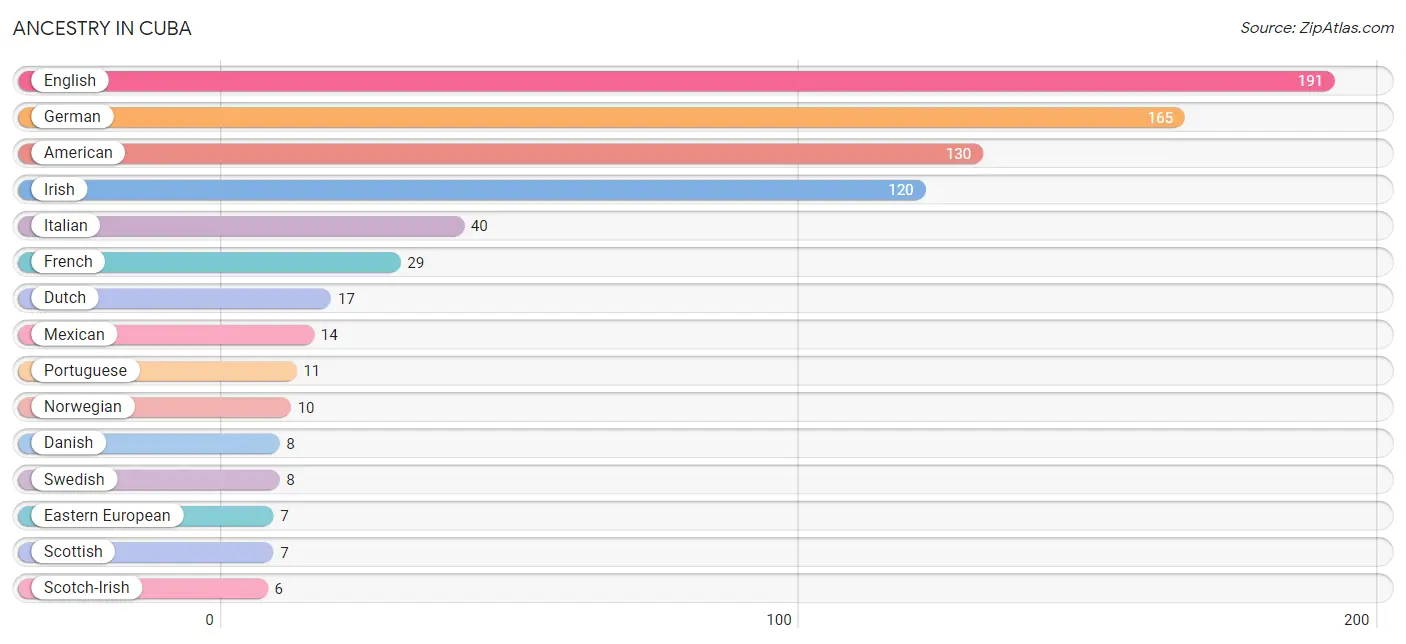
| Ancestry | # Population | % Population |
| American | 130 | 14.4% |
| Danish | 8 | 0.9% |
| Dutch | 17 | 1.9% |
| Eastern European | 7 | 0.8% |
| English | 191 | 21.1% |
| European | 5 | 0.5% |
| French | 29 | 3.2% |
| German | 165 | 18.3% |
| Irish | 120 | 13.3% |
| Italian | 40 | 4.4% |
| Mexican | 14 | 1.5% |
| Norwegian | 10 | 1.1% |
| Portuguese | 11 | 1.2% |
| Puerto Rican | 4 | 0.4% |
| Scotch-Irish | 6 | 0.7% |
| Scottish | 7 | 0.8% |
| Swedish | 8 | 0.9% |
| Welsh | 6 | 0.7% | View All 18 Rows |
Immigrants in Cuba
The most numerous immigrant groups reported in Cuba came from Central America (14 | 1.5%), Latin America (14 | 1.5%), and Mexico (14 | 1.5%), together accounting for 4.6% of all Cuba residents.
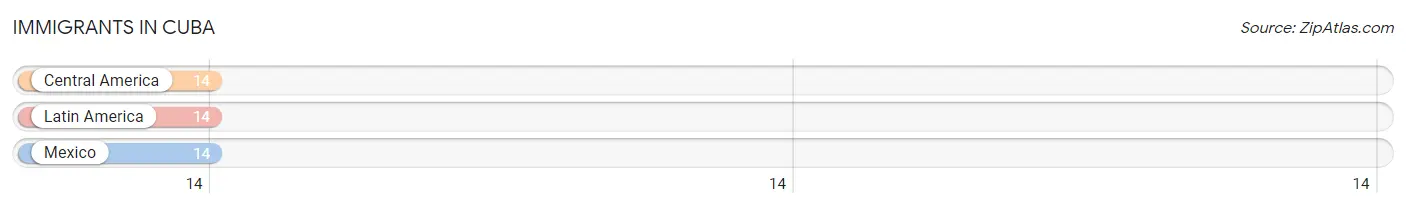
| Immigration Origin | # Population | % Population |
| Central America | 14 | 1.5% |
| Latin America | 14 | 1.5% |
| Mexico | 14 | 1.5% | View All 3 Rows |
Sex and Age in Cuba
Sex and Age in Cuba
The most populous age groups in Cuba are 45 to 49 Years (59 | 13.5%) for men and 55 to 59 Years (80 | 17.1%) for women.
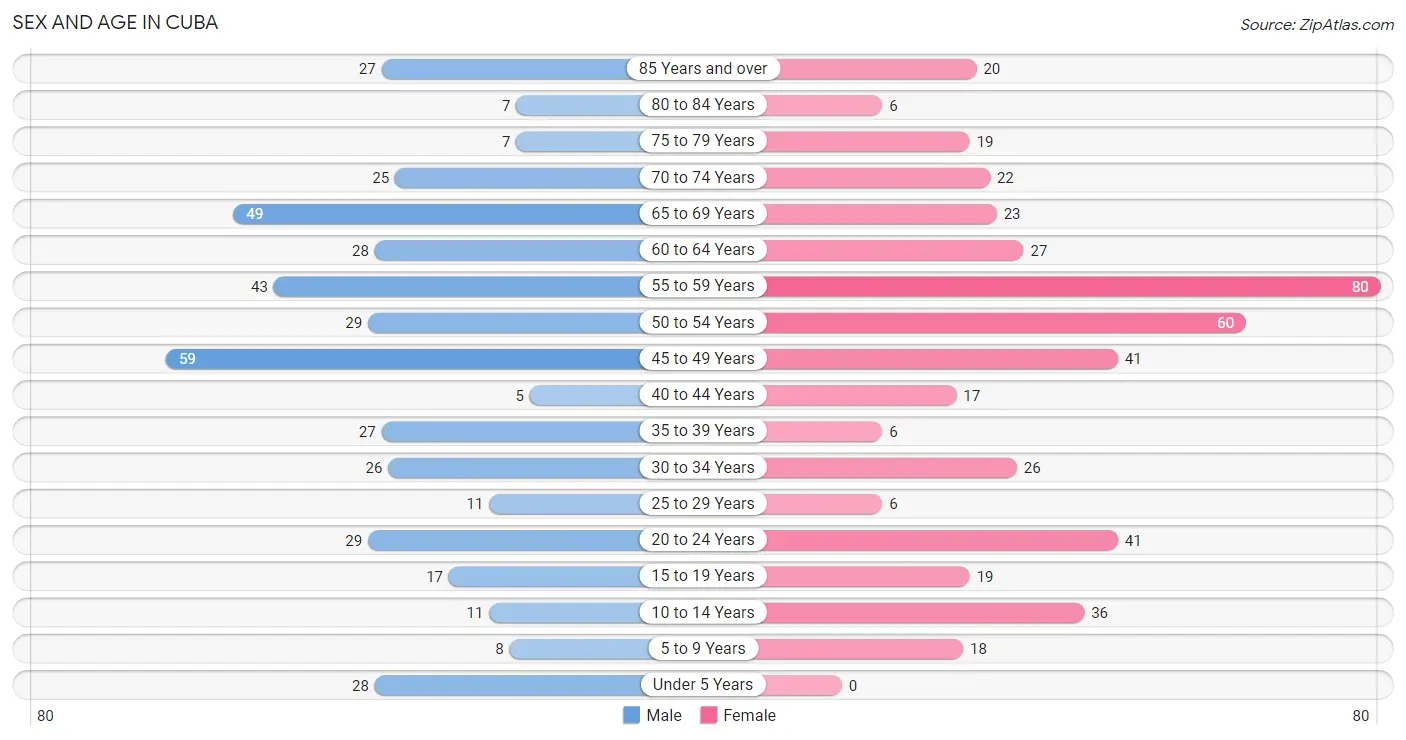
| Age Bracket | Male | Female |
| Under 5 Years | 28 (6.4%) | 0 (0.0%) |
| 5 to 9 Years | 8 (1.8%) | 18 (3.8%) |
| 10 to 14 Years | 11 (2.5%) | 36 (7.7%) |
| 15 to 19 Years | 17 (3.9%) | 19 (4.1%) |
| 20 to 24 Years | 29 (6.7%) | 41 (8.8%) |
| 25 to 29 Years | 11 (2.5%) | 6 (1.3%) |
| 30 to 34 Years | 26 (6.0%) | 26 (5.6%) |
| 35 to 39 Years | 27 (6.2%) | 6 (1.3%) |
| 40 to 44 Years | 5 (1.1%) | 17 (3.6%) |
| 45 to 49 Years | 59 (13.5%) | 41 (8.8%) |
| 50 to 54 Years | 29 (6.7%) | 60 (12.9%) |
| 55 to 59 Years | 43 (9.9%) | 80 (17.1%) |
| 60 to 64 Years | 28 (6.4%) | 27 (5.8%) |
| 65 to 69 Years | 49 (11.2%) | 23 (4.9%) |
| 70 to 74 Years | 25 (5.7%) | 22 (4.7%) |
| 75 to 79 Years | 7 (1.6%) | 19 (4.1%) |
| 80 to 84 Years | 7 (1.6%) | 6 (1.3%) |
| 85 Years and over | 27 (6.2%) | 20 (4.3%) |
| Total | 436 (100.0%) | 467 (100.0%) |
Families and Households in Cuba
Median Family Size in Cuba
The median family size in Cuba is 2.88 persons per family, with single female/mother families (44 | 22.7%) accounting for the largest median family size of 3.11 persons per family. On the other hand, single male/father families (4 | 2.1%) represent the smallest median family size with 2.00 persons per family.
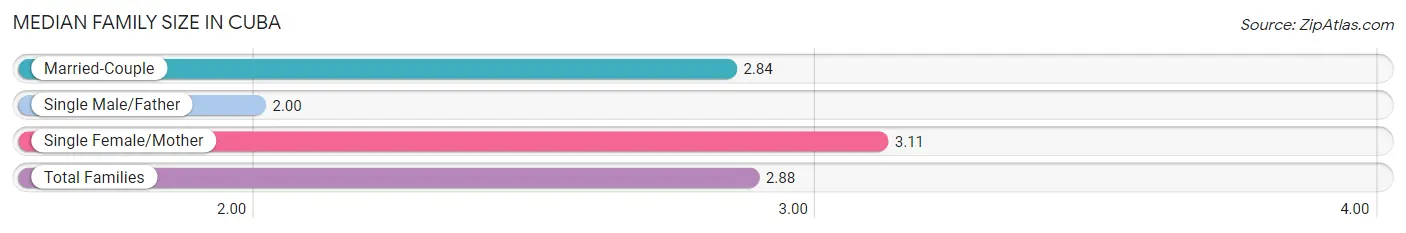
| Family Type | # Families | Family Size |
| Married-Couple | 146 (75.3%) | 2.84 |
| Single Male/Father | 4 (2.1%) | 2.00 |
| Single Female/Mother | 44 (22.7%) | 3.11 |
| Total Families | 194 (100.0%) | 2.88 |
Median Household Size in Cuba
The median household size in Cuba is 1.97 persons per household, with single female/mother households (44 | 10.1%) accounting for the largest median household size of 3.55 persons per household. non-family households (240 | 55.3%) represent the smallest median household size with 1.11 persons per household.
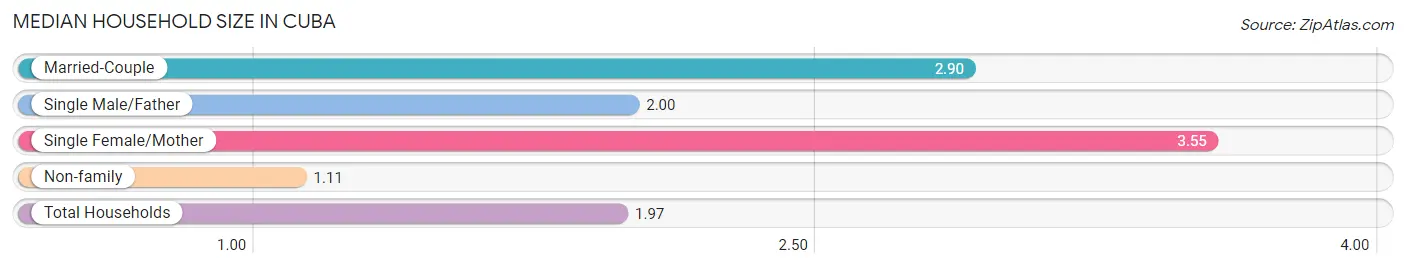
| Household Type | # Households | Household Size |
| Married-Couple | 146 (33.6%) | 2.90 |
| Single Male/Father | 4 (0.9%) | 2.00 |
| Single Female/Mother | 44 (10.1%) | 3.55 |
| Non-family | 240 (55.3%) | 1.11 |
| Total Households | 434 (100.0%) | 1.97 |
Household Size by Marriage Status in Cuba
Out of a total of 434 households in Cuba, 194 (44.7%) are family households, while 240 (55.3%) are nonfamily households. The most numerous type of family households are 2-person households, comprising 85, and the most common type of nonfamily households are 1-person households, comprising 218.
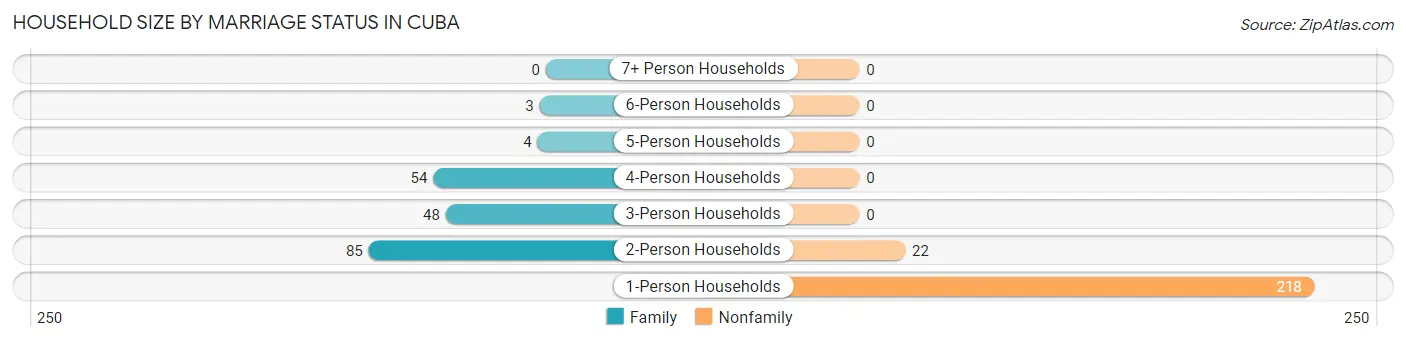
| Household Size | Family Households | Nonfamily Households |
| 1-Person Households | - | 218 (50.2%) |
| 2-Person Households | 85 (19.6%) | 22 (5.1%) |
| 3-Person Households | 48 (11.1%) | 0 (0.0%) |
| 4-Person Households | 54 (12.4%) | 0 (0.0%) |
| 5-Person Households | 4 (0.9%) | 0 (0.0%) |
| 6-Person Households | 3 (0.7%) | 0 (0.0%) |
| 7+ Person Households | 0 (0.0%) | 0 (0.0%) |
| Total | 194 (44.7%) | 240 (55.3%) |
Female Fertility in Cuba
Fertility by Age in Cuba
| Age Bracket | Women with Births | Births / 1,000 Women |
| 15 to 19 years | 0 (0.0%) | 0.0 |
| 20 to 34 years | 0 (0.0%) | 0.0 |
| 35 to 50 years | 0 (0.0%) | 0.0 |
| Total | 0 (0.0%) | 0.0 |
Fertility by Age by Marriage Status in Cuba
| Age Bracket | Married | Unmarried |
| 15 to 19 years | 0 (0.0%) | 0 (0.0%) |
| 20 to 34 years | 0 (0.0%) | 0 (0.0%) |
| 35 to 50 years | 0 (0.0%) | 0 (0.0%) |
| Total | 0 (0.0%) | 0 (0.0%) |
Fertility by Education in Cuba
| Educational Attainment | Women with Births | Births / 1,000 Women |
| Less than High School | 0 (0.0%) | 0.0 |
| High School Diploma | 0 (0.0%) | 0.0 |
| College or Associate's Degree | 0 (0.0%) | 0.0 |
| Bachelor's Degree | 0 (0.0%) | 0.0 |
| Graduate Degree | 0 (0.0%) | 0.0 |
| Total | 0 (0.0%) | 0.0 |
Fertility by Education by Marriage Status in Cuba
| Educational Attainment | Married | Unmarried |
| Less than High School | 0 (0.0%) | 0 (0.0%) |
| High School Diploma | 0 (0.0%) | 0 (0.0%) |
| College or Associate's Degree | 0 (0.0%) | 0 (0.0%) |
| Bachelor's Degree | 0 (0.0%) | 0 (0.0%) |
| Graduate Degree | 0 (0.0%) | 0 (0.0%) |
| Total | 0 (0.0%) | 0 (0.0%) |
Employment Characteristics in Cuba
Employment by Class of Employer in Cuba
Among the 410 employed individuals in Cuba, private company employees (288 | 70.2%), local government employees (52 | 12.7%), and not-for-profit organizations (44 | 10.7%) make up the most common classes of employment.
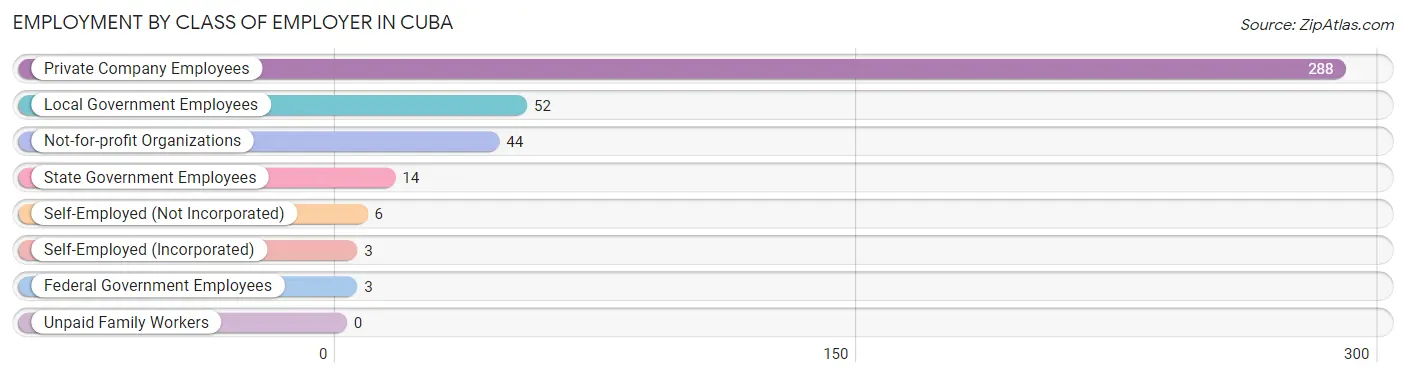
| Employer Class | # Employees | % Employees |
| Private Company Employees | 288 | 70.2% |
| Self-Employed (Incorporated) | 3 | 0.7% |
| Self-Employed (Not Incorporated) | 6 | 1.5% |
| Not-for-profit Organizations | 44 | 10.7% |
| Local Government Employees | 52 | 12.7% |
| State Government Employees | 14 | 3.4% |
| Federal Government Employees | 3 | 0.7% |
| Unpaid Family Workers | 0 | 0.0% |
| Total | 410 | 100.0% |
Employment Status by Age in Cuba
According to the labor force statistics for Cuba, out of the total population over 16 years of age (797), 54.7% or 436 individuals are in the labor force, with 4.1% or 18 of them unemployed. The age group with the highest labor force participation rate is 25 to 29 years, with 100.0% or 17 individuals in the labor force. Within the labor force, the 20 to 24 years age range has the highest percentage of unemployed individuals, with 22.0% or 13 of them being unemployed.
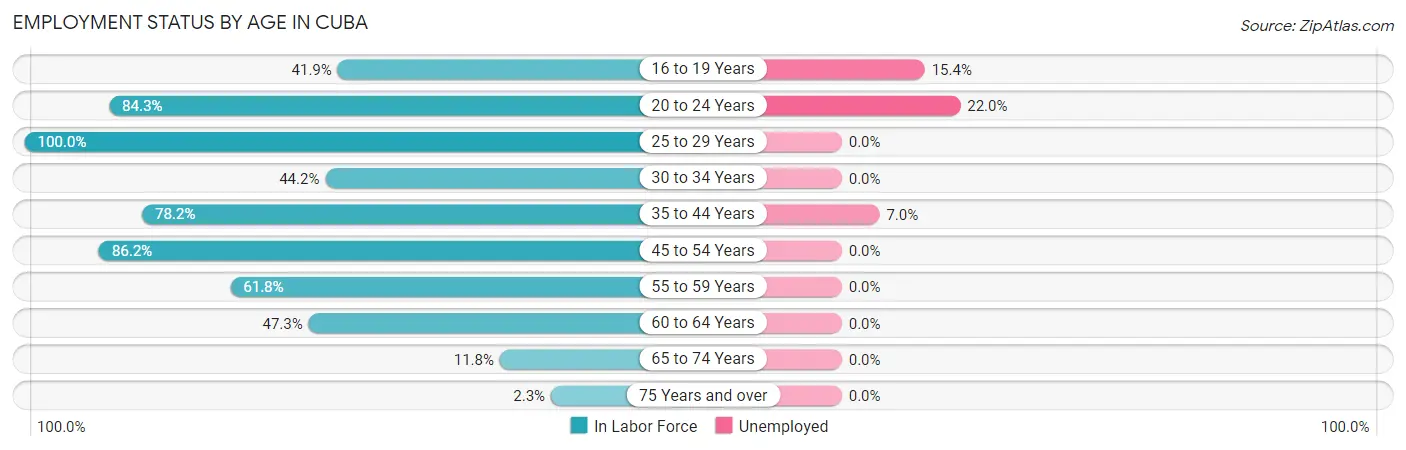
| Age Bracket | In Labor Force | Unemployed |
| 16 to 19 Years | 13 (41.9%) | 2 (15.4%) |
| 20 to 24 Years | 59 (84.3%) | 13 (22.0%) |
| 25 to 29 Years | 17 (100.0%) | 0 (0.0%) |
| 30 to 34 Years | 23 (44.2%) | 0 (0.0%) |
| 35 to 44 Years | 43 (78.2%) | 3 (7.0%) |
| 45 to 54 Years | 163 (86.2%) | 0 (0.0%) |
| 55 to 59 Years | 76 (61.8%) | 0 (0.0%) |
| 60 to 64 Years | 26 (47.3%) | 0 (0.0%) |
| 65 to 74 Years | 14 (11.8%) | 0 (0.0%) |
| 75 Years and over | 2 (2.3%) | 0 (0.0%) |
| Total | 436 (54.7%) | 18 (4.1%) |
Employment Status by Educational Attainment in Cuba
According to labor force statistics for Cuba, 70.9% of individuals (348) out of the total population between 25 and 64 years of age (491) are in the labor force, with 0.9% or 3 of them being unemployed. The group with the highest labor force participation rate are those with the educational attainment of bachelor's degree or higher, with 91.9% or 68 individuals in the labor force. Within the labor force, individuals with high school diploma education have the highest percentage of unemployment, with 2.3% or 3 of them being unemployed.
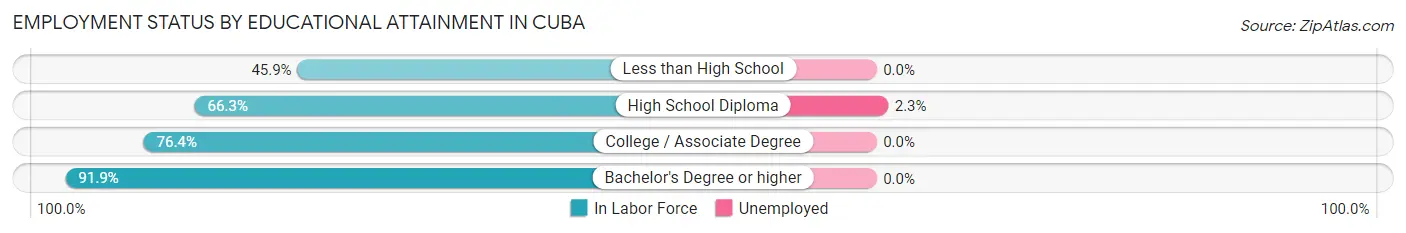
| Educational Attainment | In Labor Force | Unemployed |
| Less than High School | 28 (45.9%) | 0 (0.0%) |
| High School Diploma | 132 (66.3%) | 5 (2.3%) |
| College / Associate Degree | 120 (76.4%) | 0 (0.0%) |
| Bachelor's Degree or higher | 68 (91.9%) | 0 (0.0%) |
| Total | 348 (70.9%) | 4 (0.9%) |
Employment Occupations by Sex in Cuba
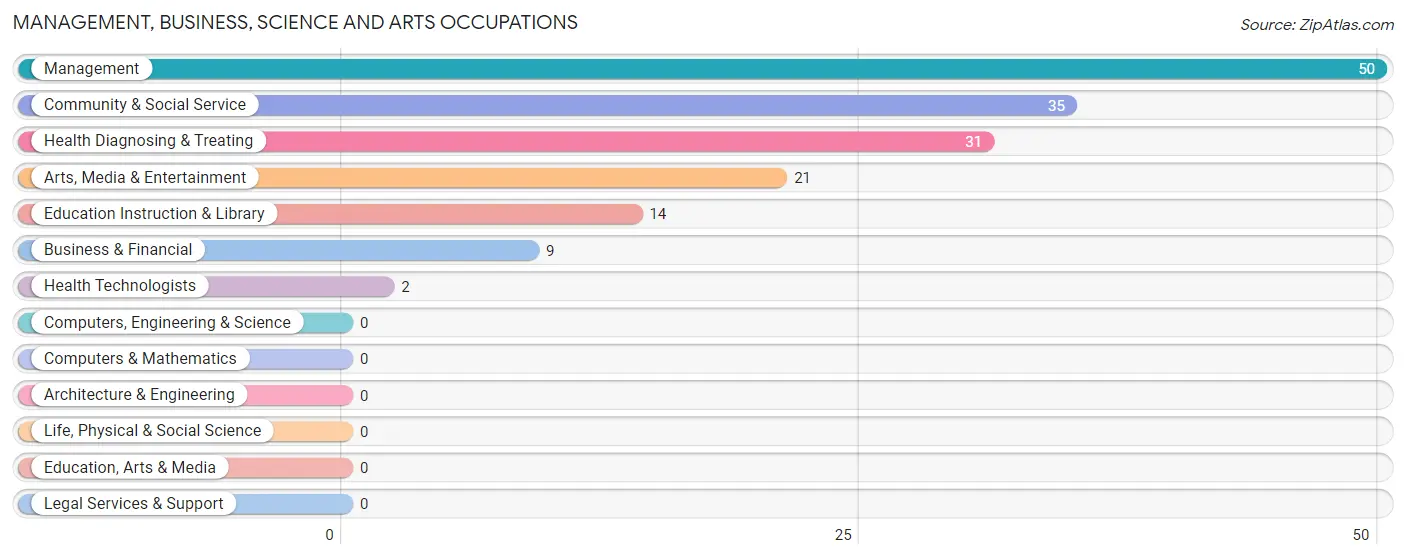
Management, Business, Science and Arts Occupations
The most common Management, Business, Science and Arts occupations in Cuba are Management (50 | 12.0%), Community & Social Service (35 | 8.4%), Health Diagnosing & Treating (31 | 7.4%), Arts, Media & Entertainment (21 | 5.0%), and Education Instruction & Library (14 | 3.4%).
Management, Business, Science and Arts Occupations by Sex
Within the Management, Business, Science and Arts occupations in Cuba, the most male-oriented occupations are Management (52.0%), Education Instruction & Library (21.4%), and Health Diagnosing & Treating (9.7%), while the most female-oriented occupations are Business & Financial (100.0%), Arts, Media & Entertainment (100.0%), and Health Technologists (100.0%).
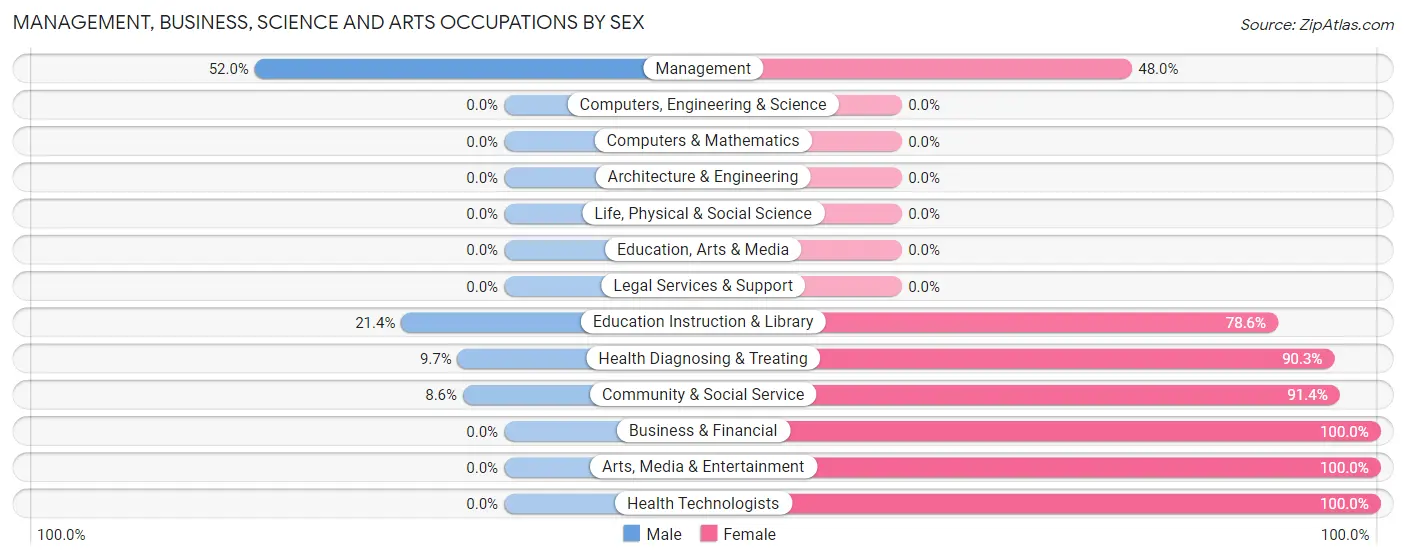
| Occupation | Male | Female |
| Management | 26 (52.0%) | 24 (48.0%) |
| Business & Financial | 0 (0.0%) | 9 (100.0%) |
| Computers, Engineering & Science | 0 (0.0%) | 0 (0.0%) |
| Computers & Mathematics | 0 (0.0%) | 0 (0.0%) |
| Architecture & Engineering | 0 (0.0%) | 0 (0.0%) |
| Life, Physical & Social Science | 0 (0.0%) | 0 (0.0%) |
| Community & Social Service | 3 (8.6%) | 32 (91.4%) |
| Education, Arts & Media | 0 (0.0%) | 0 (0.0%) |
| Legal Services & Support | 0 (0.0%) | 0 (0.0%) |
| Education Instruction & Library | 3 (21.4%) | 11 (78.6%) |
| Arts, Media & Entertainment | 0 (0.0%) | 21 (100.0%) |
| Health Diagnosing & Treating | 3 (9.7%) | 28 (90.3%) |
| Health Technologists | 0 (0.0%) | 2 (100.0%) |
| Total (Category) | 32 (25.6%) | 93 (74.4%) |
| Total (Overall) | 221 (52.9%) | 197 (47.1%) |
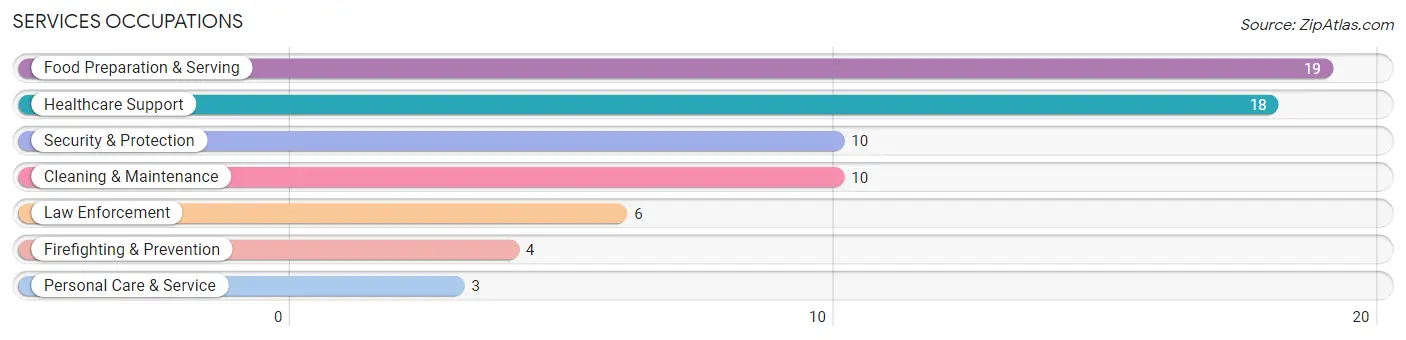
Services Occupations
The most common Services occupations in Cuba are Food Preparation & Serving (19 | 4.5%), Healthcare Support (18 | 4.3%), Security & Protection (10 | 2.4%), Cleaning & Maintenance (10 | 2.4%), and Law Enforcement (6 | 1.4%).
Services Occupations by Sex
Within the Services occupations in Cuba, the most male-oriented occupations are Law Enforcement (100.0%), Security & Protection (60.0%), and Cleaning & Maintenance (30.0%), while the most female-oriented occupations are Healthcare Support (100.0%), Firefighting & Prevention (100.0%), and Personal Care & Service (100.0%).
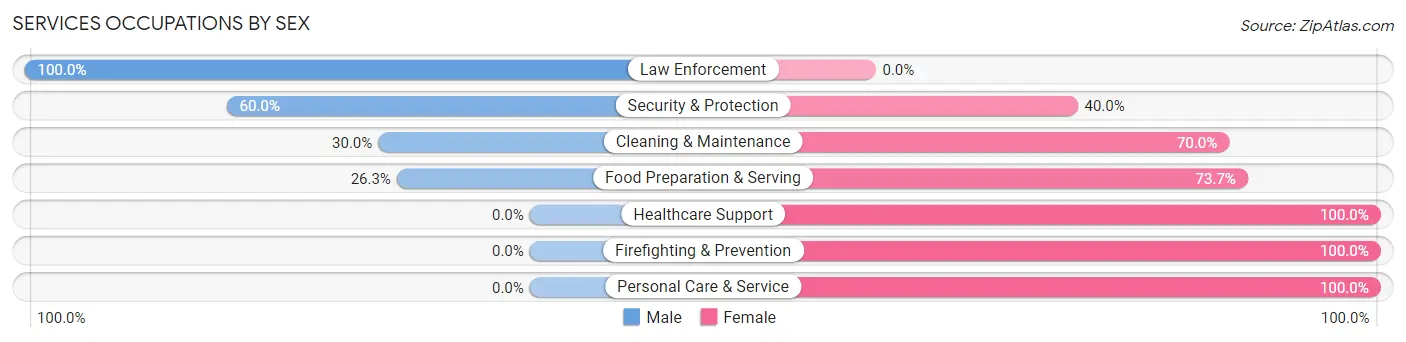
| Occupation | Male | Female |
| Healthcare Support | 0 (0.0%) | 18 (100.0%) |
| Security & Protection | 6 (60.0%) | 4 (40.0%) |
| Firefighting & Prevention | 0 (0.0%) | 4 (100.0%) |
| Law Enforcement | 6 (100.0%) | 0 (0.0%) |
| Food Preparation & Serving | 5 (26.3%) | 14 (73.7%) |
| Cleaning & Maintenance | 3 (30.0%) | 7 (70.0%) |
| Personal Care & Service | 0 (0.0%) | 3 (100.0%) |
| Total (Category) | 14 (23.3%) | 46 (76.7%) |
| Total (Overall) | 221 (52.9%) | 197 (47.1%) |
Sales and Office Occupations
The most common Sales and Office occupations in Cuba are Office & Administration (48 | 11.5%), and Sales & Related (32 | 7.7%).
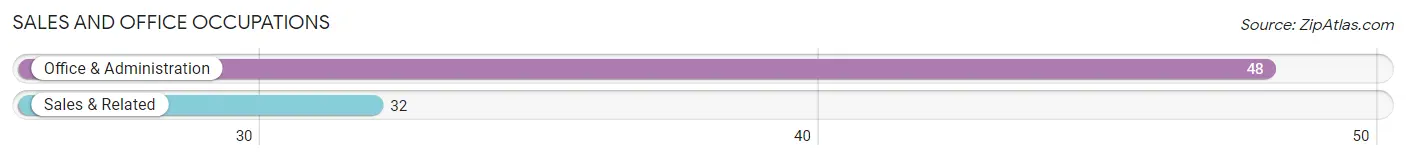
Sales and Office Occupations by Sex

| Occupation | Male | Female |
| Sales & Related | 26 (81.2%) | 6 (18.8%) |
| Office & Administration | 7 (14.6%) | 41 (85.4%) |
| Total (Category) | 33 (41.2%) | 47 (58.8%) |
| Total (Overall) | 221 (52.9%) | 197 (47.1%) |
Natural Resources, Construction and Maintenance Occupations
The most common Natural Resources, Construction and Maintenance occupations in Cuba are Installation, Maintenance & Repair (31 | 7.4%), and Construction & Extraction (25 | 6.0%).
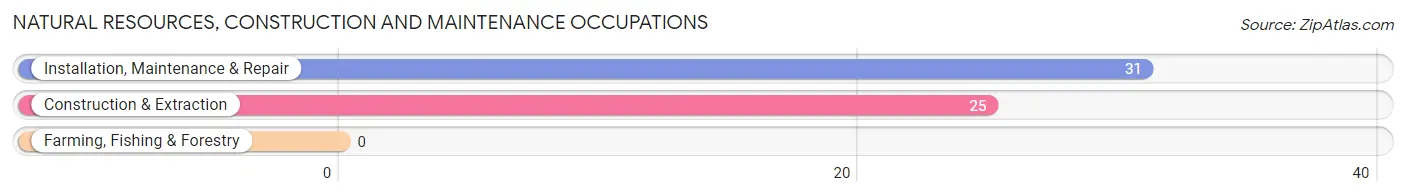
Natural Resources, Construction and Maintenance Occupations by Sex
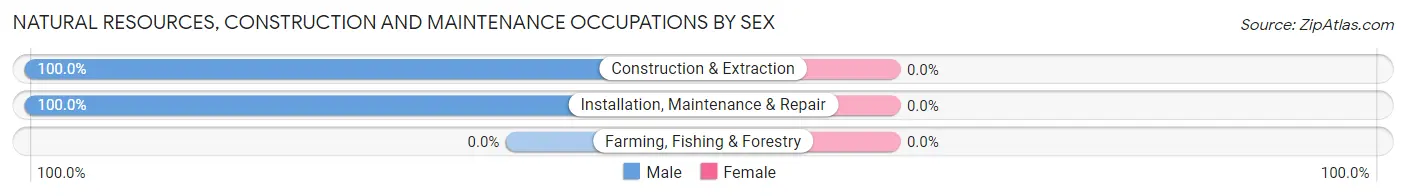
| Occupation | Male | Female |
| Farming, Fishing & Forestry | 0 (0.0%) | 0 (0.0%) |
| Construction & Extraction | 25 (100.0%) | 0 (0.0%) |
| Installation, Maintenance & Repair | 31 (100.0%) | 0 (0.0%) |
| Total (Category) | 56 (100.0%) | 0 (0.0%) |
| Total (Overall) | 221 (52.9%) | 197 (47.1%) |
Production, Transportation and Moving Occupations
The most common Production, Transportation and Moving occupations in Cuba are Transportation (58 | 13.9%), Material Moving (22 | 5.3%), and Production (17 | 4.1%).
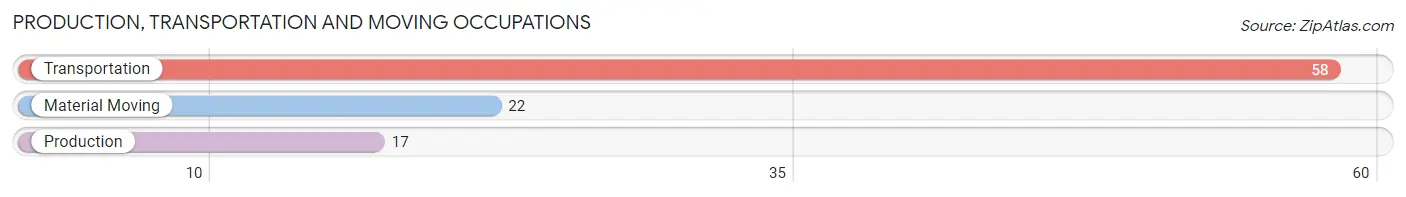
Production, Transportation and Moving Occupations by Sex
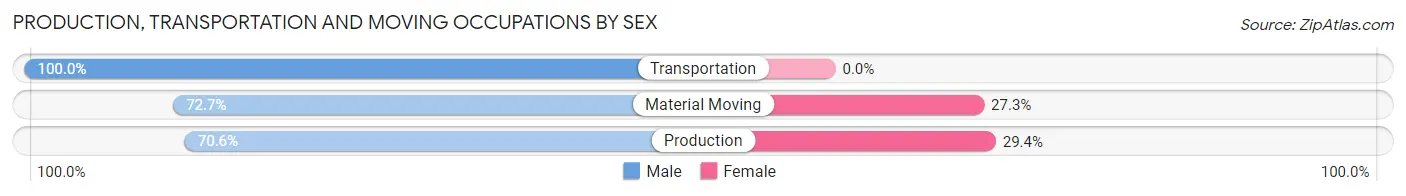
| Occupation | Male | Female |
| Production | 12 (70.6%) | 5 (29.4%) |
| Transportation | 58 (100.0%) | 0 (0.0%) |
| Material Moving | 16 (72.7%) | 6 (27.3%) |
| Total (Category) | 86 (88.7%) | 11 (11.3%) |
| Total (Overall) | 221 (52.9%) | 197 (47.1%) |
Employment Industries by Sex in Cuba
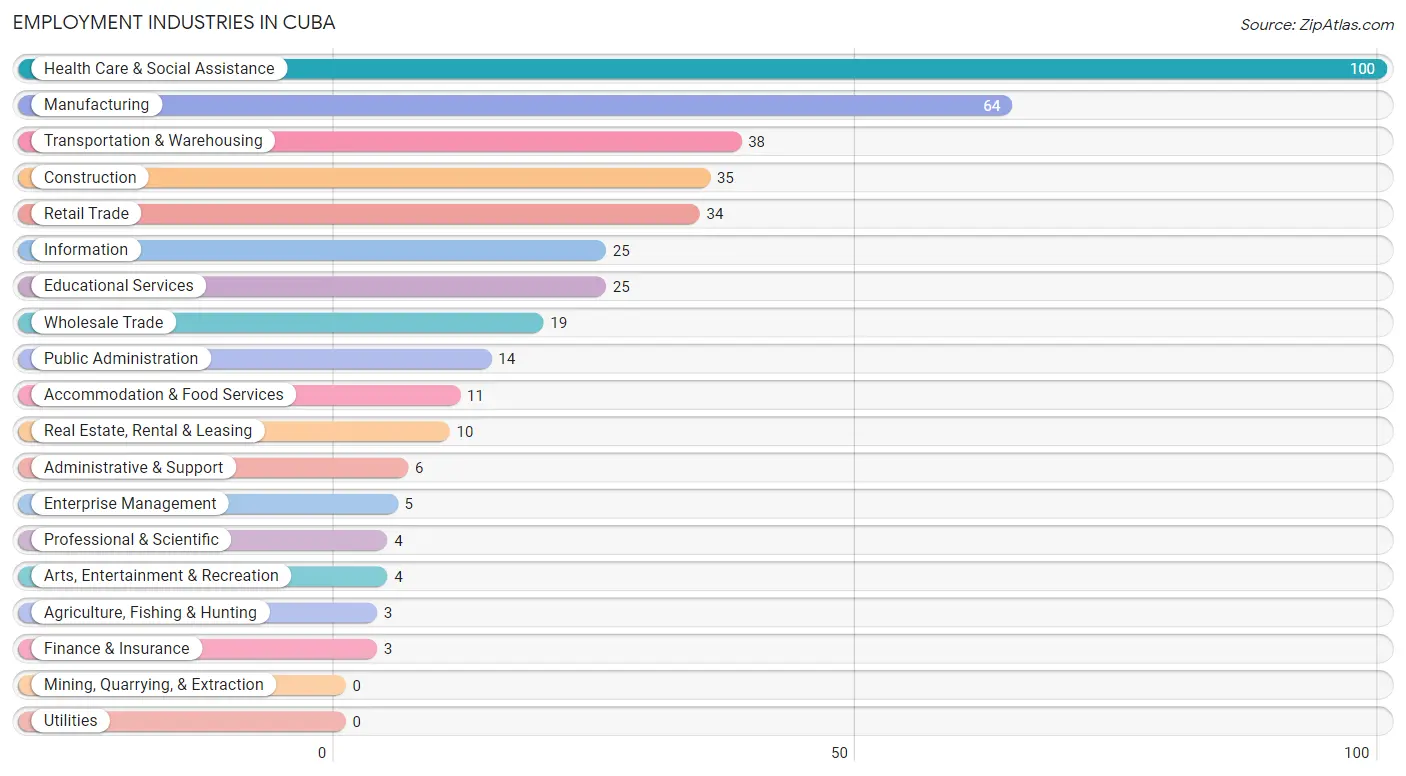
Employment Industries in Cuba
The major employment industries in Cuba include Health Care & Social Assistance (100 | 23.9%), Manufacturing (64 | 15.3%), Transportation & Warehousing (38 | 9.1%), Construction (35 | 8.4%), and Retail Trade (34 | 8.1%).
Employment Industries by Sex in Cuba
The Cuba industries that see more men than women are Agriculture, Fishing & Hunting (100.0%), Professional & Scientific (100.0%), and Accommodation & Food Services (100.0%), whereas the industries that tend to have a higher number of women are Information (100.0%), Finance & Insurance (100.0%), and Enterprise Management (100.0%).
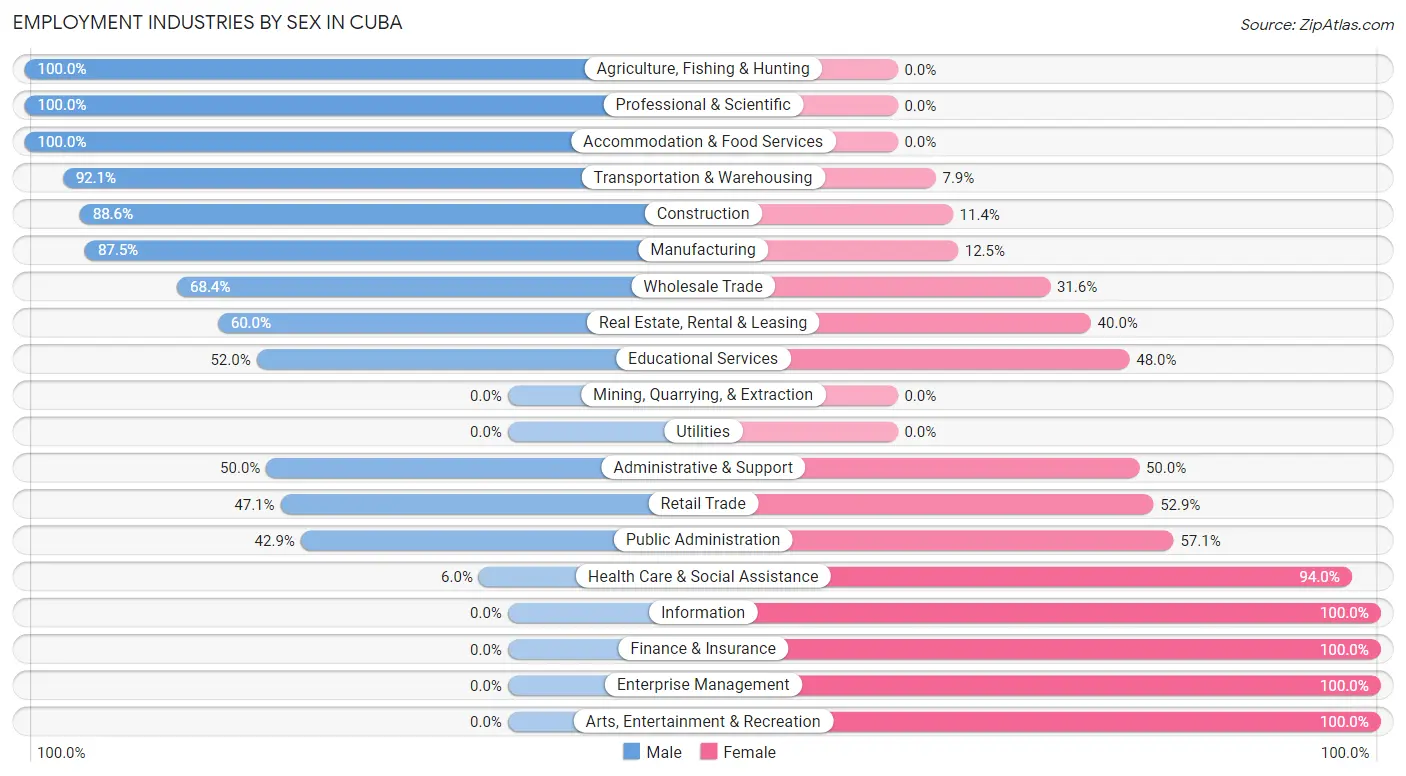
| Industry | Male | Female |
| Agriculture, Fishing & Hunting | 3 (100.0%) | 0 (0.0%) |
| Mining, Quarrying, & Extraction | 0 (0.0%) | 0 (0.0%) |
| Construction | 31 (88.6%) | 4 (11.4%) |
| Manufacturing | 56 (87.5%) | 8 (12.5%) |
| Wholesale Trade | 13 (68.4%) | 6 (31.6%) |
| Retail Trade | 16 (47.1%) | 18 (52.9%) |
| Transportation & Warehousing | 35 (92.1%) | 3 (7.9%) |
| Utilities | 0 (0.0%) | 0 (0.0%) |
| Information | 0 (0.0%) | 25 (100.0%) |
| Finance & Insurance | 0 (0.0%) | 3 (100.0%) |
| Real Estate, Rental & Leasing | 6 (60.0%) | 4 (40.0%) |
| Professional & Scientific | 4 (100.0%) | 0 (0.0%) |
| Enterprise Management | 0 (0.0%) | 5 (100.0%) |
| Administrative & Support | 3 (50.0%) | 3 (50.0%) |
| Educational Services | 13 (52.0%) | 12 (48.0%) |
| Health Care & Social Assistance | 6 (6.0%) | 94 (94.0%) |
| Arts, Entertainment & Recreation | 0 (0.0%) | 4 (100.0%) |
| Accommodation & Food Services | 11 (100.0%) | 0 (0.0%) |
| Public Administration | 6 (42.9%) | 8 (57.1%) |
| Total | 221 (52.9%) | 197 (47.1%) |
Education in Cuba
School Enrollment in Cuba
The most common levels of schooling among the 141 students in Cuba are middle school (44 | 31.2%), high school (43 | 30.5%), and college / undergraduate (28 | 19.9%).
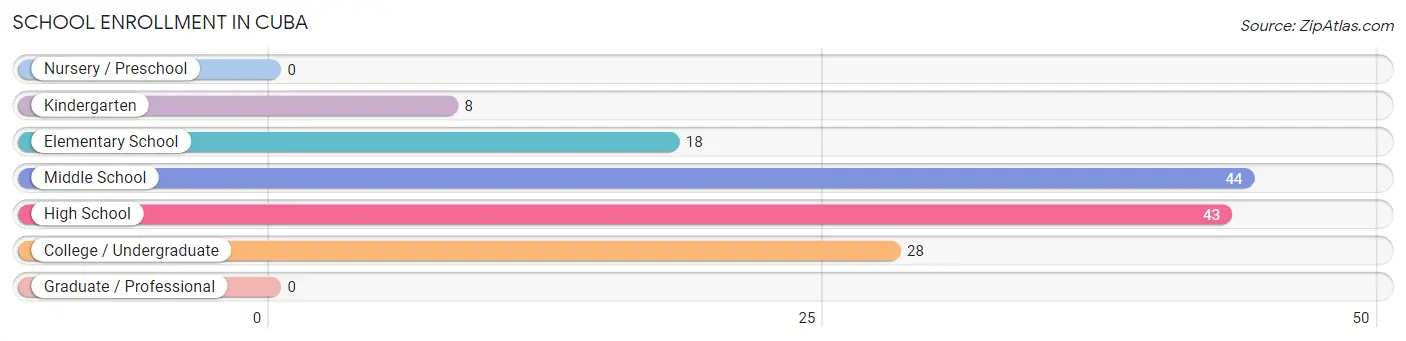
| School Level | # Students | % Students |
| Nursery / Preschool | 0 | 0.0% |
| Kindergarten | 8 | 5.7% |
| Elementary School | 18 | 12.8% |
| Middle School | 44 | 31.2% |
| High School | 43 | 30.5% |
| College / Undergraduate | 28 | 19.9% |
| Graduate / Professional | 0 | 0.0% |
| Total | 141 | 100.0% |
School Enrollment by Age by Funding Source in Cuba
Out of a total of 141 students who are enrolled in schools in Cuba, 3 (2.1%) attend a private institution, while the remaining 138 (97.9%) are enrolled in public schools. The age group of 15 to 17 year olds has the highest likelihood of being enrolled in private schools, with 3 (20.0% in the age bracket) enrolled. Conversely, the age group of 5 to 9 year old has the lowest likelihood of being enrolled in a private school, with 26 (100.0% in the age bracket) attending a public institution.
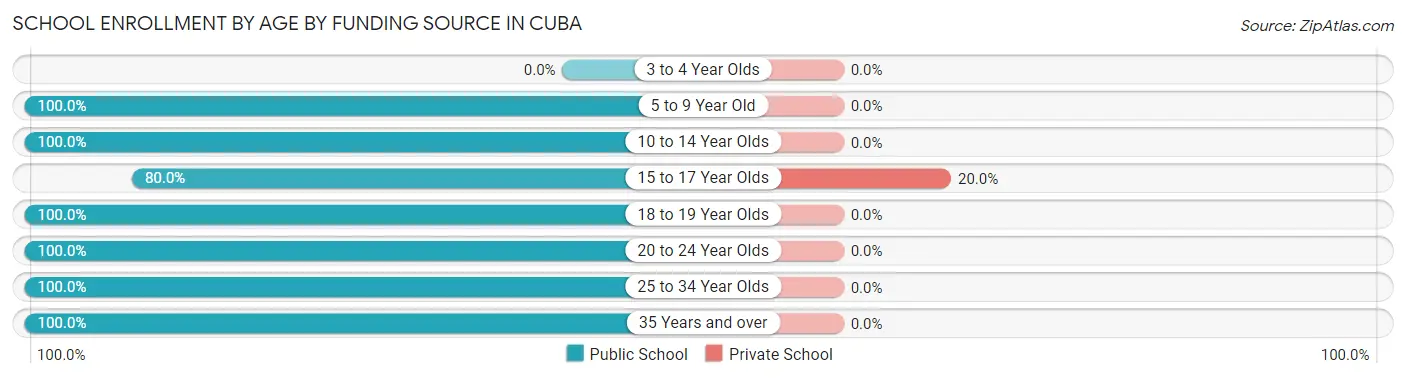
| Age Bracket | Public School | Private School |
| 3 to 4 Year Olds | 0 (0.0%) | 0 (0.0%) |
| 5 to 9 Year Old | 26 (100.0%) | 0 (0.0%) |
| 10 to 14 Year Olds | 47 (100.0%) | 0 (0.0%) |
| 15 to 17 Year Olds | 12 (80.0%) | 3 (20.0%) |
| 18 to 19 Year Olds | 12 (100.0%) | 0 (0.0%) |
| 20 to 24 Year Olds | 25 (100.0%) | 0 (0.0%) |
| 25 to 34 Year Olds | 3 (100.0%) | 0 (0.0%) |
| 35 Years and over | 13 (100.0%) | 0 (0.0%) |
| Total | 138 (97.9%) | 3 (2.1%) |
Educational Attainment by Field of Study in Cuba
Business (27 | 29.0%), education (17 | 18.3%), science & technology (15 | 16.1%), liberal arts & history (15 | 16.1%), and bio, nature & agricultural (10 | 10.7%) are the most common fields of study among 93 individuals in Cuba who have obtained a bachelor's degree or higher.
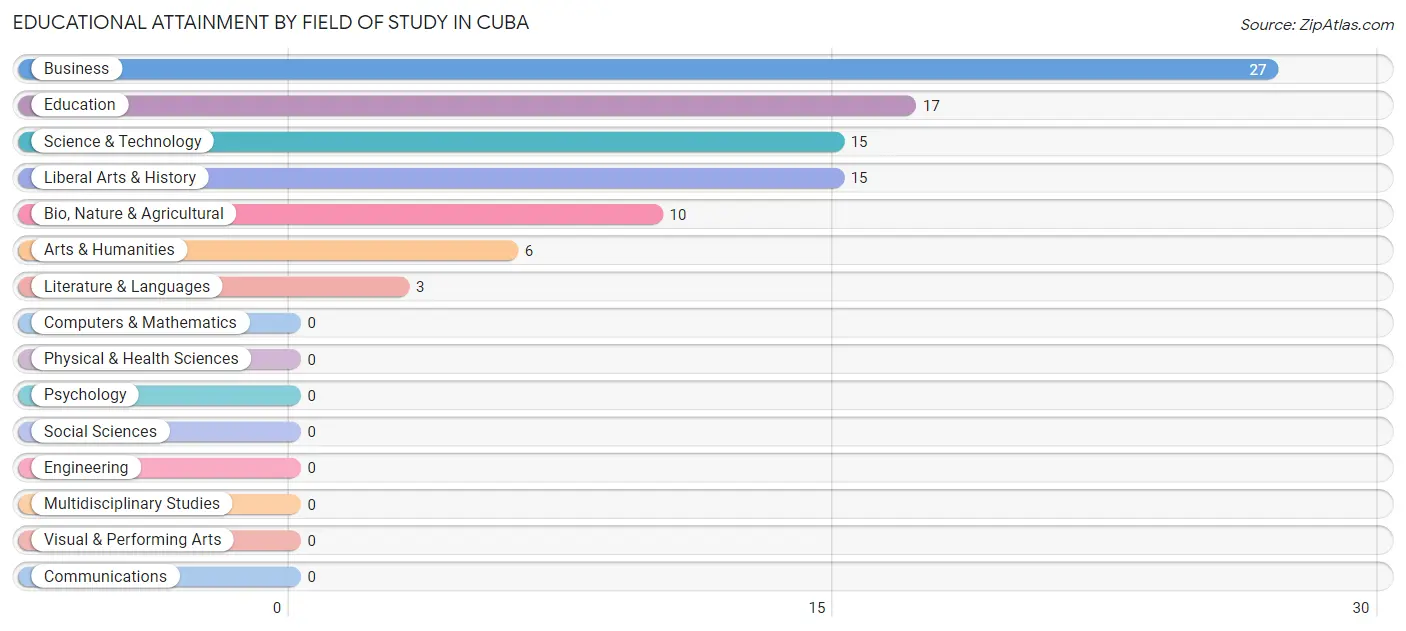
| Field of Study | # Graduates | % Graduates |
| Computers & Mathematics | 0 | 0.0% |
| Bio, Nature & Agricultural | 10 | 10.7% |
| Physical & Health Sciences | 0 | 0.0% |
| Psychology | 0 | 0.0% |
| Social Sciences | 0 | 0.0% |
| Engineering | 0 | 0.0% |
| Multidisciplinary Studies | 0 | 0.0% |
| Science & Technology | 15 | 16.1% |
| Business | 27 | 29.0% |
| Education | 17 | 18.3% |
| Literature & Languages | 3 | 3.2% |
| Liberal Arts & History | 15 | 16.1% |
| Visual & Performing Arts | 0 | 0.0% |
| Communications | 0 | 0.0% |
| Arts & Humanities | 6 | 6.5% |
| Total | 93 | 100.0% |
Transportation & Commute in Cuba
Vehicle Availability by Sex in Cuba
The most prevalent vehicle ownership categories in Cuba are males with 2 vehicles (101, accounting for 47.4%) and females with 2 vehicles (58, making up 51.3%).
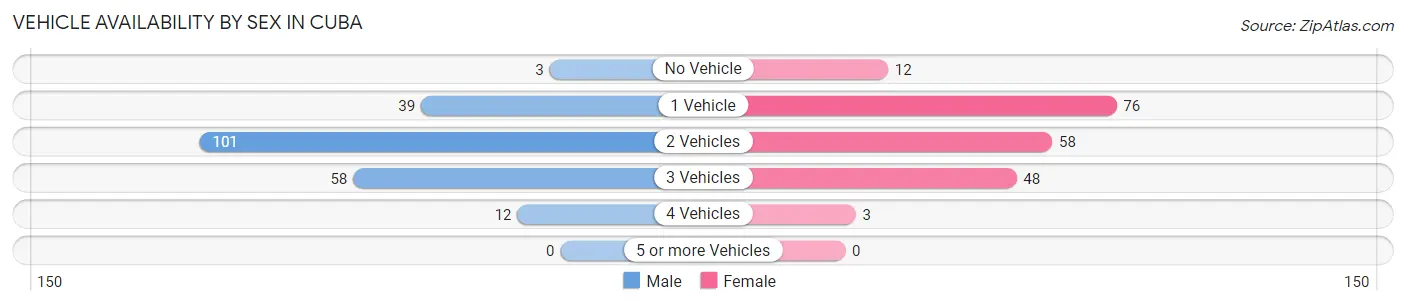
| Vehicles Available | Male | Female |
| No Vehicle | 3 (1.4%) | 12 (6.1%) |
| 1 Vehicle | 39 (18.3%) | 76 (38.6%) |
| 2 Vehicles | 101 (47.4%) | 58 (29.4%) |
| 3 Vehicles | 58 (27.2%) | 48 (24.4%) |
| 4 Vehicles | 12 (5.6%) | 3 (1.5%) |
| 5 or more Vehicles | 0 (0.0%) | 0 (0.0%) |
| Total | 213 (100.0%) | 197 (100.0%) |
Commute Time in Cuba
The most frequently occuring commute durations in Cuba are 60 to 89 minutes (90 commuters, 23.7%), 15 to 19 minutes (61 commuters, 16.1%), and 20 to 24 minutes (41 commuters, 10.8%).
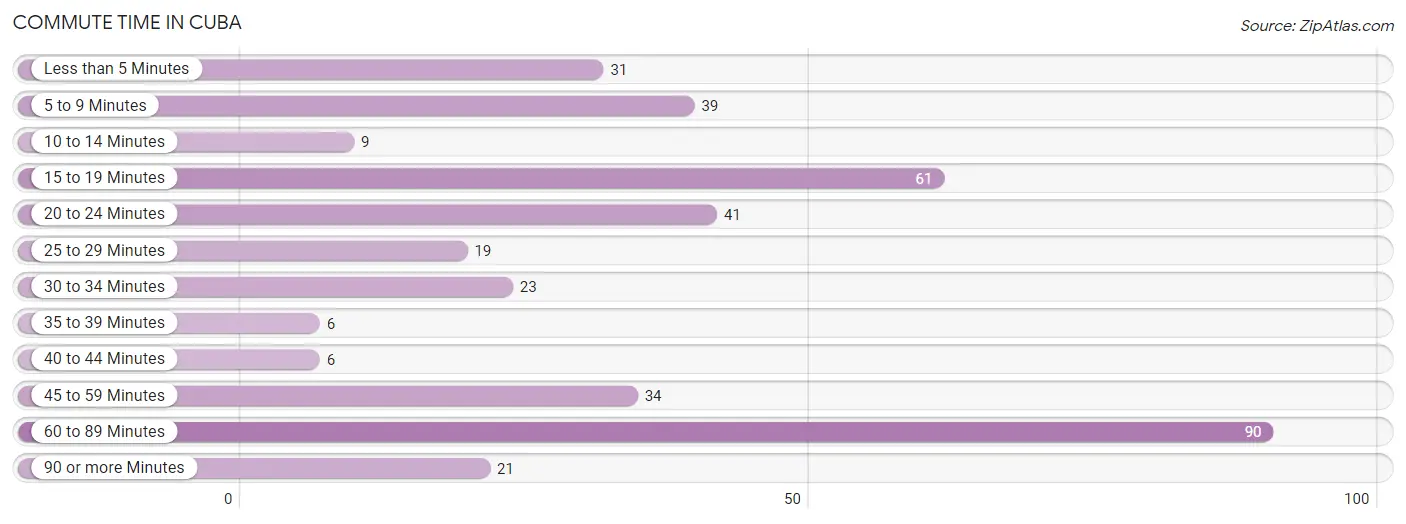
| Commute Time | # Commuters | % Commuters |
| Less than 5 Minutes | 31 | 8.2% |
| 5 to 9 Minutes | 39 | 10.3% |
| 10 to 14 Minutes | 9 | 2.4% |
| 15 to 19 Minutes | 61 | 16.1% |
| 20 to 24 Minutes | 41 | 10.8% |
| 25 to 29 Minutes | 19 | 5.0% |
| 30 to 34 Minutes | 23 | 6.0% |
| 35 to 39 Minutes | 6 | 1.6% |
| 40 to 44 Minutes | 6 | 1.6% |
| 45 to 59 Minutes | 34 | 8.9% |
| 60 to 89 Minutes | 90 | 23.7% |
| 90 or more Minutes | 21 | 5.5% |
Commute Time by Sex in Cuba
The most common commute times in Cuba are 60 to 89 minutes (48 commuters, 22.9%) for males and 60 to 89 minutes (42 commuters, 24.7%) for females.
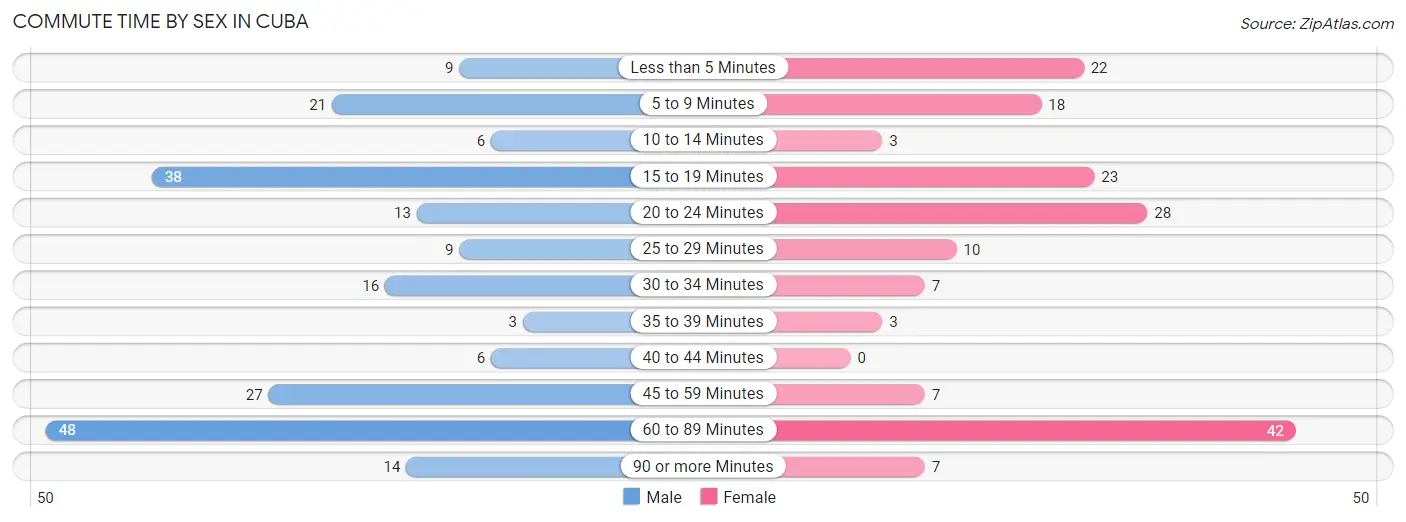
| Commute Time | Male | Female |
| Less than 5 Minutes | 9 (4.3%) | 22 (12.9%) |
| 5 to 9 Minutes | 21 (10.0%) | 18 (10.6%) |
| 10 to 14 Minutes | 6 (2.9%) | 3 (1.8%) |
| 15 to 19 Minutes | 38 (18.1%) | 23 (13.5%) |
| 20 to 24 Minutes | 13 (6.2%) | 28 (16.5%) |
| 25 to 29 Minutes | 9 (4.3%) | 10 (5.9%) |
| 30 to 34 Minutes | 16 (7.6%) | 7 (4.1%) |
| 35 to 39 Minutes | 3 (1.4%) | 3 (1.8%) |
| 40 to 44 Minutes | 6 (2.9%) | 0 (0.0%) |
| 45 to 59 Minutes | 27 (12.9%) | 7 (4.1%) |
| 60 to 89 Minutes | 48 (22.9%) | 42 (24.7%) |
| 90 or more Minutes | 14 (6.7%) | 7 (4.1%) |
Time of Departure to Work by Sex in Cuba
The most frequent times of departure to work in Cuba are 6:00 AM to 6:29 AM (37, 17.6%) for males and 6:30 AM to 6:59 AM (29, 17.1%) for females.
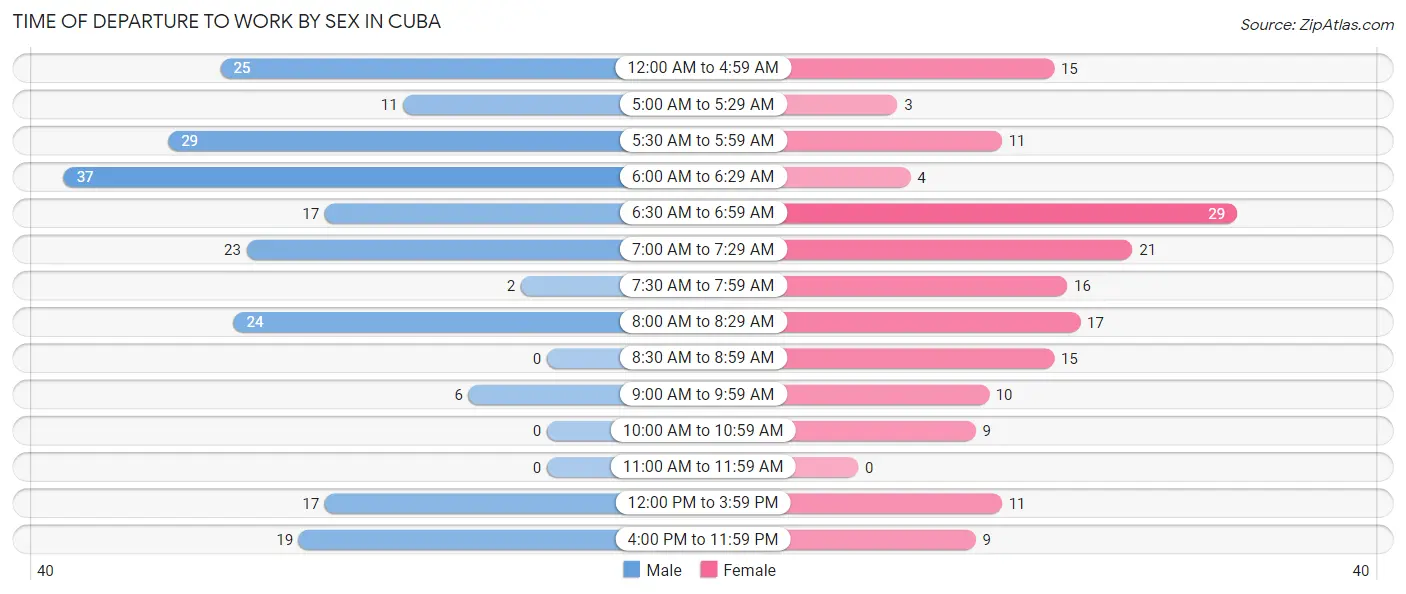
| Time of Departure | Male | Female |
| 12:00 AM to 4:59 AM | 25 (11.9%) | 15 (8.8%) |
| 5:00 AM to 5:29 AM | 11 (5.2%) | 3 (1.8%) |
| 5:30 AM to 5:59 AM | 29 (13.8%) | 11 (6.5%) |
| 6:00 AM to 6:29 AM | 37 (17.6%) | 4 (2.4%) |
| 6:30 AM to 6:59 AM | 17 (8.1%) | 29 (17.1%) |
| 7:00 AM to 7:29 AM | 23 (11.0%) | 21 (12.3%) |
| 7:30 AM to 7:59 AM | 2 (0.9%) | 16 (9.4%) |
| 8:00 AM to 8:29 AM | 24 (11.4%) | 17 (10.0%) |
| 8:30 AM to 8:59 AM | 0 (0.0%) | 15 (8.8%) |
| 9:00 AM to 9:59 AM | 6 (2.9%) | 10 (5.9%) |
| 10:00 AM to 10:59 AM | 0 (0.0%) | 9 (5.3%) |
| 11:00 AM to 11:59 AM | 0 (0.0%) | 0 (0.0%) |
| 12:00 PM to 3:59 PM | 17 (8.1%) | 11 (6.5%) |
| 4:00 PM to 11:59 PM | 19 (9.0%) | 9 (5.3%) |
| Total | 210 (100.0%) | 170 (100.0%) |
Housing Occupancy in Cuba
Occupancy by Ownership in Cuba
Of the total 434 dwellings in Cuba, owner-occupied units account for 332 (76.5%), while renter-occupied units make up 102 (23.5%).
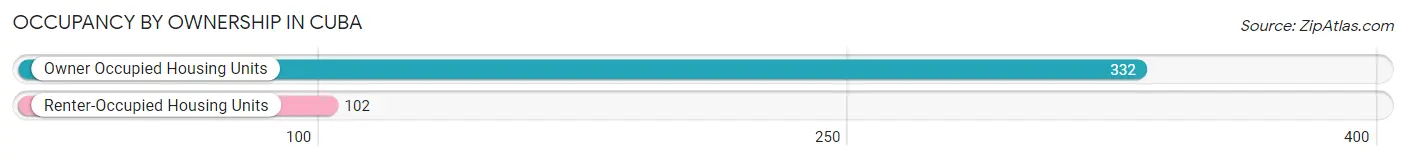
| Occupancy | # Housing Units | % Housing Units |
| Owner Occupied Housing Units | 332 | 76.5% |
| Renter-Occupied Housing Units | 102 | 23.5% |
| Total Occupied Housing Units | 434 | 100.0% |
Occupancy by Household Size in Cuba
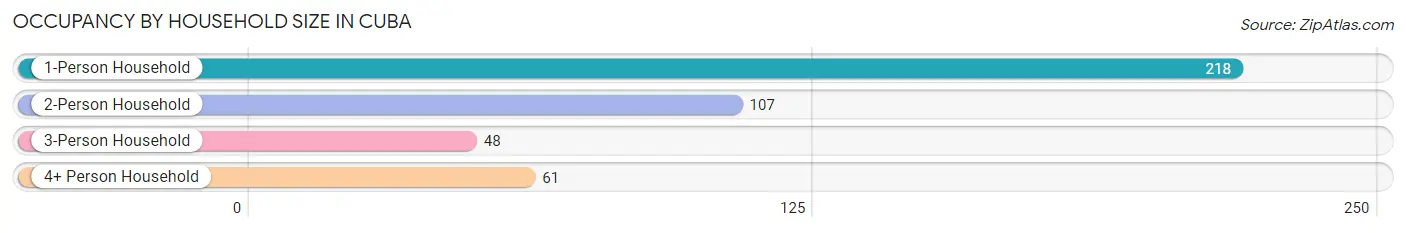
| Household Size | # Housing Units | % Housing Units |
| 1-Person Household | 218 | 50.2% |
| 2-Person Household | 107 | 24.6% |
| 3-Person Household | 48 | 11.1% |
| 4+ Person Household | 61 | 14.1% |
| Total Housing Units | 434 | 100.0% |
Occupancy by Ownership by Household Size in Cuba
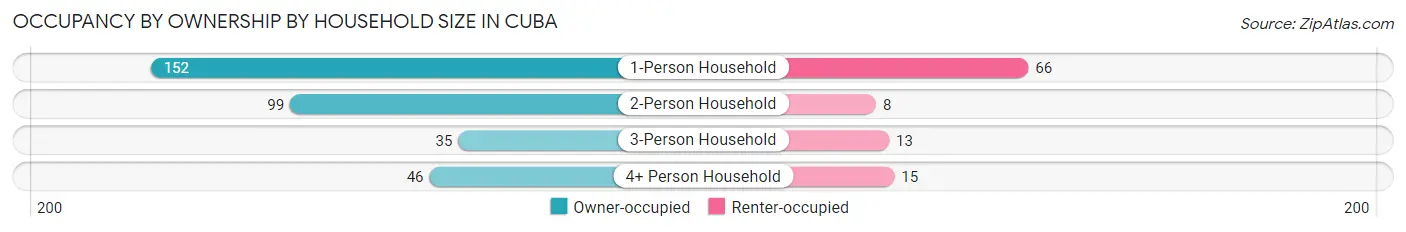
| Household Size | Owner-occupied | Renter-occupied |
| 1-Person Household | 152 (69.7%) | 66 (30.3%) |
| 2-Person Household | 99 (92.5%) | 8 (7.5%) |
| 3-Person Household | 35 (72.9%) | 13 (27.1%) |
| 4+ Person Household | 46 (75.4%) | 15 (24.6%) |
| Total Housing Units | 332 (76.5%) | 102 (23.5%) |
Occupancy by Educational Attainment in Cuba
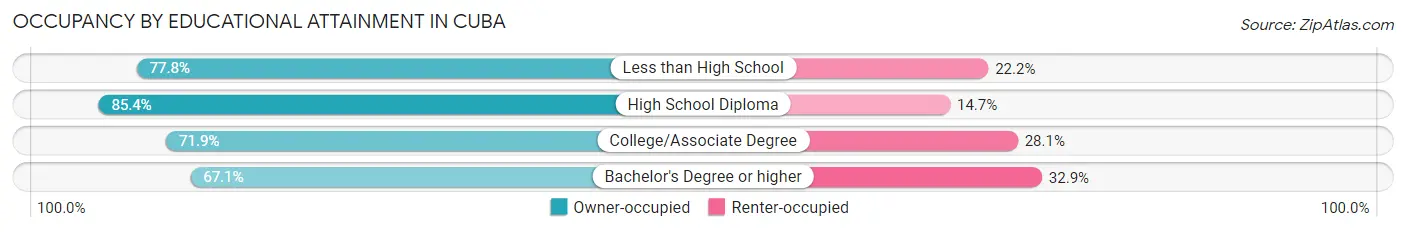
| Household Size | Owner-occupied | Renter-occupied |
| Less than High School | 28 (77.8%) | 8 (22.2%) |
| High School Diploma | 134 (85.4%) | 23 (14.6%) |
| College/Associate Degree | 123 (71.9%) | 48 (28.1%) |
| Bachelor's Degree or higher | 47 (67.1%) | 23 (32.9%) |
Occupancy by Age of Householder in Cuba
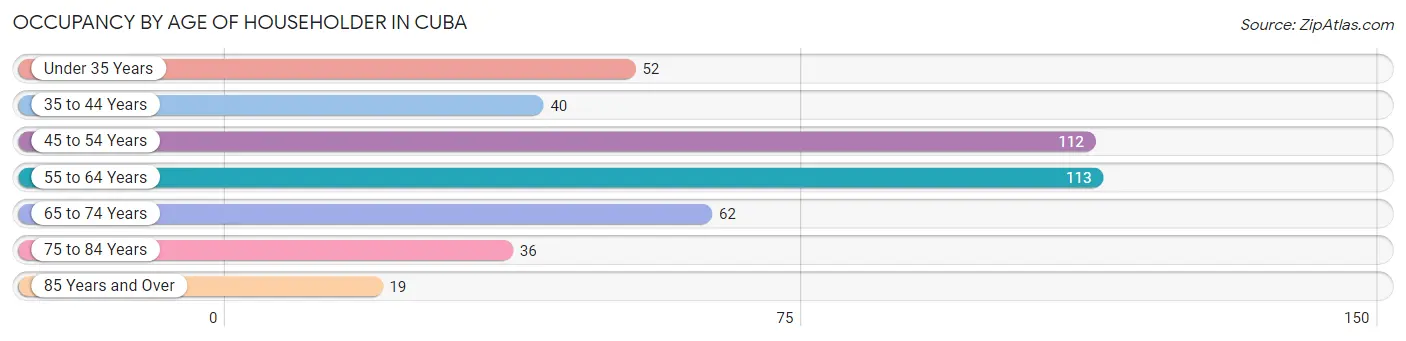
| Age Bracket | # Households | % Households |
| Under 35 Years | 52 | 12.0% |
| 35 to 44 Years | 40 | 9.2% |
| 45 to 54 Years | 112 | 25.8% |
| 55 to 64 Years | 113 | 26.0% |
| 65 to 74 Years | 62 | 14.3% |
| 75 to 84 Years | 36 | 8.3% |
| 85 Years and Over | 19 | 4.4% |
| Total | 434 | 100.0% |
Housing Finances in Cuba
Median Income by Occupancy in Cuba
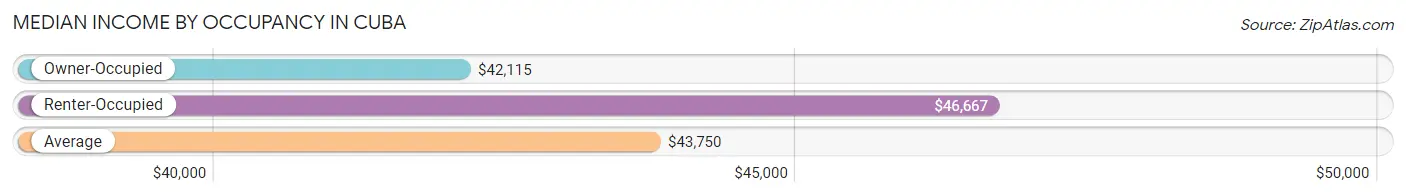
| Occupancy Type | # Households | Median Income |
| Owner-Occupied | 332 (76.5%) | $42,115 |
| Renter-Occupied | 102 (23.5%) | $46,667 |
| Average | 434 (100.0%) | $43,750 |
Occupancy by Householder Income Bracket in Cuba
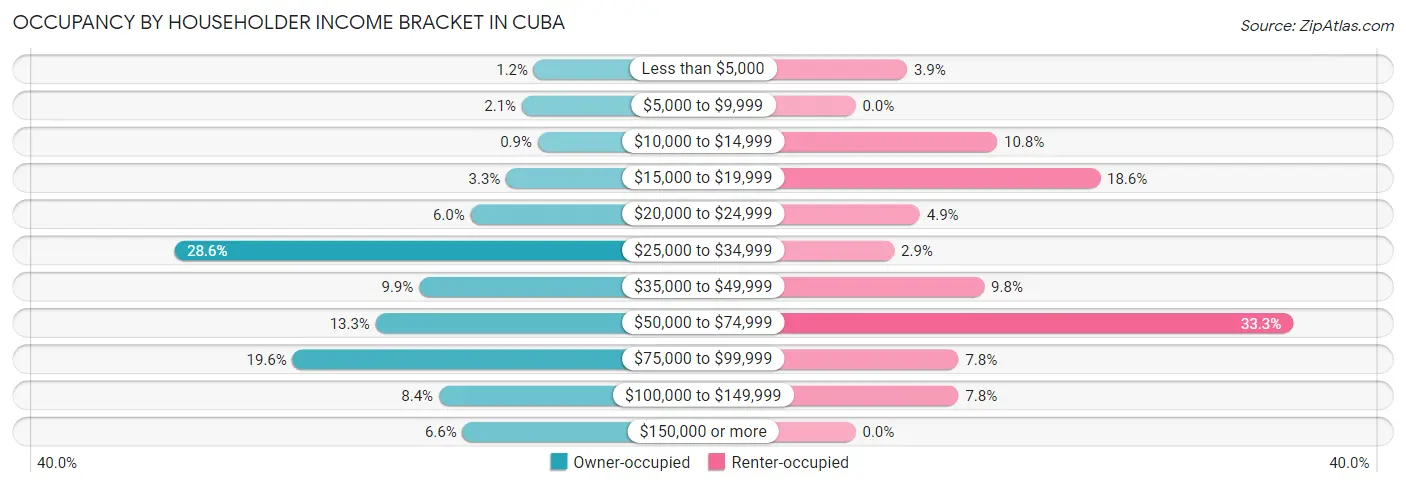
| Income Bracket | Owner-occupied | Renter-occupied |
| Less than $5,000 | 4 (1.2%) | 4 (3.9%) |
| $5,000 to $9,999 | 7 (2.1%) | 0 (0.0%) |
| $10,000 to $14,999 | 3 (0.9%) | 11 (10.8%) |
| $15,000 to $19,999 | 11 (3.3%) | 19 (18.6%) |
| $20,000 to $24,999 | 20 (6.0%) | 5 (4.9%) |
| $25,000 to $34,999 | 95 (28.6%) | 3 (2.9%) |
| $35,000 to $49,999 | 33 (9.9%) | 10 (9.8%) |
| $50,000 to $74,999 | 44 (13.3%) | 34 (33.3%) |
| $75,000 to $99,999 | 65 (19.6%) | 8 (7.8%) |
| $100,000 to $149,999 | 28 (8.4%) | 8 (7.8%) |
| $150,000 or more | 22 (6.6%) | 0 (0.0%) |
| Total | 332 (100.0%) | 102 (100.0%) |
Monthly Housing Cost Tiers in Cuba
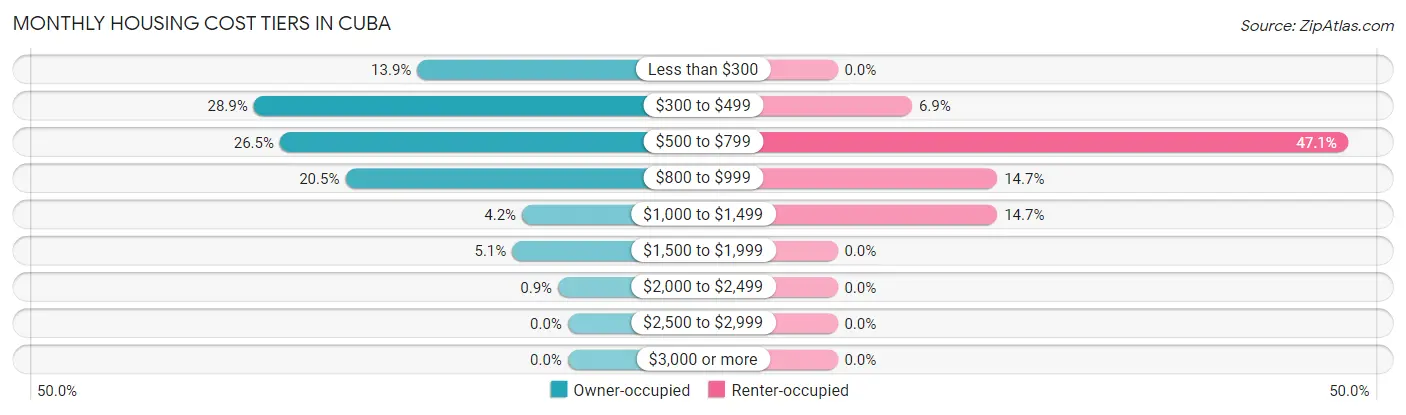
| Monthly Cost | Owner-occupied | Renter-occupied |
| Less than $300 | 46 (13.9%) | 0 (0.0%) |
| $300 to $499 | 96 (28.9%) | 7 (6.9%) |
| $500 to $799 | 88 (26.5%) | 48 (47.1%) |
| $800 to $999 | 68 (20.5%) | 15 (14.7%) |
| $1,000 to $1,499 | 14 (4.2%) | 15 (14.7%) |
| $1,500 to $1,999 | 17 (5.1%) | 0 (0.0%) |
| $2,000 to $2,499 | 3 (0.9%) | 0 (0.0%) |
| $2,500 to $2,999 | 0 (0.0%) | 0 (0.0%) |
| $3,000 or more | 0 (0.0%) | 0 (0.0%) |
| Total | 332 (100.0%) | 102 (100.0%) |
Physical Housing Characteristics in Cuba
Housing Structures in Cuba
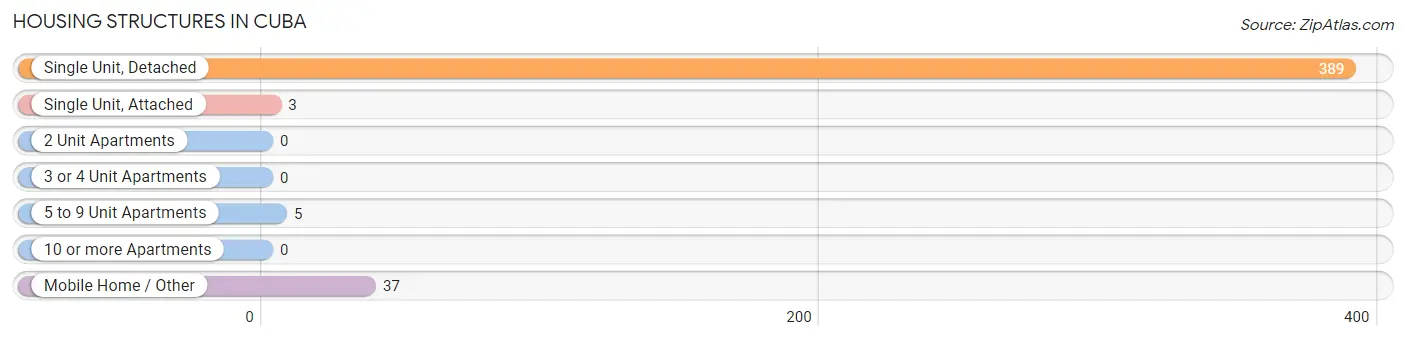
| Structure Type | # Housing Units | % Housing Units |
| Single Unit, Detached | 389 | 89.6% |
| Single Unit, Attached | 3 | 0.7% |
| 2 Unit Apartments | 0 | 0.0% |
| 3 or 4 Unit Apartments | 0 | 0.0% |
| 5 to 9 Unit Apartments | 5 | 1.1% |
| 10 or more Apartments | 0 | 0.0% |
| Mobile Home / Other | 37 | 8.5% |
| Total | 434 | 100.0% |
Housing Structures by Occupancy in Cuba
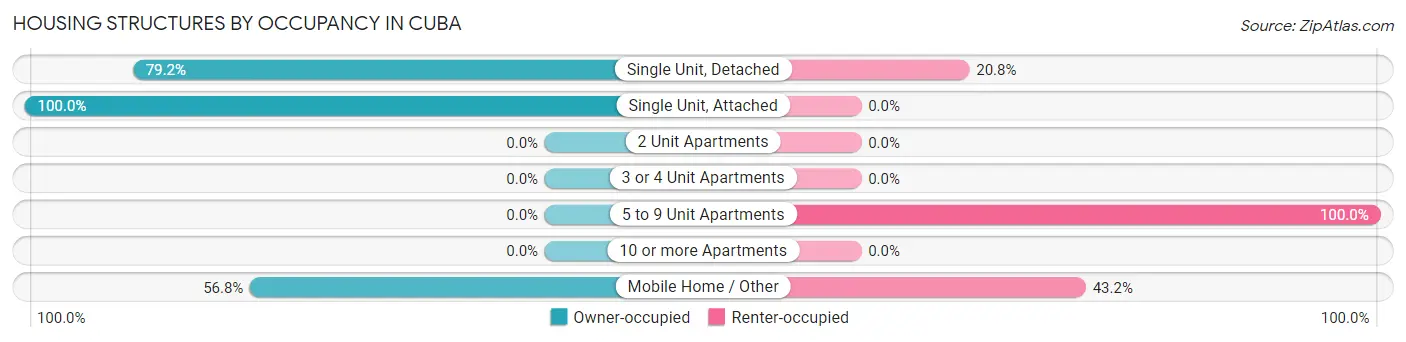
| Structure Type | Owner-occupied | Renter-occupied |
| Single Unit, Detached | 308 (79.2%) | 81 (20.8%) |
| Single Unit, Attached | 3 (100.0%) | 0 (0.0%) |
| 2 Unit Apartments | 0 (0.0%) | 0 (0.0%) |
| 3 or 4 Unit Apartments | 0 (0.0%) | 0 (0.0%) |
| 5 to 9 Unit Apartments | 0 (0.0%) | 5 (100.0%) |
| 10 or more Apartments | 0 (0.0%) | 0 (0.0%) |
| Mobile Home / Other | 21 (56.8%) | 16 (43.2%) |
| Total | 332 (76.5%) | 102 (23.5%) |
Housing Structures by Number of Rooms in Cuba
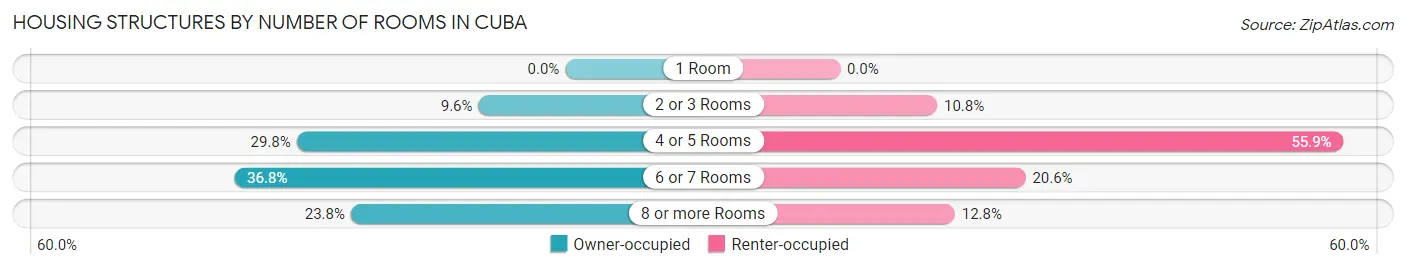
| Number of Rooms | Owner-occupied | Renter-occupied |
| 1 Room | 0 (0.0%) | 0 (0.0%) |
| 2 or 3 Rooms | 32 (9.6%) | 11 (10.8%) |
| 4 or 5 Rooms | 99 (29.8%) | 57 (55.9%) |
| 6 or 7 Rooms | 122 (36.7%) | 21 (20.6%) |
| 8 or more Rooms | 79 (23.8%) | 13 (12.8%) |
| Total | 332 (100.0%) | 102 (100.0%) |
Housing Structure by Heating Type in Cuba
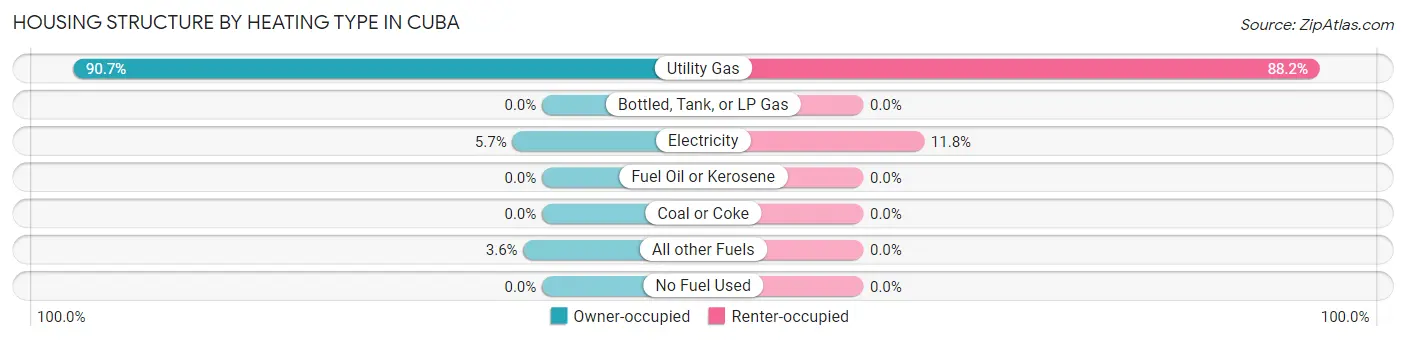
| Heating Type | Owner-occupied | Renter-occupied |
| Utility Gas | 301 (90.7%) | 90 (88.2%) |
| Bottled, Tank, or LP Gas | 0 (0.0%) | 0 (0.0%) |
| Electricity | 19 (5.7%) | 12 (11.8%) |
| Fuel Oil or Kerosene | 0 (0.0%) | 0 (0.0%) |
| Coal or Coke | 0 (0.0%) | 0 (0.0%) |
| All other Fuels | 12 (3.6%) | 0 (0.0%) |
| No Fuel Used | 0 (0.0%) | 0 (0.0%) |
| Total | 332 (100.0%) | 102 (100.0%) |
Household Vehicle Usage in Cuba
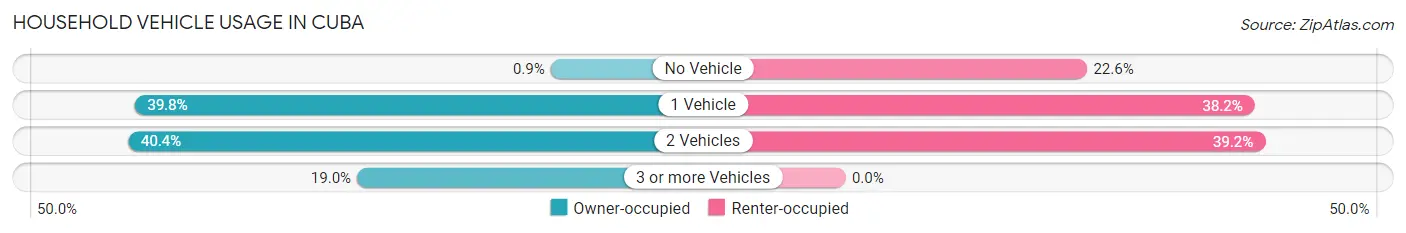
| Vehicles per Household | Owner-occupied | Renter-occupied |
| No Vehicle | 3 (0.9%) | 23 (22.6%) |
| 1 Vehicle | 132 (39.8%) | 39 (38.2%) |
| 2 Vehicles | 134 (40.4%) | 40 (39.2%) |
| 3 or more Vehicles | 63 (19.0%) | 0 (0.0%) |
| Total | 332 (100.0%) | 102 (100.0%) |
Real Estate & Mortgages in Cuba
Real Estate and Mortgage Overview in Cuba
| Characteristic | Without Mortgage | With Mortgage |
| Housing Units | 208 | 124 |
| Median Property Value | $52,300 | $75,000 |
| Median Household Income | $36,250 | $13 |
| Monthly Housing Costs | $415 | $0 |
| Real Estate Taxes | $1,500 | $3 |
Property Value by Mortgage Status in Cuba
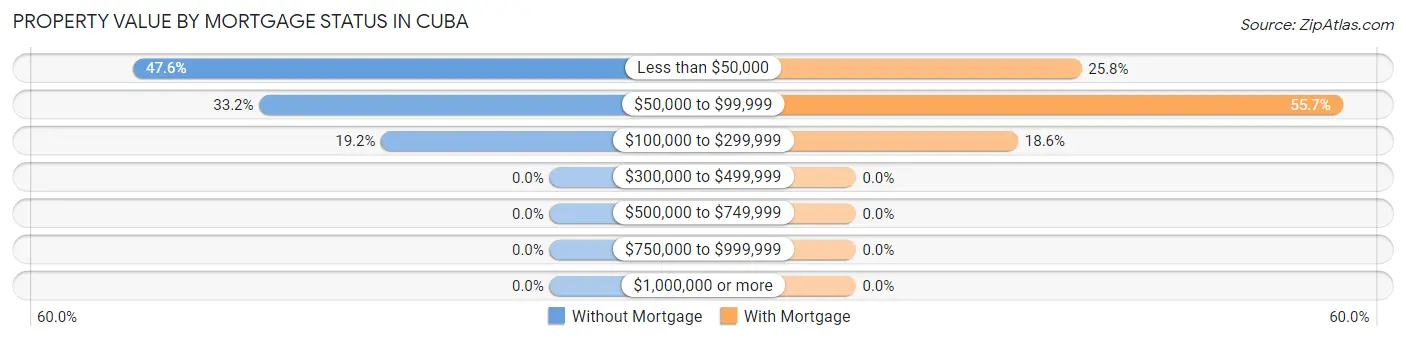
| Property Value | Without Mortgage | With Mortgage |
| Less than $50,000 | 99 (47.6%) | 32 (25.8%) |
| $50,000 to $99,999 | 69 (33.2%) | 69 (55.6%) |
| $100,000 to $299,999 | 40 (19.2%) | 23 (18.5%) |
| $300,000 to $499,999 | 0 (0.0%) | 0 (0.0%) |
| $500,000 to $749,999 | 0 (0.0%) | 0 (0.0%) |
| $750,000 to $999,999 | 0 (0.0%) | 0 (0.0%) |
| $1,000,000 or more | 0 (0.0%) | 0 (0.0%) |
| Total | 208 (100.0%) | 124 (100.0%) |
Household Income by Mortgage Status in Cuba
| Household Income | Without Mortgage | With Mortgage |
| Less than $10,000 | 4 (1.9%) | 10 (8.1%) |
| $10,000 to $24,999 | 27 (13.0%) | 7 (5.7%) |
| $25,000 to $34,999 | 71 (34.1%) | 7 (5.7%) |
| $35,000 to $49,999 | 27 (13.0%) | 24 (19.4%) |
| $50,000 to $74,999 | 32 (15.4%) | 6 (4.8%) |
| $75,000 to $99,999 | 26 (12.5%) | 12 (9.7%) |
| $100,000 to $149,999 | 12 (5.8%) | 39 (31.5%) |
| $150,000 or more | 9 (4.3%) | 16 (12.9%) |
| Total | 208 (100.0%) | 124 (100.0%) |
Property Value to Household Income Ratio in Cuba
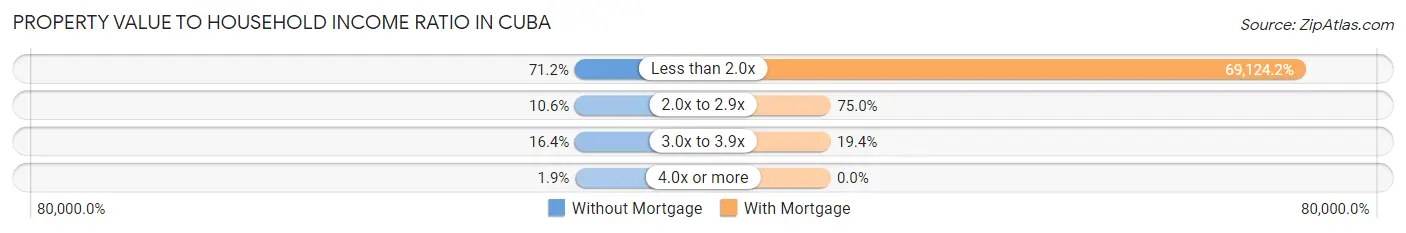
| Value-to-Income Ratio | Without Mortgage | With Mortgage |
| Less than 2.0x | 148 (71.2%) | 85,714 (69,124.2%) |
| 2.0x to 2.9x | 22 (10.6%) | 93 (75.0%) |
| 3.0x to 3.9x | 34 (16.4%) | 24 (19.4%) |
| 4.0x or more | 4 (1.9%) | 0 (0.0%) |
| Total | 208 (100.0%) | 124 (100.0%) |
Real Estate Taxes by Mortgage Status in Cuba
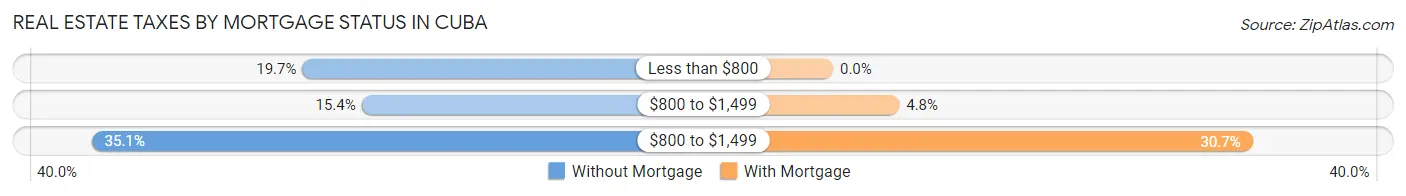
| Property Taxes | Without Mortgage | With Mortgage |
| Less than $800 | 41 (19.7%) | 0 (0.0%) |
| $800 to $1,499 | 32 (15.4%) | 6 (4.8%) |
| $800 to $1,499 | 73 (35.1%) | 38 (30.6%) |
| Total | 208 (100.0%) | 124 (100.0%) |
Health & Disability in Cuba
Health Insurance Coverage by Age in Cuba
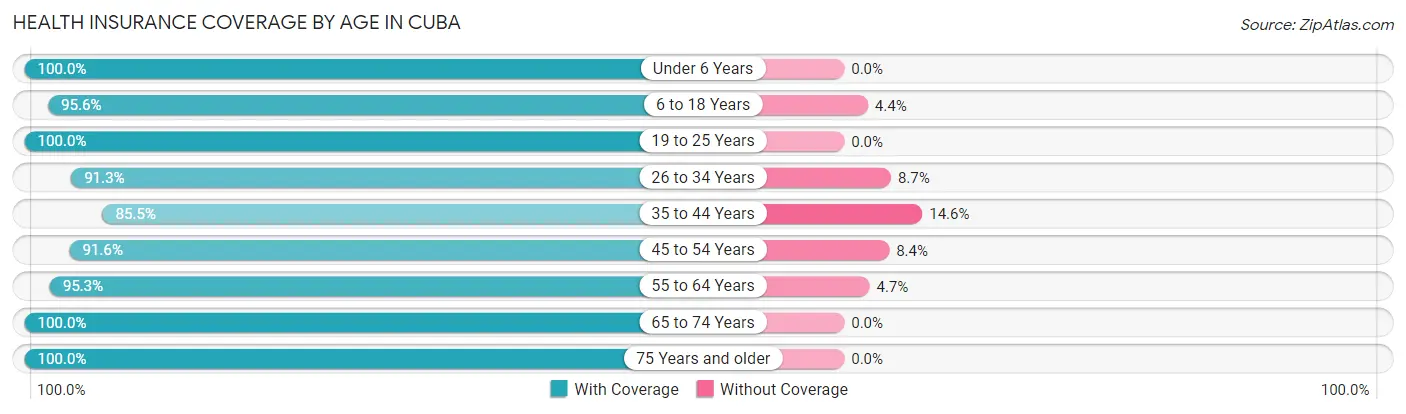
| Age Bracket | With Coverage | Without Coverage |
| Under 6 Years | 36 (100.0%) | 0 (0.0%) |
| 6 to 18 Years | 87 (95.6%) | 4 (4.4%) |
| 19 to 25 Years | 80 (100.0%) | 0 (0.0%) |
| 26 to 34 Years | 63 (91.3%) | 6 (8.7%) |
| 35 to 44 Years | 47 (85.5%) | 8 (14.5%) |
| 45 to 54 Years | 164 (91.6%) | 15 (8.4%) |
| 55 to 64 Years | 162 (95.3%) | 8 (4.7%) |
| 65 to 74 Years | 99 (100.0%) | 0 (0.0%) |
| 75 Years and older | 76 (100.0%) | 0 (0.0%) |
| Total | 814 (95.2%) | 41 (4.8%) |
Health Insurance Coverage by Citizenship Status in Cuba

| Citizenship Status | With Coverage | Without Coverage |
| Native Born | 36 (100.0%) | 0 (0.0%) |
| Foreign Born, Citizen | 87 (95.6%) | 4 (4.4%) |
| Foreign Born, not a Citizen | 80 (100.0%) | 0 (0.0%) |
Health Insurance Coverage by Household Income in Cuba
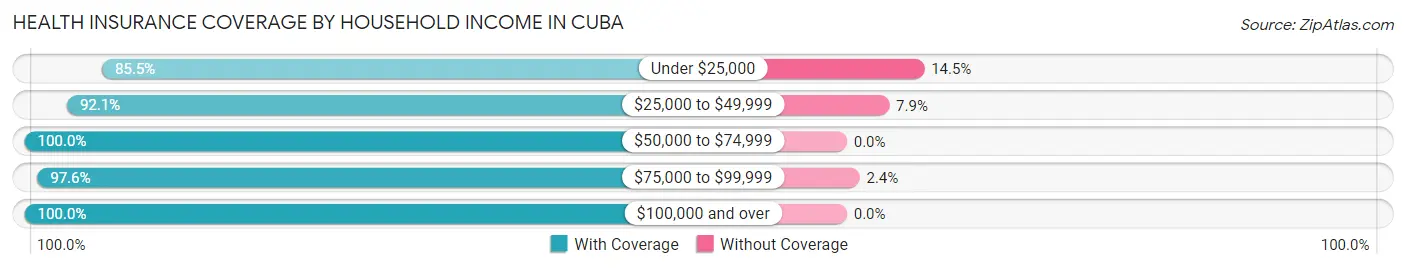
| Household Income | With Coverage | Without Coverage |
| Under $25,000 | 112 (85.5%) | 19 (14.5%) |
| $25,000 to $49,999 | 197 (92.1%) | 17 (7.9%) |
| $50,000 to $74,999 | 137 (100.0%) | 0 (0.0%) |
| $75,000 to $99,999 | 204 (97.6%) | 5 (2.4%) |
| $100,000 and over | 164 (100.0%) | 0 (0.0%) |
Public vs Private Health Insurance Coverage by Age in Cuba
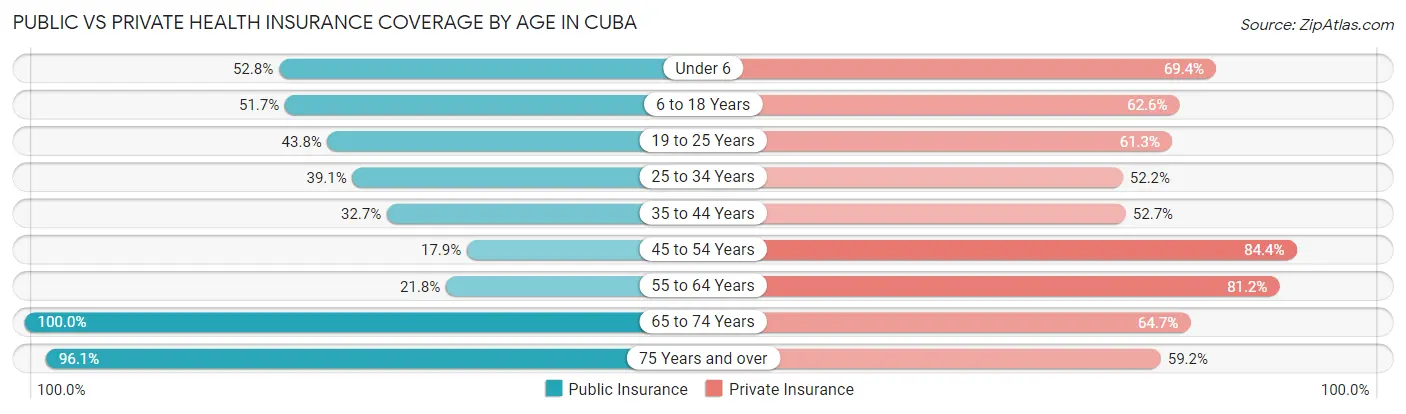
| Age Bracket | Public Insurance | Private Insurance |
| Under 6 | 19 (52.8%) | 25 (69.4%) |
| 6 to 18 Years | 47 (51.6%) | 57 (62.6%) |
| 19 to 25 Years | 35 (43.8%) | 49 (61.3%) |
| 25 to 34 Years | 27 (39.1%) | 36 (52.2%) |
| 35 to 44 Years | 18 (32.7%) | 29 (52.7%) |
| 45 to 54 Years | 32 (17.9%) | 151 (84.4%) |
| 55 to 64 Years | 37 (21.8%) | 138 (81.2%) |
| 65 to 74 Years | 99 (100.0%) | 64 (64.6%) |
| 75 Years and over | 73 (96.1%) | 45 (59.2%) |
| Total | 387 (45.3%) | 594 (69.5%) |
Disability Status by Sex by Age in Cuba
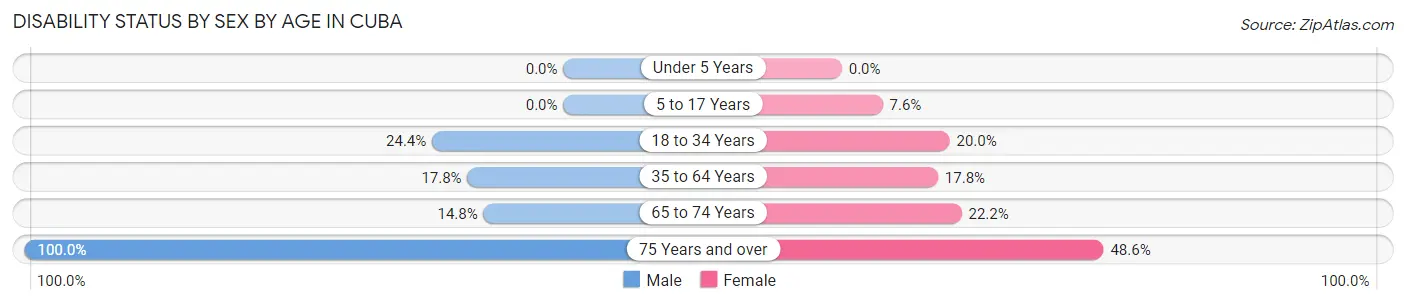
| Age Bracket | Male | Female |
| Under 5 Years | 0 (0.0%) | 0 (0.0%) |
| 5 to 17 Years | 0 (0.0%) | 5 (7.6%) |
| 18 to 34 Years | 19 (24.4%) | 16 (20.0%) |
| 35 to 64 Years | 34 (17.8%) | 38 (17.8%) |
| 65 to 74 Years | 8 (14.8%) | 10 (22.2%) |
| 75 Years and over | 41 (100.0%) | 17 (48.6%) |
Disability Class by Sex by Age in Cuba
Disability Class: Hearing Difficulty
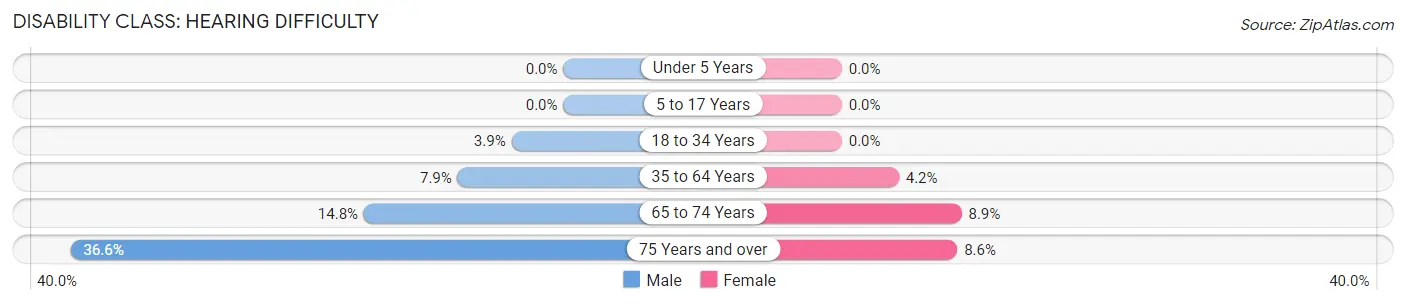
| Age Bracket | Male | Female |
| Under 5 Years | 0 (0.0%) | 0 (0.0%) |
| 5 to 17 Years | 0 (0.0%) | 0 (0.0%) |
| 18 to 34 Years | 3 (3.8%) | 0 (0.0%) |
| 35 to 64 Years | 15 (7.9%) | 9 (4.2%) |
| 65 to 74 Years | 8 (14.8%) | 4 (8.9%) |
| 75 Years and over | 15 (36.6%) | 3 (8.6%) |
Disability Class: Vision Difficulty
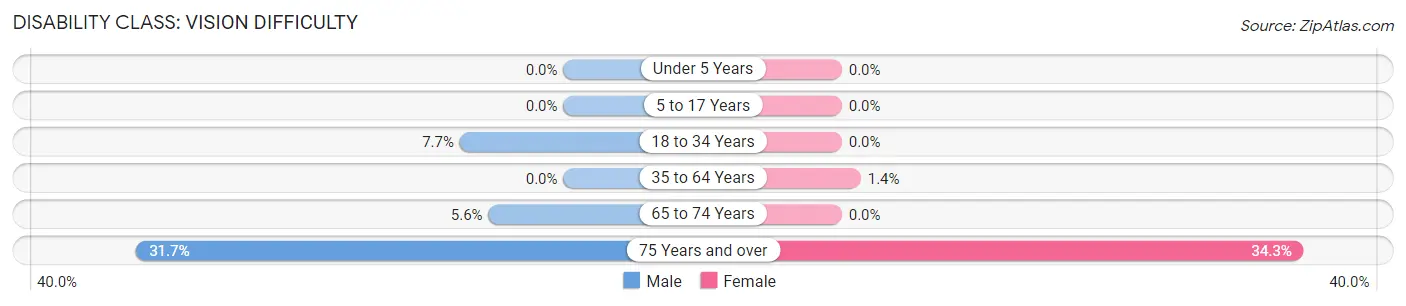
| Age Bracket | Male | Female |
| Under 5 Years | 0 (0.0%) | 0 (0.0%) |
| 5 to 17 Years | 0 (0.0%) | 0 (0.0%) |
| 18 to 34 Years | 6 (7.7%) | 0 (0.0%) |
| 35 to 64 Years | 0 (0.0%) | 3 (1.4%) |
| 65 to 74 Years | 3 (5.6%) | 0 (0.0%) |
| 75 Years and over | 13 (31.7%) | 12 (34.3%) |
Disability Class: Cognitive Difficulty
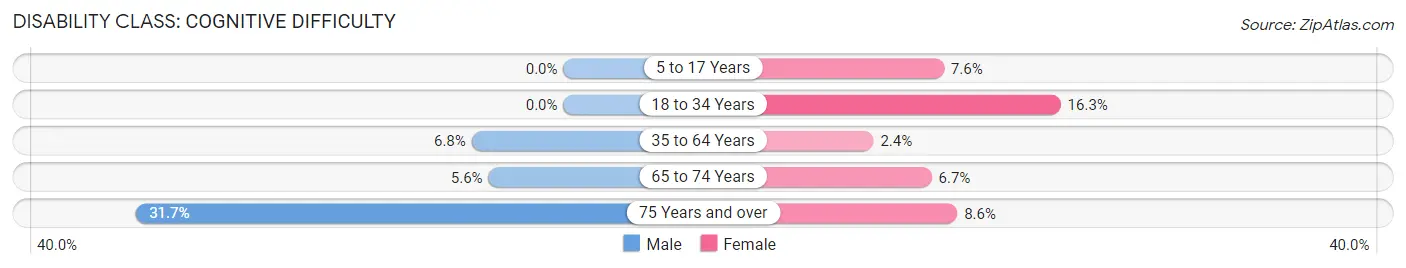
| Age Bracket | Male | Female |
| 5 to 17 Years | 0 (0.0%) | 5 (7.6%) |
| 18 to 34 Years | 0 (0.0%) | 13 (16.3%) |
| 35 to 64 Years | 13 (6.8%) | 5 (2.4%) |
| 65 to 74 Years | 3 (5.6%) | 3 (6.7%) |
| 75 Years and over | 13 (31.7%) | 3 (8.6%) |
Disability Class: Ambulatory Difficulty
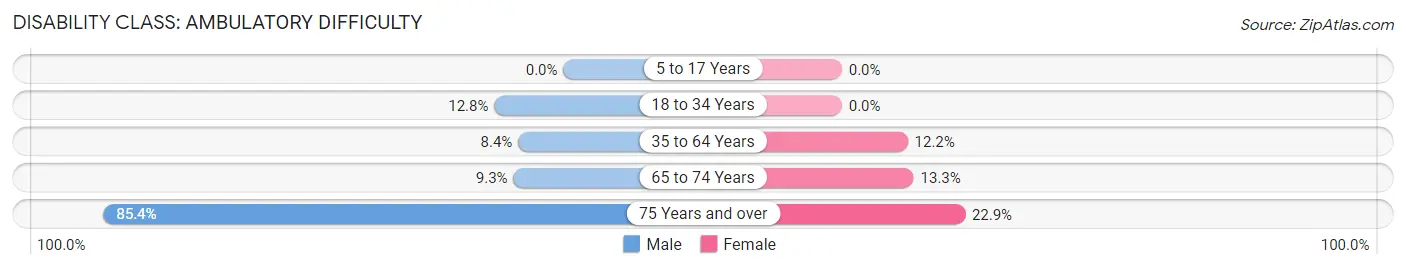
| Age Bracket | Male | Female |
| 5 to 17 Years | 0 (0.0%) | 0 (0.0%) |
| 18 to 34 Years | 10 (12.8%) | 0 (0.0%) |
| 35 to 64 Years | 16 (8.4%) | 26 (12.2%) |
| 65 to 74 Years | 5 (9.3%) | 6 (13.3%) |
| 75 Years and over | 35 (85.4%) | 8 (22.9%) |
Disability Class: Self-Care Difficulty
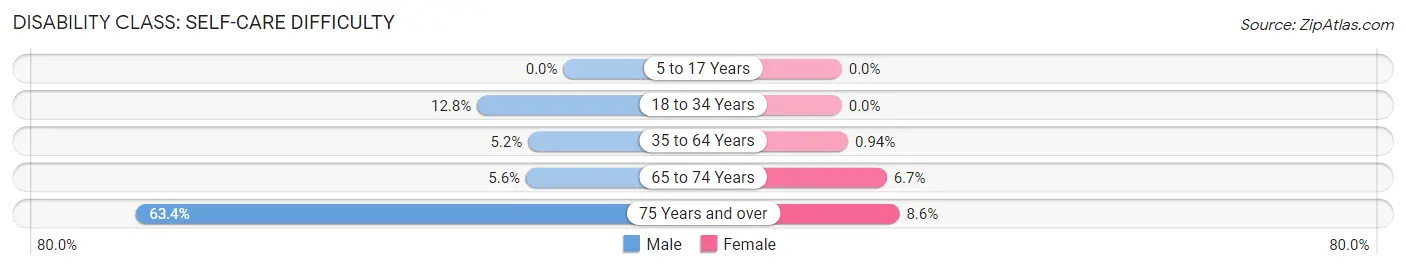
| Age Bracket | Male | Female |
| 5 to 17 Years | 0 (0.0%) | 0 (0.0%) |
| 18 to 34 Years | 10 (12.8%) | 0 (0.0%) |
| 35 to 64 Years | 10 (5.2%) | 2 (0.9%) |
| 65 to 74 Years | 3 (5.6%) | 3 (6.7%) |
| 75 Years and over | 26 (63.4%) | 3 (8.6%) |
Technology Access in Cuba
Computing Device Access in Cuba
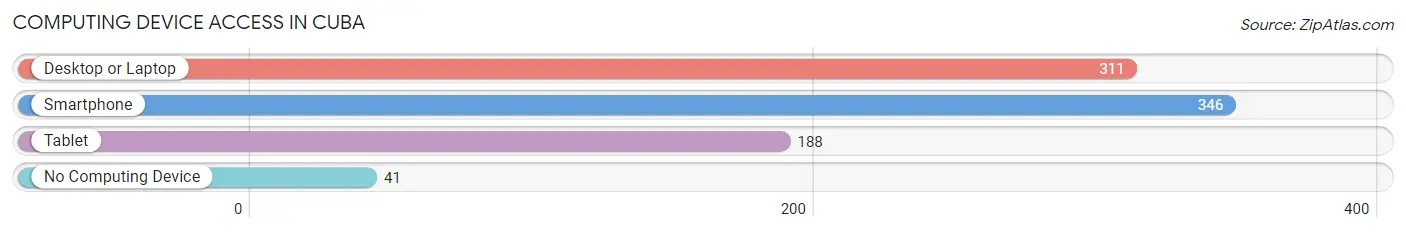
| Device Type | # Households | % Households |
| Desktop or Laptop | 311 | 71.7% |
| Smartphone | 346 | 79.7% |
| Tablet | 188 | 43.3% |
| No Computing Device | 41 | 9.5% |
| Total | 434 | 100.0% |
Internet Access in Cuba
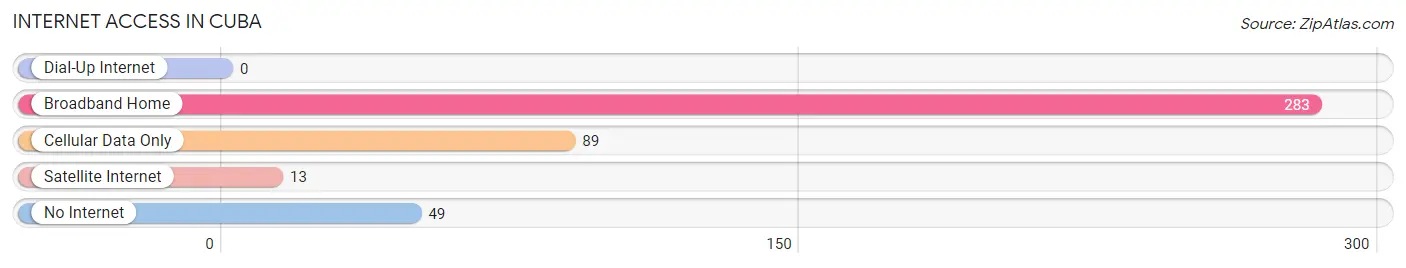
| Internet Type | # Households | % Households |
| Dial-Up Internet | 0 | 0.0% |
| Broadband Home | 283 | 65.2% |
| Cellular Data Only | 89 | 20.5% |
| Satellite Internet | 13 | 3.0% |
| No Internet | 49 | 11.3% |
| Total | 434 | 100.0% |
Cuba Summary
Cuba, Illinois is a small city located in Fulton County, Illinois. It is situated on the banks of the Spoon River and is home to a population of approximately 2,000 people. The city is known for its rich history, diverse geography, and vibrant economy.
History
Cuba, Illinois was founded in 1836 by a group of settlers from New York. The city was named after the island of Cuba, which was a popular destination for many of the settlers. The city was incorporated in 1854 and quickly became a hub for trade and commerce. The city was home to a variety of businesses, including a flour mill, a sawmill, a brickyard, and a blacksmith shop.
In the late 19th century, Cuba, Illinois was a major stop on the Chicago, Burlington & Quincy Railroad. The railroad brought many new people to the city, and the population grew rapidly. The city was also home to a variety of industries, including a cigar factory, a furniture factory, and a canning factory.
Geography
Cuba, Illinois is located in the heart of the Midwest. The city is situated on the banks of the Spoon River, which is a tributary of the Illinois River. The city is surrounded by rolling hills and farmland, and is home to a variety of wildlife, including deer, foxes, and wild turkeys.
The city is located approximately 50 miles from the state capital of Springfield, and is within a two-hour drive of Chicago. The city is also located near several major highways, including Interstate 55 and U.S. Route 24.
Economy
Cuba, Illinois is home to a vibrant economy. The city is home to a variety of businesses, including a grocery store, a hardware store, a pharmacy, and a variety of restaurants. The city is also home to a variety of manufacturing companies, including a furniture factory, a canning factory, and a cigar factory.
The city is also home to a variety of agricultural businesses, including a dairy farm, a hog farm, and a poultry farm. The city is also home to a variety of service businesses, including a bank, a post office, and a variety of medical and dental offices.
Demographics
As of the 2010 census, the population of Cuba, Illinois was 2,000. The city is predominantly white, with approximately 95% of the population identifying as Caucasian. The city is also home to a small Hispanic population, with approximately 5% of the population identifying as Hispanic or Latino.
The median household income in Cuba, Illinois is approximately $45,000, and the median home value is approximately $90,000. The city is home to a variety of educational institutions, including a public elementary school, a public middle school, and a public high school.
Conclusion
Cuba, Illinois is a small city located in Fulton County, Illinois. The city is known for its rich history, diverse geography, and vibrant economy. The city is home to a variety of businesses, including a grocery store, a hardware store, a pharmacy, and a variety of restaurants. The city is also home to a variety of manufacturing companies, including a furniture factory, a canning factory, and a cigar factory. The city is predominantly white, with approximately 95% of the population identifying as Caucasian. The median household income in Cuba, Illinois is approximately $45,000, and the median home value is approximately $90,000.
Common Questions
What is Per Capita Income in Cuba?
Per Capita income in Cuba is $32,883.
What is the Median Family Income in Cuba?
Median Family Income in Cuba is $73,750.
What is the Median Household income in Cuba?
Median Household Income in Cuba is $43,750.
What is Income or Wage Gap in Cuba?
Income or Wage Gap in Cuba is 28.1%.
Women in Cuba earn 71.9 cents for every dollar earned by a man.
What is Inequality or Gini Index in Cuba?
Inequality or Gini Index in Cuba is 0.45.
What is the Total Population of Cuba?
Total Population of Cuba is 903.
What is the Total Male Population of Cuba?
Total Male Population of Cuba is 436.
What is the Total Female Population of Cuba?
Total Female Population of Cuba is 467.
What is the Ratio of Males per 100 Females in Cuba?
There are 93.36 Males per 100 Females in Cuba.
What is the Ratio of Females per 100 Males in Cuba?
There are 107.11 Females per 100 Males in Cuba.
What is the Median Population Age in Cuba?
Median Population Age in Cuba is 50.9 Years.
What is the Average Family Size in Cuba
Average Family Size in Cuba is 2.9 People.
What is the Average Household Size in Cuba
Average Household Size in Cuba is 2.0 People.
How Large is the Labor Force in Cuba?
There are 436 People in the Labor Forcein in Cuba.
What is the Percentage of People in the Labor Force in Cuba?
54.7% of People are in the Labor Force in Cuba.
What is the Unemployment Rate in Cuba?
Unemployment Rate in Cuba is 4.1%.