Creal Springs, IL Map & Demographics
Creal Springs Map
Creal Springs Overview
$25,640
PER CAPITA INCOME
$66,042
AVG FAMILY INCOME
$55,658
AVG HOUSEHOLD INCOME
0.43
INEQUALITY / GINI INDEX
425
TOTAL POPULATION
206
MALE POPULATION
219
FEMALE POPULATION
94.06
MALES / 100 FEMALES
106.31
FEMALES / 100 MALES
34.3
MEDIAN AGE
3.0
AVG FAMILY SIZE
2.4
AVG HOUSEHOLD SIZE
172
LABOR FORCE [ PEOPLE ]
55.5%
PERCENT IN LABOR FORCE
10.5%
UNEMPLOYMENT RATE
Creal Springs Zip Codes
Creal Springs Area Codes
Income in Creal Springs
Income Overview in Creal Springs
Per Capita Income in Creal Springs is $25,640, while median incomes of families and households are $66,042 and $55,658 respectively.
| Characteristic | Number | Measure |
| Per Capita Income | 425 | $25,640 |
| Median Family Income | 110 | $66,042 |
| Mean Family Income | 110 | $77,109 |
| Median Household Income | 180 | $55,658 |
| Mean Household Income | 180 | $62,875 |
| Income Deficit | 110 | $0 |
| Wage / Income Gap (%) | 425 | 0.00% |
| Wage / Income Gap ($) | 425 | 100.00¢ per $1 |
| Gini / Inequality Index | 425 | 0.43 |
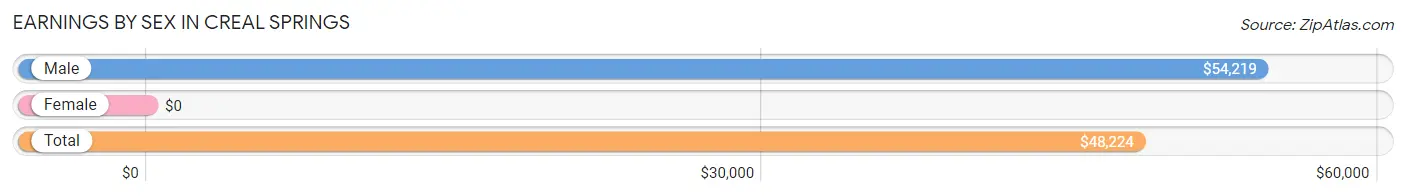
Earnings by Sex in Creal Springs
| Sex | Number | Average Earnings |
| Male | 101 (54.0%) | $54,219 |
| Female | 86 (46.0%) | $0 |
| Total | 187 (100.0%) | $48,224 |
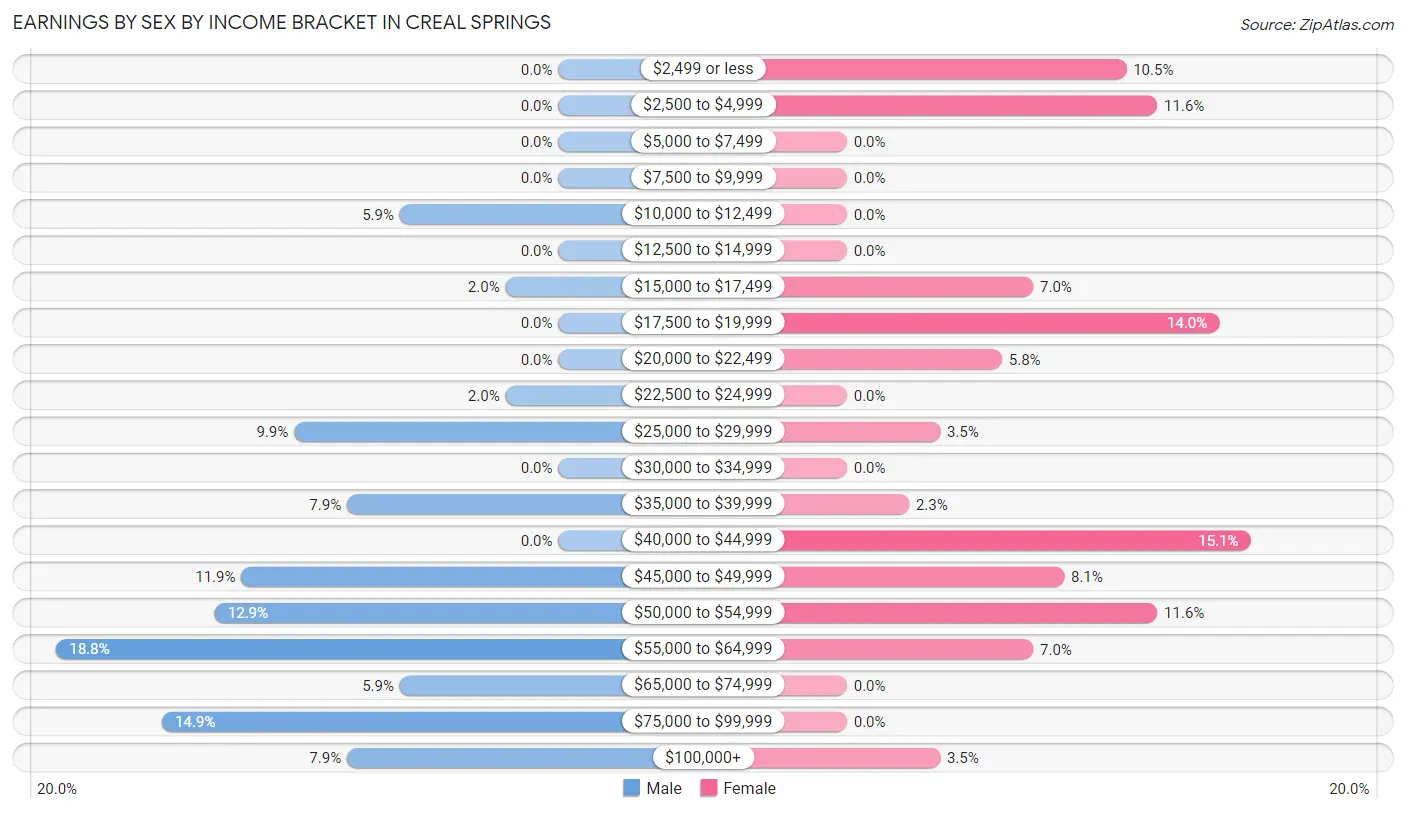
Earnings by Sex by Income Bracket in Creal Springs
The most common earnings brackets in Creal Springs are $55,000 to $64,999 for men (19 | 18.8%) and $40,000 to $44,999 for women (13 | 15.1%).
| Income | Male | Female |
| $2,499 or less | 0 (0.0%) | 9 (10.5%) |
| $2,500 to $4,999 | 0 (0.0%) | 10 (11.6%) |
| $5,000 to $7,499 | 0 (0.0%) | 0 (0.0%) |
| $7,500 to $9,999 | 0 (0.0%) | 0 (0.0%) |
| $10,000 to $12,499 | 6 (5.9%) | 0 (0.0%) |
| $12,500 to $14,999 | 0 (0.0%) | 0 (0.0%) |
| $15,000 to $17,499 | 2 (2.0%) | 6 (7.0%) |
| $17,500 to $19,999 | 0 (0.0%) | 12 (14.0%) |
| $20,000 to $22,499 | 0 (0.0%) | 5 (5.8%) |
| $22,500 to $24,999 | 2 (2.0%) | 0 (0.0%) |
| $25,000 to $29,999 | 10 (9.9%) | 3 (3.5%) |
| $30,000 to $34,999 | 0 (0.0%) | 0 (0.0%) |
| $35,000 to $39,999 | 8 (7.9%) | 2 (2.3%) |
| $40,000 to $44,999 | 0 (0.0%) | 13 (15.1%) |
| $45,000 to $49,999 | 12 (11.9%) | 7 (8.1%) |
| $50,000 to $54,999 | 13 (12.9%) | 10 (11.6%) |
| $55,000 to $64,999 | 19 (18.8%) | 6 (7.0%) |
| $65,000 to $74,999 | 6 (5.9%) | 0 (0.0%) |
| $75,000 to $99,999 | 15 (14.8%) | 0 (0.0%) |
| $100,000+ | 8 (7.9%) | 3 (3.5%) |
| Total | 101 (100.0%) | 86 (100.0%) |
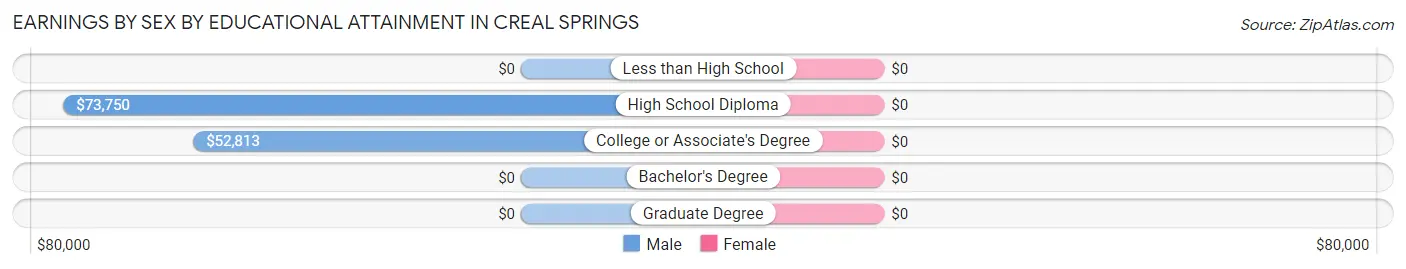
Earnings by Sex by Educational Attainment in Creal Springs
| Educational Attainment | Male Income | Female Income |
| Less than High School | - | - |
| High School Diploma | $73,750 | $0 |
| College or Associate's Degree | $52,813 | $0 |
| Bachelor's Degree | - | - |
| Graduate Degree | - | - |
| Total | $55,329 | $0 |
Family Income in Creal Springs
Family Income Brackets in Creal Springs
According to the Creal Springs family income data, there are 23 families falling into the $100,000 to $149,999 income range, which is the most common income bracket and makes up 20.9% of all families.
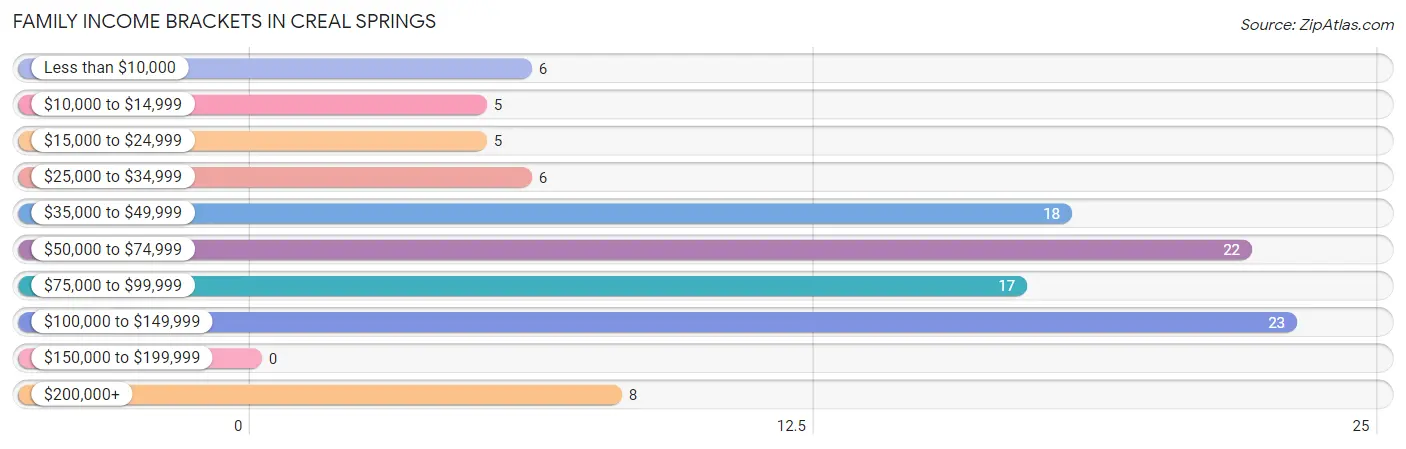
| Income Bracket | # Families | % Families |
| Less than $10,000 | 6 | 5.5% |
| $10,000 to $14,999 | 5 | 4.5% |
| $15,000 to $24,999 | 5 | 4.5% |
| $25,000 to $34,999 | 6 | 5.5% |
| $35,000 to $49,999 | 18 | 16.4% |
| $50,000 to $74,999 | 22 | 20.0% |
| $75,000 to $99,999 | 17 | 15.5% |
| $100,000 to $149,999 | 23 | 20.9% |
| $150,000 to $199,999 | 0 | 0.0% |
| $200,000+ | 8 | 7.3% |
Family Income by Famaliy Size in Creal Springs
2-person families (43 | 39.1%) account for the highest median family income in Creal Springs with $55,875 per family, while 2-person families (43 | 39.1%) have the highest median income of $27,938 per family member.
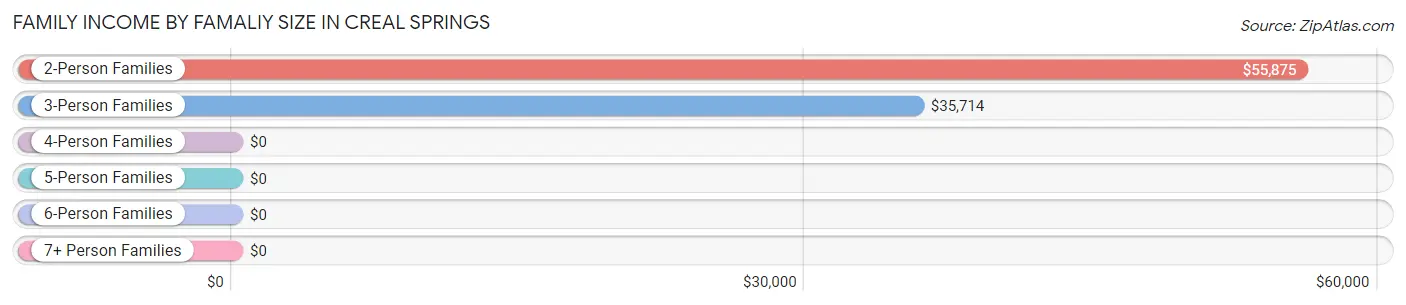
| Income Bracket | # Families | Median Income |
| 2-Person Families | 43 (39.1%) | $55,875 |
| 3-Person Families | 20 (18.2%) | $35,714 |
| 4-Person Families | 29 (26.4%) | $0 |
| 5-Person Families | 18 (16.4%) | $0 |
| 6-Person Families | 0 (0.0%) | $0 |
| 7+ Person Families | 0 (0.0%) | $0 |
| Total | 110 (100.0%) | $66,042 |
Family Income by Number of Earners in Creal Springs
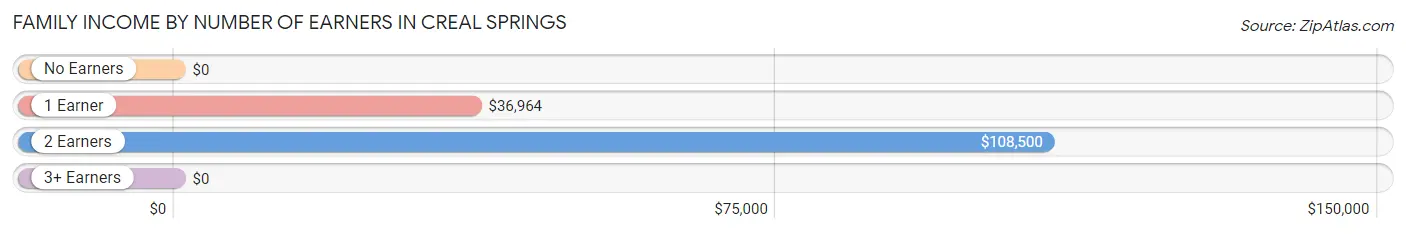
| Number of Earners | # Families | Median Income |
| No Earners | 11 (10.0%) | $0 |
| 1 Earner | 47 (42.7%) | $36,964 |
| 2 Earners | 52 (47.3%) | $108,500 |
| 3+ Earners | 0 (0.0%) | $0 |
| Total | 110 (100.0%) | $66,042 |
Household Income in Creal Springs
Household Income Brackets in Creal Springs
With 39 households falling in the category, the $50,000 to $74,999 income range is the most frequent in Creal Springs, accounting for 21.7% of all households.
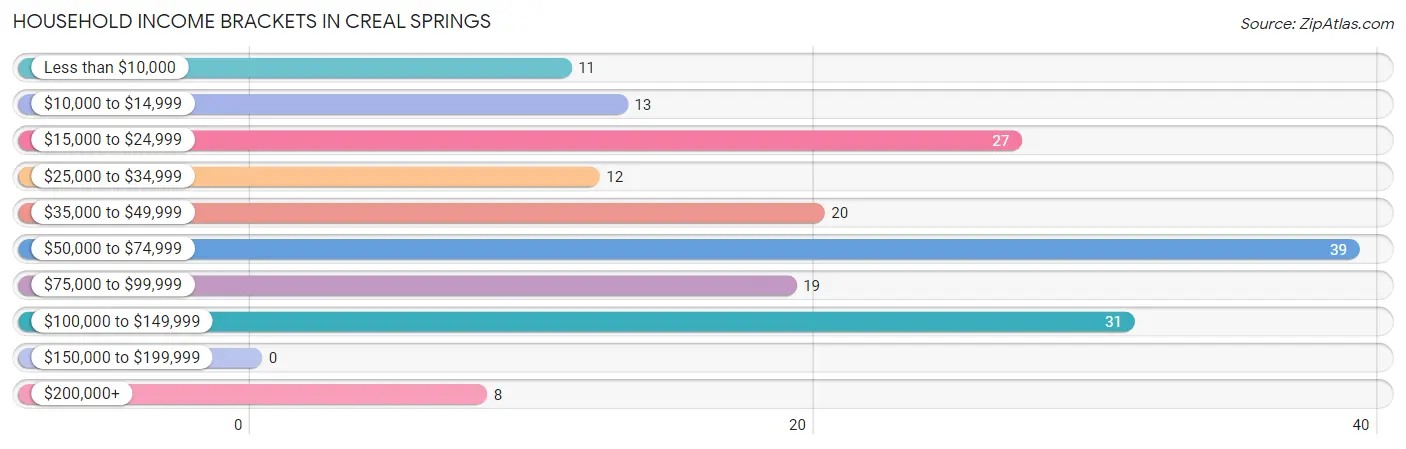
| Income Bracket | # Households | % Households |
| Less than $10,000 | 11 | 6.1% |
| $10,000 to $14,999 | 13 | 7.2% |
| $15,000 to $24,999 | 27 | 15.0% |
| $25,000 to $34,999 | 12 | 6.7% |
| $35,000 to $49,999 | 20 | 11.1% |
| $50,000 to $74,999 | 39 | 21.7% |
| $75,000 to $99,999 | 19 | 10.6% |
| $100,000 to $149,999 | 31 | 17.2% |
| $150,000 to $199,999 | 0 | 0.0% |
| $200,000+ | 8 | 4.4% |
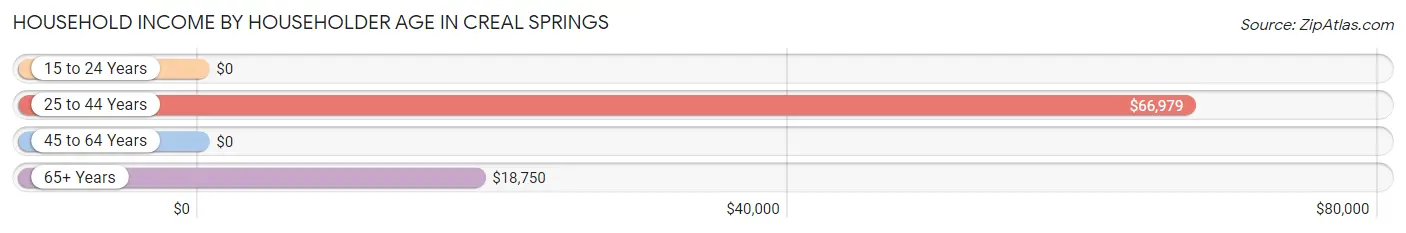
Household Income by Householder Age in Creal Springs
The median household income in Creal Springs is $55,658, with the highest median household income of $66,979 found in the 25 to 44 years age bracket for the primary householder. A total of 93 households (51.7%) fall into this category.
| Income Bracket | # Households | Median Income |
| 15 to 24 Years | 0 (0.0%) | $0 |
| 25 to 44 Years | 93 (51.7%) | $66,979 |
| 45 to 64 Years | 44 (24.4%) | $0 |
| 65+ Years | 43 (23.9%) | $18,750 |
| Total | 180 (100.0%) | $55,658 |
Poverty in Creal Springs
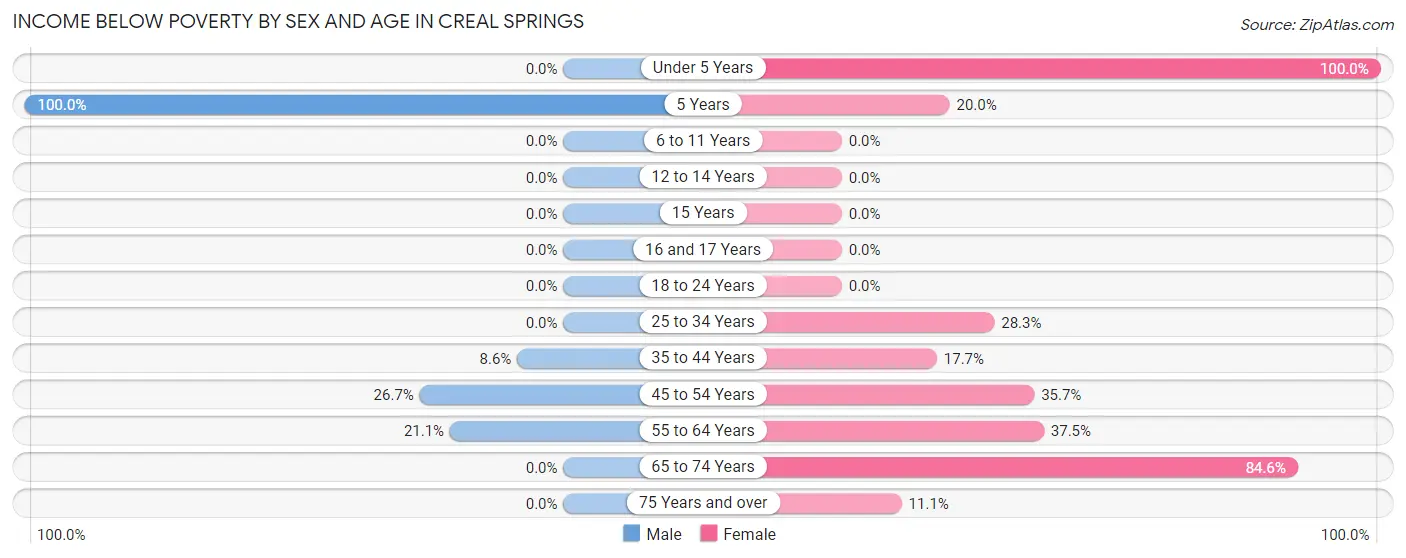
Income Below Poverty by Sex and Age in Creal Springs
With 6.3% poverty level for males and 23.7% for females among the residents of Creal Springs, 5 year old males and under 5 year old females are the most vulnerable to poverty, with 2 males (100.0%) and 1 females (100.0%) in their respective age groups living below the poverty level.
| Age Bracket | Male | Female |
| Under 5 Years | 0 (0.0%) | 1 (100.0%) |
| 5 Years | 2 (100.0%) | 3 (20.0%) |
| 6 to 11 Years | 0 (0.0%) | 0 (0.0%) |
| 12 to 14 Years | 0 (0.0%) | 0 (0.0%) |
| 15 Years | 0 (0.0%) | 0 (0.0%) |
| 16 and 17 Years | 0 (0.0%) | 0 (0.0%) |
| 18 to 24 Years | 0 (0.0%) | 0 (0.0%) |
| 25 to 34 Years | 0 (0.0%) | 15 (28.3%) |
| 35 to 44 Years | 3 (8.6%) | 6 (17.6%) |
| 45 to 54 Years | 4 (26.7%) | 5 (35.7%) |
| 55 to 64 Years | 4 (21.0%) | 9 (37.5%) |
| 65 to 74 Years | 0 (0.0%) | 11 (84.6%) |
| 75 Years and over | 0 (0.0%) | 2 (11.1%) |
| Total | 13 (6.3%) | 52 (23.7%) |
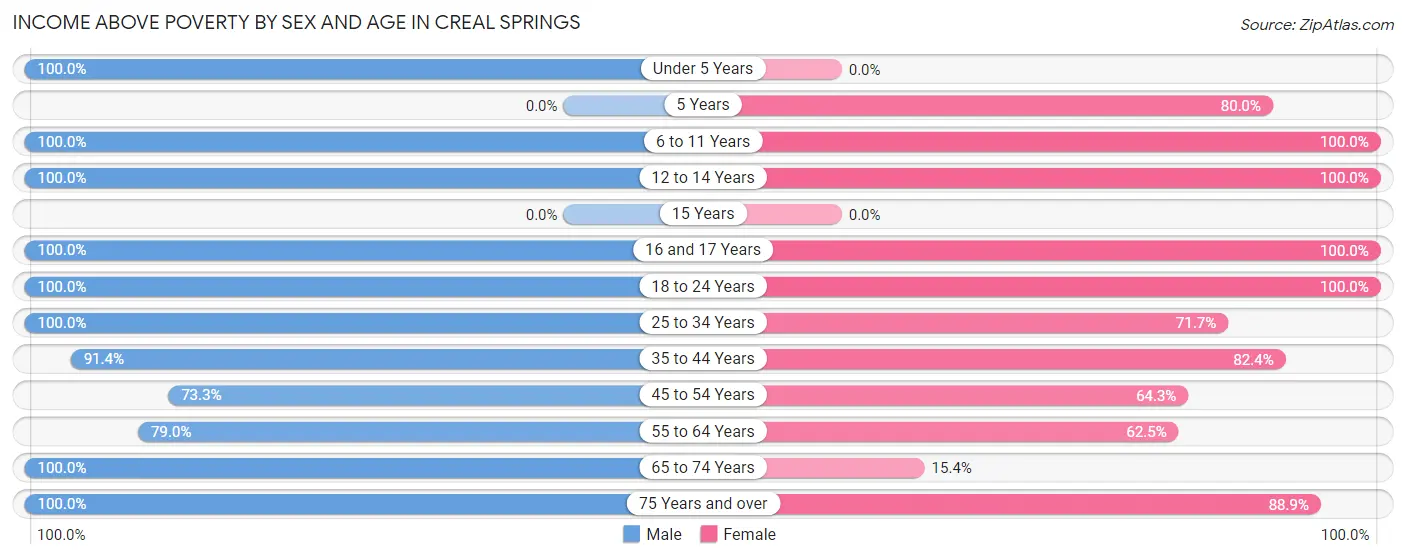
Income Above Poverty by Sex and Age in Creal Springs
According to the poverty statistics in Creal Springs, males aged under 5 years and females aged 6 to 11 years are the age groups that are most secure financially, with 100.0% of males and 100.0% of females in these age groups living above the poverty line.
| Age Bracket | Male | Female |
| Under 5 Years | 27 (100.0%) | 0 (0.0%) |
| 5 Years | 0 (0.0%) | 12 (80.0%) |
| 6 to 11 Years | 27 (100.0%) | 30 (100.0%) |
| 12 to 14 Years | 9 (100.0%) | 4 (100.0%) |
| 15 Years | 0 (0.0%) | 0 (0.0%) |
| 16 and 17 Years | 5 (100.0%) | 6 (100.0%) |
| 18 to 24 Years | 10 (100.0%) | 7 (100.0%) |
| 25 to 34 Years | 33 (100.0%) | 38 (71.7%) |
| 35 to 44 Years | 32 (91.4%) | 28 (82.4%) |
| 45 to 54 Years | 11 (73.3%) | 9 (64.3%) |
| 55 to 64 Years | 15 (78.9%) | 15 (62.5%) |
| 65 to 74 Years | 19 (100.0%) | 2 (15.4%) |
| 75 Years and over | 5 (100.0%) | 16 (88.9%) |
| Total | 193 (93.7%) | 167 (76.3%) |
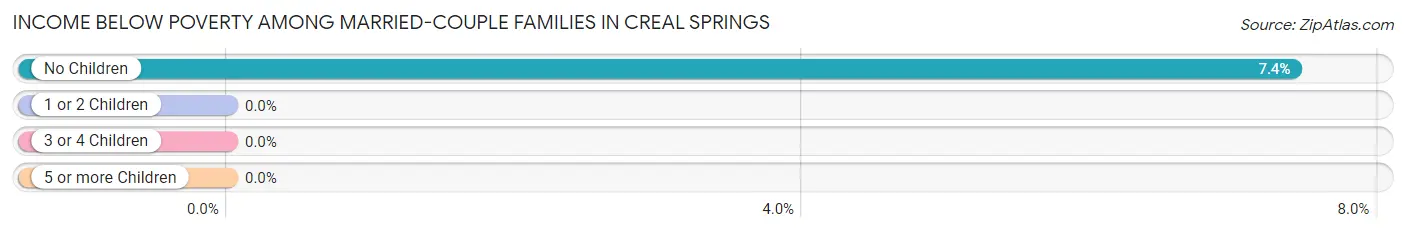
Income Below Poverty Among Married-Couple Families in Creal Springs
The poverty statistics for married-couple families in Creal Springs show that 2.5% or 2 of the total 81 families live below the poverty line. Families with no children have the highest poverty rate of 7.4%, comprising of 2 families. On the other hand, families with 1 or 2 children have the lowest poverty rate of 0.0%, which includes 0 families.
| Children | Above Poverty | Below Poverty |
| No Children | 25 (92.6%) | 2 (7.4%) |
| 1 or 2 Children | 36 (100.0%) | 0 (0.0%) |
| 3 or 4 Children | 18 (100.0%) | 0 (0.0%) |
| 5 or more Children | 0 (0.0%) | 0 (0.0%) |
| Total | 79 (97.5%) | 2 (2.5%) |
Income Below Poverty Among Single-Parent Households in Creal Springs
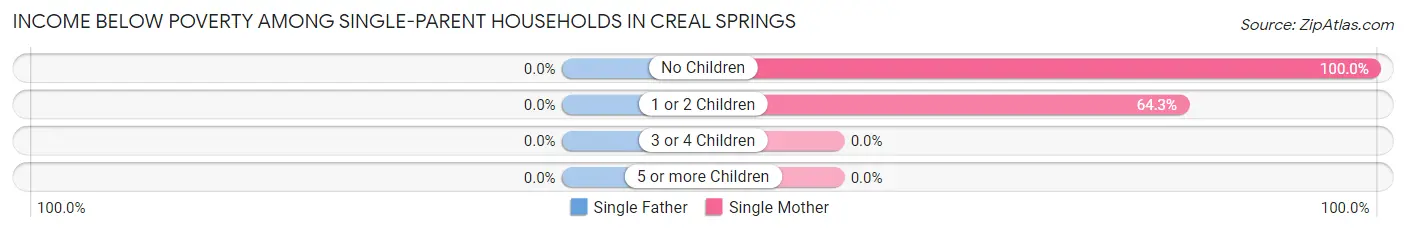
| Children | Single Father | Single Mother |
| No Children | 0 (0.0%) | 5 (100.0%) |
| 1 or 2 Children | 0 (0.0%) | 9 (64.3%) |
| 3 or 4 Children | 0 (0.0%) | 0 (0.0%) |
| 5 or more Children | 0 (0.0%) | 0 (0.0%) |
| Total | 0 (0.0%) | 14 (73.7%) |
Income Below Poverty Among Married-Couple vs Single-Parent Households in Creal Springs
The poverty data for Creal Springs shows that 2 of the married-couple family households (2.5%) and 14 of the single-parent households (48.3%) are living below the poverty level. Within the married-couple family households, those with no children have the highest poverty rate, with 2 households (7.4%) falling below the poverty line. Among the single-parent households, those with no children have the highest poverty rate, with 5 household (100.0%) living below poverty.
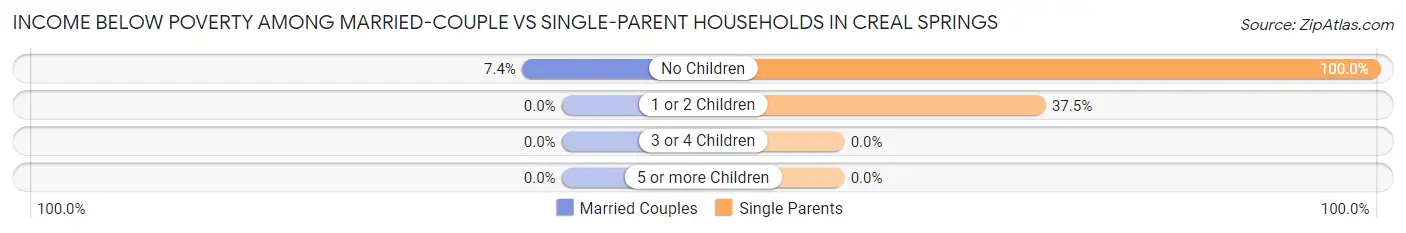
| Children | Married-Couple Families | Single-Parent Households |
| No Children | 2 (7.4%) | 5 (100.0%) |
| 1 or 2 Children | 0 (0.0%) | 9 (37.5%) |
| 3 or 4 Children | 0 (0.0%) | 0 (0.0%) |
| 5 or more Children | 0 (0.0%) | 0 (0.0%) |
| Total | 2 (2.5%) | 14 (48.3%) |
Race in Creal Springs
The most populous races in Creal Springs are White / Caucasian (370 | 87.1%), Hispanic or Latino (32 | 7.5%), and Some other Race (23 | 5.4%).
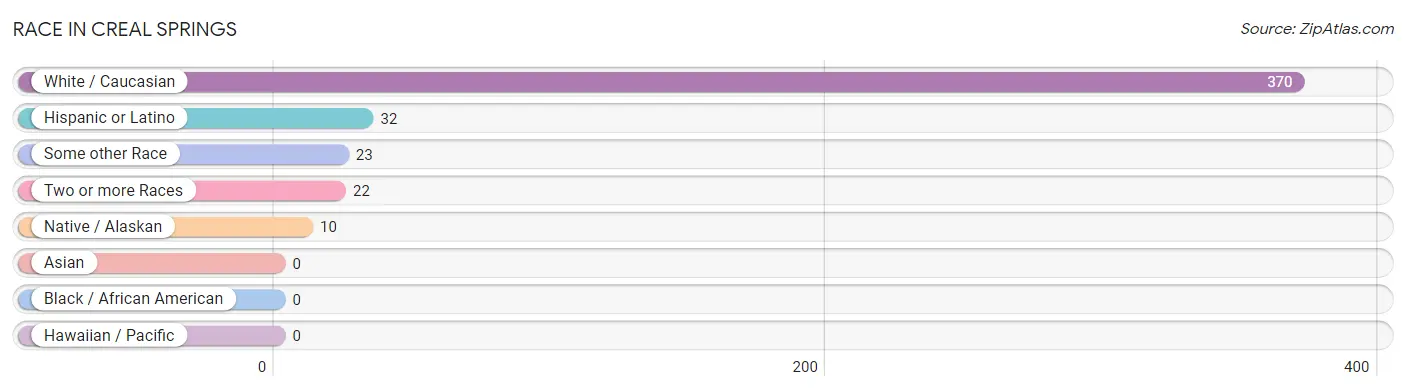
| Race | # Population | % Population |
| Asian | 0 | 0.0% |
| Black / African American | 0 | 0.0% |
| Hawaiian / Pacific | 0 | 0.0% |
| Hispanic or Latino | 32 | 7.5% |
| Native / Alaskan | 10 | 2.4% |
| White / Caucasian | 370 | 87.1% |
| Two or more Races | 22 | 5.2% |
| Some other Race | 23 | 5.4% |
| Total | 425 | 100.0% |
Ancestry in Creal Springs
The most populous ancestries reported in Creal Springs are Irish (47 | 11.1%), German (39 | 9.2%), Puerto Rican (19 | 4.5%), English (17 | 4.0%), and American (13 | 3.1%), together accounting for 31.8% of all Creal Springs residents.
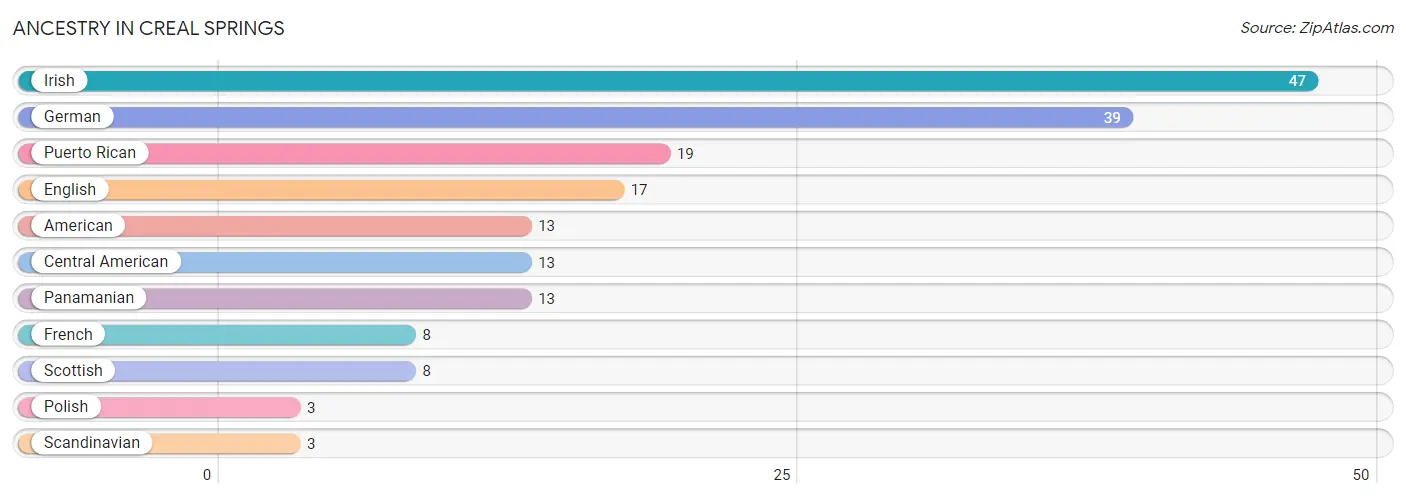
| Ancestry | # Population | % Population |
| American | 13 | 3.1% |
| Central American | 13 | 3.1% |
| English | 17 | 4.0% |
| French | 8 | 1.9% |
| German | 39 | 9.2% |
| Irish | 47 | 11.1% |
| Panamanian | 13 | 3.1% |
| Polish | 3 | 0.7% |
| Puerto Rican | 19 | 4.5% |
| Scandinavian | 3 | 0.7% |
| Scottish | 8 | 1.9% | View All 11 Rows |
Immigrants in Creal Springs

| Immigration Origin | # Population | % Population | View All 0 Rows |
Sex and Age in Creal Springs
Sex and Age in Creal Springs
The most populous age groups in Creal Springs are 30 to 34 Years (33 | 16.0%) for men and 5 to 9 Years (43 | 19.6%) for women.
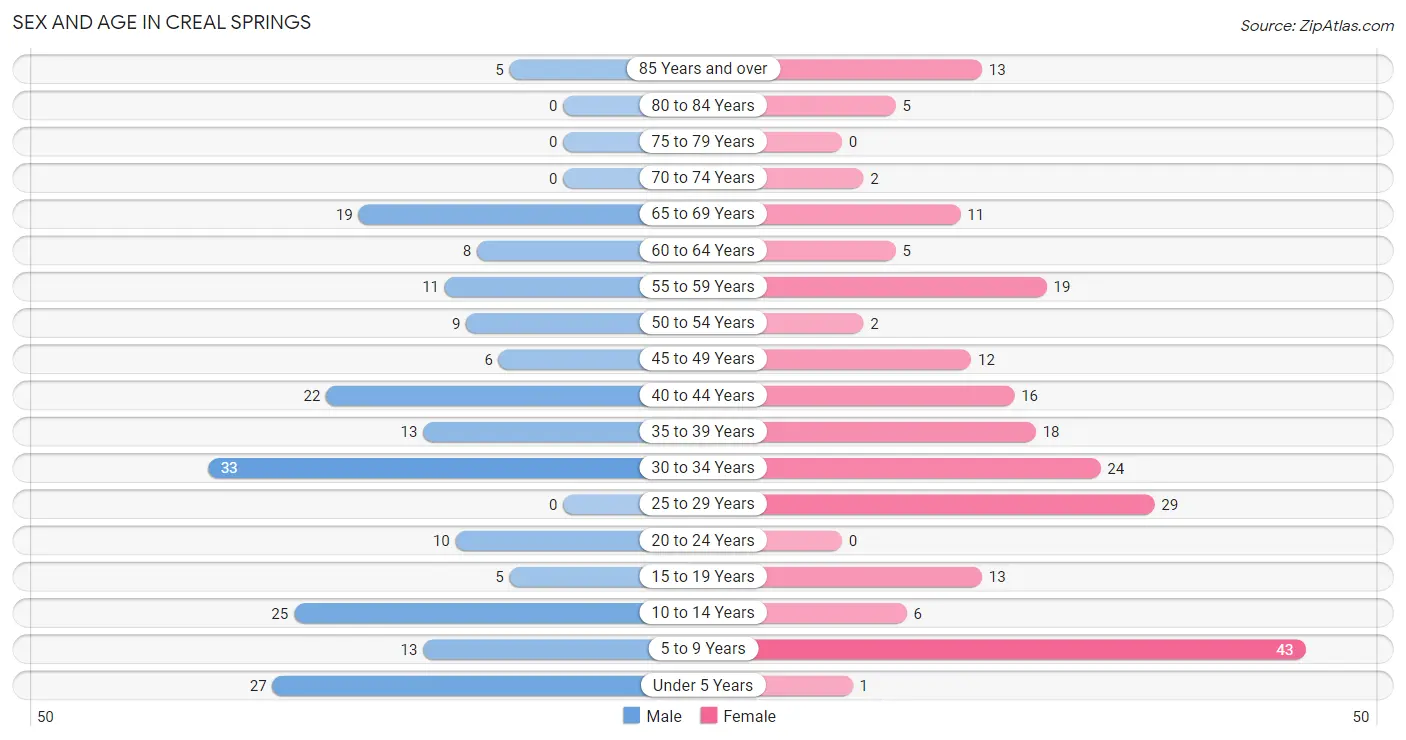
| Age Bracket | Male | Female |
| Under 5 Years | 27 (13.1%) | 1 (0.5%) |
| 5 to 9 Years | 13 (6.3%) | 43 (19.6%) |
| 10 to 14 Years | 25 (12.1%) | 6 (2.7%) |
| 15 to 19 Years | 5 (2.4%) | 13 (5.9%) |
| 20 to 24 Years | 10 (4.9%) | 0 (0.0%) |
| 25 to 29 Years | 0 (0.0%) | 29 (13.2%) |
| 30 to 34 Years | 33 (16.0%) | 24 (11.0%) |
| 35 to 39 Years | 13 (6.3%) | 18 (8.2%) |
| 40 to 44 Years | 22 (10.7%) | 16 (7.3%) |
| 45 to 49 Years | 6 (2.9%) | 12 (5.5%) |
| 50 to 54 Years | 9 (4.4%) | 2 (0.9%) |
| 55 to 59 Years | 11 (5.3%) | 19 (8.7%) |
| 60 to 64 Years | 8 (3.9%) | 5 (2.3%) |
| 65 to 69 Years | 19 (9.2%) | 11 (5.0%) |
| 70 to 74 Years | 0 (0.0%) | 2 (0.9%) |
| 75 to 79 Years | 0 (0.0%) | 0 (0.0%) |
| 80 to 84 Years | 0 (0.0%) | 5 (2.3%) |
| 85 Years and over | 5 (2.4%) | 13 (5.9%) |
| Total | 206 (100.0%) | 219 (100.0%) |
Families and Households in Creal Springs
Median Family Size in Creal Springs
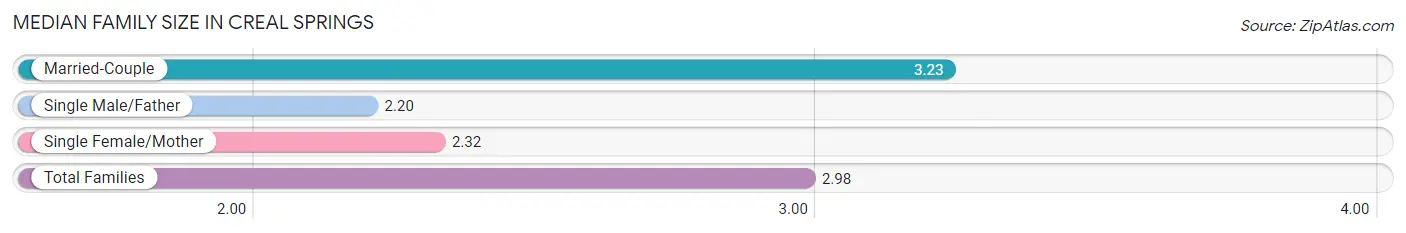
The median family size in Creal Springs is 2.98 persons per family, with married-couple families (81 | 73.6%) accounting for the largest median family size of 3.23 persons per family. On the other hand, single male/father families (10 | 9.1%) represent the smallest median family size with 2.20 persons per family.
| Family Type | # Families | Family Size |
| Married-Couple | 81 (73.6%) | 3.23 |
| Single Male/Father | 10 (9.1%) | 2.20 |
| Single Female/Mother | 19 (17.3%) | 2.32 |
| Total Families | 110 (100.0%) | 2.98 |
Median Household Size in Creal Springs
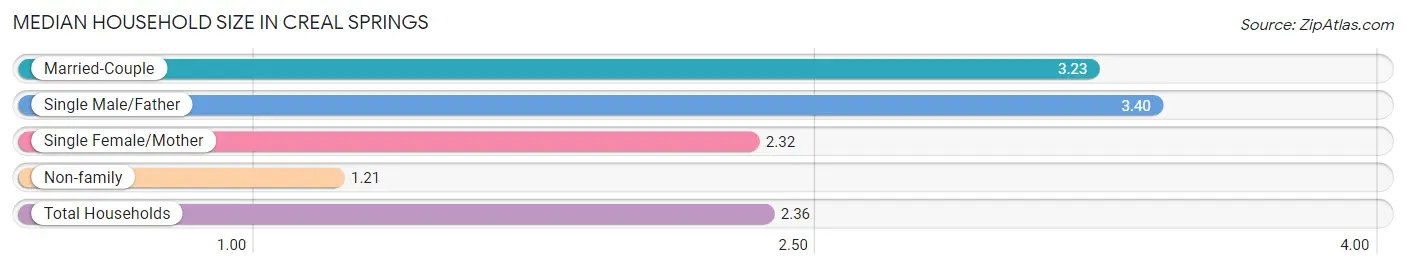
The median household size in Creal Springs is 2.36 persons per household, with single male/father households (10 | 5.6%) accounting for the largest median household size of 3.4 persons per household. non-family households (70 | 38.9%) represent the smallest median household size with 1.21 persons per household.
| Household Type | # Households | Household Size |
| Married-Couple | 81 (45.0%) | 3.23 |
| Single Male/Father | 10 (5.6%) | 3.40 |
| Single Female/Mother | 19 (10.6%) | 2.32 |
| Non-family | 70 (38.9%) | 1.21 |
| Total Households | 180 (100.0%) | 2.36 |
Household Size by Marriage Status in Creal Springs
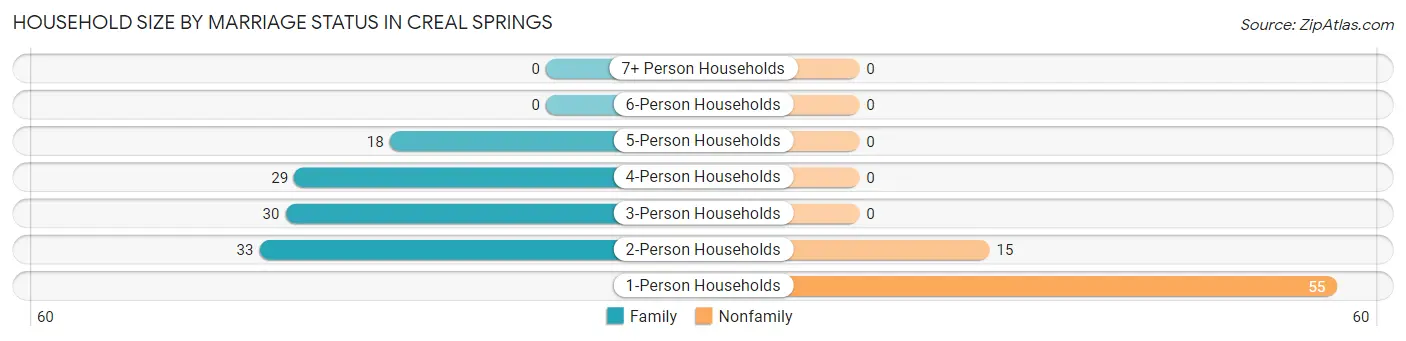
Out of a total of 180 households in Creal Springs, 110 (61.1%) are family households, while 70 (38.9%) are nonfamily households. The most numerous type of family households are 2-person households, comprising 33, and the most common type of nonfamily households are 1-person households, comprising 55.
| Household Size | Family Households | Nonfamily Households |
| 1-Person Households | - | 55 (30.6%) |
| 2-Person Households | 33 (18.3%) | 15 (8.3%) |
| 3-Person Households | 30 (16.7%) | 0 (0.0%) |
| 4-Person Households | 29 (16.1%) | 0 (0.0%) |
| 5-Person Households | 18 (10.0%) | 0 (0.0%) |
| 6-Person Households | 0 (0.0%) | 0 (0.0%) |
| 7+ Person Households | 0 (0.0%) | 0 (0.0%) |
| Total | 110 (61.1%) | 70 (38.9%) |
Female Fertility in Creal Springs
Fertility by Age in Creal Springs
Average fertility rate in Creal Springs is 107.0 births per 1,000 women. Women in the age bracket of 20 to 34 years have the highest fertility rate with 226.0 births per 1,000 women. Women in the age bracket of 20 to 34 years acount for 100.0% of all women with births.
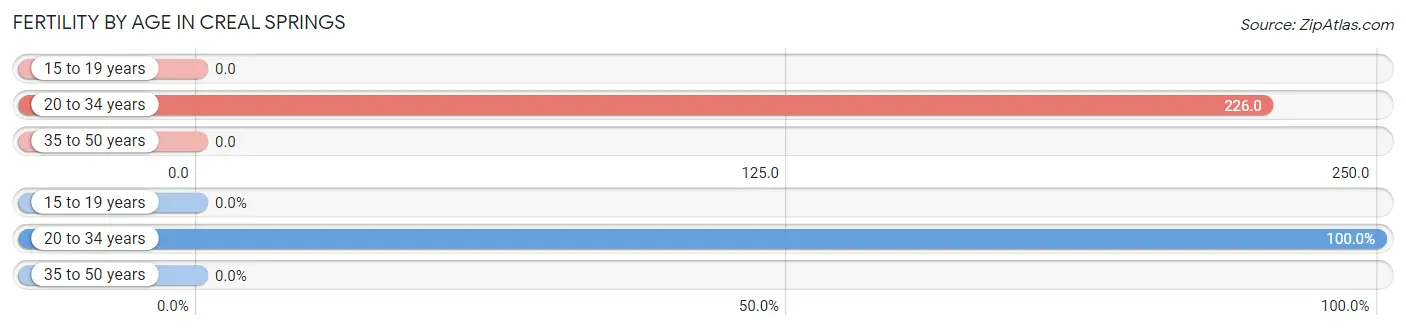
| Age Bracket | Women with Births | Births / 1,000 Women |
| 15 to 19 years | 0 (0.0%) | 0.0 |
| 20 to 34 years | 12 (100.0%) | 226.0 |
| 35 to 50 years | 0 (0.0%) | 0.0 |
| Total | 12 (100.0%) | 107.0 |
Fertility by Age by Marriage Status in Creal Springs
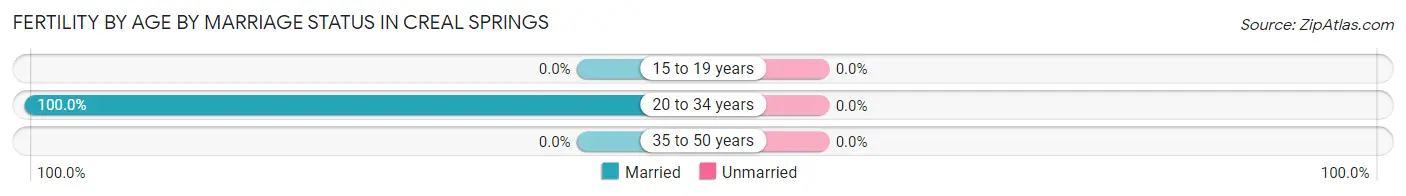
| Age Bracket | Married | Unmarried |
| 15 to 19 years | 0 (0.0%) | 0 (0.0%) |
| 20 to 34 years | 12 (100.0%) | 0 (0.0%) |
| 35 to 50 years | 0 (0.0%) | 0 (0.0%) |
| Total | 12 (100.0%) | 0 (0.0%) |
Fertility by Education in Creal Springs
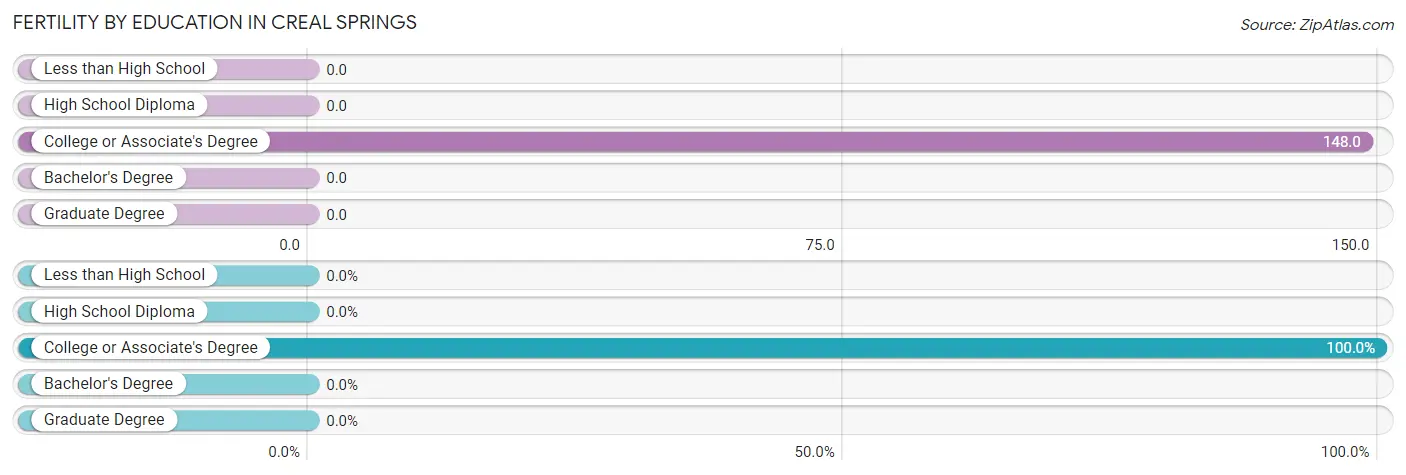
| Educational Attainment | Women with Births | Births / 1,000 Women |
| Less than High School | 0 (0.0%) | 0.0 |
| High School Diploma | 0 (0.0%) | 0.0 |
| College or Associate's Degree | 12 (100.0%) | 148.0 |
| Bachelor's Degree | 0 (0.0%) | 0.0 |
| Graduate Degree | 0 (0.0%) | 0.0 |
| Total | 12 (100.0%) | 107.0 |
Fertility by Education by Marriage Status in Creal Springs
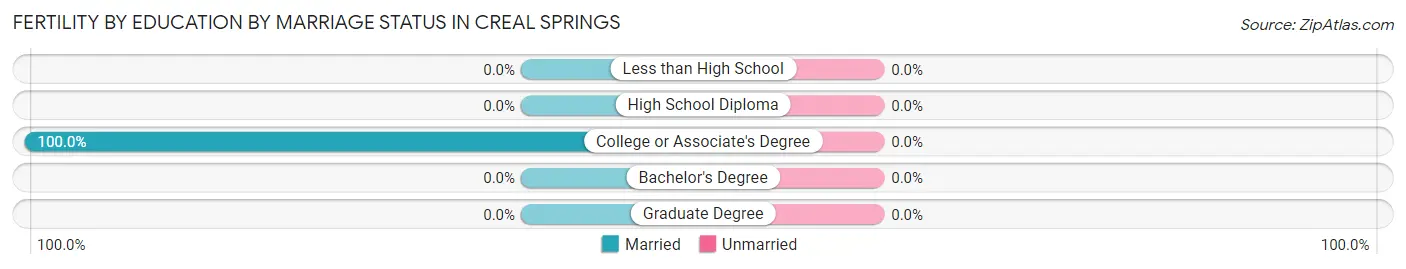
| Educational Attainment | Married | Unmarried |
| Less than High School | 0 (0.0%) | 0 (0.0%) |
| High School Diploma | 0 (0.0%) | 0 (0.0%) |
| College or Associate's Degree | 12 (100.0%) | 0 (0.0%) |
| Bachelor's Degree | 0 (0.0%) | 0 (0.0%) |
| Graduate Degree | 0 (0.0%) | 0 (0.0%) |
| Total | 12 (100.0%) | 0 (0.0%) |
Employment Characteristics in Creal Springs
Employment by Class of Employer in Creal Springs
Among the 154 employed individuals in Creal Springs, private company employees (122 | 79.2%), self-employed (not incorporated) (17 | 11.0%), and state government employees (6 | 3.9%) make up the most common classes of employment.
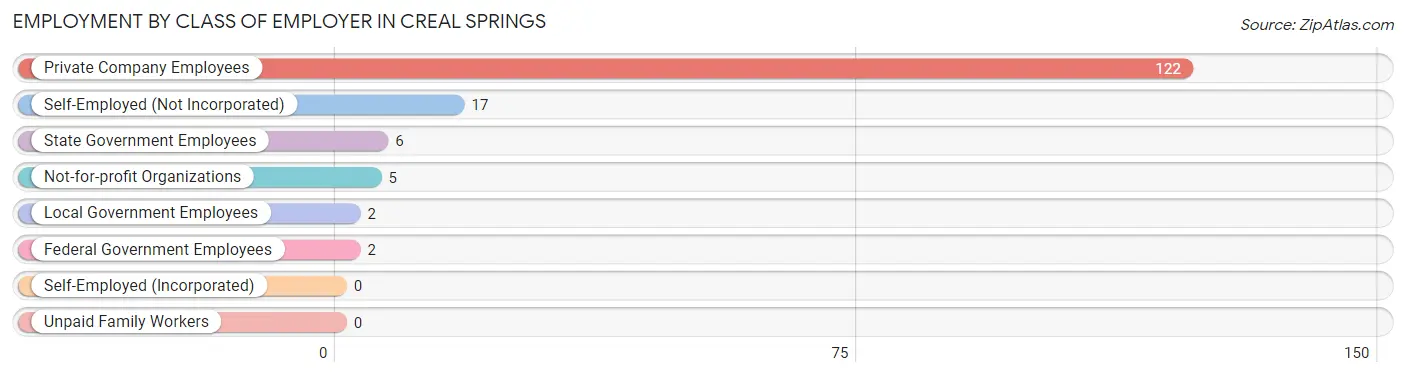
| Employer Class | # Employees | % Employees |
| Private Company Employees | 122 | 79.2% |
| Self-Employed (Incorporated) | 0 | 0.0% |
| Self-Employed (Not Incorporated) | 17 | 11.0% |
| Not-for-profit Organizations | 5 | 3.3% |
| Local Government Employees | 2 | 1.3% |
| State Government Employees | 6 | 3.9% |
| Federal Government Employees | 2 | 1.3% |
| Unpaid Family Workers | 0 | 0.0% |
| Total | 154 | 100.0% |
Employment Status by Age in Creal Springs
According to the labor force statistics for Creal Springs, out of the total population over 16 years of age (310), 55.5% or 172 individuals are in the labor force, with 10.5% or 18 of them unemployed. The age group with the highest labor force participation rate is 20 to 24 years, with 100.0% or 10 individuals in the labor force. Within the labor force, the 20 to 24 years age range has the highest percentage of unemployed individuals, with 100.0% or 10 of them being unemployed.
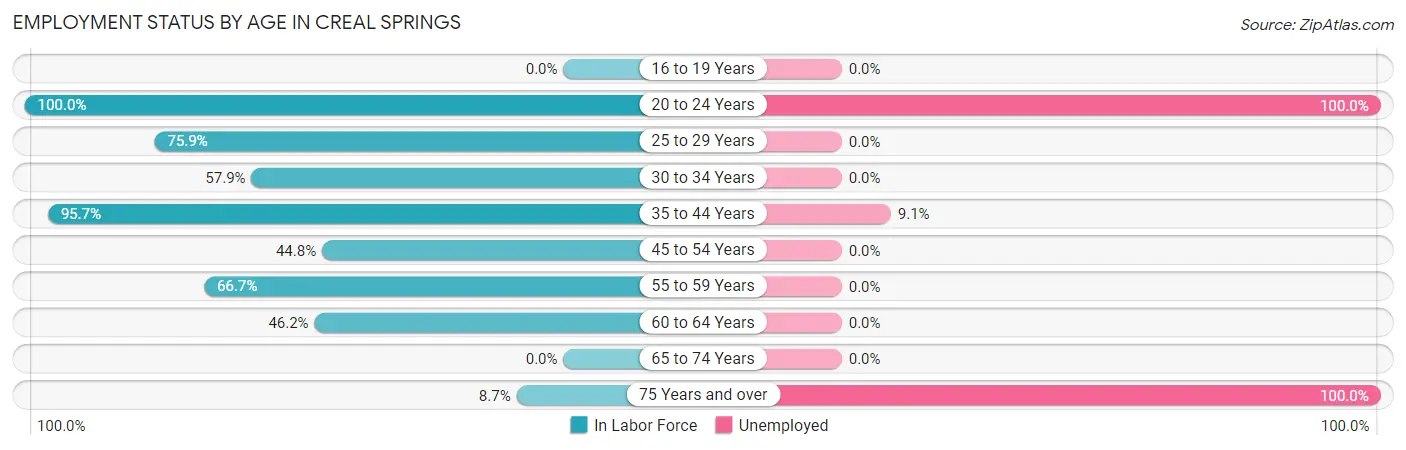
| Age Bracket | In Labor Force | Unemployed |
| 16 to 19 Years | 0 (0.0%) | 0 (0.0%) |
| 20 to 24 Years | 10 (100.0%) | 10 (100.0%) |
| 25 to 29 Years | 22 (75.9%) | 0 (0.0%) |
| 30 to 34 Years | 33 (57.9%) | 0 (0.0%) |
| 35 to 44 Years | 66 (95.7%) | 6 (9.1%) |
| 45 to 54 Years | 13 (44.8%) | 0 (0.0%) |
| 55 to 59 Years | 20 (66.7%) | 0 (0.0%) |
| 60 to 64 Years | 6 (46.2%) | 0 (0.0%) |
| 65 to 74 Years | 0 (0.0%) | 0 (0.0%) |
| 75 Years and over | 2 (8.7%) | 2 (100.0%) |
| Total | 172 (55.5%) | 18 (10.5%) |
Employment Status by Educational Attainment in Creal Springs
According to labor force statistics for Creal Springs, 70.5% of individuals (160) out of the total population between 25 and 64 years of age (227) are in the labor force, with 3.8% or 6 of them being unemployed. The group with the highest labor force participation rate are those with the educational attainment of bachelor's degree or higher, with 100.0% or 27 individuals in the labor force. Within the labor force, individuals with college / associate degree education have the highest percentage of unemployment, with 8.6% or 6 of them being unemployed.
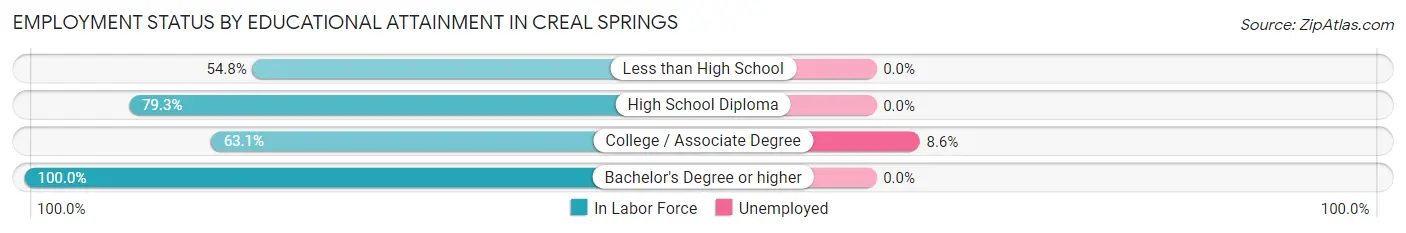
| Educational Attainment | In Labor Force | Unemployed |
| Less than High School | 17 (54.8%) | 0 (0.0%) |
| High School Diploma | 46 (79.3%) | 0 (0.0%) |
| College / Associate Degree | 70 (63.1%) | 10 (8.6%) |
| Bachelor's Degree or higher | 27 (100.0%) | 0 (0.0%) |
| Total | 160 (70.5%) | 9 (3.8%) |
Employment Occupations by Sex in Creal Springs
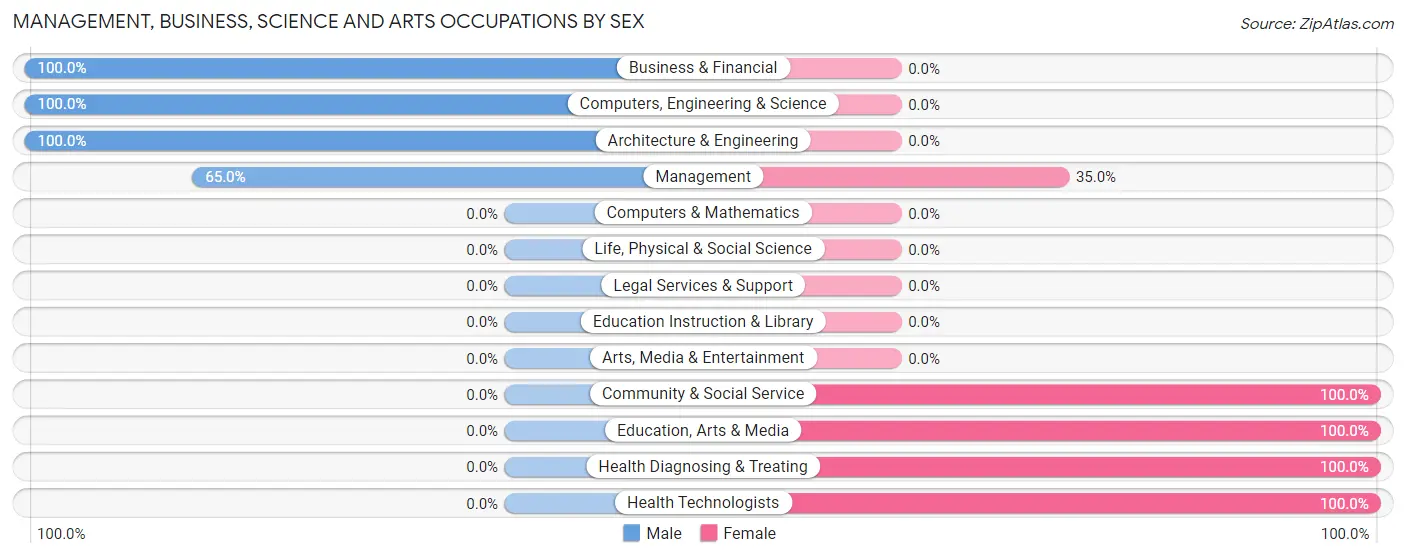
Management, Business, Science and Arts Occupations
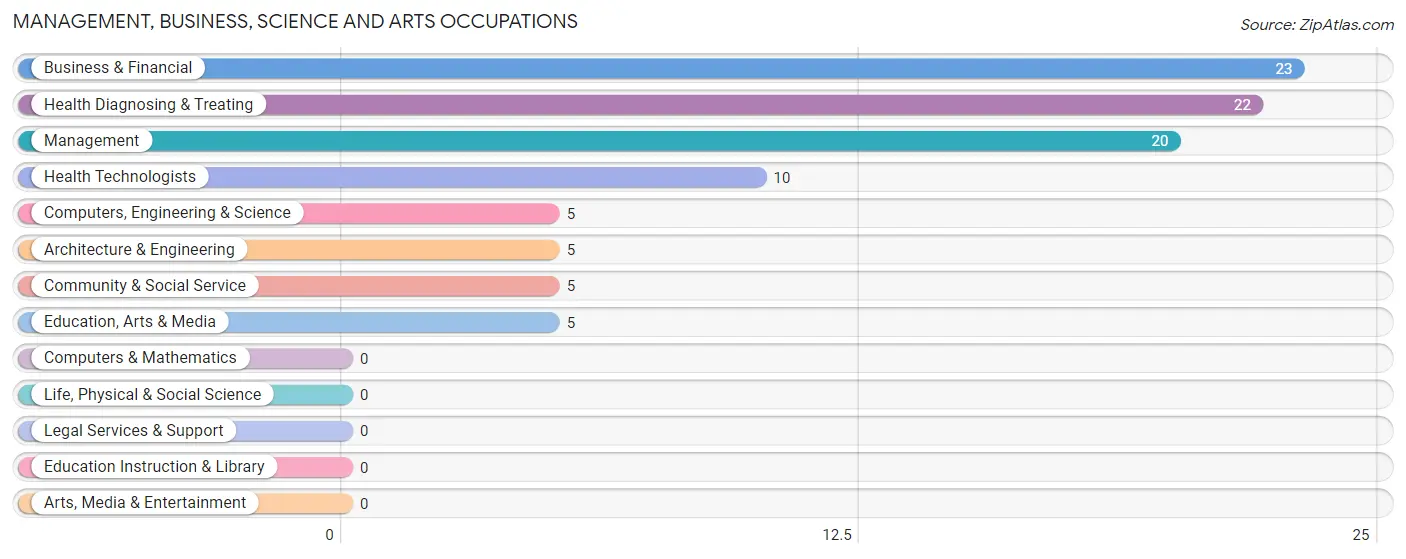
The most common Management, Business, Science and Arts occupations in Creal Springs are Business & Financial (23 | 14.9%), Health Diagnosing & Treating (22 | 14.3%), Management (20 | 13.0%), Health Technologists (10 | 6.5%), and Computers, Engineering & Science (5 | 3.3%).
Management, Business, Science and Arts Occupations by Sex
Within the Management, Business, Science and Arts occupations in Creal Springs, the most male-oriented occupations are Business & Financial (100.0%), Computers, Engineering & Science (100.0%), and Architecture & Engineering (100.0%), while the most female-oriented occupations are Community & Social Service (100.0%), Education, Arts & Media (100.0%), and Health Diagnosing & Treating (100.0%).
| Occupation | Male | Female |
| Management | 13 (65.0%) | 7 (35.0%) |
| Business & Financial | 23 (100.0%) | 0 (0.0%) |
| Computers, Engineering & Science | 5 (100.0%) | 0 (0.0%) |
| Computers & Mathematics | 0 (0.0%) | 0 (0.0%) |
| Architecture & Engineering | 5 (100.0%) | 0 (0.0%) |
| Life, Physical & Social Science | 0 (0.0%) | 0 (0.0%) |
| Community & Social Service | 0 (0.0%) | 5 (100.0%) |
| Education, Arts & Media | 0 (0.0%) | 5 (100.0%) |
| Legal Services & Support | 0 (0.0%) | 0 (0.0%) |
| Education Instruction & Library | 0 (0.0%) | 0 (0.0%) |
| Arts, Media & Entertainment | 0 (0.0%) | 0 (0.0%) |
| Health Diagnosing & Treating | 0 (0.0%) | 22 (100.0%) |
| Health Technologists | 0 (0.0%) | 10 (100.0%) |
| Total (Category) | 41 (54.7%) | 34 (45.3%) |
| Total (Overall) | 89 (57.8%) | 65 (42.2%) |
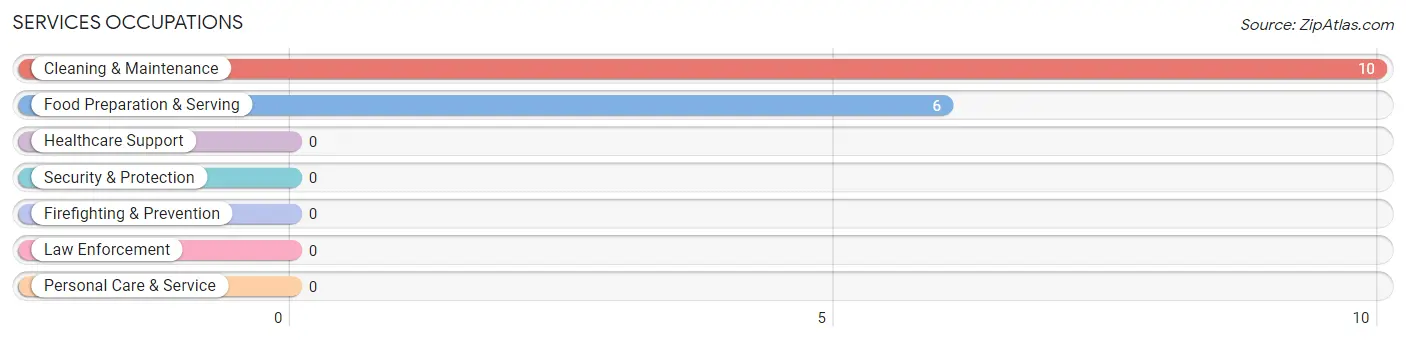
Services Occupations
The most common Services occupations in Creal Springs are Cleaning & Maintenance (10 | 6.5%), and Food Preparation & Serving (6 | 3.9%).
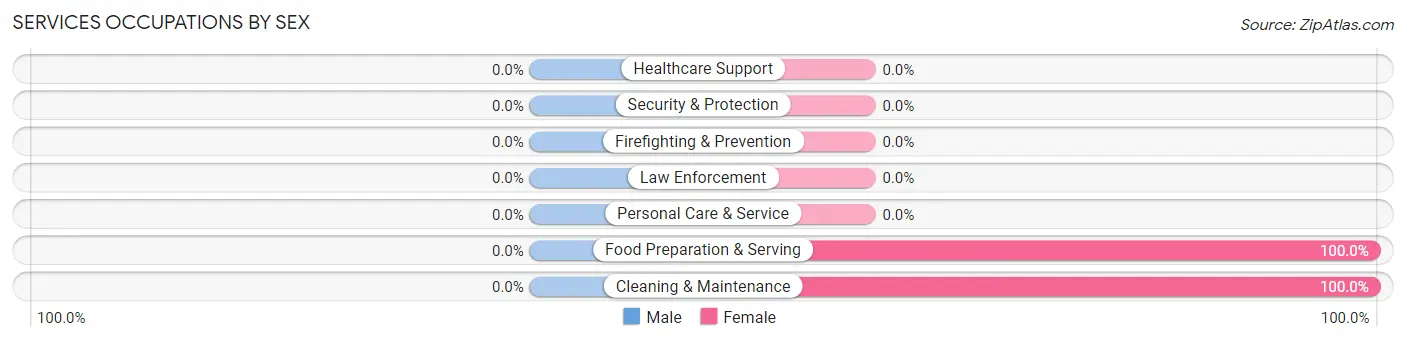
Services Occupations by Sex
| Occupation | Male | Female |
| Healthcare Support | 0 (0.0%) | 0 (0.0%) |
| Security & Protection | 0 (0.0%) | 0 (0.0%) |
| Firefighting & Prevention | 0 (0.0%) | 0 (0.0%) |
| Law Enforcement | 0 (0.0%) | 0 (0.0%) |
| Food Preparation & Serving | 0 (0.0%) | 6 (100.0%) |
| Cleaning & Maintenance | 0 (0.0%) | 10 (100.0%) |
| Personal Care & Service | 0 (0.0%) | 0 (0.0%) |
| Total (Category) | 0 (0.0%) | 16 (100.0%) |
| Total (Overall) | 89 (57.8%) | 65 (42.2%) |
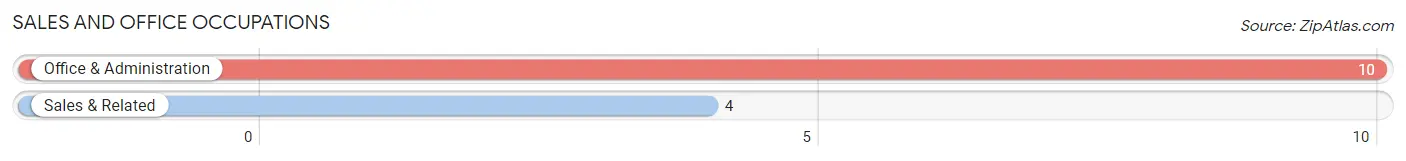
Sales and Office Occupations
The most common Sales and Office occupations in Creal Springs are Office & Administration (10 | 6.5%), and Sales & Related (4 | 2.6%).
Sales and Office Occupations by Sex
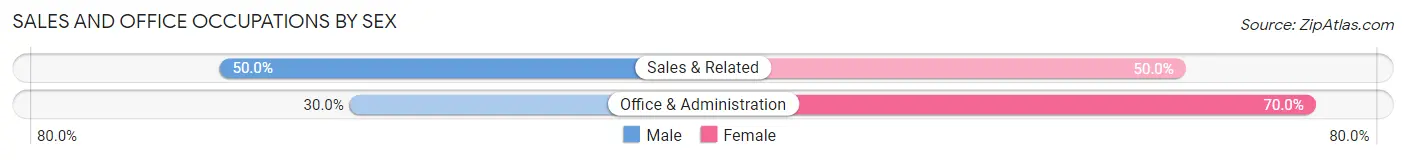
| Occupation | Male | Female |
| Sales & Related | 2 (50.0%) | 2 (50.0%) |
| Office & Administration | 3 (30.0%) | 7 (70.0%) |
| Total (Category) | 5 (35.7%) | 9 (64.3%) |
| Total (Overall) | 89 (57.8%) | 65 (42.2%) |
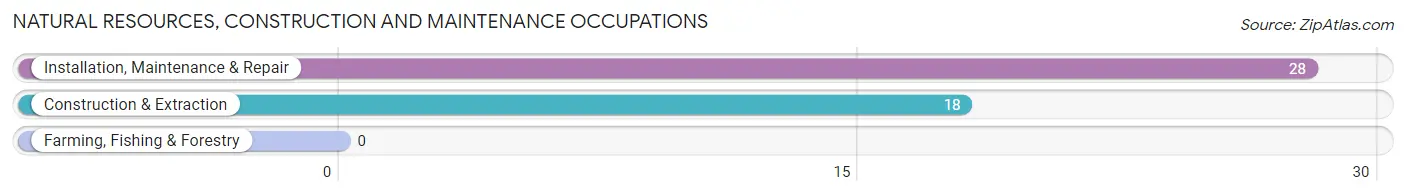
Natural Resources, Construction and Maintenance Occupations
The most common Natural Resources, Construction and Maintenance occupations in Creal Springs are Installation, Maintenance & Repair (28 | 18.2%), and Construction & Extraction (18 | 11.7%).
Natural Resources, Construction and Maintenance Occupations by Sex
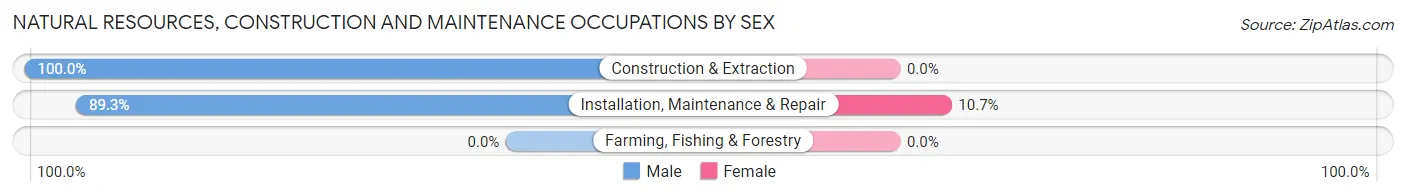
| Occupation | Male | Female |
| Farming, Fishing & Forestry | 0 (0.0%) | 0 (0.0%) |
| Construction & Extraction | 18 (100.0%) | 0 (0.0%) |
| Installation, Maintenance & Repair | 25 (89.3%) | 3 (10.7%) |
| Total (Category) | 43 (93.5%) | 3 (6.5%) |
| Total (Overall) | 89 (57.8%) | 65 (42.2%) |
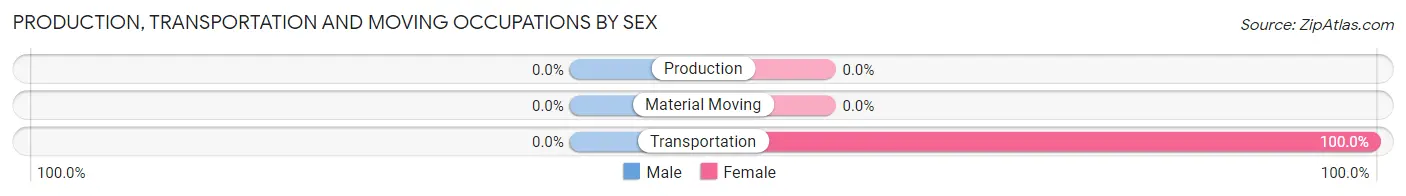
Production, Transportation and Moving Occupations
The most common Production, Transportation and Moving occupations in Creal Springs are , and Transportation (3 | 1.9%).
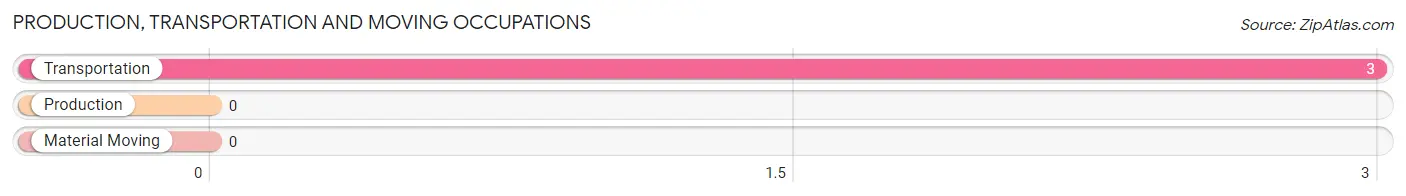
Production, Transportation and Moving Occupations by Sex
| Occupation | Male | Female |
| Production | 0 (0.0%) | 0 (0.0%) |
| Transportation | 0 (0.0%) | 3 (100.0%) |
| Material Moving | 0 (0.0%) | 0 (0.0%) |
| Total (Category) | 0 (0.0%) | 3 (100.0%) |
| Total (Overall) | 89 (57.8%) | 65 (42.2%) |
Employment Industries by Sex in Creal Springs
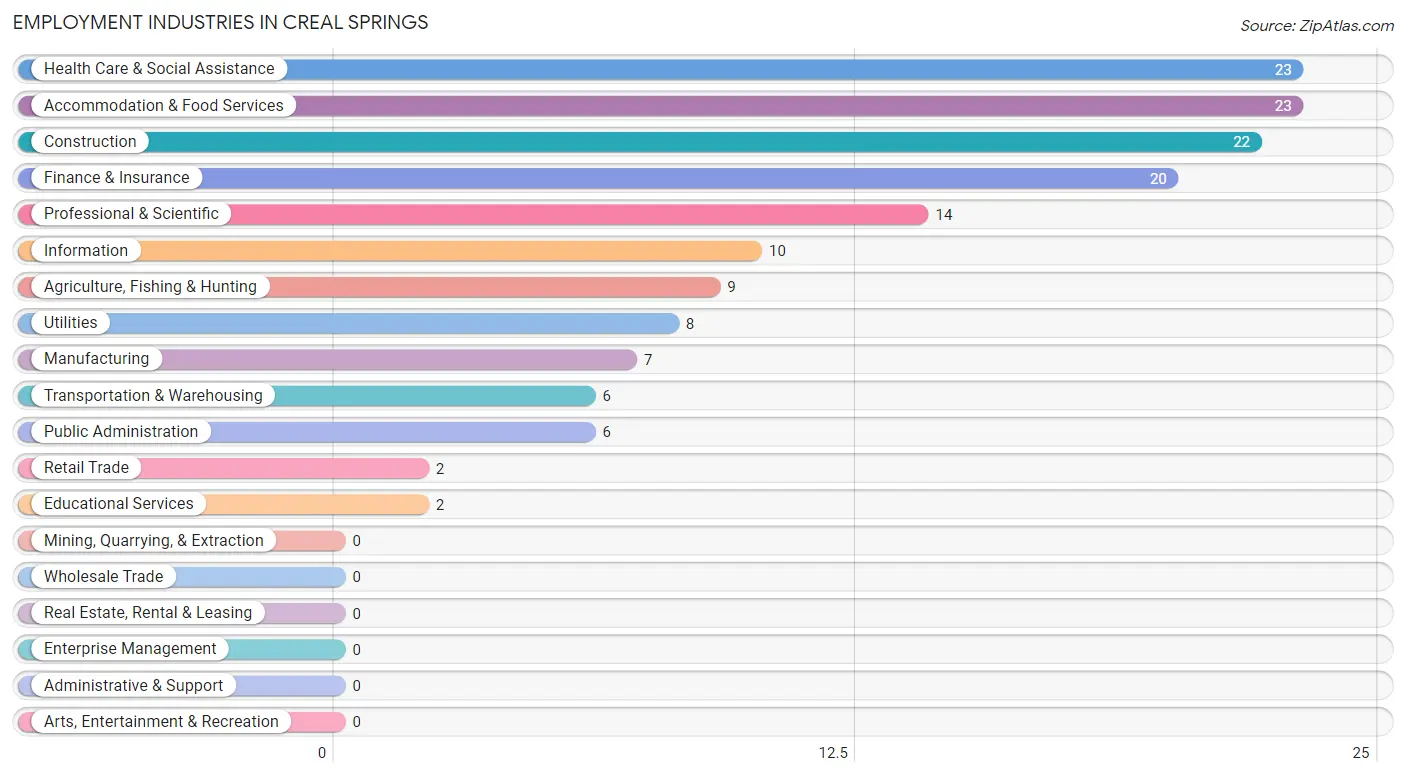
Employment Industries in Creal Springs
The major employment industries in Creal Springs include Health Care & Social Assistance (23 | 14.9%), Accommodation & Food Services (23 | 14.9%), Construction (22 | 14.3%), Finance & Insurance (20 | 13.0%), and Professional & Scientific (14 | 9.1%).
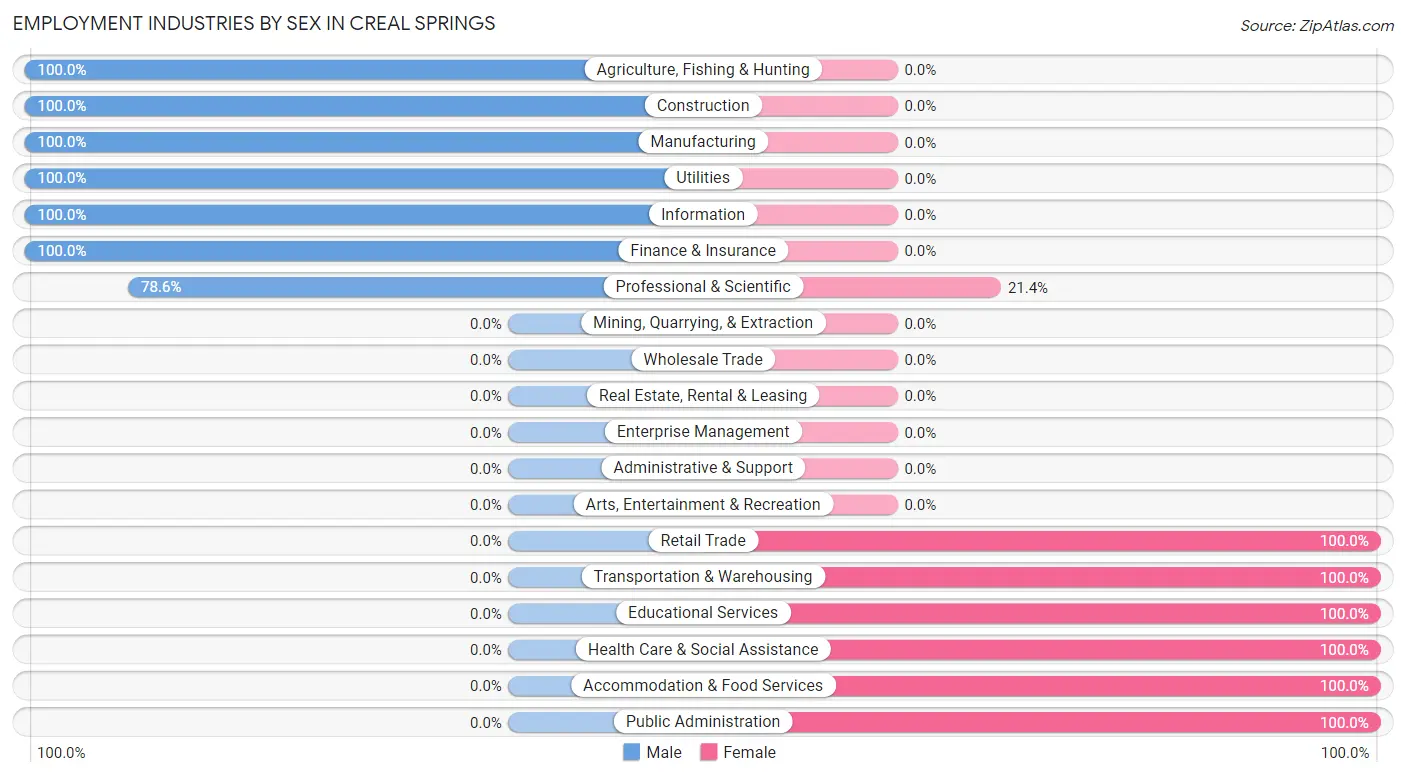
Employment Industries by Sex in Creal Springs
The Creal Springs industries that see more men than women are Agriculture, Fishing & Hunting (100.0%), Construction (100.0%), and Manufacturing (100.0%), whereas the industries that tend to have a higher number of women are Retail Trade (100.0%), Transportation & Warehousing (100.0%), and Educational Services (100.0%).
| Industry | Male | Female |
| Agriculture, Fishing & Hunting | 9 (100.0%) | 0 (0.0%) |
| Mining, Quarrying, & Extraction | 0 (0.0%) | 0 (0.0%) |
| Construction | 22 (100.0%) | 0 (0.0%) |
| Manufacturing | 7 (100.0%) | 0 (0.0%) |
| Wholesale Trade | 0 (0.0%) | 0 (0.0%) |
| Retail Trade | 0 (0.0%) | 2 (100.0%) |
| Transportation & Warehousing | 0 (0.0%) | 6 (100.0%) |
| Utilities | 8 (100.0%) | 0 (0.0%) |
| Information | 10 (100.0%) | 0 (0.0%) |
| Finance & Insurance | 20 (100.0%) | 0 (0.0%) |
| Real Estate, Rental & Leasing | 0 (0.0%) | 0 (0.0%) |
| Professional & Scientific | 11 (78.6%) | 3 (21.4%) |
| Enterprise Management | 0 (0.0%) | 0 (0.0%) |
| Administrative & Support | 0 (0.0%) | 0 (0.0%) |
| Educational Services | 0 (0.0%) | 2 (100.0%) |
| Health Care & Social Assistance | 0 (0.0%) | 23 (100.0%) |
| Arts, Entertainment & Recreation | 0 (0.0%) | 0 (0.0%) |
| Accommodation & Food Services | 0 (0.0%) | 23 (100.0%) |
| Public Administration | 0 (0.0%) | 6 (100.0%) |
| Total | 89 (57.8%) | 65 (42.2%) |
Education in Creal Springs
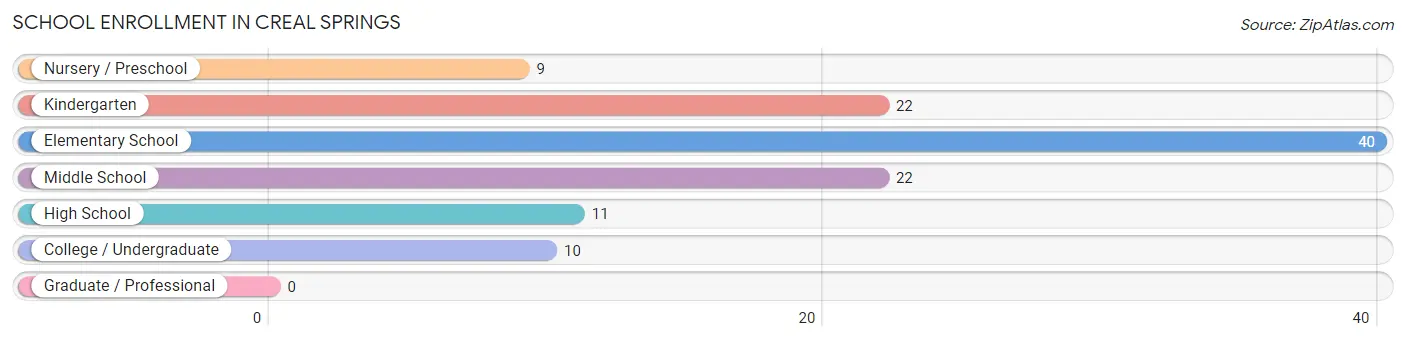
School Enrollment in Creal Springs
The most common levels of schooling among the 114 students in Creal Springs are elementary school (40 | 35.1%), kindergarten (22 | 19.3%), and middle school (22 | 19.3%).
| School Level | # Students | % Students |
| Nursery / Preschool | 9 | 7.9% |
| Kindergarten | 22 | 19.3% |
| Elementary School | 40 | 35.1% |
| Middle School | 22 | 19.3% |
| High School | 11 | 9.7% |
| College / Undergraduate | 10 | 8.8% |
| Graduate / Professional | 0 | 0.0% |
| Total | 114 | 100.0% |
School Enrollment by Age by Funding Source in Creal Springs
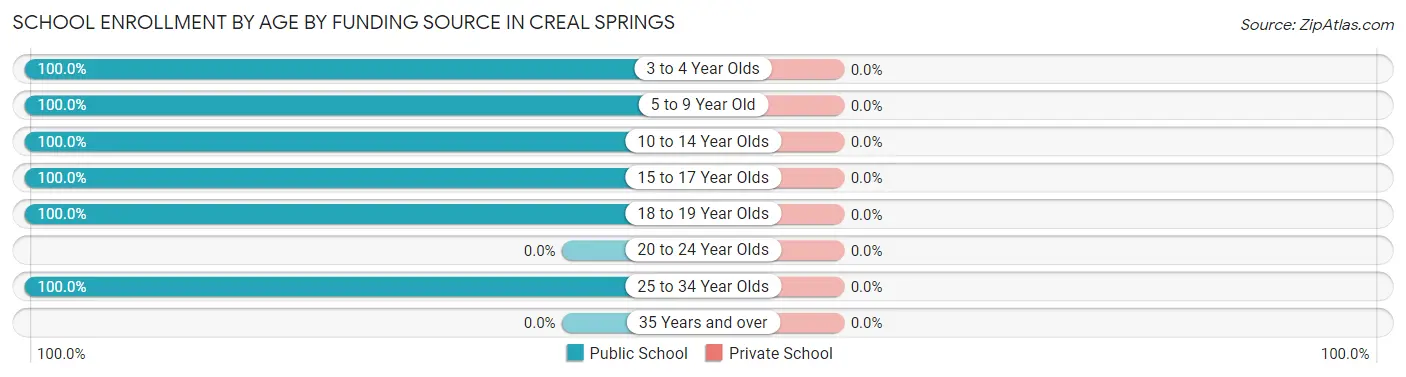
| Age Bracket | Public School | Private School |
| 3 to 4 Year Olds | 6 (100.0%) | 0 (0.0%) |
| 5 to 9 Year Old | 56 (100.0%) | 0 (0.0%) |
| 10 to 14 Year Olds | 31 (100.0%) | 0 (0.0%) |
| 15 to 17 Year Olds | 11 (100.0%) | 0 (0.0%) |
| 18 to 19 Year Olds | 7 (100.0%) | 0 (0.0%) |
| 20 to 24 Year Olds | 0 (0.0%) | 0 (0.0%) |
| 25 to 34 Year Olds | 3 (100.0%) | 0 (0.0%) |
| 35 Years and over | 0 (0.0%) | 0 (0.0%) |
| Total | 114 (100.0%) | 0 (0.0%) |
Educational Attainment by Field of Study in Creal Springs
Bio, nature & agricultural (12 | 40.0%), arts & humanities (10 | 33.3%), science & technology (3 | 10.0%), business (3 | 10.0%), and physical & health sciences (2 | 6.7%) are the most common fields of study among 30 individuals in Creal Springs who have obtained a bachelor's degree or higher.
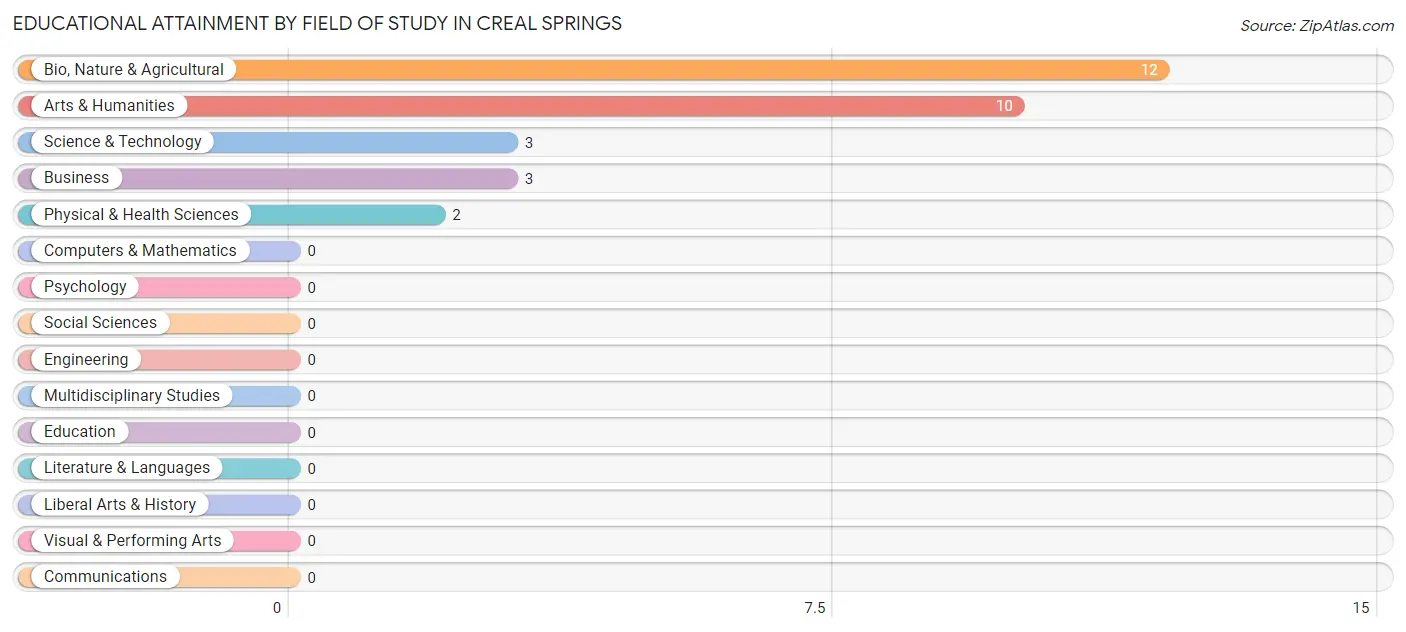
| Field of Study | # Graduates | % Graduates |
| Computers & Mathematics | 0 | 0.0% |
| Bio, Nature & Agricultural | 12 | 40.0% |
| Physical & Health Sciences | 2 | 6.7% |
| Psychology | 0 | 0.0% |
| Social Sciences | 0 | 0.0% |
| Engineering | 0 | 0.0% |
| Multidisciplinary Studies | 0 | 0.0% |
| Science & Technology | 3 | 10.0% |
| Business | 3 | 10.0% |
| Education | 0 | 0.0% |
| Literature & Languages | 0 | 0.0% |
| Liberal Arts & History | 0 | 0.0% |
| Visual & Performing Arts | 0 | 0.0% |
| Communications | 0 | 0.0% |
| Arts & Humanities | 10 | 33.3% |
| Total | 30 | 100.0% |
Transportation & Commute in Creal Springs
Vehicle Availability by Sex in Creal Springs
The most prevalent vehicle ownership categories in Creal Springs are males with 2 vehicles (47, accounting for 52.8%) and females with 2 vehicles (28, making up 72.3%).
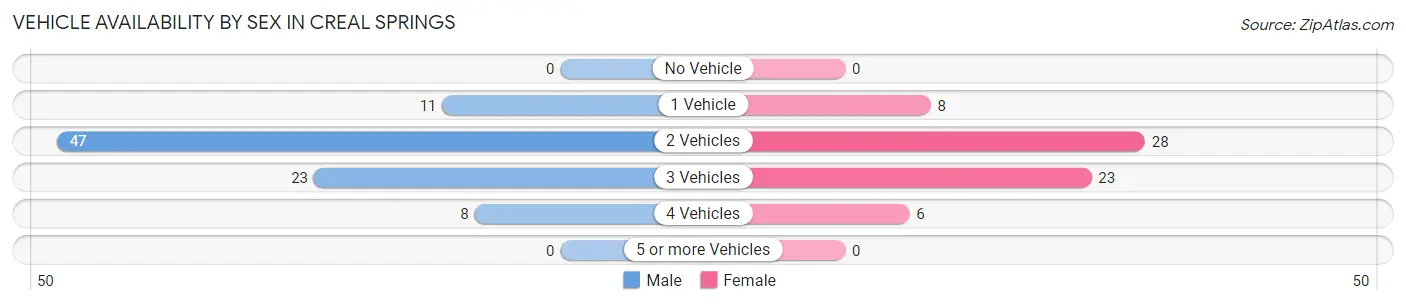
| Vehicles Available | Male | Female |
| No Vehicle | 0 (0.0%) | 0 (0.0%) |
| 1 Vehicle | 11 (12.4%) | 8 (12.3%) |
| 2 Vehicles | 47 (52.8%) | 28 (43.1%) |
| 3 Vehicles | 23 (25.8%) | 23 (35.4%) |
| 4 Vehicles | 8 (9.0%) | 6 (9.2%) |
| 5 or more Vehicles | 0 (0.0%) | 0 (0.0%) |
| Total | 89 (100.0%) | 65 (100.0%) |
Commute Time in Creal Springs
The most frequently occuring commute durations in Creal Springs are 30 to 34 minutes (72 commuters, 58.1%), 45 to 59 minutes (23 commuters, 18.5%), and 15 to 19 minutes (12 commuters, 9.7%).
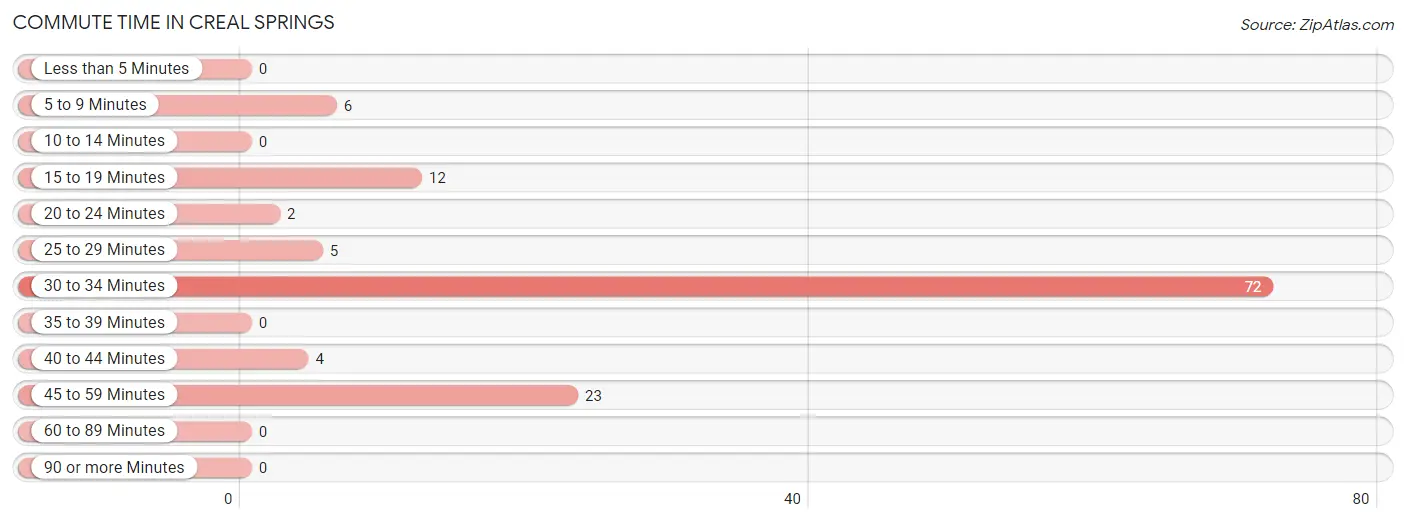
| Commute Time | # Commuters | % Commuters |
| Less than 5 Minutes | 0 | 0.0% |
| 5 to 9 Minutes | 6 | 4.8% |
| 10 to 14 Minutes | 0 | 0.0% |
| 15 to 19 Minutes | 12 | 9.7% |
| 20 to 24 Minutes | 2 | 1.6% |
| 25 to 29 Minutes | 5 | 4.0% |
| 30 to 34 Minutes | 72 | 58.1% |
| 35 to 39 Minutes | 0 | 0.0% |
| 40 to 44 Minutes | 4 | 3.2% |
| 45 to 59 Minutes | 23 | 18.5% |
| 60 to 89 Minutes | 0 | 0.0% |
| 90 or more Minutes | 0 | 0.0% |
Commute Time by Sex in Creal Springs
The most common commute times in Creal Springs are 30 to 34 minutes (30 commuters, 43.5%) for males and 30 to 34 minutes (42 commuters, 76.4%) for females.
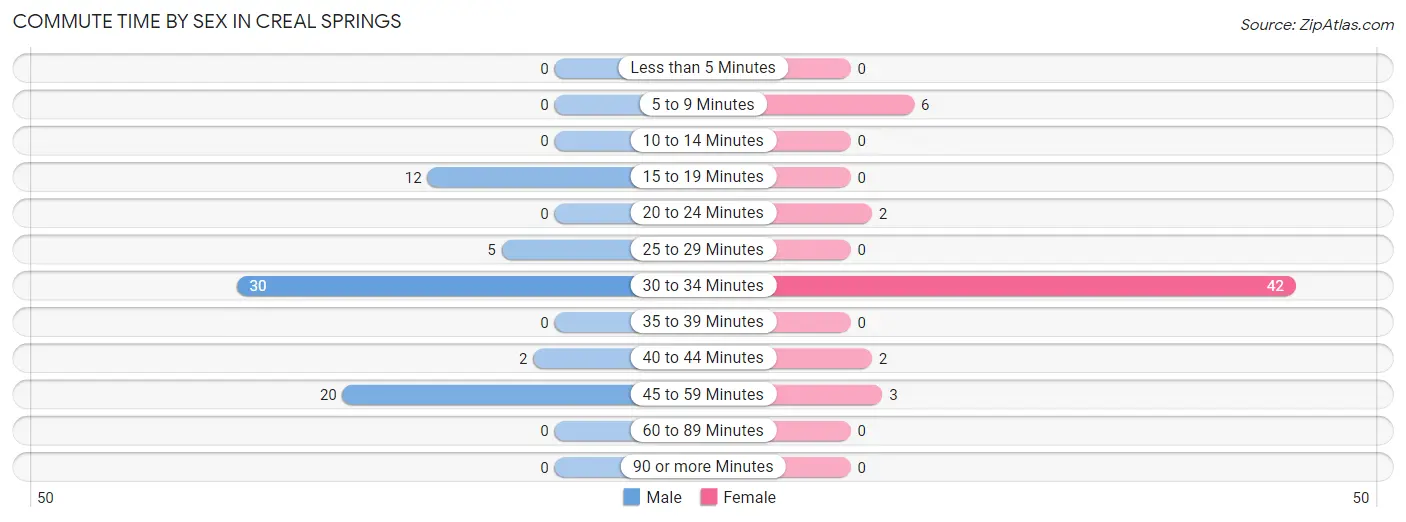
| Commute Time | Male | Female |
| Less than 5 Minutes | 0 (0.0%) | 0 (0.0%) |
| 5 to 9 Minutes | 0 (0.0%) | 6 (10.9%) |
| 10 to 14 Minutes | 0 (0.0%) | 0 (0.0%) |
| 15 to 19 Minutes | 12 (17.4%) | 0 (0.0%) |
| 20 to 24 Minutes | 0 (0.0%) | 2 (3.6%) |
| 25 to 29 Minutes | 5 (7.2%) | 0 (0.0%) |
| 30 to 34 Minutes | 30 (43.5%) | 42 (76.4%) |
| 35 to 39 Minutes | 0 (0.0%) | 0 (0.0%) |
| 40 to 44 Minutes | 2 (2.9%) | 2 (3.6%) |
| 45 to 59 Minutes | 20 (29.0%) | 3 (5.4%) |
| 60 to 89 Minutes | 0 (0.0%) | 0 (0.0%) |
| 90 or more Minutes | 0 (0.0%) | 0 (0.0%) |
Time of Departure to Work by Sex in Creal Springs
The most frequent times of departure to work in Creal Springs are 8:00 AM to 8:29 AM (27, 39.1%) for males and 8:00 AM to 8:29 AM (11, 20.0%) for females.
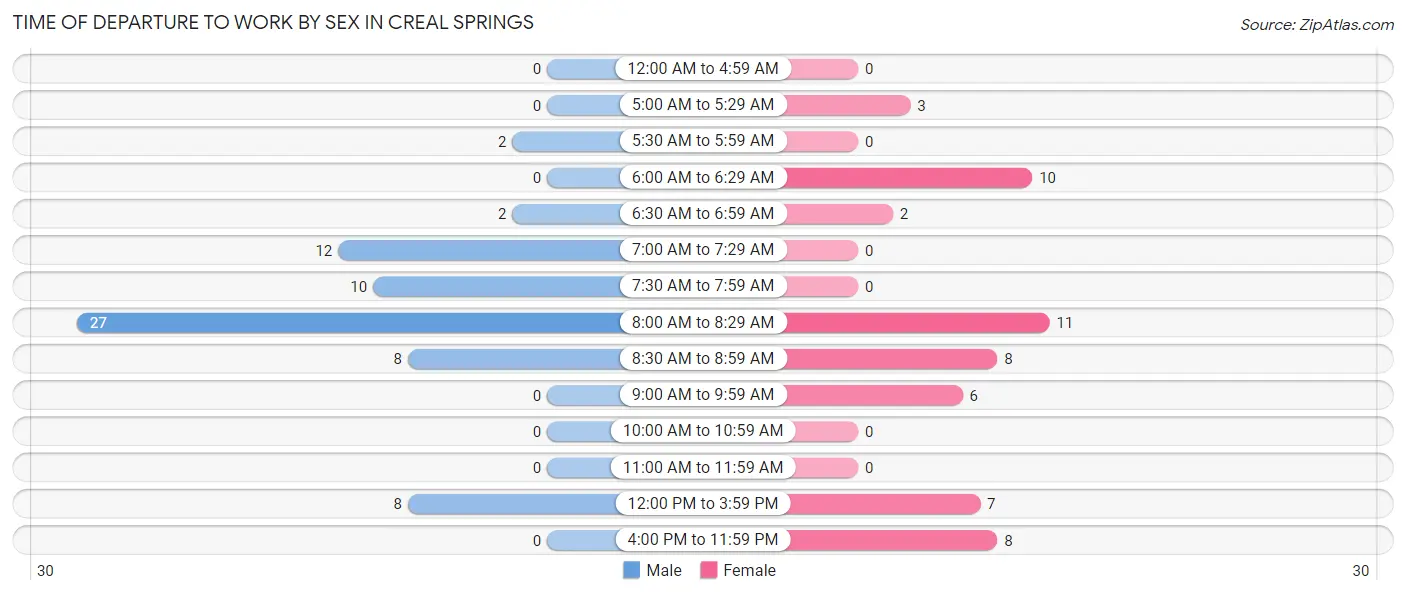
| Time of Departure | Male | Female |
| 12:00 AM to 4:59 AM | 0 (0.0%) | 0 (0.0%) |
| 5:00 AM to 5:29 AM | 0 (0.0%) | 3 (5.4%) |
| 5:30 AM to 5:59 AM | 2 (2.9%) | 0 (0.0%) |
| 6:00 AM to 6:29 AM | 0 (0.0%) | 10 (18.2%) |
| 6:30 AM to 6:59 AM | 2 (2.9%) | 2 (3.6%) |
| 7:00 AM to 7:29 AM | 12 (17.4%) | 0 (0.0%) |
| 7:30 AM to 7:59 AM | 10 (14.5%) | 0 (0.0%) |
| 8:00 AM to 8:29 AM | 27 (39.1%) | 11 (20.0%) |
| 8:30 AM to 8:59 AM | 8 (11.6%) | 8 (14.5%) |
| 9:00 AM to 9:59 AM | 0 (0.0%) | 6 (10.9%) |
| 10:00 AM to 10:59 AM | 0 (0.0%) | 0 (0.0%) |
| 11:00 AM to 11:59 AM | 0 (0.0%) | 0 (0.0%) |
| 12:00 PM to 3:59 PM | 8 (11.6%) | 7 (12.7%) |
| 4:00 PM to 11:59 PM | 0 (0.0%) | 8 (14.5%) |
| Total | 69 (100.0%) | 55 (100.0%) |
Housing Occupancy in Creal Springs
Occupancy by Ownership in Creal Springs
Of the total 180 dwellings in Creal Springs, owner-occupied units account for 138 (76.7%), while renter-occupied units make up 42 (23.3%).
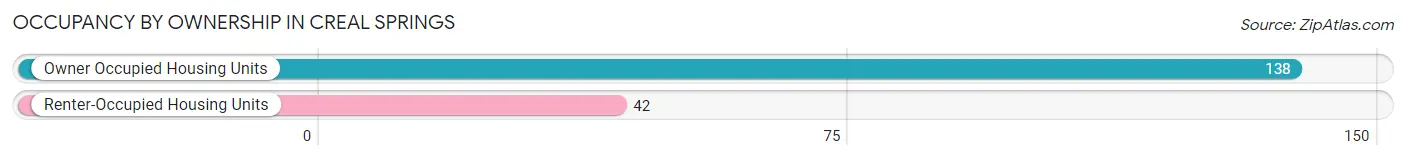
| Occupancy | # Housing Units | % Housing Units |
| Owner Occupied Housing Units | 138 | 76.7% |
| Renter-Occupied Housing Units | 42 | 23.3% |
| Total Occupied Housing Units | 180 | 100.0% |
Occupancy by Household Size in Creal Springs
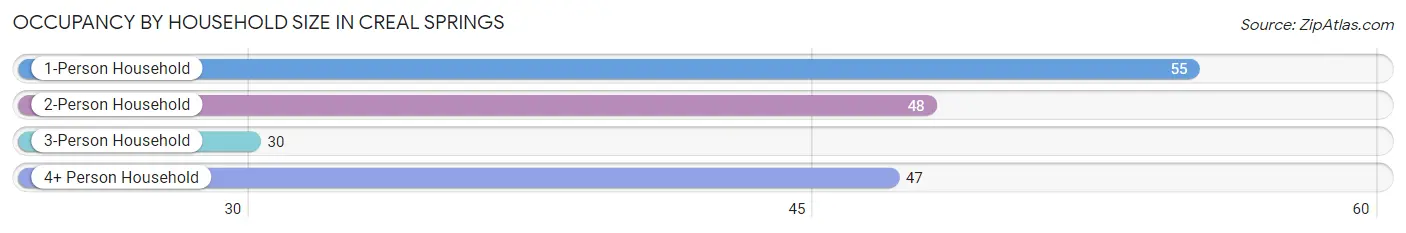
| Household Size | # Housing Units | % Housing Units |
| 1-Person Household | 55 | 30.6% |
| 2-Person Household | 48 | 26.7% |
| 3-Person Household | 30 | 16.7% |
| 4+ Person Household | 47 | 26.1% |
| Total Housing Units | 180 | 100.0% |
Occupancy by Ownership by Household Size in Creal Springs
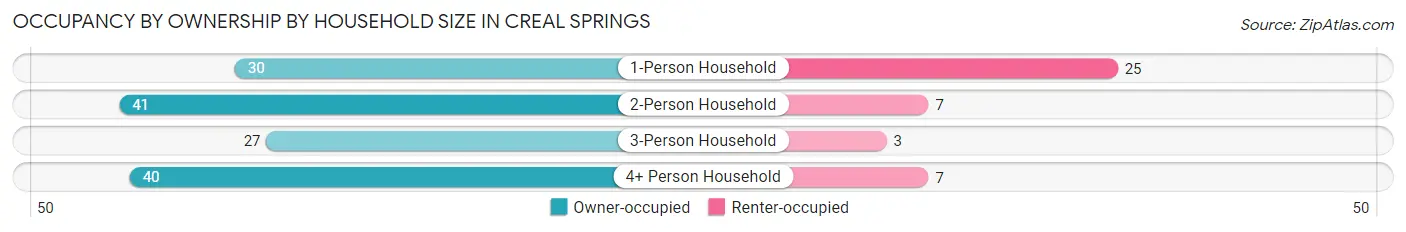
| Household Size | Owner-occupied | Renter-occupied |
| 1-Person Household | 30 (54.5%) | 25 (45.5%) |
| 2-Person Household | 41 (85.4%) | 7 (14.6%) |
| 3-Person Household | 27 (90.0%) | 3 (10.0%) |
| 4+ Person Household | 40 (85.1%) | 7 (14.9%) |
| Total Housing Units | 138 (76.7%) | 42 (23.3%) |
Occupancy by Educational Attainment in Creal Springs
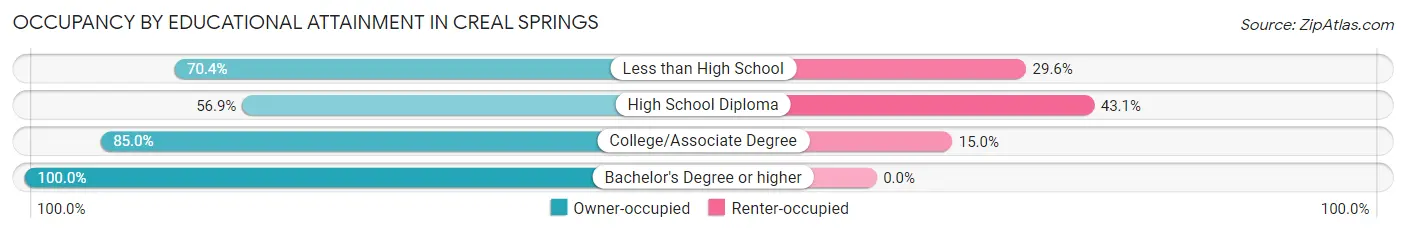
| Household Size | Owner-occupied | Renter-occupied |
| Less than High School | 19 (70.4%) | 8 (29.6%) |
| High School Diploma | 29 (56.9%) | 22 (43.1%) |
| College/Associate Degree | 68 (85.0%) | 12 (15.0%) |
| Bachelor's Degree or higher | 22 (100.0%) | 0 (0.0%) |
Occupancy by Age of Householder in Creal Springs
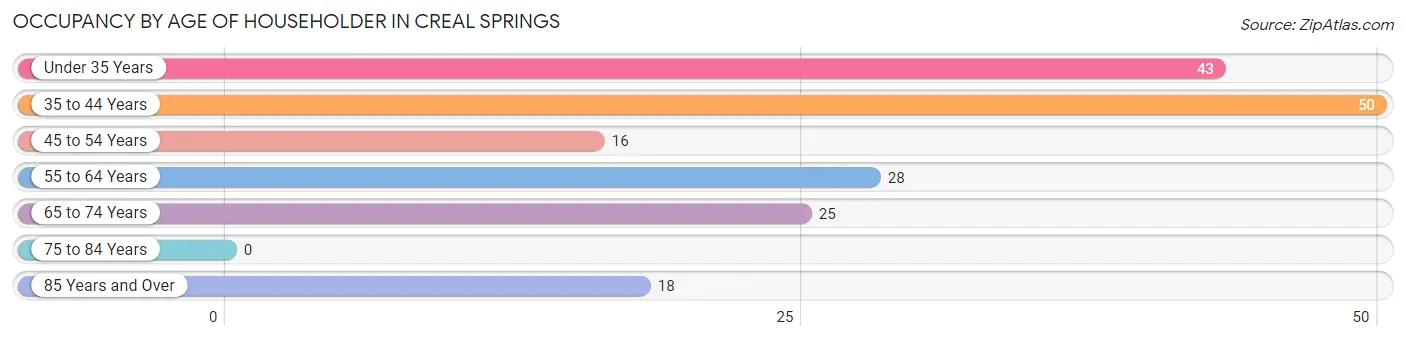
| Age Bracket | # Households | % Households |
| Under 35 Years | 43 | 23.9% |
| 35 to 44 Years | 50 | 27.8% |
| 45 to 54 Years | 16 | 8.9% |
| 55 to 64 Years | 28 | 15.6% |
| 65 to 74 Years | 25 | 13.9% |
| 75 to 84 Years | 0 | 0.0% |
| 85 Years and Over | 18 | 10.0% |
| Total | 180 | 100.0% |
Housing Finances in Creal Springs
Median Income by Occupancy in Creal Springs
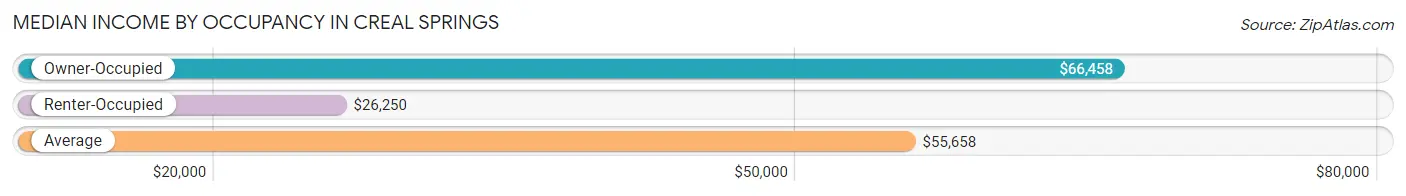
| Occupancy Type | # Households | Median Income |
| Owner-Occupied | 138 (76.7%) | $66,458 |
| Renter-Occupied | 42 (23.3%) | $26,250 |
| Average | 180 (100.0%) | $55,658 |
Occupancy by Householder Income Bracket in Creal Springs
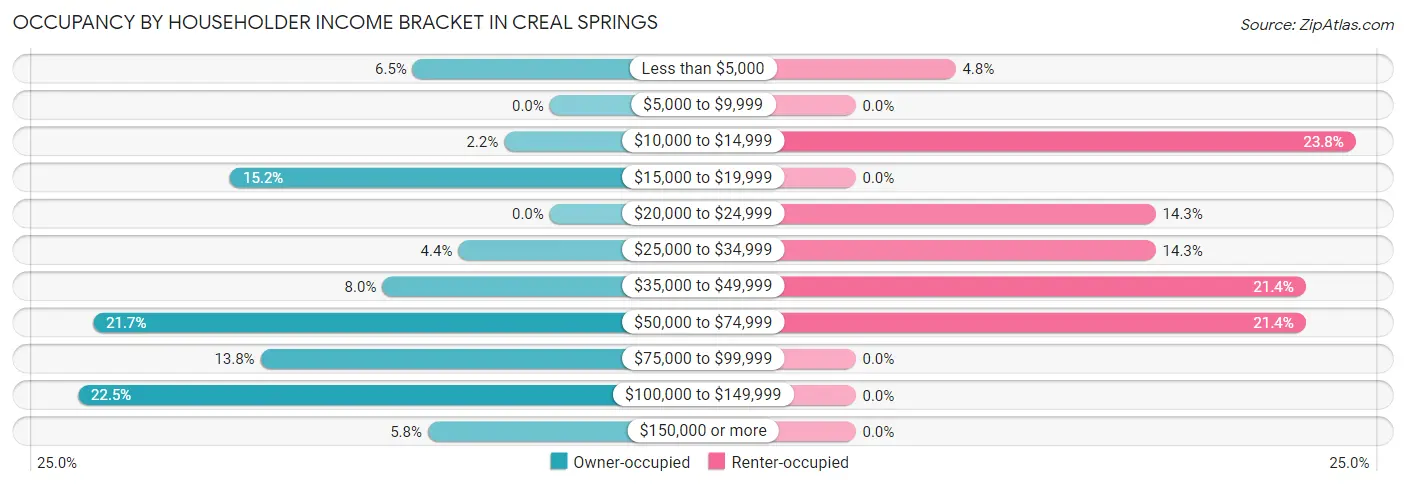
| Income Bracket | Owner-occupied | Renter-occupied |
| Less than $5,000 | 9 (6.5%) | 2 (4.8%) |
| $5,000 to $9,999 | 0 (0.0%) | 0 (0.0%) |
| $10,000 to $14,999 | 3 (2.2%) | 10 (23.8%) |
| $15,000 to $19,999 | 21 (15.2%) | 0 (0.0%) |
| $20,000 to $24,999 | 0 (0.0%) | 6 (14.3%) |
| $25,000 to $34,999 | 6 (4.3%) | 6 (14.3%) |
| $35,000 to $49,999 | 11 (8.0%) | 9 (21.4%) |
| $50,000 to $74,999 | 30 (21.7%) | 9 (21.4%) |
| $75,000 to $99,999 | 19 (13.8%) | 0 (0.0%) |
| $100,000 to $149,999 | 31 (22.5%) | 0 (0.0%) |
| $150,000 or more | 8 (5.8%) | 0 (0.0%) |
| Total | 138 (100.0%) | 42 (100.0%) |
Monthly Housing Cost Tiers in Creal Springs
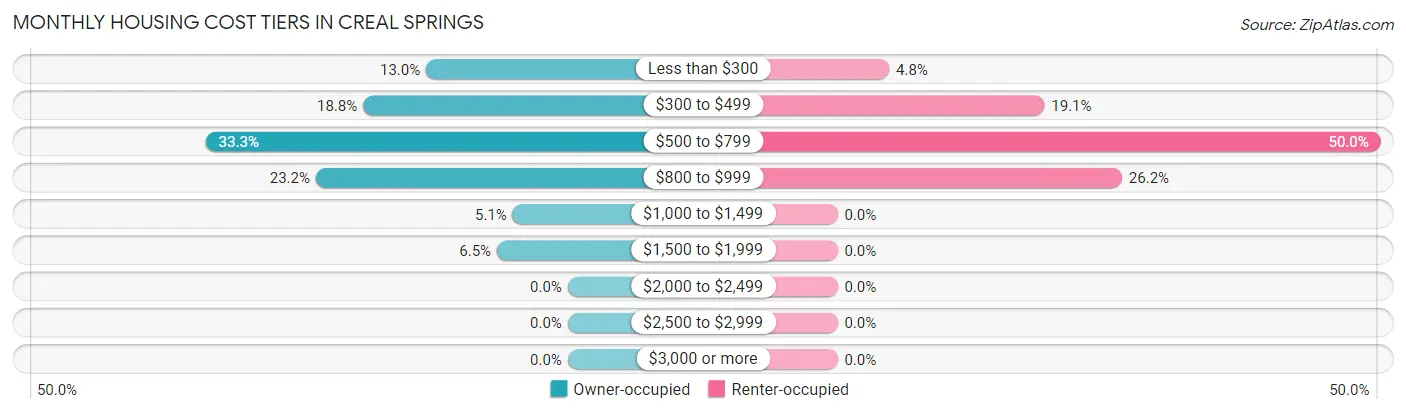
| Monthly Cost | Owner-occupied | Renter-occupied |
| Less than $300 | 18 (13.0%) | 2 (4.8%) |
| $300 to $499 | 26 (18.8%) | 8 (19.1%) |
| $500 to $799 | 46 (33.3%) | 21 (50.0%) |
| $800 to $999 | 32 (23.2%) | 11 (26.2%) |
| $1,000 to $1,499 | 7 (5.1%) | 0 (0.0%) |
| $1,500 to $1,999 | 9 (6.5%) | 0 (0.0%) |
| $2,000 to $2,499 | 0 (0.0%) | 0 (0.0%) |
| $2,500 to $2,999 | 0 (0.0%) | 0 (0.0%) |
| $3,000 or more | 0 (0.0%) | 0 (0.0%) |
| Total | 138 (100.0%) | 42 (100.0%) |
Physical Housing Characteristics in Creal Springs
Housing Structures in Creal Springs
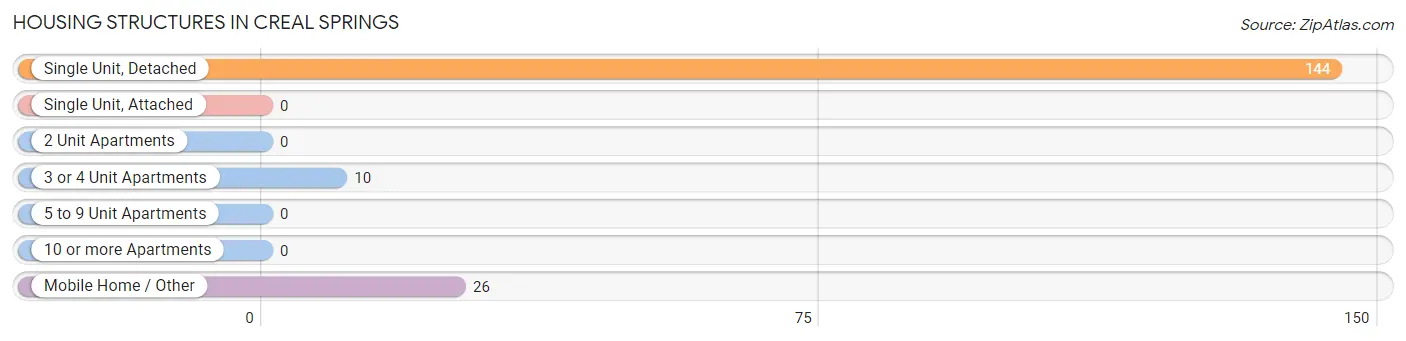
| Structure Type | # Housing Units | % Housing Units |
| Single Unit, Detached | 144 | 80.0% |
| Single Unit, Attached | 0 | 0.0% |
| 2 Unit Apartments | 0 | 0.0% |
| 3 or 4 Unit Apartments | 10 | 5.6% |
| 5 to 9 Unit Apartments | 0 | 0.0% |
| 10 or more Apartments | 0 | 0.0% |
| Mobile Home / Other | 26 | 14.4% |
| Total | 180 | 100.0% |
Housing Structures by Occupancy in Creal Springs
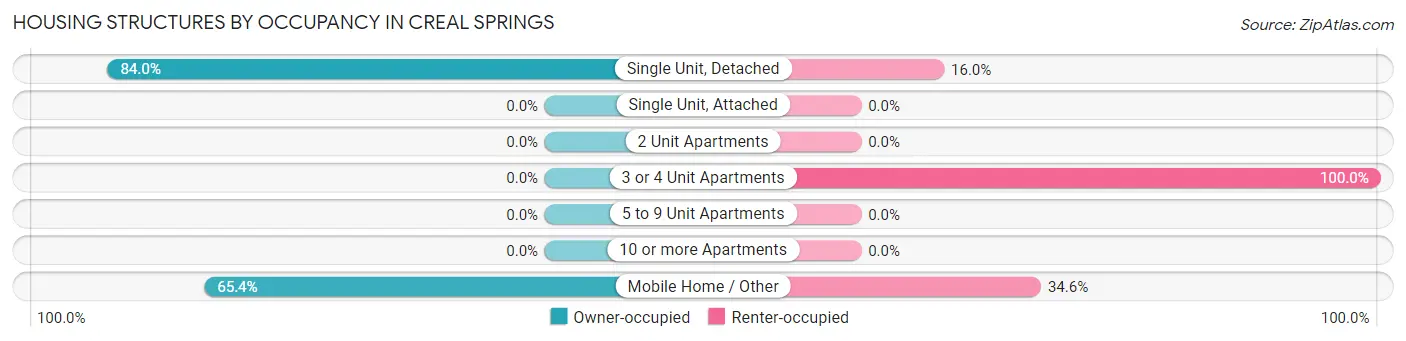
| Structure Type | Owner-occupied | Renter-occupied |
| Single Unit, Detached | 121 (84.0%) | 23 (16.0%) |
| Single Unit, Attached | 0 (0.0%) | 0 (0.0%) |
| 2 Unit Apartments | 0 (0.0%) | 0 (0.0%) |
| 3 or 4 Unit Apartments | 0 (0.0%) | 10 (100.0%) |
| 5 to 9 Unit Apartments | 0 (0.0%) | 0 (0.0%) |
| 10 or more Apartments | 0 (0.0%) | 0 (0.0%) |
| Mobile Home / Other | 17 (65.4%) | 9 (34.6%) |
| Total | 138 (76.7%) | 42 (23.3%) |
Housing Structures by Number of Rooms in Creal Springs
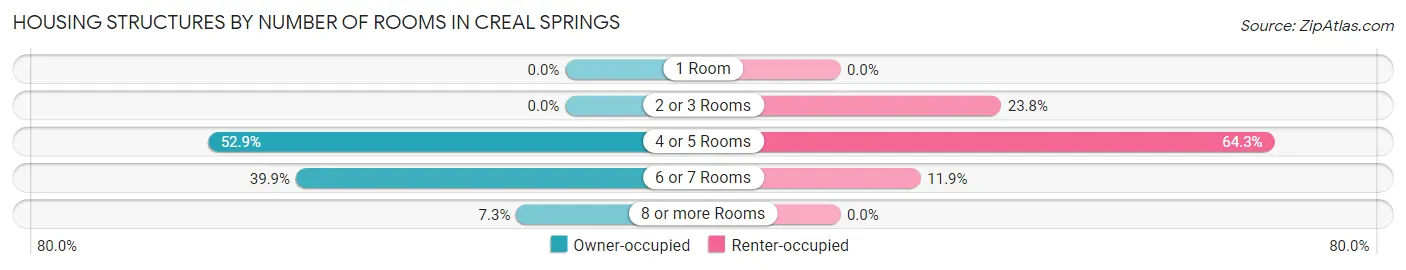
| Number of Rooms | Owner-occupied | Renter-occupied |
| 1 Room | 0 (0.0%) | 0 (0.0%) |
| 2 or 3 Rooms | 0 (0.0%) | 10 (23.8%) |
| 4 or 5 Rooms | 73 (52.9%) | 27 (64.3%) |
| 6 or 7 Rooms | 55 (39.9%) | 5 (11.9%) |
| 8 or more Rooms | 10 (7.2%) | 0 (0.0%) |
| Total | 138 (100.0%) | 42 (100.0%) |
Housing Structure by Heating Type in Creal Springs
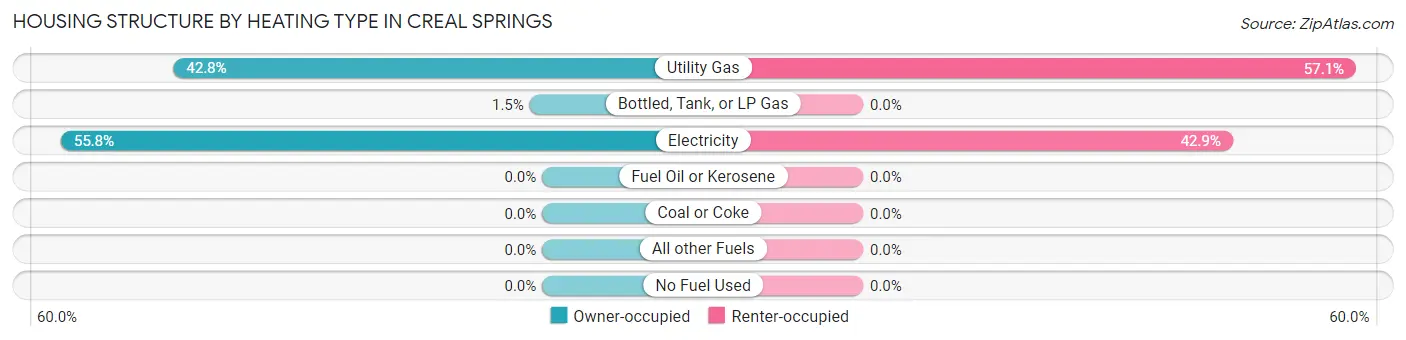
| Heating Type | Owner-occupied | Renter-occupied |
| Utility Gas | 59 (42.7%) | 24 (57.1%) |
| Bottled, Tank, or LP Gas | 2 (1.5%) | 0 (0.0%) |
| Electricity | 77 (55.8%) | 18 (42.9%) |
| Fuel Oil or Kerosene | 0 (0.0%) | 0 (0.0%) |
| Coal or Coke | 0 (0.0%) | 0 (0.0%) |
| All other Fuels | 0 (0.0%) | 0 (0.0%) |
| No Fuel Used | 0 (0.0%) | 0 (0.0%) |
| Total | 138 (100.0%) | 42 (100.0%) |
Household Vehicle Usage in Creal Springs
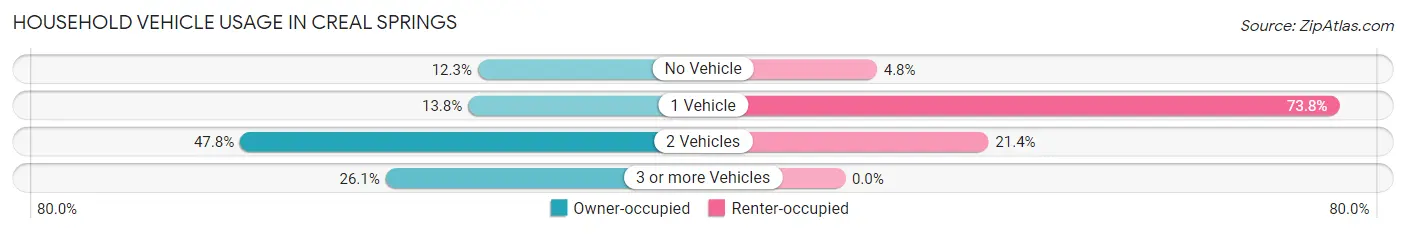
| Vehicles per Household | Owner-occupied | Renter-occupied |
| No Vehicle | 17 (12.3%) | 2 (4.8%) |
| 1 Vehicle | 19 (13.8%) | 31 (73.8%) |
| 2 Vehicles | 66 (47.8%) | 9 (21.4%) |
| 3 or more Vehicles | 36 (26.1%) | 0 (0.0%) |
| Total | 138 (100.0%) | 42 (100.0%) |
Real Estate & Mortgages in Creal Springs
Real Estate and Mortgage Overview in Creal Springs
| Characteristic | Without Mortgage | With Mortgage |
| Housing Units | 74 | 64 |
| Median Property Value | $52,800 | $95,800 |
| Median Household Income | - | - |
| Monthly Housing Costs | $473 | $0 |
| Real Estate Taxes | $806 | $0 |
Property Value by Mortgage Status in Creal Springs
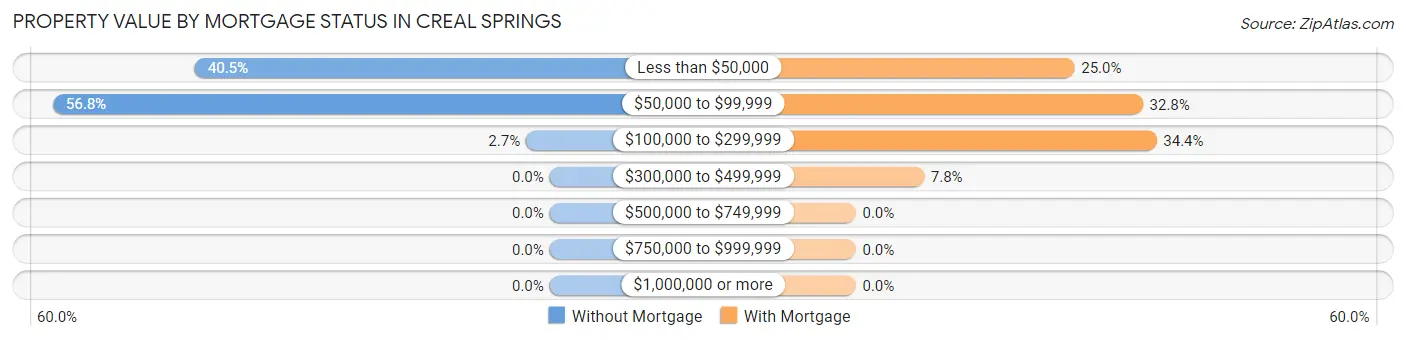
| Property Value | Without Mortgage | With Mortgage |
| Less than $50,000 | 30 (40.5%) | 16 (25.0%) |
| $50,000 to $99,999 | 42 (56.8%) | 21 (32.8%) |
| $100,000 to $299,999 | 2 (2.7%) | 22 (34.4%) |
| $300,000 to $499,999 | 0 (0.0%) | 5 (7.8%) |
| $500,000 to $749,999 | 0 (0.0%) | 0 (0.0%) |
| $750,000 to $999,999 | 0 (0.0%) | 0 (0.0%) |
| $1,000,000 or more | 0 (0.0%) | 0 (0.0%) |
| Total | 74 (100.0%) | 64 (100.0%) |
Household Income by Mortgage Status in Creal Springs
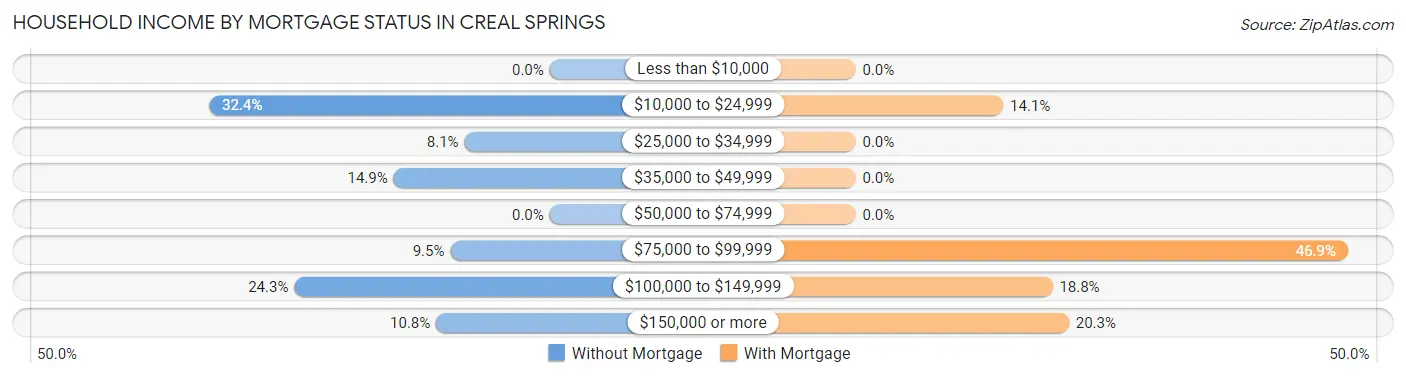
| Household Income | Without Mortgage | With Mortgage |
| Less than $10,000 | 0 (0.0%) | 0 (0.0%) |
| $10,000 to $24,999 | 24 (32.4%) | 9 (14.1%) |
| $25,000 to $34,999 | 6 (8.1%) | 0 (0.0%) |
| $35,000 to $49,999 | 11 (14.9%) | 0 (0.0%) |
| $50,000 to $74,999 | 0 (0.0%) | 0 (0.0%) |
| $75,000 to $99,999 | 7 (9.5%) | 30 (46.9%) |
| $100,000 to $149,999 | 18 (24.3%) | 12 (18.8%) |
| $150,000 or more | 8 (10.8%) | 13 (20.3%) |
| Total | 74 (100.0%) | 64 (100.0%) |
Property Value to Household Income Ratio in Creal Springs
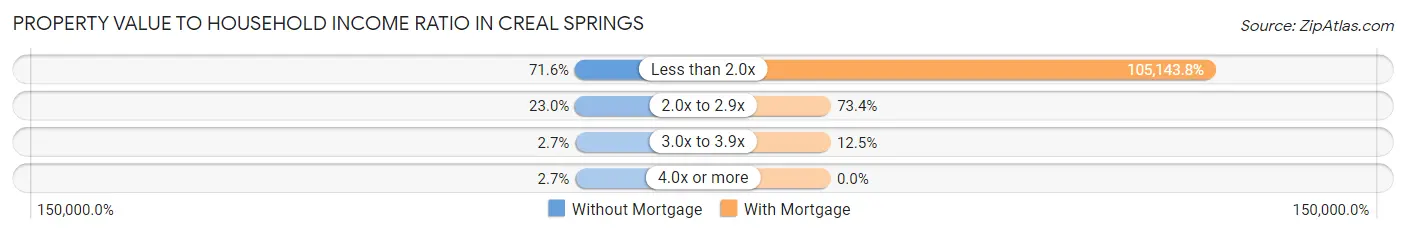
| Value-to-Income Ratio | Without Mortgage | With Mortgage |
| Less than 2.0x | 53 (71.6%) | 67,292 (105,143.8%) |
| 2.0x to 2.9x | 17 (23.0%) | 47 (73.4%) |
| 3.0x to 3.9x | 2 (2.7%) | 8 (12.5%) |
| 4.0x or more | 2 (2.7%) | 0 (0.0%) |
| Total | 74 (100.0%) | 64 (100.0%) |
Real Estate Taxes by Mortgage Status in Creal Springs
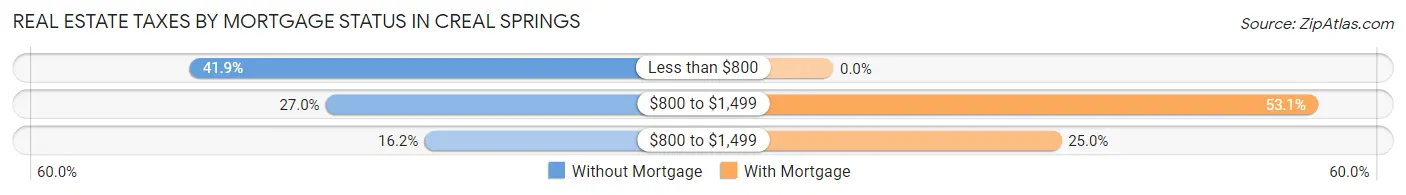
| Property Taxes | Without Mortgage | With Mortgage |
| Less than $800 | 31 (41.9%) | 0 (0.0%) |
| $800 to $1,499 | 20 (27.0%) | 34 (53.1%) |
| $800 to $1,499 | 12 (16.2%) | 16 (25.0%) |
| Total | 74 (100.0%) | 64 (100.0%) |
Health & Disability in Creal Springs
Health Insurance Coverage by Age in Creal Springs
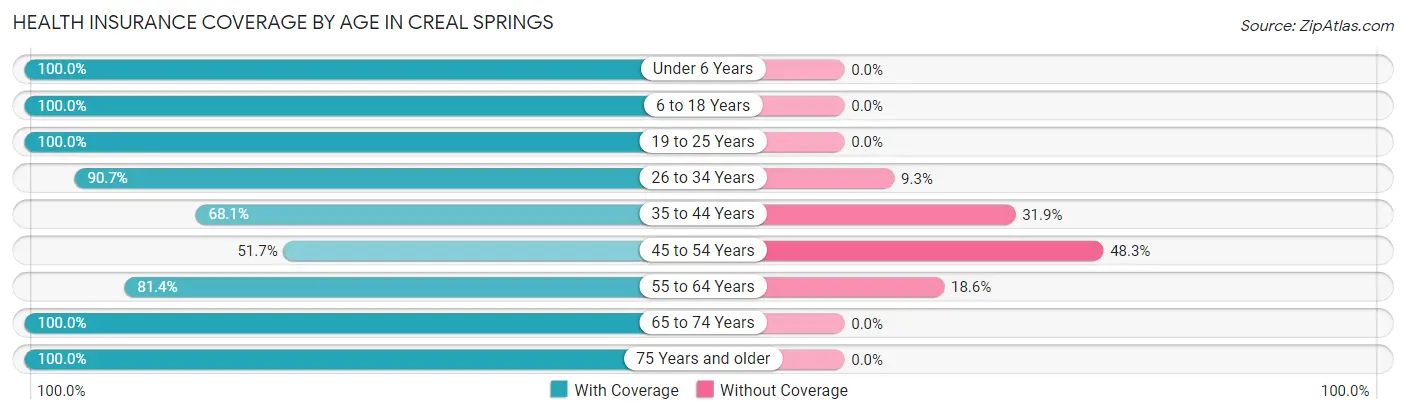
| Age Bracket | With Coverage | Without Coverage |
| Under 6 Years | 45 (100.0%) | 0 (0.0%) |
| 6 to 18 Years | 81 (100.0%) | 0 (0.0%) |
| 19 to 25 Years | 17 (100.0%) | 0 (0.0%) |
| 26 to 34 Years | 78 (90.7%) | 8 (9.3%) |
| 35 to 44 Years | 47 (68.1%) | 22 (31.9%) |
| 45 to 54 Years | 15 (51.7%) | 14 (48.3%) |
| 55 to 64 Years | 35 (81.4%) | 8 (18.6%) |
| 65 to 74 Years | 32 (100.0%) | 0 (0.0%) |
| 75 Years and older | 23 (100.0%) | 0 (0.0%) |
| Total | 373 (87.8%) | 52 (12.2%) |
Health Insurance Coverage by Citizenship Status in Creal Springs
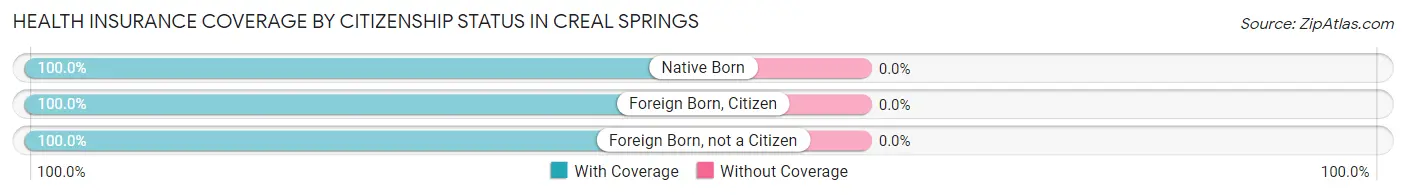
| Citizenship Status | With Coverage | Without Coverage |
| Native Born | 45 (100.0%) | 0 (0.0%) |
| Foreign Born, Citizen | 81 (100.0%) | 0 (0.0%) |
| Foreign Born, not a Citizen | 17 (100.0%) | 0 (0.0%) |
Health Insurance Coverage by Household Income in Creal Springs
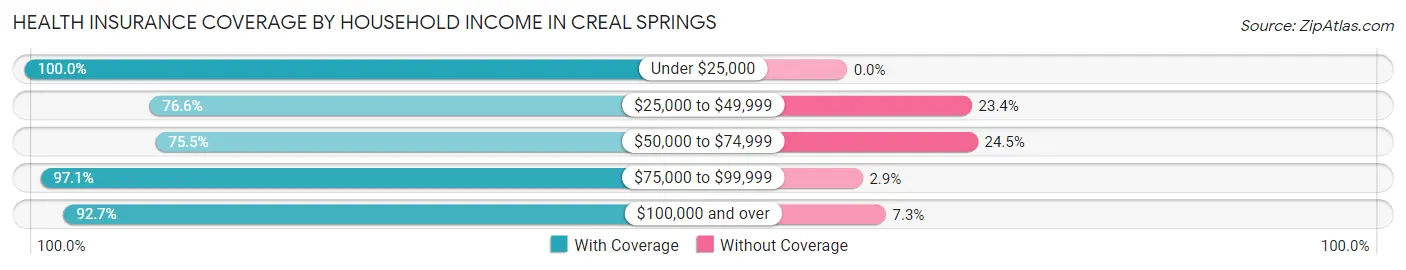
| Household Income | With Coverage | Without Coverage |
| Under $25,000 | 72 (100.0%) | 0 (0.0%) |
| $25,000 to $49,999 | 59 (76.6%) | 18 (23.4%) |
| $50,000 to $74,999 | 74 (75.5%) | 24 (24.5%) |
| $75,000 to $99,999 | 66 (97.1%) | 2 (2.9%) |
| $100,000 and over | 102 (92.7%) | 8 (7.3%) |
Public vs Private Health Insurance Coverage by Age in Creal Springs
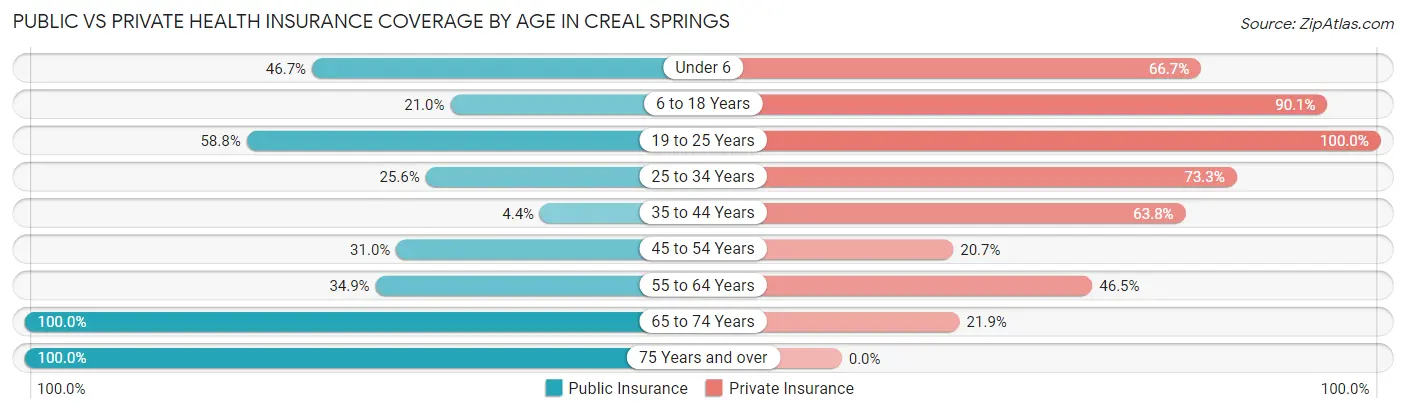
| Age Bracket | Public Insurance | Private Insurance |
| Under 6 | 21 (46.7%) | 30 (66.7%) |
| 6 to 18 Years | 17 (21.0%) | 73 (90.1%) |
| 19 to 25 Years | 10 (58.8%) | 17 (100.0%) |
| 25 to 34 Years | 22 (25.6%) | 63 (73.3%) |
| 35 to 44 Years | 3 (4.3%) | 44 (63.8%) |
| 45 to 54 Years | 9 (31.0%) | 6 (20.7%) |
| 55 to 64 Years | 15 (34.9%) | 20 (46.5%) |
| 65 to 74 Years | 32 (100.0%) | 7 (21.9%) |
| 75 Years and over | 23 (100.0%) | 0 (0.0%) |
| Total | 152 (35.8%) | 260 (61.2%) |
Disability Status by Sex by Age in Creal Springs
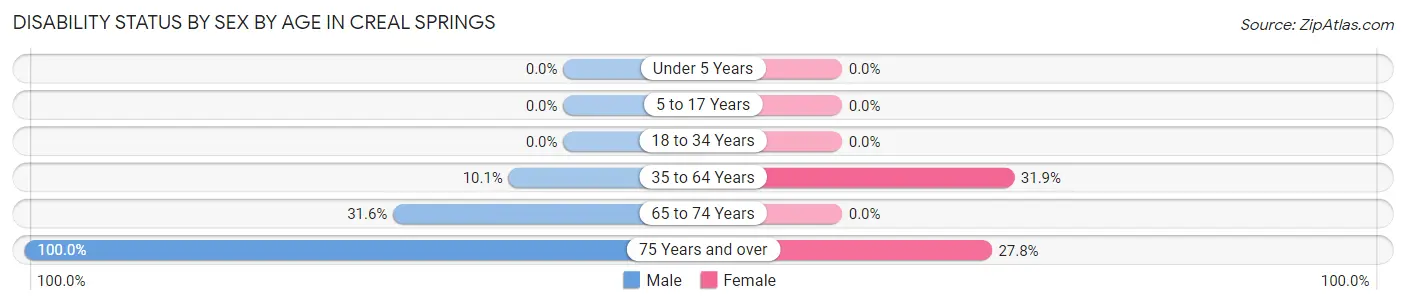
| Age Bracket | Male | Female |
| Under 5 Years | 0 (0.0%) | 0 (0.0%) |
| 5 to 17 Years | 0 (0.0%) | 0 (0.0%) |
| 18 to 34 Years | 0 (0.0%) | 0 (0.0%) |
| 35 to 64 Years | 7 (10.1%) | 23 (31.9%) |
| 65 to 74 Years | 6 (31.6%) | 0 (0.0%) |
| 75 Years and over | 5 (100.0%) | 5 (27.8%) |
Disability Class by Sex by Age in Creal Springs
Disability Class: Hearing Difficulty
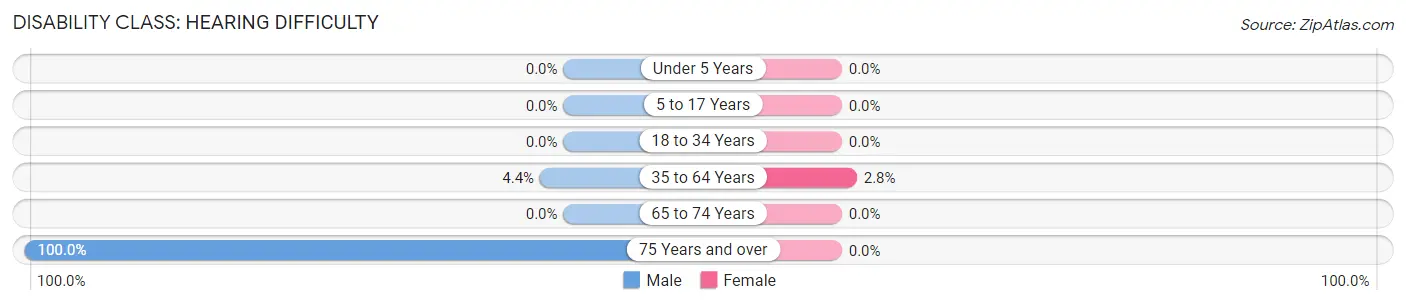
| Age Bracket | Male | Female |
| Under 5 Years | 0 (0.0%) | 0 (0.0%) |
| 5 to 17 Years | 0 (0.0%) | 0 (0.0%) |
| 18 to 34 Years | 0 (0.0%) | 0 (0.0%) |
| 35 to 64 Years | 3 (4.3%) | 2 (2.8%) |
| 65 to 74 Years | 0 (0.0%) | 0 (0.0%) |
| 75 Years and over | 5 (100.0%) | 0 (0.0%) |
Disability Class: Vision Difficulty
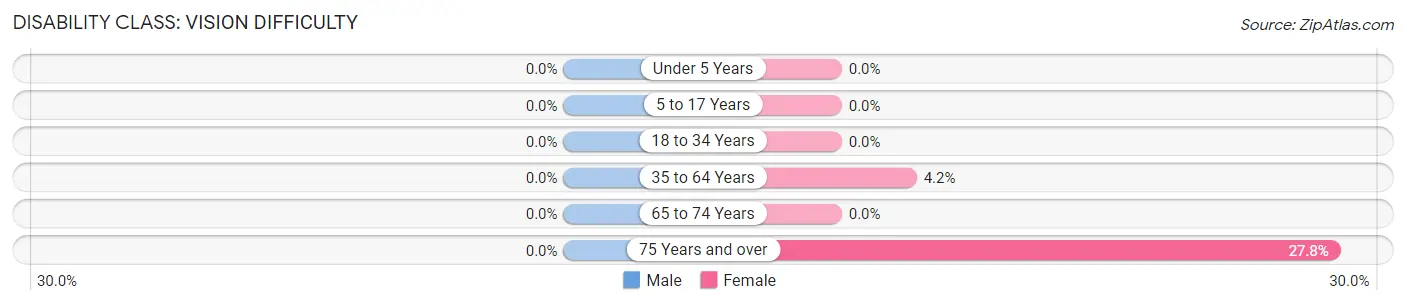
| Age Bracket | Male | Female |
| Under 5 Years | 0 (0.0%) | 0 (0.0%) |
| 5 to 17 Years | 0 (0.0%) | 0 (0.0%) |
| 18 to 34 Years | 0 (0.0%) | 0 (0.0%) |
| 35 to 64 Years | 0 (0.0%) | 3 (4.2%) |
| 65 to 74 Years | 0 (0.0%) | 0 (0.0%) |
| 75 Years and over | 0 (0.0%) | 5 (27.8%) |
Disability Class: Cognitive Difficulty
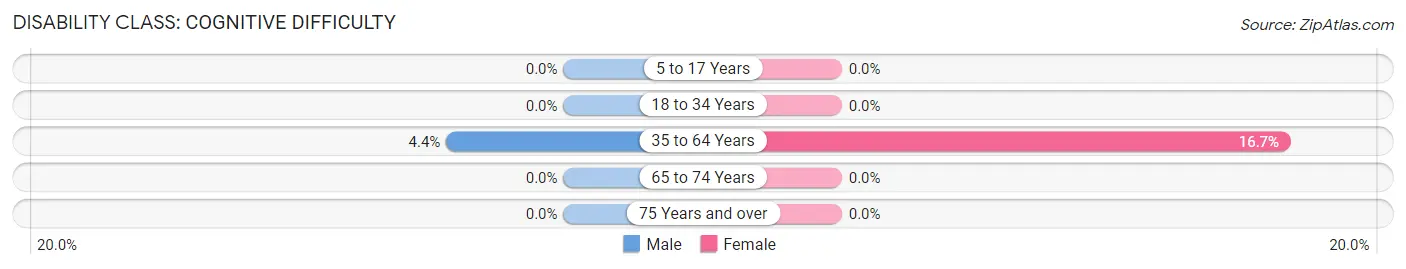
| Age Bracket | Male | Female |
| 5 to 17 Years | 0 (0.0%) | 0 (0.0%) |
| 18 to 34 Years | 0 (0.0%) | 0 (0.0%) |
| 35 to 64 Years | 3 (4.3%) | 12 (16.7%) |
| 65 to 74 Years | 0 (0.0%) | 0 (0.0%) |
| 75 Years and over | 0 (0.0%) | 0 (0.0%) |
Disability Class: Ambulatory Difficulty
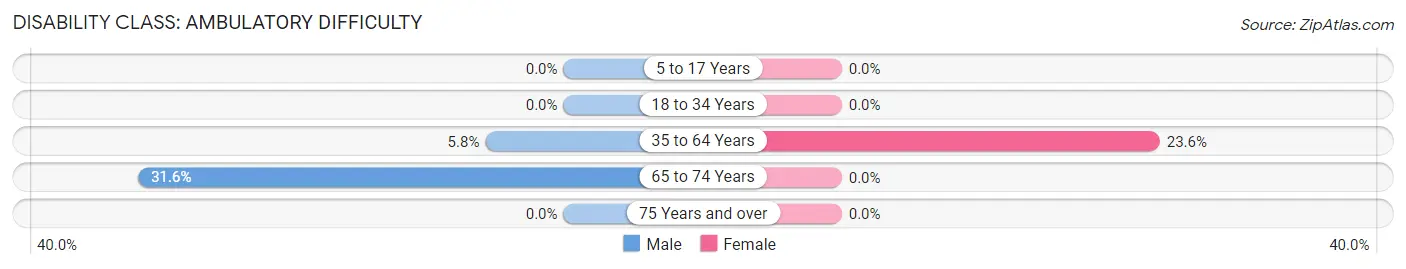
| Age Bracket | Male | Female |
| 5 to 17 Years | 0 (0.0%) | 0 (0.0%) |
| 18 to 34 Years | 0 (0.0%) | 0 (0.0%) |
| 35 to 64 Years | 4 (5.8%) | 17 (23.6%) |
| 65 to 74 Years | 6 (31.6%) | 0 (0.0%) |
| 75 Years and over | 0 (0.0%) | 0 (0.0%) |
Disability Class: Self-Care Difficulty
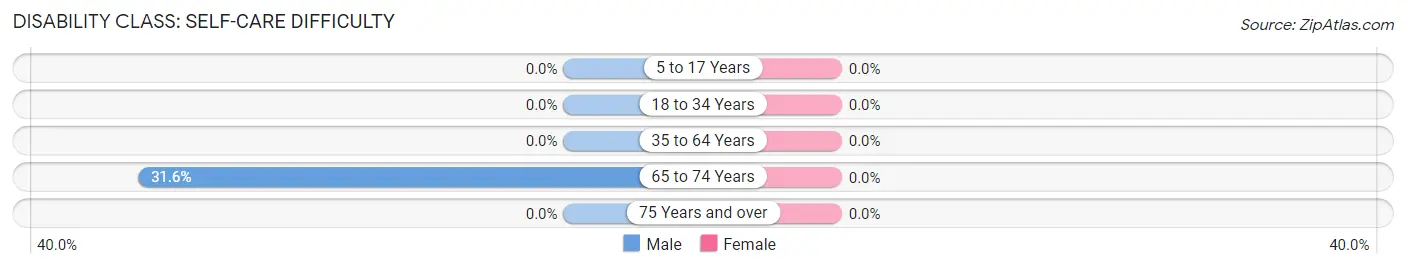
| Age Bracket | Male | Female |
| 5 to 17 Years | 0 (0.0%) | 0 (0.0%) |
| 18 to 34 Years | 0 (0.0%) | 0 (0.0%) |
| 35 to 64 Years | 0 (0.0%) | 0 (0.0%) |
| 65 to 74 Years | 6 (31.6%) | 0 (0.0%) |
| 75 Years and over | 0 (0.0%) | 0 (0.0%) |
Technology Access in Creal Springs
Computing Device Access in Creal Springs
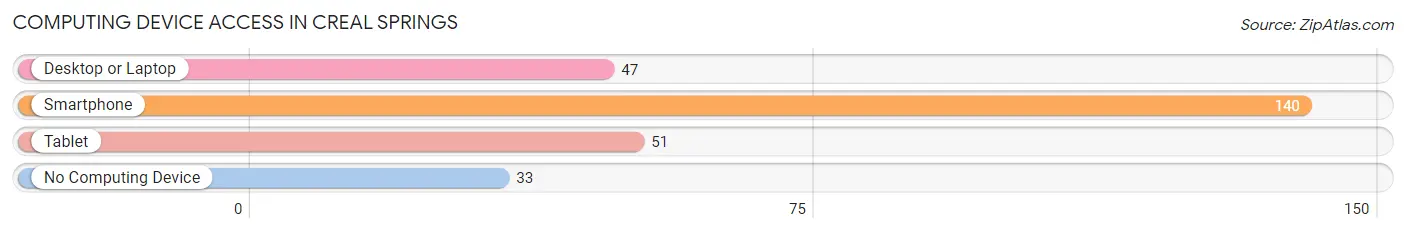
| Device Type | # Households | % Households |
| Desktop or Laptop | 47 | 26.1% |
| Smartphone | 140 | 77.8% |
| Tablet | 51 | 28.3% |
| No Computing Device | 33 | 18.3% |
| Total | 180 | 100.0% |
Internet Access in Creal Springs
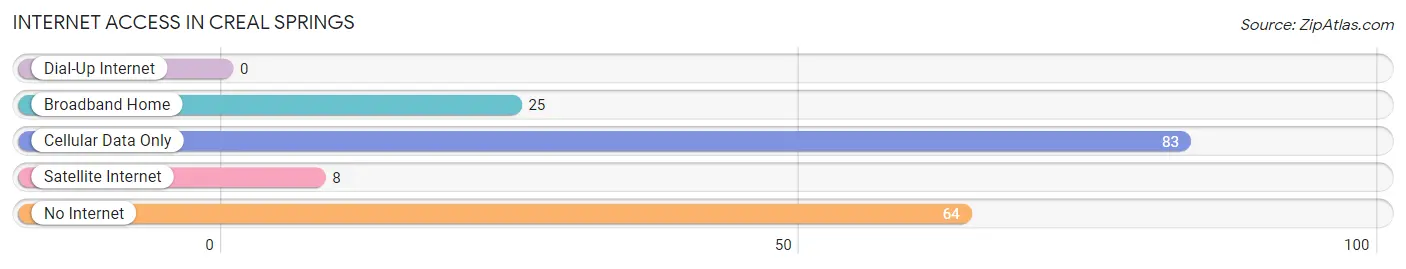
| Internet Type | # Households | % Households |
| Dial-Up Internet | 0 | 0.0% |
| Broadband Home | 25 | 13.9% |
| Cellular Data Only | 83 | 46.1% |
| Satellite Internet | 8 | 4.4% |
| No Internet | 64 | 35.6% |
| Total | 180 | 100.0% |
Creal Springs Summary
Creal Springs, Illinois is a small village located in Williamson County, Illinois. It is situated on the banks of the Saline River, about 10 miles south of Marion, the county seat. The village has a population of 1,093 as of the 2010 census.
History
Creal Springs was founded in 1883 by William Creal, a local farmer. He named the village after his family’s homestead, which was located near the Saline River. The village was incorporated in 1887.
In the early 1900s, Creal Springs was a thriving community with a variety of businesses, including a general store, a blacksmith shop, a hotel, a bank, and a post office. The village also had a school, a church, and a cemetery.
In the 1920s, the village began to decline as the railroad bypassed it and the population began to move away. The Great Depression further exacerbated the decline, and by the 1940s, the village was nearly abandoned.
In the 1950s, the village began to experience a resurgence as new businesses opened and the population began to grow. The village was officially reincorporated in 1959.
Geography
Creal Springs is located in the southern part of Williamson County, Illinois. It is situated on the banks of the Saline River, about 10 miles south of Marion, the county seat. The village has a total area of 0.6 square miles, all of which is land.
The village is located in the Shawnee National Forest, which is home to a variety of wildlife, including deer, wild turkeys, and bald eagles. The forest also contains a variety of plants, including wildflowers, ferns, and mosses.
Economy
The economy of Creal Springs is largely based on agriculture and tourism. The village is home to several farms, which produce a variety of crops, including corn, soybeans, and wheat.
The village is also home to several tourist attractions, including the Saline River Wildlife Refuge, the Creal Springs Historical Museum, and the Creal Springs Golf Course.
Demographics
As of the 2010 census, the population of Creal Springs was 1,093. The racial makeup of the village was 97.3% White, 0.7% African American, 0.2% Native American, 0.2% Asian, 0.2% from other races, and 1.6% from two or more races. Hispanic or Latino of any race were 1.2% of the population.
The median income for a household in the village was $37,500, and the median income for a family was $41,250. The per capita income for the village was $17,845. About 11.2% of families and 13.2% of the population were below the poverty line, including 17.2% of those under age 18 and 8.3% of those age 65 or over.
Common Questions
What is Per Capita Income in Creal Springs?
Per Capita income in Creal Springs is $25,640.
What is the Median Family Income in Creal Springs?
Median Family Income in Creal Springs is $66,042.
What is the Median Household income in Creal Springs?
Median Household Income in Creal Springs is $55,658.
What is Inequality or Gini Index in Creal Springs?
Inequality or Gini Index in Creal Springs is 0.43.
What is the Total Population of Creal Springs?
Total Population of Creal Springs is 425.
What is the Total Male Population of Creal Springs?
Total Male Population of Creal Springs is 206.
What is the Total Female Population of Creal Springs?
Total Female Population of Creal Springs is 219.
What is the Ratio of Males per 100 Females in Creal Springs?
There are 94.06 Males per 100 Females in Creal Springs.
What is the Ratio of Females per 100 Males in Creal Springs?
There are 106.31 Females per 100 Males in Creal Springs.
What is the Median Population Age in Creal Springs?
Median Population Age in Creal Springs is 34.3 Years.
What is the Average Family Size in Creal Springs
Average Family Size in Creal Springs is 3.0 People.
What is the Average Household Size in Creal Springs
Average Household Size in Creal Springs is 2.4 People.
How Large is the Labor Force in Creal Springs?
There are 172 People in the Labor Forcein in Creal Springs.
What is the Percentage of People in the Labor Force in Creal Springs?
55.5% of People are in the Labor Force in Creal Springs.
What is the Unemployment Rate in Creal Springs?
Unemployment Rate in Creal Springs is 10.5%.