Colfax, IL Map & Demographics
Colfax Map
Colfax Overview
$39,797
PER CAPITA INCOME
$59,706
AVG FAMILY INCOME
$63,750
AVG HOUSEHOLD INCOME
38.9%
WAGE / INCOME GAP [ % ]
61.1¢/ $1
WAGE / INCOME GAP [ $ ]
0.53
INEQUALITY / GINI INDEX
1,017
TOTAL POPULATION
454
MALE POPULATION
563
FEMALE POPULATION
80.64
MALES / 100 FEMALES
124.01
FEMALES / 100 MALES
34.4
MEDIAN AGE
3.1
AVG FAMILY SIZE
2.7
AVG HOUSEHOLD SIZE
527
LABOR FORCE [ PEOPLE ]
66.8%
PERCENT IN LABOR FORCE
6.6%
UNEMPLOYMENT RATE
Colfax Zip Codes
Colfax Area Codes
Income in Colfax
Income Overview in Colfax
Per Capita Income in Colfax is $39,797, while median incomes of families and households are $59,706 and $63,750 respectively.
| Characteristic | Number | Measure |
| Per Capita Income | 1,017 | $39,797 |
| Median Family Income | 240 | $59,706 |
| Mean Family Income | 240 | $86,590 |
| Median Household Income | 366 | $63,750 |
| Mean Household Income | 366 | $106,649 |
| Income Deficit | 240 | $0 |
| Wage / Income Gap (%) | 1,017 | 38.88% |
| Wage / Income Gap ($) | 1,017 | 61.12¢ per $1 |
| Gini / Inequality Index | 1,017 | 0.53 |
Earnings by Sex in Colfax
Average Earnings in Colfax are $40,288, $46,250 for men and $28,269 for women, a difference of 38.9%.
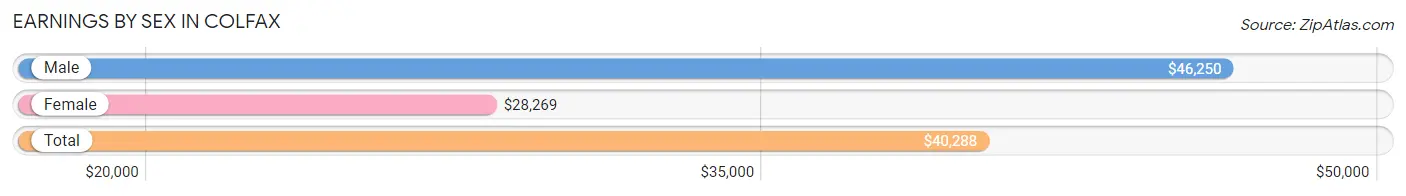
| Sex | Number | Average Earnings |
| Male | 303 (55.0%) | $46,250 |
| Female | 248 (45.0%) | $28,269 |
| Total | 551 (100.0%) | $40,288 |
Earnings by Sex by Income Bracket in Colfax
The most common earnings brackets in Colfax are $100,000+ for men (45 | 14.8%) and $45,000 to $49,999 for women (35 | 14.1%).
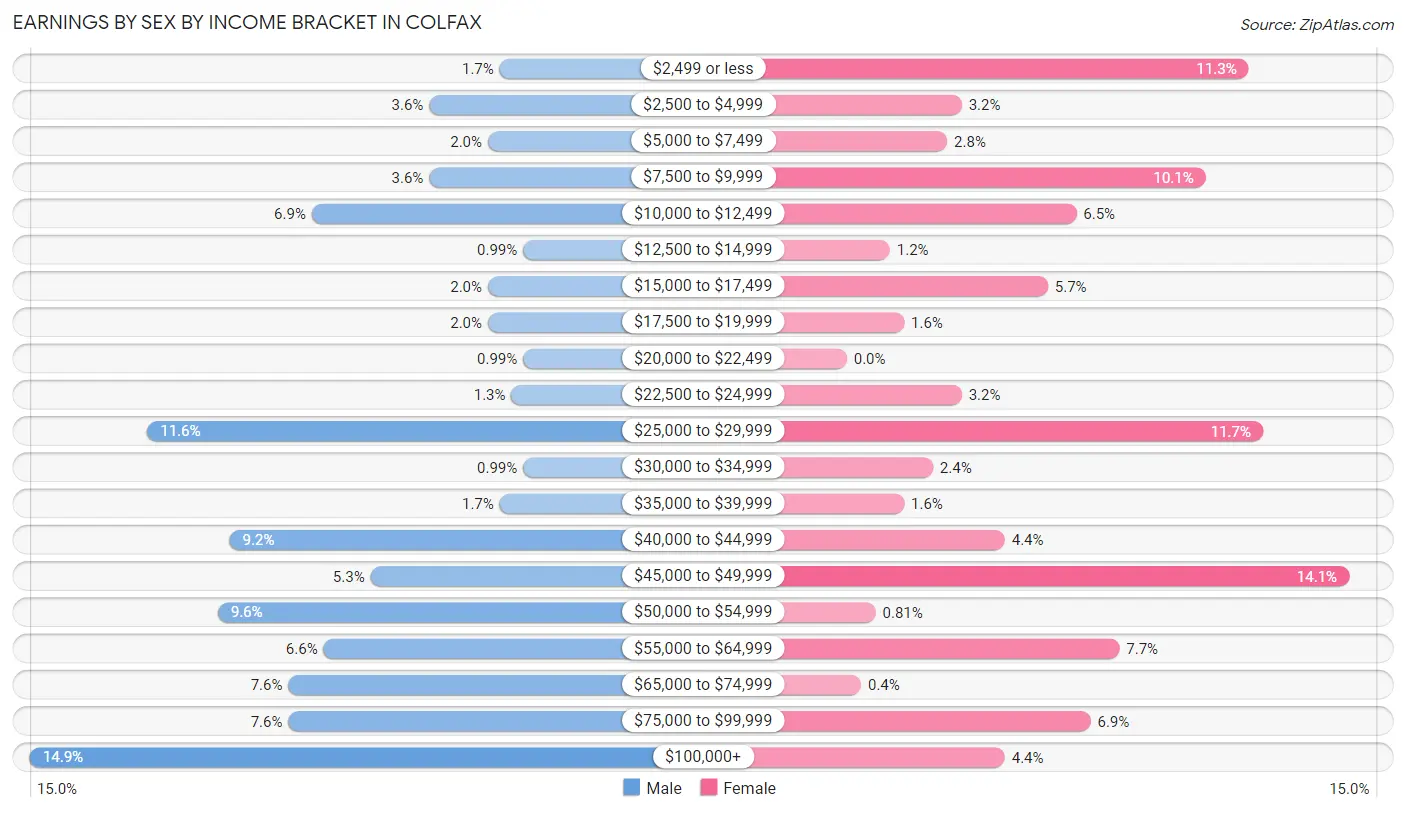
| Income | Male | Female |
| $2,499 or less | 5 (1.7%) | 28 (11.3%) |
| $2,500 to $4,999 | 11 (3.6%) | 8 (3.2%) |
| $5,000 to $7,499 | 6 (2.0%) | 7 (2.8%) |
| $7,500 to $9,999 | 11 (3.6%) | 25 (10.1%) |
| $10,000 to $12,499 | 21 (6.9%) | 16 (6.5%) |
| $12,500 to $14,999 | 3 (1.0%) | 3 (1.2%) |
| $15,000 to $17,499 | 6 (2.0%) | 14 (5.7%) |
| $17,500 to $19,999 | 6 (2.0%) | 4 (1.6%) |
| $20,000 to $22,499 | 3 (1.0%) | 0 (0.0%) |
| $22,500 to $24,999 | 4 (1.3%) | 8 (3.2%) |
| $25,000 to $29,999 | 35 (11.6%) | 29 (11.7%) |
| $30,000 to $34,999 | 3 (1.0%) | 6 (2.4%) |
| $35,000 to $39,999 | 5 (1.7%) | 4 (1.6%) |
| $40,000 to $44,999 | 28 (9.2%) | 11 (4.4%) |
| $45,000 to $49,999 | 16 (5.3%) | 35 (14.1%) |
| $50,000 to $54,999 | 29 (9.6%) | 2 (0.8%) |
| $55,000 to $64,999 | 20 (6.6%) | 19 (7.7%) |
| $65,000 to $74,999 | 23 (7.6%) | 1 (0.4%) |
| $75,000 to $99,999 | 23 (7.6%) | 17 (6.9%) |
| $100,000+ | 45 (14.8%) | 11 (4.4%) |
| Total | 303 (100.0%) | 248 (100.0%) |
Earnings by Sex by Educational Attainment in Colfax
Average earnings in Colfax are $54,375 for men and $35,313 for women, a difference of 35.1%. Men with an educational attainment of graduate degree enjoy the highest average annual earnings of $105,313, while those with college or associate's degree education earn the least with $52,273. Women with an educational attainment of graduate degree earn the most with the average annual earnings of $81,750, while those with high school diploma education have the smallest earnings of $22,656.
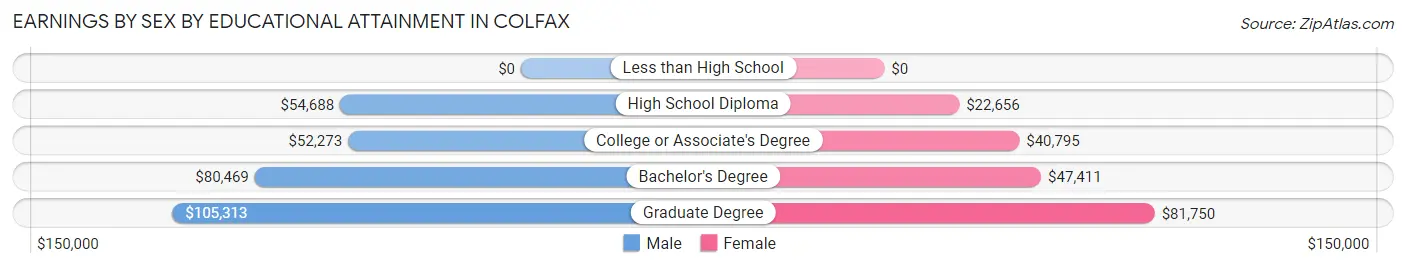
| Educational Attainment | Male Income | Female Income |
| Less than High School | - | - |
| High School Diploma | $54,688 | $22,656 |
| College or Associate's Degree | $52,273 | $40,795 |
| Bachelor's Degree | $80,469 | $47,411 |
| Graduate Degree | $105,313 | $81,750 |
| Total | $54,375 | $35,313 |
Family Income in Colfax
Family Income Brackets in Colfax
According to the Colfax family income data, there are 67 families falling into the $50,000 to $74,999 income range, which is the most common income bracket and makes up 27.9% of all families.
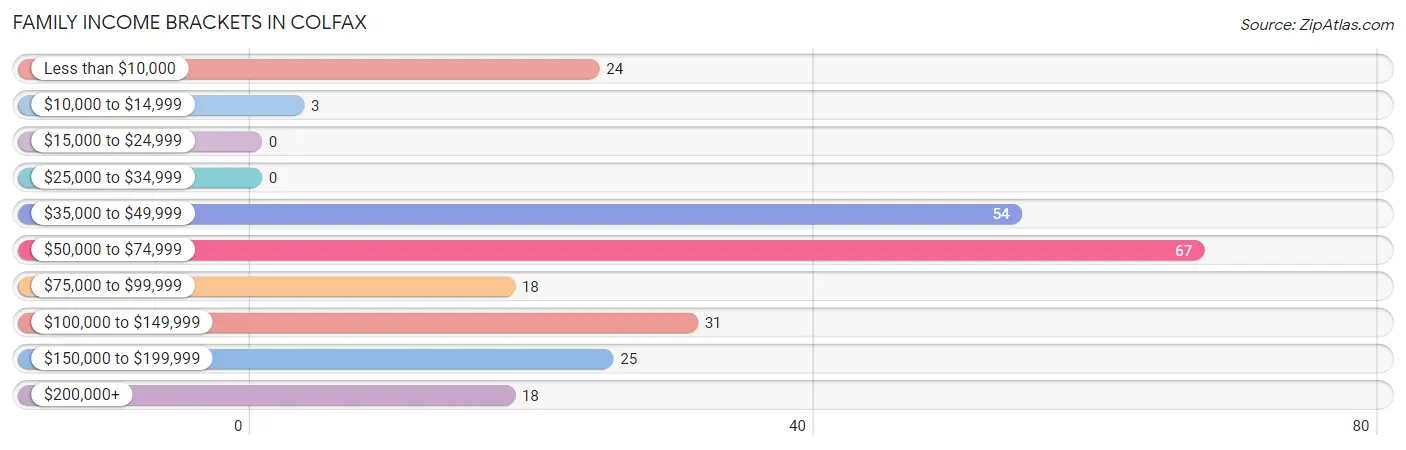
| Income Bracket | # Families | % Families |
| Less than $10,000 | 24 | 10.0% |
| $10,000 to $14,999 | 3 | 1.3% |
| $15,000 to $24,999 | 0 | 0.0% |
| $25,000 to $34,999 | 0 | 0.0% |
| $35,000 to $49,999 | 54 | 22.5% |
| $50,000 to $74,999 | 67 | 27.9% |
| $75,000 to $99,999 | 18 | 7.5% |
| $100,000 to $149,999 | 31 | 12.9% |
| $150,000 to $199,999 | 25 | 10.4% |
| $200,000+ | 18 | 7.5% |
Family Income by Famaliy Size in Colfax
5-person families (18 | 7.5%) account for the highest median family income in Colfax with $167,143 per family, while 5-person families (18 | 7.5%) have the highest median income of $33,429 per family member.
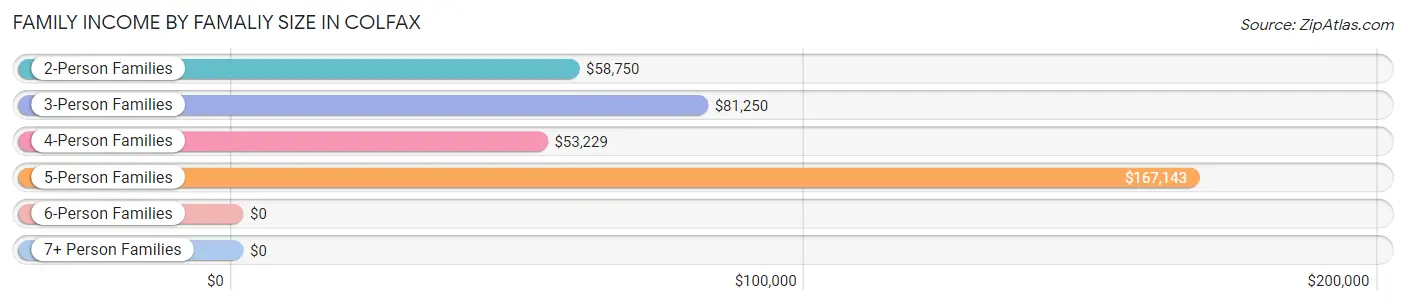
| Income Bracket | # Families | Median Income |
| 2-Person Families | 108 (45.0%) | $58,750 |
| 3-Person Families | 34 (14.2%) | $81,250 |
| 4-Person Families | 73 (30.4%) | $53,229 |
| 5-Person Families | 18 (7.5%) | $167,143 |
| 6-Person Families | 7 (2.9%) | $0 |
| 7+ Person Families | 0 (0.0%) | $0 |
| Total | 240 (100.0%) | $59,706 |
Family Income by Number of Earners in Colfax
The median family income in Colfax is $59,706, with families comprising 3+ earners (17) having the highest median family income of $185,938, while families with 1 earner (101) have the lowest median family income of $41,949, accounting for 7.1% and 42.1% of families, respectively.
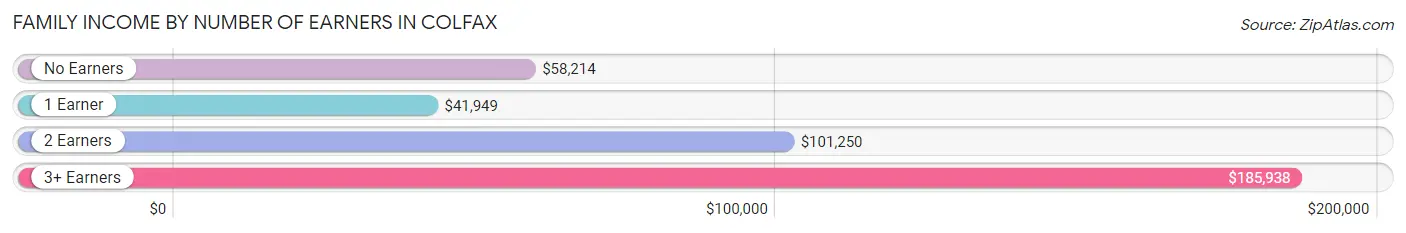
| Number of Earners | # Families | Median Income |
| No Earners | 26 (10.8%) | $58,214 |
| 1 Earner | 101 (42.1%) | $41,949 |
| 2 Earners | 96 (40.0%) | $101,250 |
| 3+ Earners | 17 (7.1%) | $185,938 |
| Total | 240 (100.0%) | $59,706 |
Household Income in Colfax
Household Income Brackets in Colfax
With 92 households falling in the category, the $50,000 to $74,999 income range is the most frequent in Colfax, accounting for 25.1% of all households. In contrast, only 4 households (1.1%) fall into the $15,000 to $24,999 income bracket, making it the least populous group.
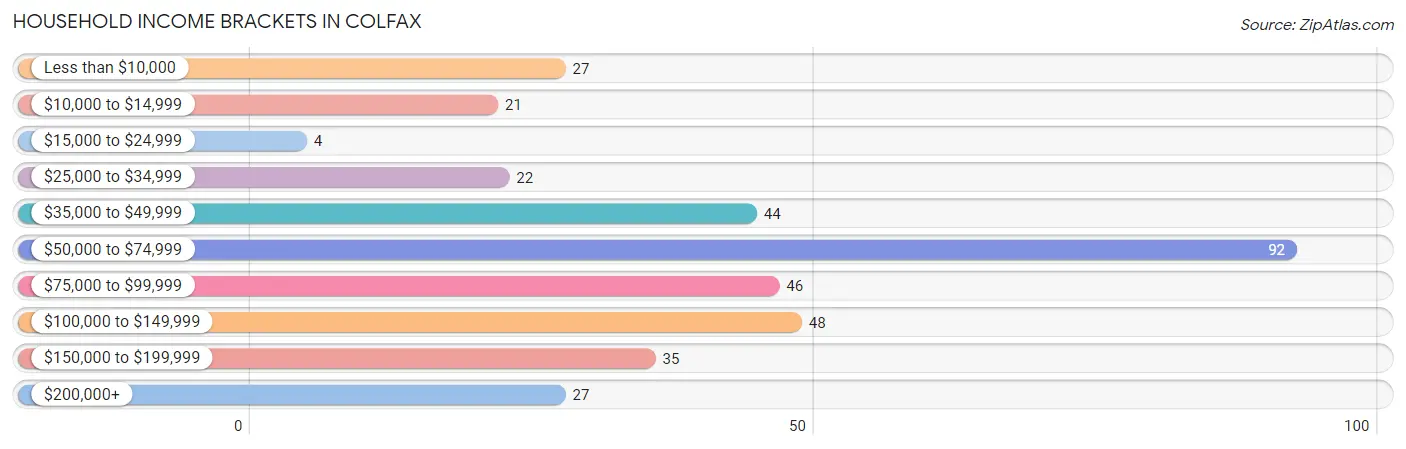
| Income Bracket | # Households | % Households |
| Less than $10,000 | 27 | 7.4% |
| $10,000 to $14,999 | 21 | 5.7% |
| $15,000 to $24,999 | 4 | 1.1% |
| $25,000 to $34,999 | 22 | 6.0% |
| $35,000 to $49,999 | 44 | 12.0% |
| $50,000 to $74,999 | 92 | 25.1% |
| $75,000 to $99,999 | 46 | 12.6% |
| $100,000 to $149,999 | 48 | 13.1% |
| $150,000 to $199,999 | 35 | 9.6% |
| $200,000+ | 27 | 7.4% |
Household Income by Householder Age in Colfax
The median household income in Colfax is $63,750, with the highest median household income of $95,795 found in the 25 to 44 years age bracket for the primary householder. A total of 133 households (36.3%) fall into this category. Meanwhile, the 15 to 24 years age bracket for the primary householder has the lowest median household income of $52,829, with 33 households (9.0%) in this group.
| Income Bracket | # Households | Median Income |
| 15 to 24 Years | 33 (9.0%) | $52,829 |
| 25 to 44 Years | 133 (36.3%) | $95,795 |
| 45 to 64 Years | 116 (31.7%) | $66,667 |
| 65+ Years | 84 (23.0%) | $54,167 |
| Total | 366 (100.0%) | $63,750 |
Poverty in Colfax
Income Below Poverty by Sex and Age in Colfax
With 12.3% poverty level for males and 13.1% for females among the residents of Colfax, under 5 year old males and 15 year old females are the most vulnerable to poverty, with 12 males (63.2%) and 3 females (100.0%) in their respective age groups living below the poverty level.
| Age Bracket | Male | Female |
| Under 5 Years | 12 (63.2%) | 3 (8.8%) |
| 5 Years | 3 (37.5%) | 0 (0.0%) |
| 6 to 11 Years | 3 (25.0%) | 0 (0.0%) |
| 12 to 14 Years | 0 (0.0%) | 6 (10.9%) |
| 15 Years | 0 (0.0%) | 3 (100.0%) |
| 16 and 17 Years | 2 (9.1%) | 0 (0.0%) |
| 18 to 24 Years | 5 (6.9%) | 12 (23.1%) |
| 25 to 34 Years | 19 (29.7%) | 22 (38.6%) |
| 35 to 44 Years | 0 (0.0%) | 0 (0.0%) |
| 45 to 54 Years | 0 (0.0%) | 10 (19.2%) |
| 55 to 64 Years | 6 (10.0%) | 0 (0.0%) |
| 65 to 74 Years | 0 (0.0%) | 13 (22.8%) |
| 75 Years and over | 5 (15.6%) | 0 (0.0%) |
| Total | 55 (12.3%) | 69 (13.1%) |
Income Above Poverty by Sex and Age in Colfax
According to the poverty statistics in Colfax, males aged 12 to 14 years and females aged 5 years are the age groups that are most secure financially, with 100.0% of males and 100.0% of females in these age groups living above the poverty line.
| Age Bracket | Male | Female |
| Under 5 Years | 7 (36.8%) | 31 (91.2%) |
| 5 Years | 5 (62.5%) | 4 (100.0%) |
| 6 to 11 Years | 9 (75.0%) | 51 (100.0%) |
| 12 to 14 Years | 25 (100.0%) | 49 (89.1%) |
| 15 Years | 5 (100.0%) | 0 (0.0%) |
| 16 and 17 Years | 20 (90.9%) | 24 (100.0%) |
| 18 to 24 Years | 67 (93.1%) | 40 (76.9%) |
| 25 to 34 Years | 45 (70.3%) | 35 (61.4%) |
| 35 to 44 Years | 77 (100.0%) | 76 (100.0%) |
| 45 to 54 Years | 34 (100.0%) | 42 (80.8%) |
| 55 to 64 Years | 54 (90.0%) | 31 (100.0%) |
| 65 to 74 Years | 18 (100.0%) | 44 (77.2%) |
| 75 Years and over | 27 (84.4%) | 29 (100.0%) |
| Total | 393 (87.7%) | 456 (86.9%) |
Income Below Poverty Among Married-Couple Families in Colfax
The poverty statistics for married-couple families in Colfax show that 5.3% or 9 of the total 169 families live below the poverty line. Families with 3 or 4 children have the highest poverty rate of 20.0%, comprising of 3 families. On the other hand, families with no children have the lowest poverty rate of 2.8%, which includes 3 families.
| Children | Above Poverty | Below Poverty |
| No Children | 103 (97.2%) | 3 (2.8%) |
| 1 or 2 Children | 45 (93.8%) | 3 (6.2%) |
| 3 or 4 Children | 12 (80.0%) | 3 (20.0%) |
| 5 or more Children | 0 (0.0%) | 0 (0.0%) |
| Total | 160 (94.7%) | 9 (5.3%) |
Income Below Poverty Among Single-Parent Households in Colfax
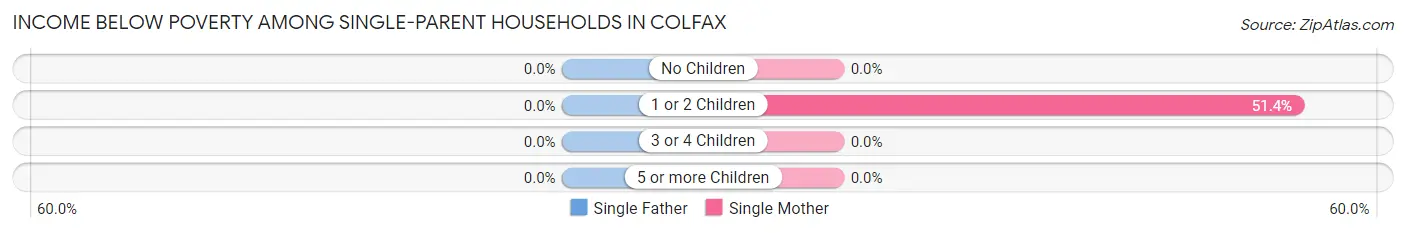
| Children | Single Father | Single Mother |
| No Children | 0 (0.0%) | 0 (0.0%) |
| 1 or 2 Children | 0 (0.0%) | 18 (51.4%) |
| 3 or 4 Children | 0 (0.0%) | 0 (0.0%) |
| 5 or more Children | 0 (0.0%) | 0 (0.0%) |
| Total | 0 (0.0%) | 18 (39.1%) |
Income Below Poverty Among Married-Couple vs Single-Parent Households in Colfax
The poverty data for Colfax shows that 9 of the married-couple family households (5.3%) and 18 of the single-parent households (25.4%) are living below the poverty level. Within the married-couple family households, those with 3 or 4 children have the highest poverty rate, with 3 households (20.0%) falling below the poverty line. Among the single-parent households, those with 1 or 2 children have the highest poverty rate, with 18 household (43.9%) living below poverty.
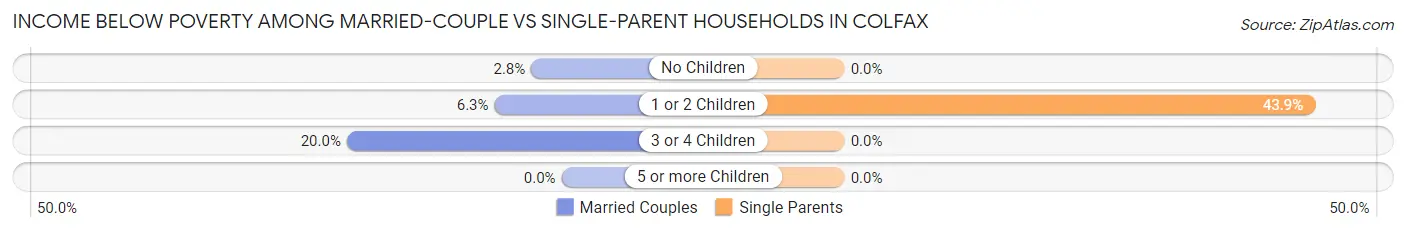
| Children | Married-Couple Families | Single-Parent Households |
| No Children | 3 (2.8%) | 0 (0.0%) |
| 1 or 2 Children | 3 (6.2%) | 18 (43.9%) |
| 3 or 4 Children | 3 (20.0%) | 0 (0.0%) |
| 5 or more Children | 0 (0.0%) | 0 (0.0%) |
| Total | 9 (5.3%) | 18 (25.4%) |
Race in Colfax
The most populous races in Colfax are White / Caucasian (991 | 97.4%), Hispanic or Latino (28 | 2.8%), and Some other Race (16 | 1.6%).
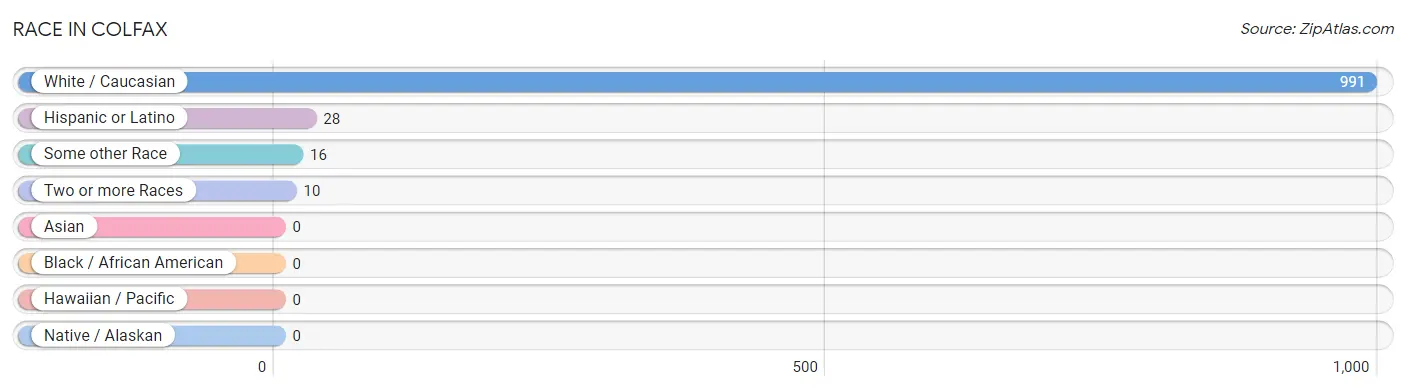
| Race | # Population | % Population |
| Asian | 0 | 0.0% |
| Black / African American | 0 | 0.0% |
| Hawaiian / Pacific | 0 | 0.0% |
| Hispanic or Latino | 28 | 2.8% |
| Native / Alaskan | 0 | 0.0% |
| White / Caucasian | 991 | 97.4% |
| Two or more Races | 10 | 1.0% |
| Some other Race | 16 | 1.6% |
| Total | 1,017 | 100.0% |
Ancestry in Colfax
The most populous ancestries reported in Colfax are German (248 | 24.4%), English (147 | 14.4%), Irish (135 | 13.3%), Italian (71 | 7.0%), and Dutch (57 | 5.6%), together accounting for 64.7% of all Colfax residents.
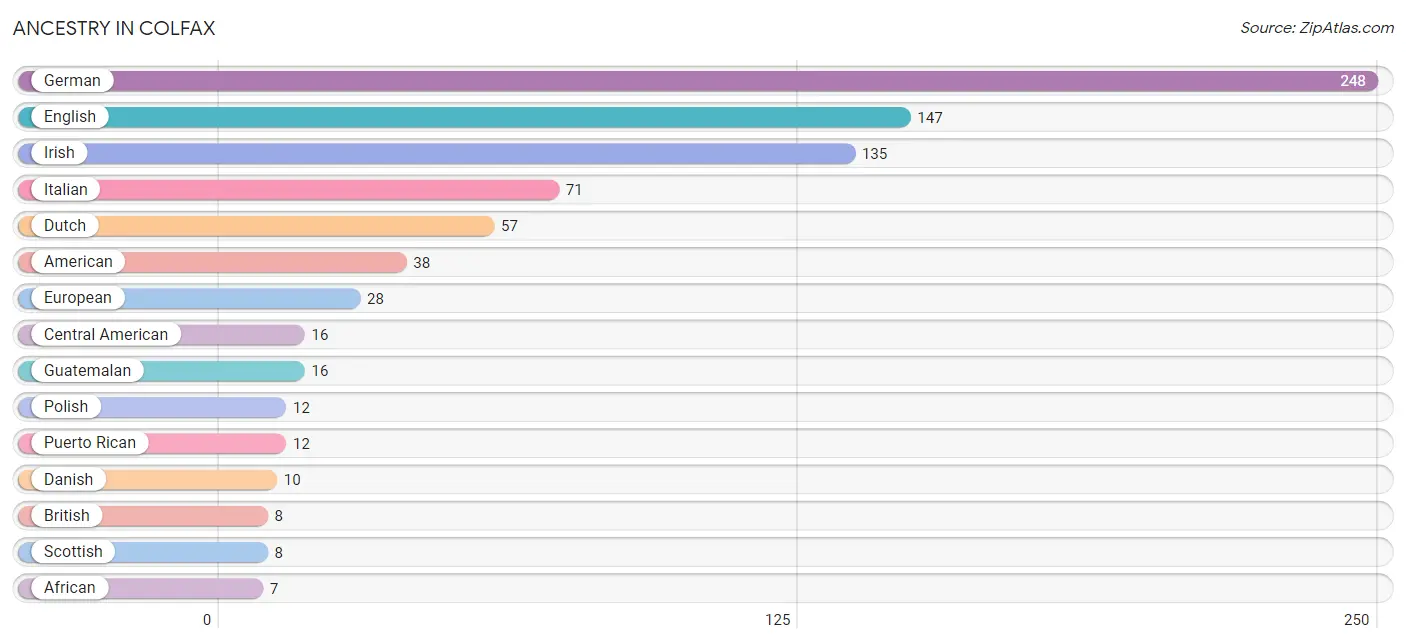
| Ancestry | # Population | % Population |
| African | 7 | 0.7% |
| American | 38 | 3.7% |
| British | 8 | 0.8% |
| Central American | 16 | 1.6% |
| Czechoslovakian | 2 | 0.2% |
| Danish | 10 | 1.0% |
| Dutch | 57 | 5.6% |
| Eastern European | 3 | 0.3% |
| English | 147 | 14.4% |
| European | 28 | 2.8% |
| German | 248 | 24.4% |
| Guatemalan | 16 | 1.6% |
| Hungarian | 2 | 0.2% |
| Irish | 135 | 13.3% |
| Italian | 71 | 7.0% |
| Lithuanian | 2 | 0.2% |
| Norwegian | 3 | 0.3% |
| Polish | 12 | 1.2% |
| Puerto Rican | 12 | 1.2% |
| Scandinavian | 1 | 0.1% |
| Scotch-Irish | 3 | 0.3% |
| Scottish | 8 | 0.8% |
| Subsaharan African | 7 | 0.7% |
| Swedish | 3 | 0.3% |
| Swiss | 5 | 0.5% |
| Welsh | 3 | 0.3% | View All 26 Rows |
Immigrants in Colfax
The most numerous immigrant groups reported in Colfax came from Central America (16 | 1.6%), Guatemala (16 | 1.6%), Latin America (16 | 1.6%), Canada (6 | 0.6%), and Eastern Europe (2 | 0.2%), together accounting for 5.5% of all Colfax residents.
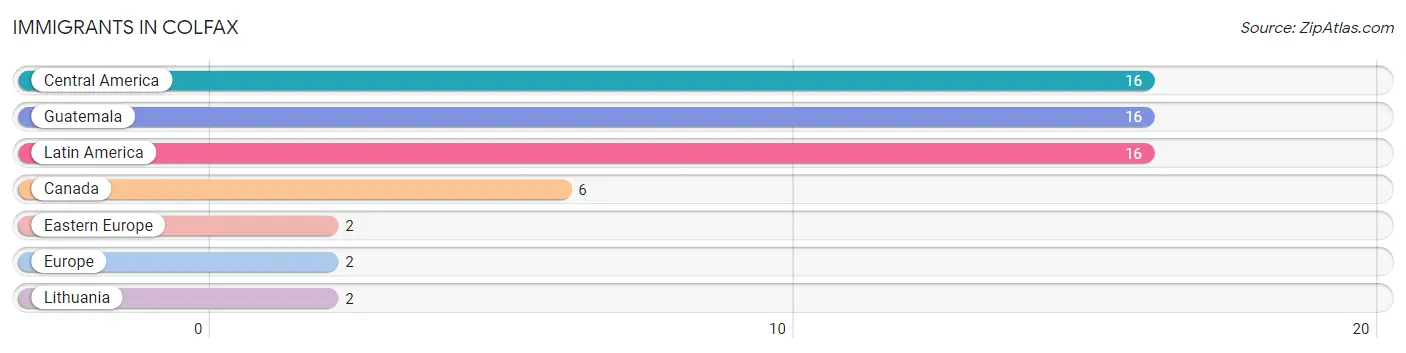
| Immigration Origin | # Population | % Population |
| Canada | 6 | 0.6% |
| Central America | 16 | 1.6% |
| Eastern Europe | 2 | 0.2% |
| Europe | 2 | 0.2% |
| Guatemala | 16 | 1.6% |
| Latin America | 16 | 1.6% |
| Lithuania | 2 | 0.2% | View All 7 Rows |
Sex and Age in Colfax
Sex and Age in Colfax
The most populous age groups in Colfax are 20 to 24 Years (70 | 15.4%) for men and 10 to 14 Years (68 | 12.1%) for women.
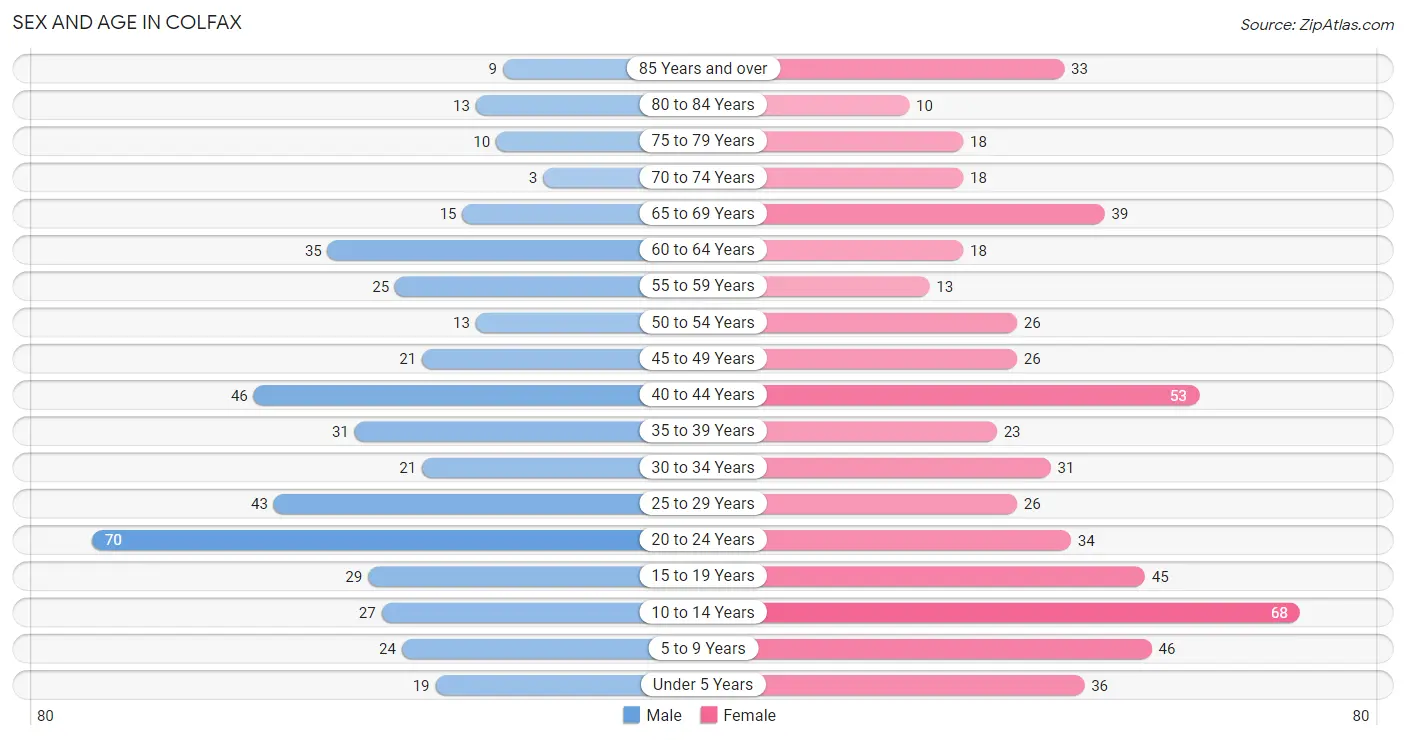
| Age Bracket | Male | Female |
| Under 5 Years | 19 (4.2%) | 36 (6.4%) |
| 5 to 9 Years | 24 (5.3%) | 46 (8.2%) |
| 10 to 14 Years | 27 (5.9%) | 68 (12.1%) |
| 15 to 19 Years | 29 (6.4%) | 45 (8.0%) |
| 20 to 24 Years | 70 (15.4%) | 34 (6.0%) |
| 25 to 29 Years | 43 (9.5%) | 26 (4.6%) |
| 30 to 34 Years | 21 (4.6%) | 31 (5.5%) |
| 35 to 39 Years | 31 (6.8%) | 23 (4.1%) |
| 40 to 44 Years | 46 (10.1%) | 53 (9.4%) |
| 45 to 49 Years | 21 (4.6%) | 26 (4.6%) |
| 50 to 54 Years | 13 (2.9%) | 26 (4.6%) |
| 55 to 59 Years | 25 (5.5%) | 13 (2.3%) |
| 60 to 64 Years | 35 (7.7%) | 18 (3.2%) |
| 65 to 69 Years | 15 (3.3%) | 39 (6.9%) |
| 70 to 74 Years | 3 (0.7%) | 18 (3.2%) |
| 75 to 79 Years | 10 (2.2%) | 18 (3.2%) |
| 80 to 84 Years | 13 (2.9%) | 10 (1.8%) |
| 85 Years and over | 9 (2.0%) | 33 (5.9%) |
| Total | 454 (100.0%) | 563 (100.0%) |
Families and Households in Colfax
Median Family Size in Colfax
The median family size in Colfax is 3.14 persons per family, with single female/mother families (46 | 19.2%) accounting for the largest median family size of 3.37 persons per family. On the other hand, single male/father families (25 | 10.4%) represent the smallest median family size with 2.84 persons per family.
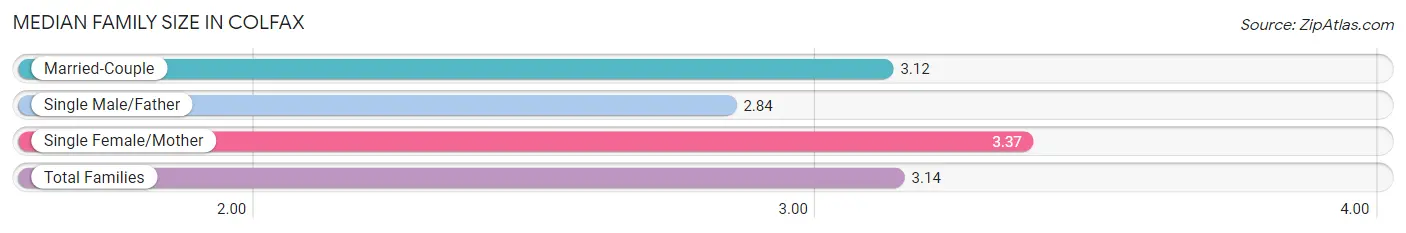
| Family Type | # Families | Family Size |
| Married-Couple | 169 (70.4%) | 3.12 |
| Single Male/Father | 25 (10.4%) | 2.84 |
| Single Female/Mother | 46 (19.2%) | 3.37 |
| Total Families | 240 (100.0%) | 3.14 |
Median Household Size in Colfax
The median household size in Colfax is 2.69 persons per household, with single female/mother households (46 | 12.6%) accounting for the largest median household size of 4.39 persons per household. non-family households (126 | 34.4%) represent the smallest median household size with 1.22 persons per household.
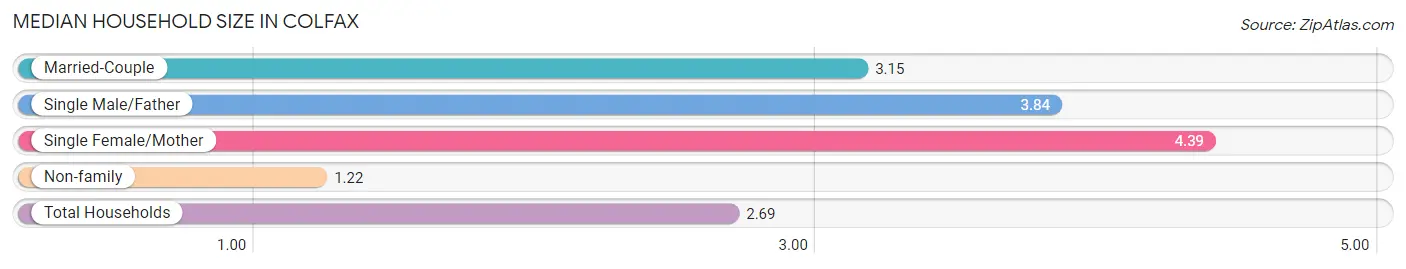
| Household Type | # Households | Household Size |
| Married-Couple | 169 (46.2%) | 3.15 |
| Single Male/Father | 25 (6.8%) | 3.84 |
| Single Female/Mother | 46 (12.6%) | 4.39 |
| Non-family | 126 (34.4%) | 1.22 |
| Total Households | 366 (100.0%) | 2.69 |
Household Size by Marriage Status in Colfax
Out of a total of 366 households in Colfax, 240 (65.6%) are family households, while 126 (34.4%) are nonfamily households. The most numerous type of family households are 2-person households, comprising 84, and the most common type of nonfamily households are 1-person households, comprising 109.
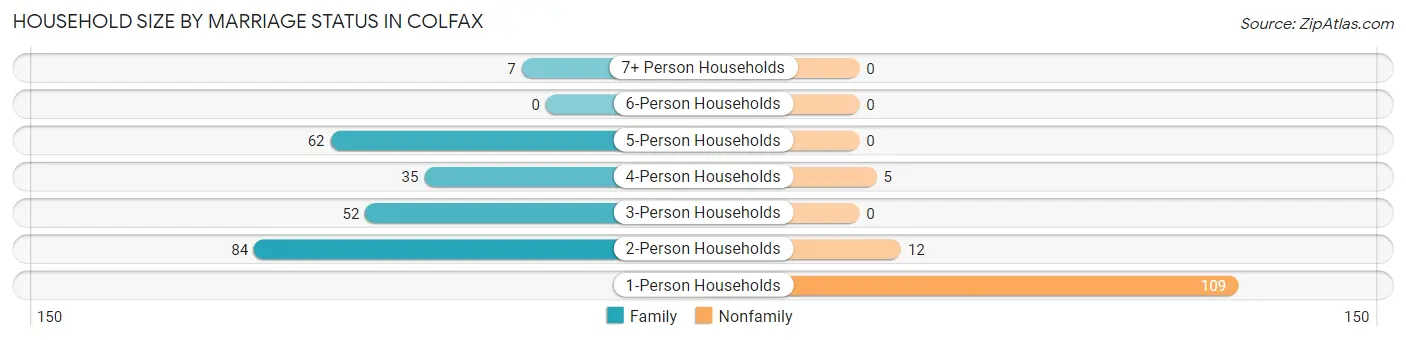
| Household Size | Family Households | Nonfamily Households |
| 1-Person Households | - | 109 (29.8%) |
| 2-Person Households | 84 (23.0%) | 12 (3.3%) |
| 3-Person Households | 52 (14.2%) | 0 (0.0%) |
| 4-Person Households | 35 (9.6%) | 5 (1.4%) |
| 5-Person Households | 62 (16.9%) | 0 (0.0%) |
| 6-Person Households | 0 (0.0%) | 0 (0.0%) |
| 7+ Person Households | 7 (1.9%) | 0 (0.0%) |
| Total | 240 (65.6%) | 126 (34.4%) |
Female Fertility in Colfax
Fertility by Age in Colfax
Average fertility rate in Colfax is 20.0 births per 1,000 women. Women in the age bracket of 20 to 34 years have the highest fertility rate with 55.0 births per 1,000 women. Women in the age bracket of 20 to 34 years acount for 100.0% of all women with births.
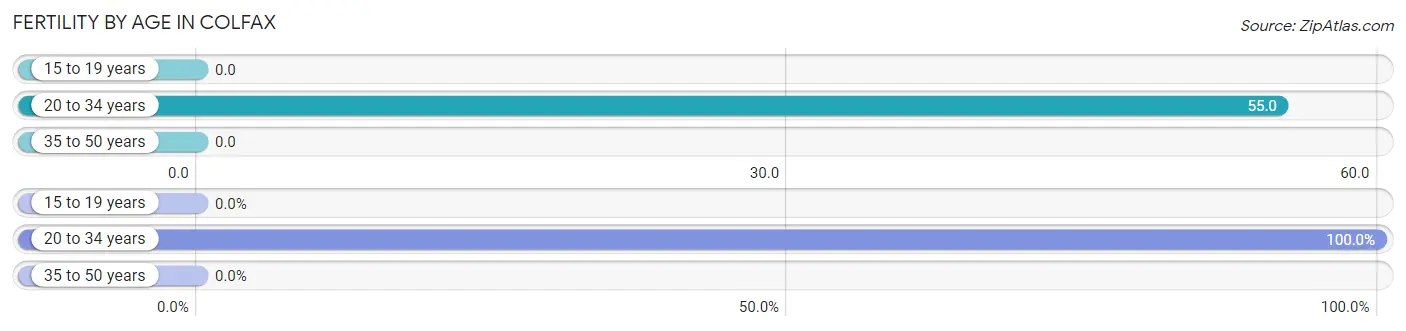
| Age Bracket | Women with Births | Births / 1,000 Women |
| 15 to 19 years | 0 (0.0%) | 0.0 |
| 20 to 34 years | 5 (100.0%) | 55.0 |
| 35 to 50 years | 0 (0.0%) | 0.0 |
| Total | 5 (100.0%) | 20.0 |
Fertility by Age by Marriage Status in Colfax
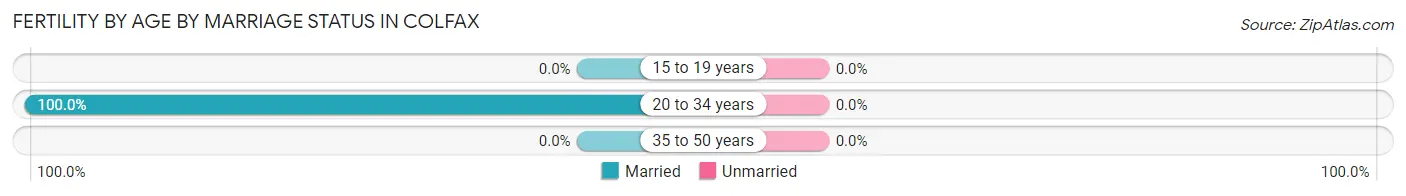
| Age Bracket | Married | Unmarried |
| 15 to 19 years | 0 (0.0%) | 0 (0.0%) |
| 20 to 34 years | 5 (100.0%) | 0 (0.0%) |
| 35 to 50 years | 0 (0.0%) | 0 (0.0%) |
| Total | 5 (100.0%) | 0 (0.0%) |
Fertility by Education in Colfax
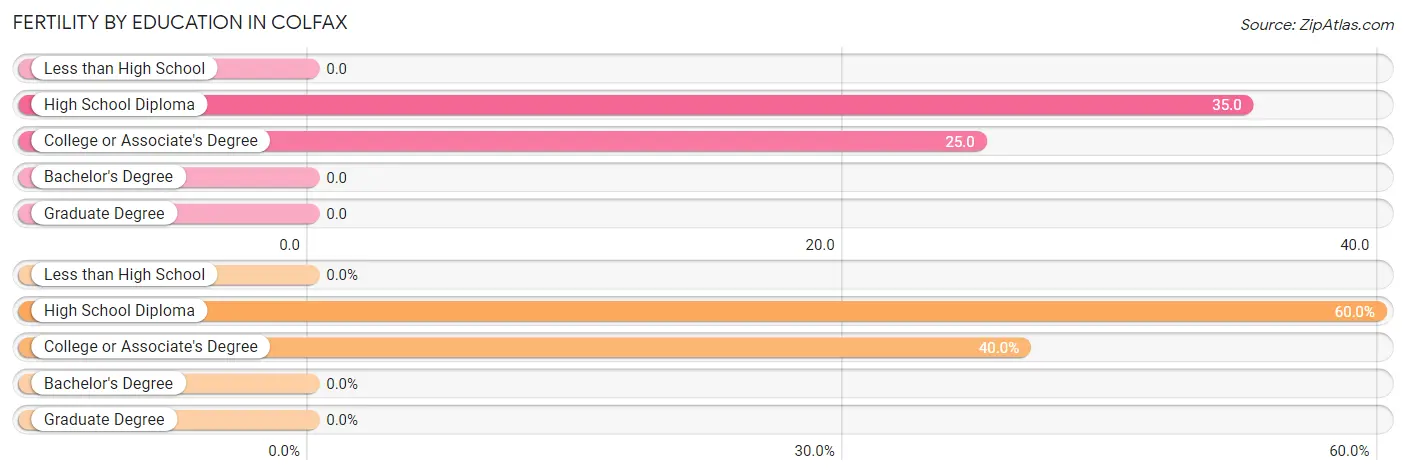
| Educational Attainment | Women with Births | Births / 1,000 Women |
| Less than High School | 0 (0.0%) | 0.0 |
| High School Diploma | 3 (60.0%) | 35.0 |
| College or Associate's Degree | 2 (40.0%) | 25.0 |
| Bachelor's Degree | 0 (0.0%) | 0.0 |
| Graduate Degree | 0 (0.0%) | 0.0 |
| Total | 5 (100.0%) | 20.0 |
Fertility by Education by Marriage Status in Colfax
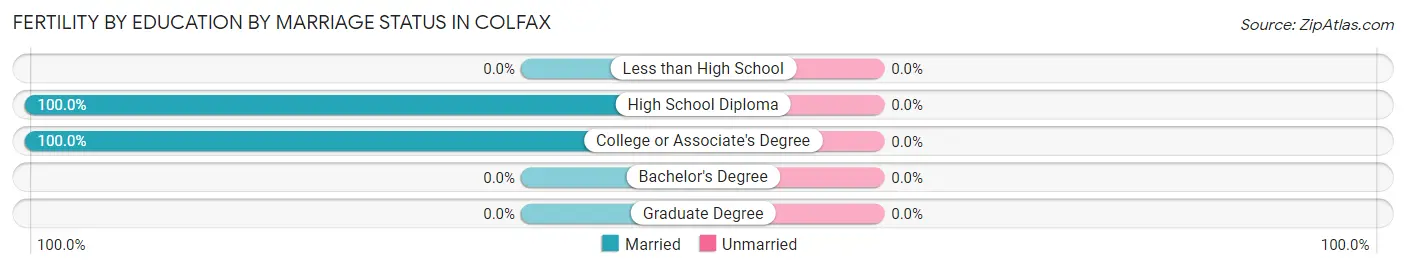
| Educational Attainment | Married | Unmarried |
| Less than High School | 0 (0.0%) | 0 (0.0%) |
| High School Diploma | 3 (100.0%) | 0 (0.0%) |
| College or Associate's Degree | 2 (100.0%) | 0 (0.0%) |
| Bachelor's Degree | 0 (0.0%) | 0 (0.0%) |
| Graduate Degree | 0 (0.0%) | 0 (0.0%) |
| Total | 5 (100.0%) | 0 (0.0%) |
Employment Characteristics in Colfax
Employment by Class of Employer in Colfax
Among the 486 employed individuals in Colfax, private company employees (371 | 76.3%), state government employees (37 | 7.6%), and not-for-profit organizations (30 | 6.2%) make up the most common classes of employment.
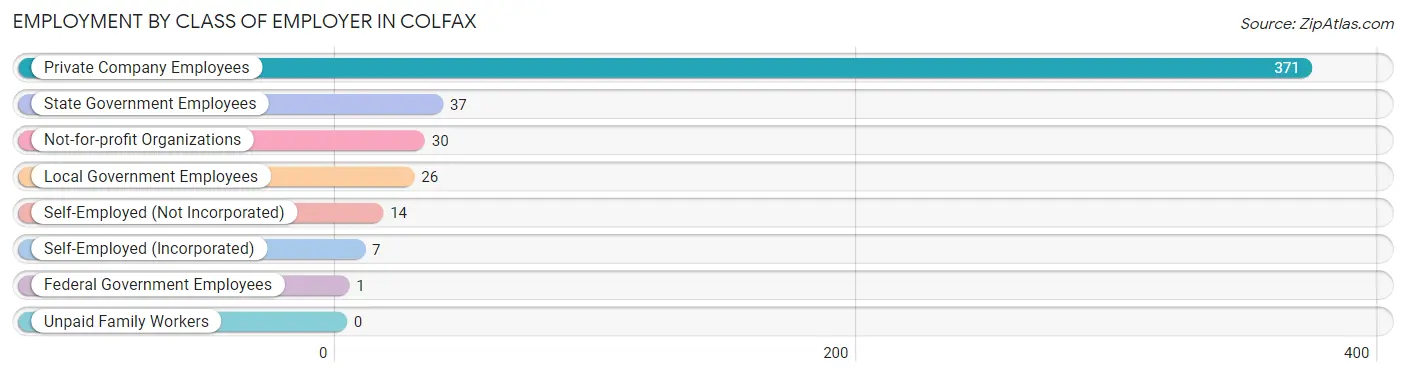
| Employer Class | # Employees | % Employees |
| Private Company Employees | 371 | 76.3% |
| Self-Employed (Incorporated) | 7 | 1.4% |
| Self-Employed (Not Incorporated) | 14 | 2.9% |
| Not-for-profit Organizations | 30 | 6.2% |
| Local Government Employees | 26 | 5.3% |
| State Government Employees | 37 | 7.6% |
| Federal Government Employees | 1 | 0.2% |
| Unpaid Family Workers | 0 | 0.0% |
| Total | 486 | 100.0% |
Employment Status by Age in Colfax
According to the labor force statistics for Colfax, out of the total population over 16 years of age (789), 66.8% or 527 individuals are in the labor force, with 6.6% or 35 of them unemployed. The age group with the highest labor force participation rate is 30 to 34 years, with 100.0% or 52 individuals in the labor force. Within the labor force, the 20 to 24 years age range has the highest percentage of unemployed individuals, with 14.7% or 14 of them being unemployed.
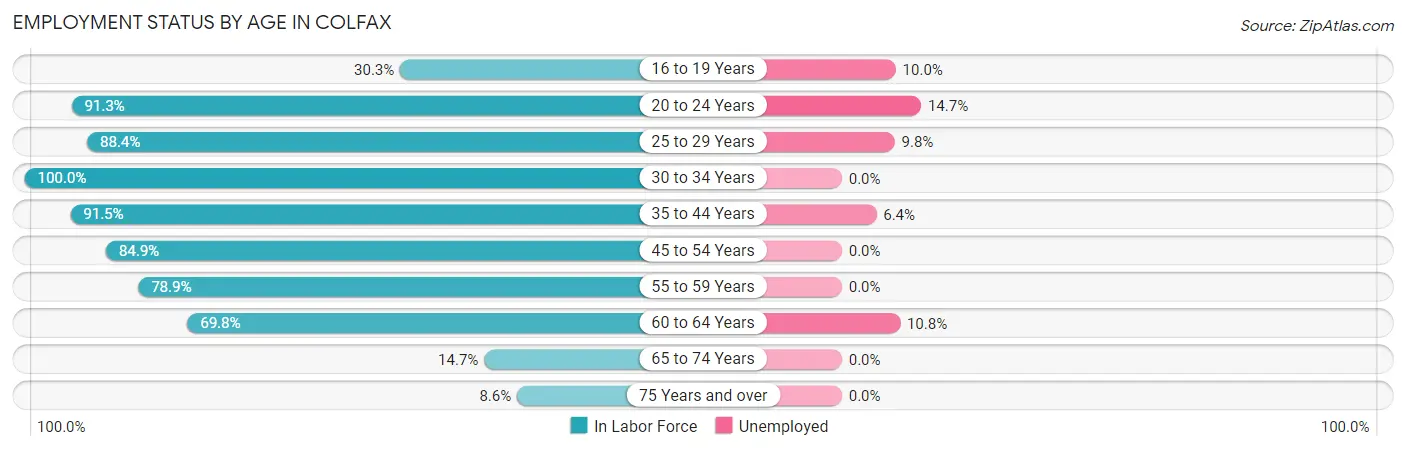
| Age Bracket | In Labor Force | Unemployed |
| 16 to 19 Years | 20 (30.3%) | 2 (10.0%) |
| 20 to 24 Years | 95 (91.3%) | 14 (14.7%) |
| 25 to 29 Years | 61 (88.4%) | 6 (9.8%) |
| 30 to 34 Years | 52 (100.0%) | 0 (0.0%) |
| 35 to 44 Years | 140 (91.5%) | 9 (6.4%) |
| 45 to 54 Years | 73 (84.9%) | 0 (0.0%) |
| 55 to 59 Years | 30 (78.9%) | 0 (0.0%) |
| 60 to 64 Years | 37 (69.8%) | 4 (10.8%) |
| 65 to 74 Years | 11 (14.7%) | 0 (0.0%) |
| 75 Years and over | 8 (8.6%) | 0 (0.0%) |
| Total | 527 (66.8%) | 35 (6.6%) |
Employment Status by Educational Attainment in Colfax
According to labor force statistics for Colfax, 87.1% of individuals (393) out of the total population between 25 and 64 years of age (451) are in the labor force, with 4.8% or 19 of them being unemployed. The group with the highest labor force participation rate are those with the educational attainment of college / associate degree, with 95.2% or 178 individuals in the labor force. Within the labor force, individuals with less than high school education have the highest percentage of unemployment, with 35.7% or 5 of them being unemployed.
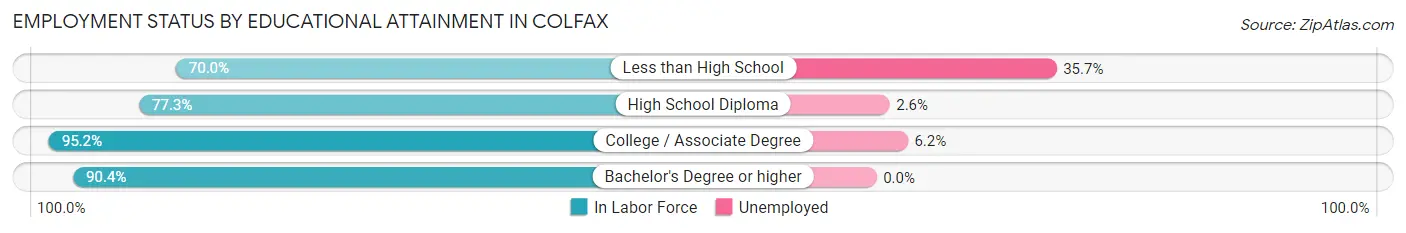
| Educational Attainment | In Labor Force | Unemployed |
| Less than High School | 14 (70.0%) | 7 (35.7%) |
| High School Diploma | 116 (77.3%) | 4 (2.6%) |
| College / Associate Degree | 178 (95.2%) | 12 (6.2%) |
| Bachelor's Degree or higher | 85 (90.4%) | 0 (0.0%) |
| Total | 393 (87.1%) | 22 (4.8%) |
Employment Occupations by Sex in Colfax
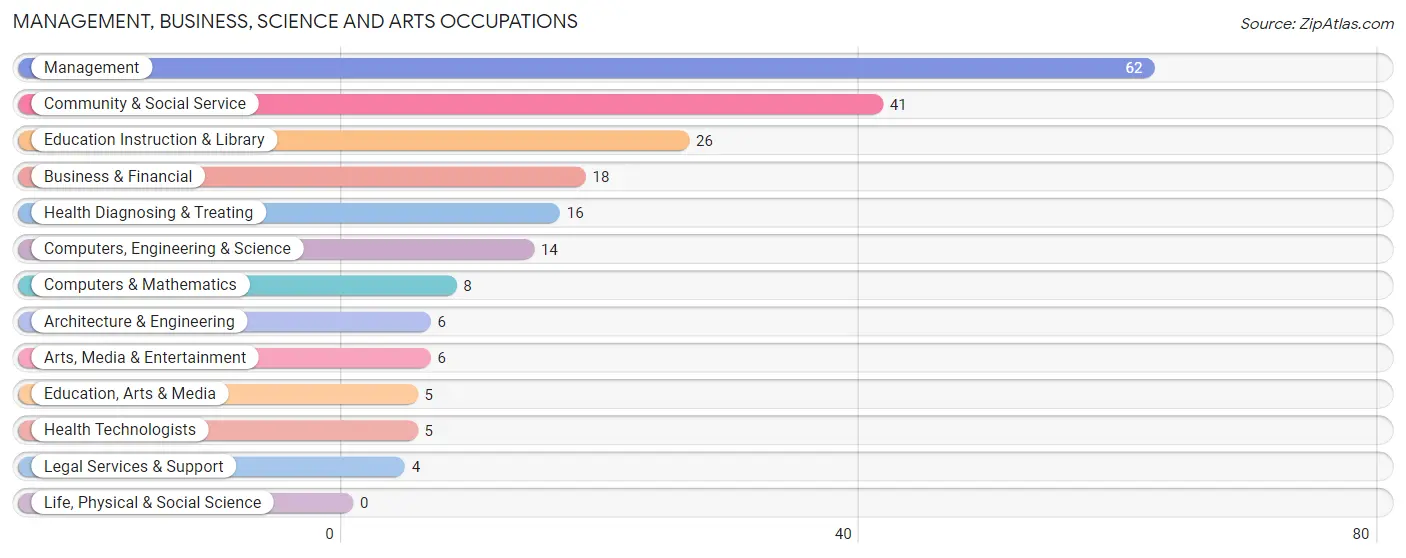
Management, Business, Science and Arts Occupations
The most common Management, Business, Science and Arts occupations in Colfax are Management (62 | 12.6%), Community & Social Service (41 | 8.3%), Education Instruction & Library (26 | 5.3%), Business & Financial (18 | 3.7%), and Health Diagnosing & Treating (16 | 3.3%).
Management, Business, Science and Arts Occupations by Sex
Within the Management, Business, Science and Arts occupations in Colfax, the most male-oriented occupations are Architecture & Engineering (100.0%), Legal Services & Support (100.0%), and Computers, Engineering & Science (78.6%), while the most female-oriented occupations are Education, Arts & Media (100.0%), Arts, Media & Entertainment (100.0%), and Education Instruction & Library (92.3%).
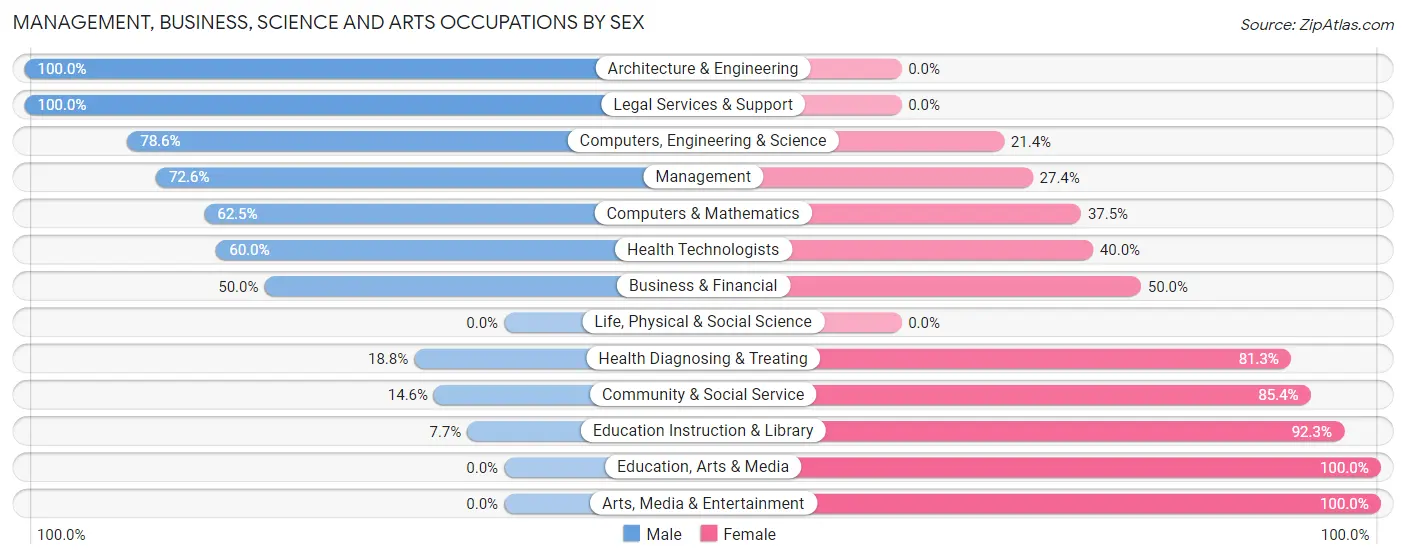
| Occupation | Male | Female |
| Management | 45 (72.6%) | 17 (27.4%) |
| Business & Financial | 9 (50.0%) | 9 (50.0%) |
| Computers, Engineering & Science | 11 (78.6%) | 3 (21.4%) |
| Computers & Mathematics | 5 (62.5%) | 3 (37.5%) |
| Architecture & Engineering | 6 (100.0%) | 0 (0.0%) |
| Life, Physical & Social Science | 0 (0.0%) | 0 (0.0%) |
| Community & Social Service | 6 (14.6%) | 35 (85.4%) |
| Education, Arts & Media | 0 (0.0%) | 5 (100.0%) |
| Legal Services & Support | 4 (100.0%) | 0 (0.0%) |
| Education Instruction & Library | 2 (7.7%) | 24 (92.3%) |
| Arts, Media & Entertainment | 0 (0.0%) | 6 (100.0%) |
| Health Diagnosing & Treating | 3 (18.8%) | 13 (81.2%) |
| Health Technologists | 3 (60.0%) | 2 (40.0%) |
| Total (Category) | 74 (49.0%) | 77 (51.0%) |
| Total (Overall) | 274 (55.7%) | 218 (44.3%) |
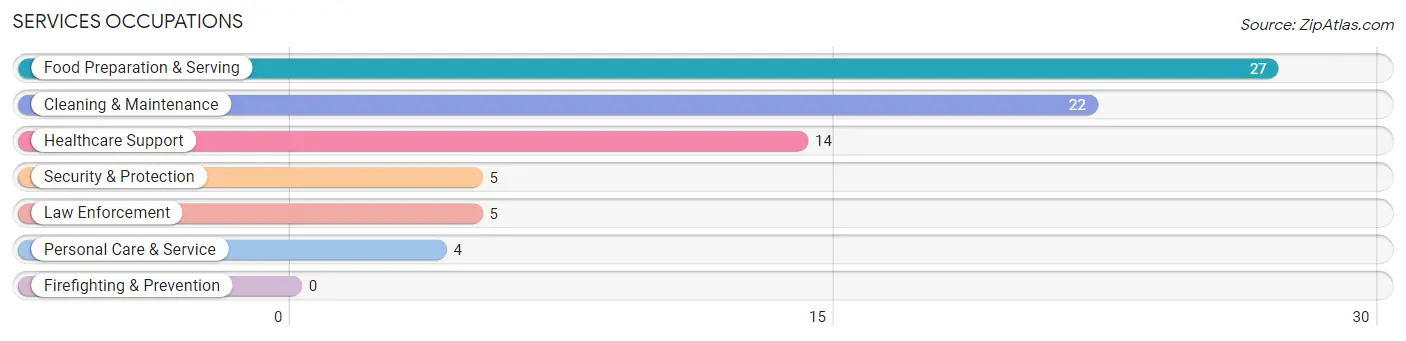
Services Occupations
The most common Services occupations in Colfax are Food Preparation & Serving (27 | 5.5%), Cleaning & Maintenance (22 | 4.5%), Healthcare Support (14 | 2.9%), Security & Protection (5 | 1.0%), and Law Enforcement (5 | 1.0%).
Services Occupations by Sex
Within the Services occupations in Colfax, the most male-oriented occupations are Security & Protection (100.0%), Law Enforcement (100.0%), and Cleaning & Maintenance (45.5%), while the most female-oriented occupations are Healthcare Support (100.0%), Personal Care & Service (100.0%), and Food Preparation & Serving (66.7%).
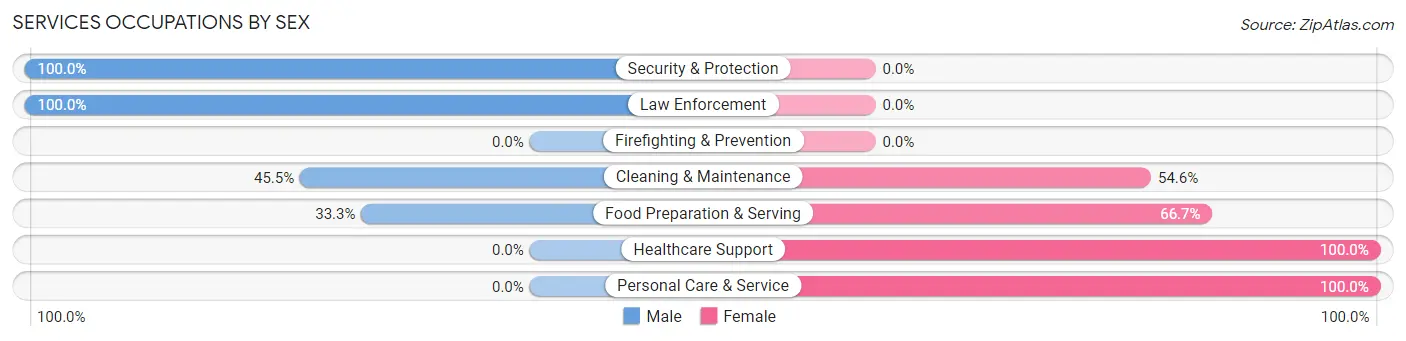
| Occupation | Male | Female |
| Healthcare Support | 0 (0.0%) | 14 (100.0%) |
| Security & Protection | 5 (100.0%) | 0 (0.0%) |
| Firefighting & Prevention | 0 (0.0%) | 0 (0.0%) |
| Law Enforcement | 5 (100.0%) | 0 (0.0%) |
| Food Preparation & Serving | 9 (33.3%) | 18 (66.7%) |
| Cleaning & Maintenance | 10 (45.5%) | 12 (54.5%) |
| Personal Care & Service | 0 (0.0%) | 4 (100.0%) |
| Total (Category) | 24 (33.3%) | 48 (66.7%) |
| Total (Overall) | 274 (55.7%) | 218 (44.3%) |
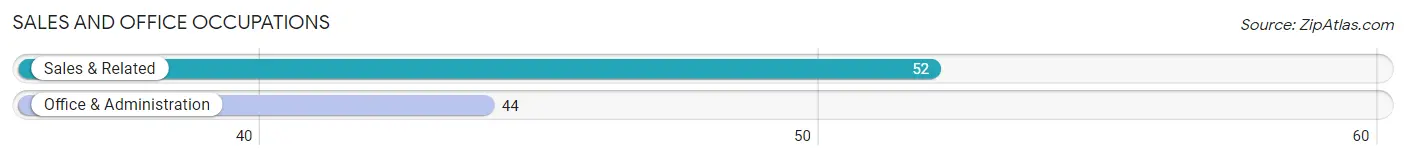
Sales and Office Occupations
The most common Sales and Office occupations in Colfax are Sales & Related (52 | 10.6%), and Office & Administration (44 | 8.9%).
Sales and Office Occupations by Sex
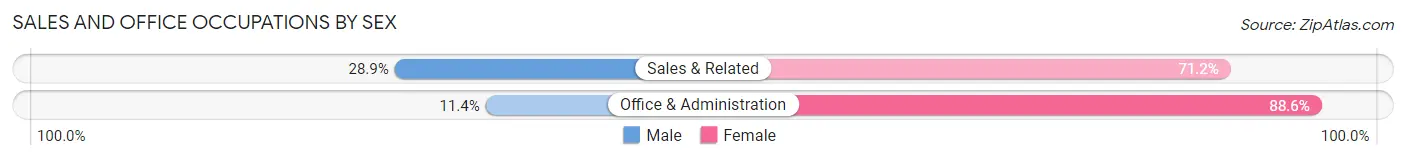
| Occupation | Male | Female |
| Sales & Related | 15 (28.8%) | 37 (71.2%) |
| Office & Administration | 5 (11.4%) | 39 (88.6%) |
| Total (Category) | 20 (20.8%) | 76 (79.2%) |
| Total (Overall) | 274 (55.7%) | 218 (44.3%) |
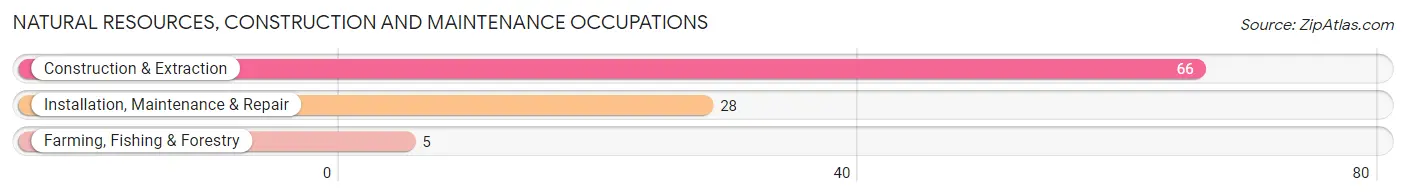
Natural Resources, Construction and Maintenance Occupations
The most common Natural Resources, Construction and Maintenance occupations in Colfax are Construction & Extraction (66 | 13.4%), Installation, Maintenance & Repair (28 | 5.7%), and Farming, Fishing & Forestry (5 | 1.0%).
Natural Resources, Construction and Maintenance Occupations by Sex
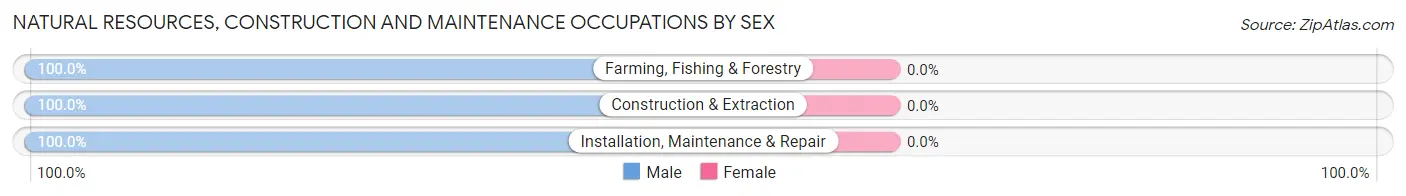
| Occupation | Male | Female |
| Farming, Fishing & Forestry | 5 (100.0%) | 0 (0.0%) |
| Construction & Extraction | 66 (100.0%) | 0 (0.0%) |
| Installation, Maintenance & Repair | 28 (100.0%) | 0 (0.0%) |
| Total (Category) | 99 (100.0%) | 0 (0.0%) |
| Total (Overall) | 274 (55.7%) | 218 (44.3%) |
Production, Transportation and Moving Occupations
The most common Production, Transportation and Moving occupations in Colfax are Production (43 | 8.7%), Transportation (21 | 4.3%), and Material Moving (10 | 2.0%).
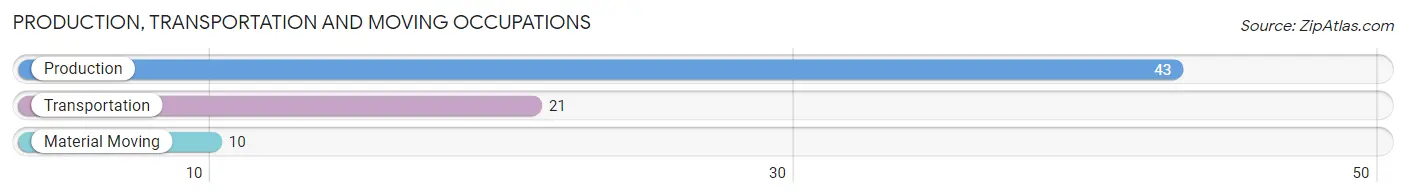
Production, Transportation and Moving Occupations by Sex
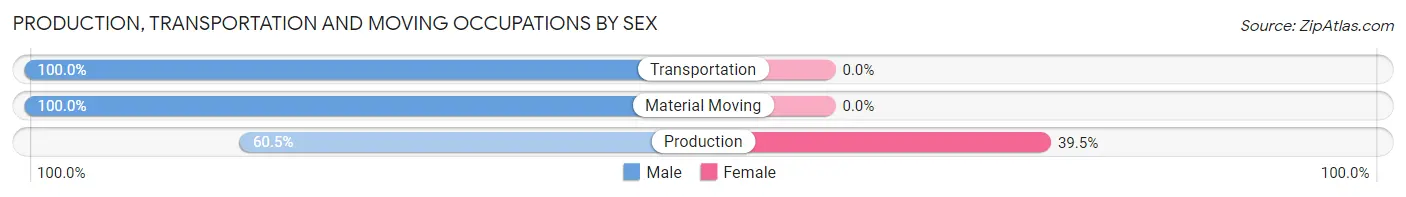
| Occupation | Male | Female |
| Production | 26 (60.5%) | 17 (39.5%) |
| Transportation | 21 (100.0%) | 0 (0.0%) |
| Material Moving | 10 (100.0%) | 0 (0.0%) |
| Total (Category) | 57 (77.0%) | 17 (23.0%) |
| Total (Overall) | 274 (55.7%) | 218 (44.3%) |
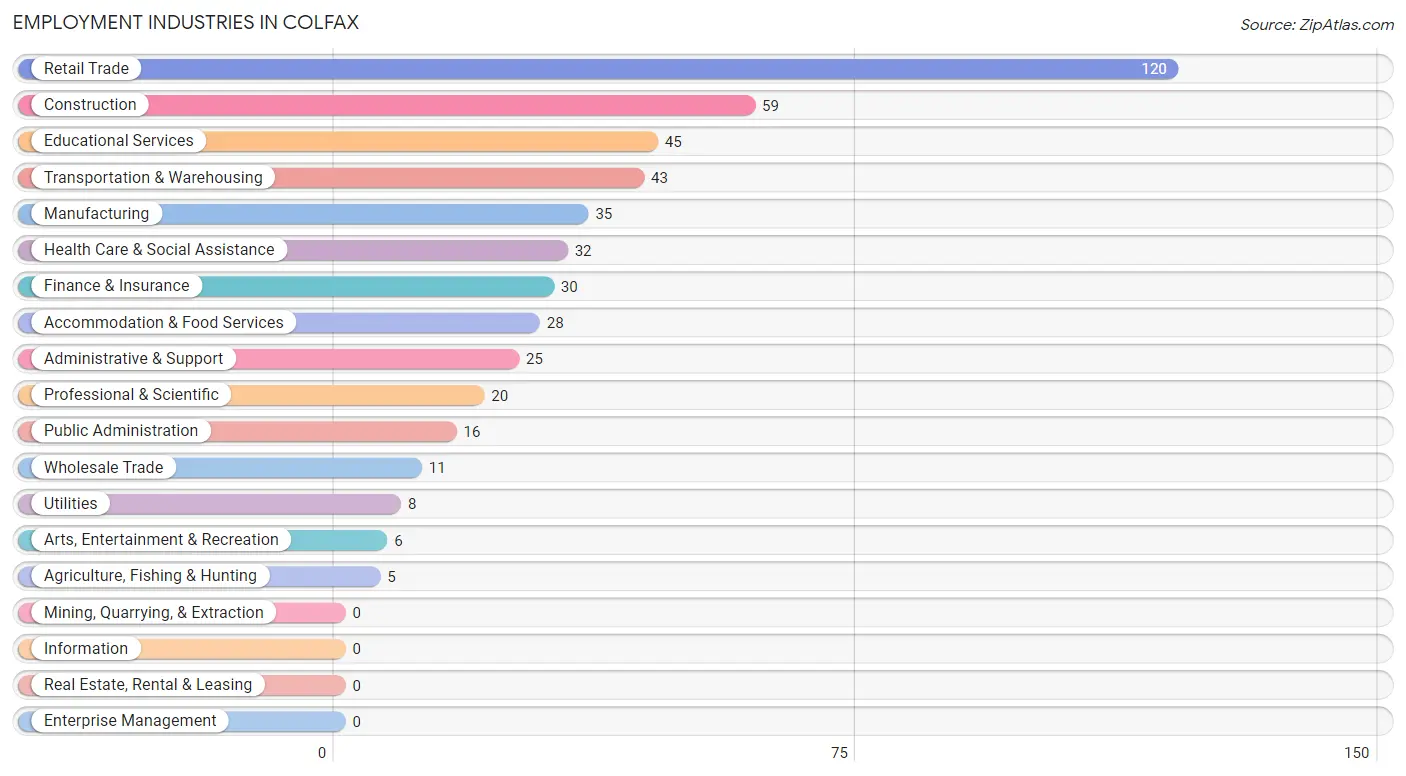
Employment Industries by Sex in Colfax
Employment Industries in Colfax
The major employment industries in Colfax include Retail Trade (120 | 24.4%), Construction (59 | 12.0%), Educational Services (45 | 9.1%), Transportation & Warehousing (43 | 8.7%), and Manufacturing (35 | 7.1%).
Employment Industries by Sex in Colfax
The Colfax industries that see more men than women are Agriculture, Fishing & Hunting (100.0%), Construction (100.0%), and Utilities (100.0%), whereas the industries that tend to have a higher number of women are Health Care & Social Assistance (90.6%), Educational Services (88.9%), and Professional & Scientific (85.0%).
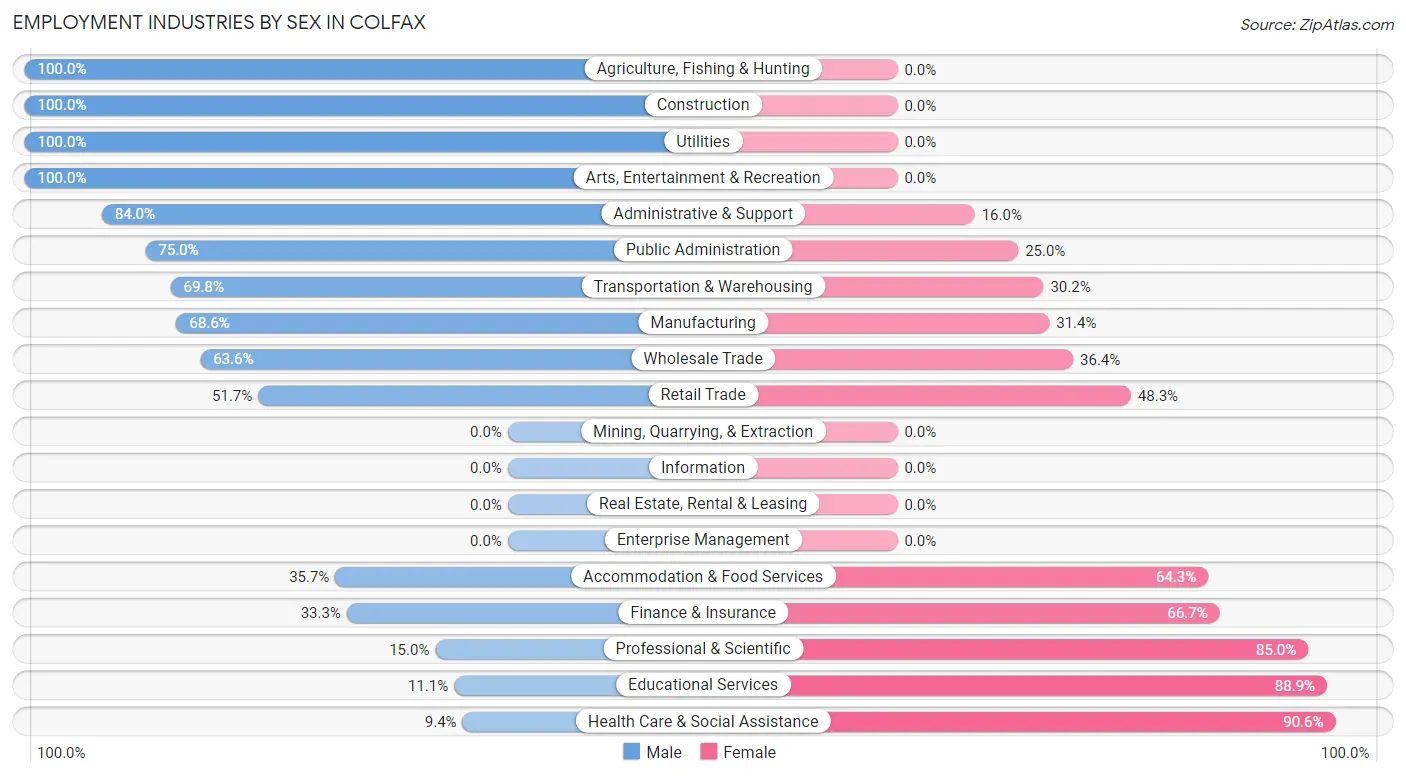
| Industry | Male | Female |
| Agriculture, Fishing & Hunting | 5 (100.0%) | 0 (0.0%) |
| Mining, Quarrying, & Extraction | 0 (0.0%) | 0 (0.0%) |
| Construction | 59 (100.0%) | 0 (0.0%) |
| Manufacturing | 24 (68.6%) | 11 (31.4%) |
| Wholesale Trade | 7 (63.6%) | 4 (36.4%) |
| Retail Trade | 62 (51.7%) | 58 (48.3%) |
| Transportation & Warehousing | 30 (69.8%) | 13 (30.2%) |
| Utilities | 8 (100.0%) | 0 (0.0%) |
| Information | 0 (0.0%) | 0 (0.0%) |
| Finance & Insurance | 10 (33.3%) | 20 (66.7%) |
| Real Estate, Rental & Leasing | 0 (0.0%) | 0 (0.0%) |
| Professional & Scientific | 3 (15.0%) | 17 (85.0%) |
| Enterprise Management | 0 (0.0%) | 0 (0.0%) |
| Administrative & Support | 21 (84.0%) | 4 (16.0%) |
| Educational Services | 5 (11.1%) | 40 (88.9%) |
| Health Care & Social Assistance | 3 (9.4%) | 29 (90.6%) |
| Arts, Entertainment & Recreation | 6 (100.0%) | 0 (0.0%) |
| Accommodation & Food Services | 10 (35.7%) | 18 (64.3%) |
| Public Administration | 12 (75.0%) | 4 (25.0%) |
| Total | 274 (55.7%) | 218 (44.3%) |
Education in Colfax
School Enrollment in Colfax
The most common levels of schooling among the 281 students in Colfax are middle school (90 | 32.0%), elementary school (59 | 21.0%), and high school (58 | 20.6%).
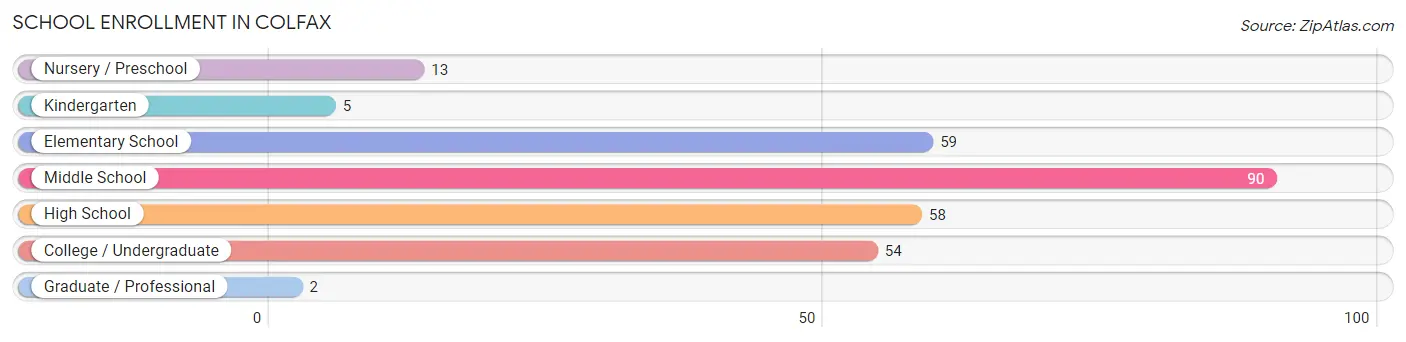
| School Level | # Students | % Students |
| Nursery / Preschool | 13 | 4.6% |
| Kindergarten | 5 | 1.8% |
| Elementary School | 59 | 21.0% |
| Middle School | 90 | 32.0% |
| High School | 58 | 20.6% |
| College / Undergraduate | 54 | 19.2% |
| Graduate / Professional | 2 | 0.7% |
| Total | 281 | 100.0% |
School Enrollment by Age by Funding Source in Colfax
Out of a total of 281 students who are enrolled in schools in Colfax, 4 (1.4%) attend a private institution, while the remaining 277 (98.6%) are enrolled in public schools. The age group of 3 to 4 year olds has the highest likelihood of being enrolled in private schools, with 4 (50.0% in the age bracket) enrolled. Conversely, the age group of 5 to 9 year old has the lowest likelihood of being enrolled in a private school, with 64 (100.0% in the age bracket) attending a public institution.
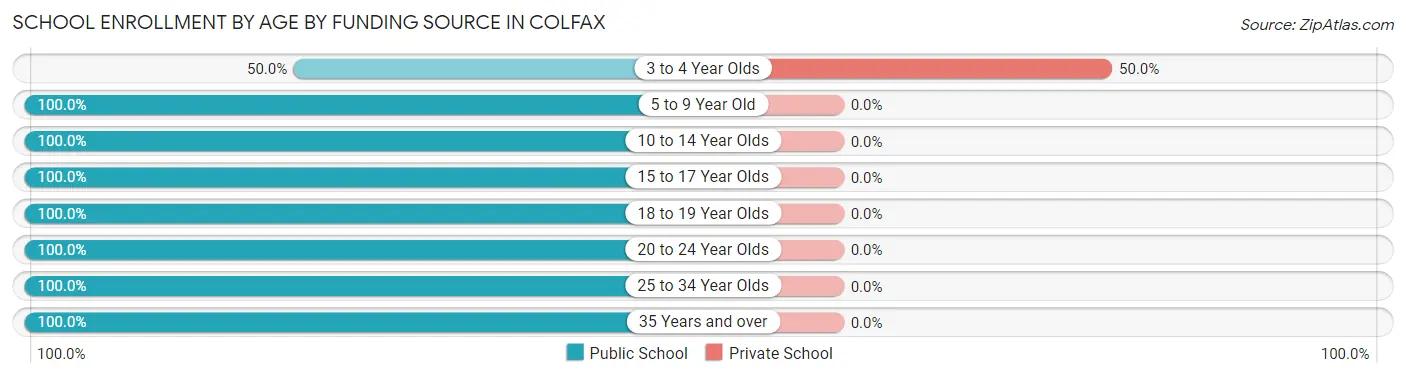
| Age Bracket | Public School | Private School |
| 3 to 4 Year Olds | 4 (50.0%) | 4 (50.0%) |
| 5 to 9 Year Old | 64 (100.0%) | 0 (0.0%) |
| 10 to 14 Year Olds | 95 (100.0%) | 0 (0.0%) |
| 15 to 17 Year Olds | 52 (100.0%) | 0 (0.0%) |
| 18 to 19 Year Olds | 20 (100.0%) | 0 (0.0%) |
| 20 to 24 Year Olds | 21 (100.0%) | 0 (0.0%) |
| 25 to 34 Year Olds | 17 (100.0%) | 0 (0.0%) |
| 35 Years and over | 4 (100.0%) | 0 (0.0%) |
| Total | 277 (98.6%) | 4 (1.4%) |
Educational Attainment by Field of Study in Colfax
Education (42 | 28.4%), arts & humanities (19 | 12.8%), business (15 | 10.1%), computers & mathematics (11 | 7.4%), and physical & health sciences (9 | 6.1%) are the most common fields of study among 148 individuals in Colfax who have obtained a bachelor's degree or higher.
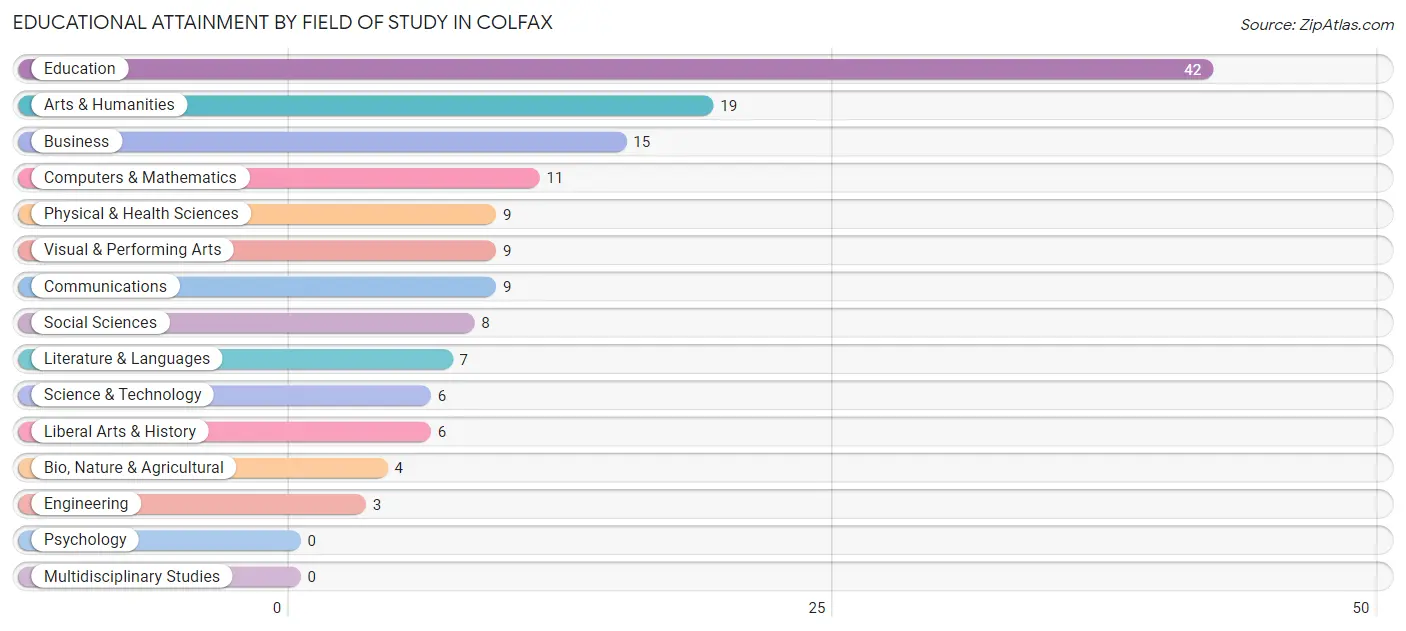
| Field of Study | # Graduates | % Graduates |
| Computers & Mathematics | 11 | 7.4% |
| Bio, Nature & Agricultural | 4 | 2.7% |
| Physical & Health Sciences | 9 | 6.1% |
| Psychology | 0 | 0.0% |
| Social Sciences | 8 | 5.4% |
| Engineering | 3 | 2.0% |
| Multidisciplinary Studies | 0 | 0.0% |
| Science & Technology | 6 | 4.1% |
| Business | 15 | 10.1% |
| Education | 42 | 28.4% |
| Literature & Languages | 7 | 4.7% |
| Liberal Arts & History | 6 | 4.1% |
| Visual & Performing Arts | 9 | 6.1% |
| Communications | 9 | 6.1% |
| Arts & Humanities | 19 | 12.8% |
| Total | 148 | 100.0% |
Transportation & Commute in Colfax
Vehicle Availability by Sex in Colfax
The most prevalent vehicle ownership categories in Colfax are males with 2 vehicles (98, accounting for 35.8%) and females with 2 vehicles (85, making up 46.2%).
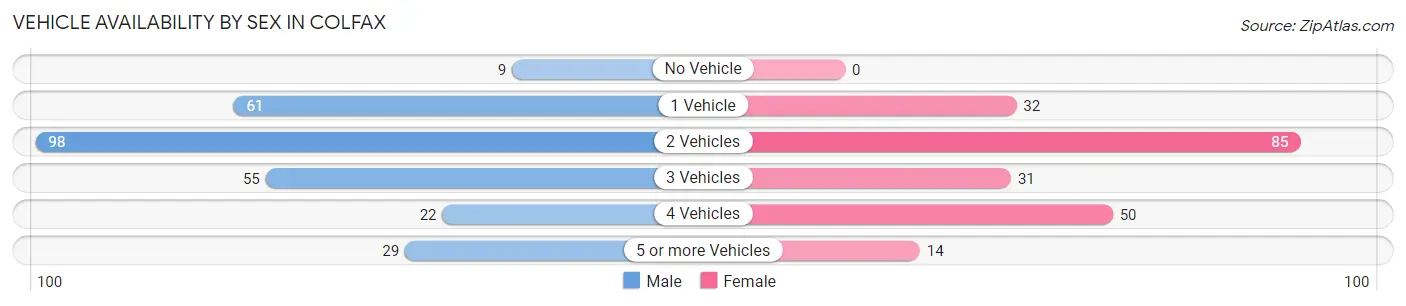
| Vehicles Available | Male | Female |
| No Vehicle | 9 (3.3%) | 0 (0.0%) |
| 1 Vehicle | 61 (22.3%) | 32 (15.1%) |
| 2 Vehicles | 98 (35.8%) | 85 (40.1%) |
| 3 Vehicles | 55 (20.1%) | 31 (14.6%) |
| 4 Vehicles | 22 (8.0%) | 50 (23.6%) |
| 5 or more Vehicles | 29 (10.6%) | 14 (6.6%) |
| Total | 274 (100.0%) | 212 (100.0%) |
Commute Time in Colfax
The most frequently occuring commute durations in Colfax are 30 to 34 minutes (103 commuters, 23.3%), 25 to 29 minutes (82 commuters, 18.5%), and 35 to 39 minutes (51 commuters, 11.5%).
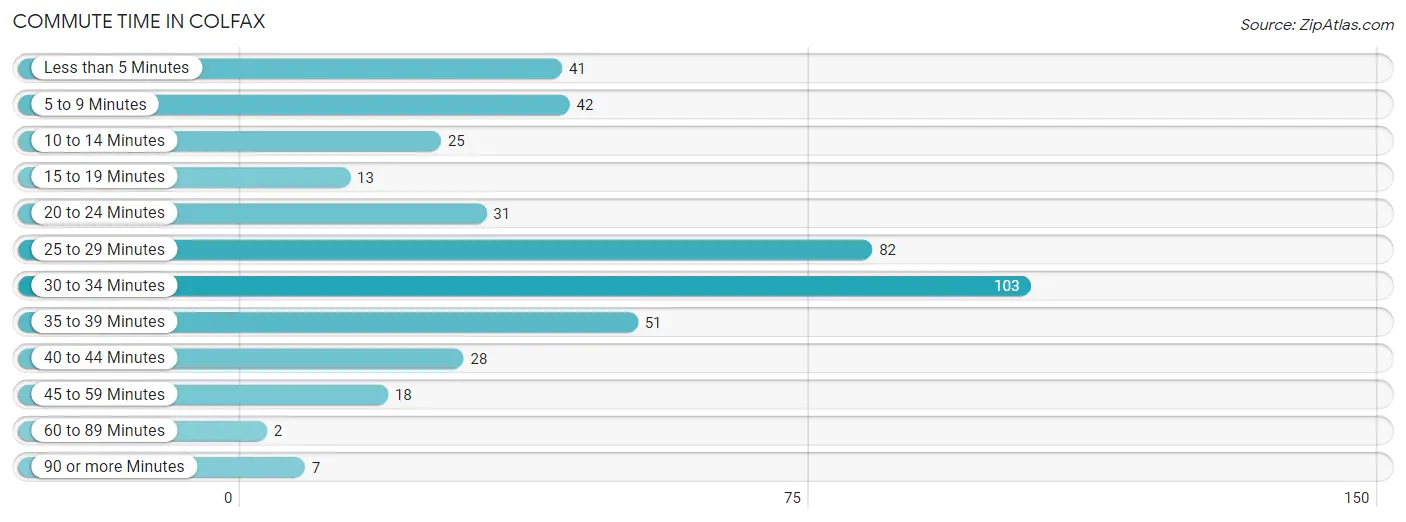
| Commute Time | # Commuters | % Commuters |
| Less than 5 Minutes | 41 | 9.3% |
| 5 to 9 Minutes | 42 | 9.5% |
| 10 to 14 Minutes | 25 | 5.6% |
| 15 to 19 Minutes | 13 | 2.9% |
| 20 to 24 Minutes | 31 | 7.0% |
| 25 to 29 Minutes | 82 | 18.5% |
| 30 to 34 Minutes | 103 | 23.3% |
| 35 to 39 Minutes | 51 | 11.5% |
| 40 to 44 Minutes | 28 | 6.3% |
| 45 to 59 Minutes | 18 | 4.1% |
| 60 to 89 Minutes | 2 | 0.4% |
| 90 or more Minutes | 7 | 1.6% |
Commute Time by Sex in Colfax
The most common commute times in Colfax are 30 to 34 minutes (57 commuters, 21.7%) for males and 25 to 29 minutes (50 commuters, 27.8%) for females.
| Commute Time | Male | Female |
| Less than 5 Minutes | 30 (11.4%) | 11 (6.1%) |
| 5 to 9 Minutes | 38 (14.4%) | 4 (2.2%) |
| 10 to 14 Minutes | 25 (9.5%) | 0 (0.0%) |
| 15 to 19 Minutes | 9 (3.4%) | 4 (2.2%) |
| 20 to 24 Minutes | 25 (9.5%) | 6 (3.3%) |
| 25 to 29 Minutes | 32 (12.2%) | 50 (27.8%) |
| 30 to 34 Minutes | 57 (21.7%) | 46 (25.6%) |
| 35 to 39 Minutes | 10 (3.8%) | 41 (22.8%) |
| 40 to 44 Minutes | 21 (8.0%) | 7 (3.9%) |
| 45 to 59 Minutes | 9 (3.4%) | 9 (5.0%) |
| 60 to 89 Minutes | 2 (0.8%) | 0 (0.0%) |
| 90 or more Minutes | 5 (1.9%) | 2 (1.1%) |
Time of Departure to Work by Sex in Colfax
The most frequent times of departure to work in Colfax are 6:00 AM to 6:29 AM (66, 25.1%) for males and 7:00 AM to 7:29 AM (50, 27.8%) for females.
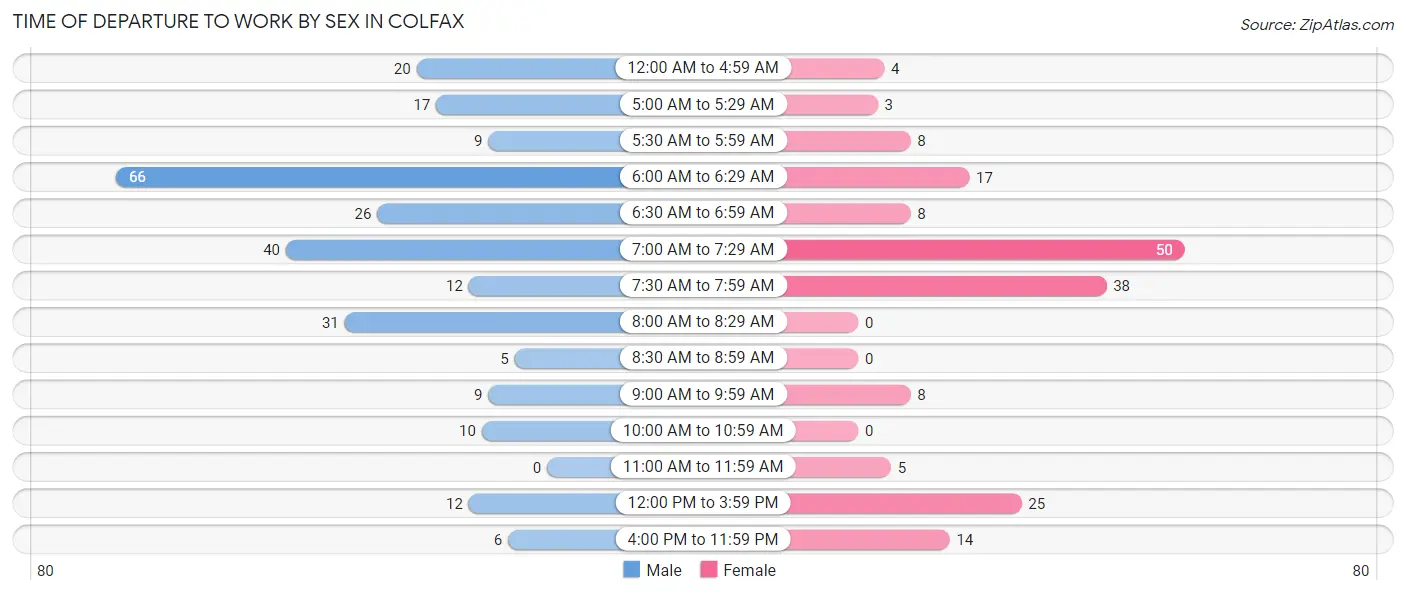
| Time of Departure | Male | Female |
| 12:00 AM to 4:59 AM | 20 (7.6%) | 4 (2.2%) |
| 5:00 AM to 5:29 AM | 17 (6.5%) | 3 (1.7%) |
| 5:30 AM to 5:59 AM | 9 (3.4%) | 8 (4.4%) |
| 6:00 AM to 6:29 AM | 66 (25.1%) | 17 (9.4%) |
| 6:30 AM to 6:59 AM | 26 (9.9%) | 8 (4.4%) |
| 7:00 AM to 7:29 AM | 40 (15.2%) | 50 (27.8%) |
| 7:30 AM to 7:59 AM | 12 (4.6%) | 38 (21.1%) |
| 8:00 AM to 8:29 AM | 31 (11.8%) | 0 (0.0%) |
| 8:30 AM to 8:59 AM | 5 (1.9%) | 0 (0.0%) |
| 9:00 AM to 9:59 AM | 9 (3.4%) | 8 (4.4%) |
| 10:00 AM to 10:59 AM | 10 (3.8%) | 0 (0.0%) |
| 11:00 AM to 11:59 AM | 0 (0.0%) | 5 (2.8%) |
| 12:00 PM to 3:59 PM | 12 (4.6%) | 25 (13.9%) |
| 4:00 PM to 11:59 PM | 6 (2.3%) | 14 (7.8%) |
| Total | 263 (100.0%) | 180 (100.0%) |
Housing Occupancy in Colfax
Occupancy by Ownership in Colfax
Of the total 366 dwellings in Colfax, owner-occupied units account for 257 (70.2%), while renter-occupied units make up 109 (29.8%).
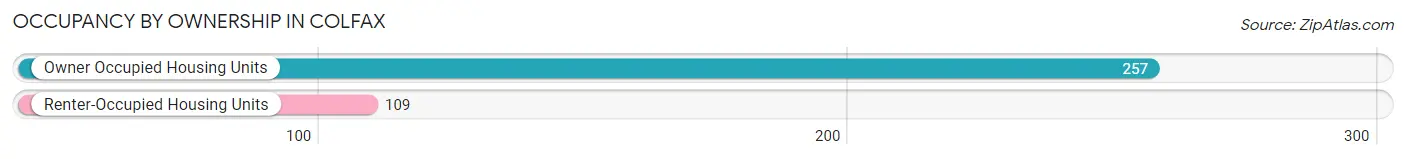
| Occupancy | # Housing Units | % Housing Units |
| Owner Occupied Housing Units | 257 | 70.2% |
| Renter-Occupied Housing Units | 109 | 29.8% |
| Total Occupied Housing Units | 366 | 100.0% |
Occupancy by Household Size in Colfax
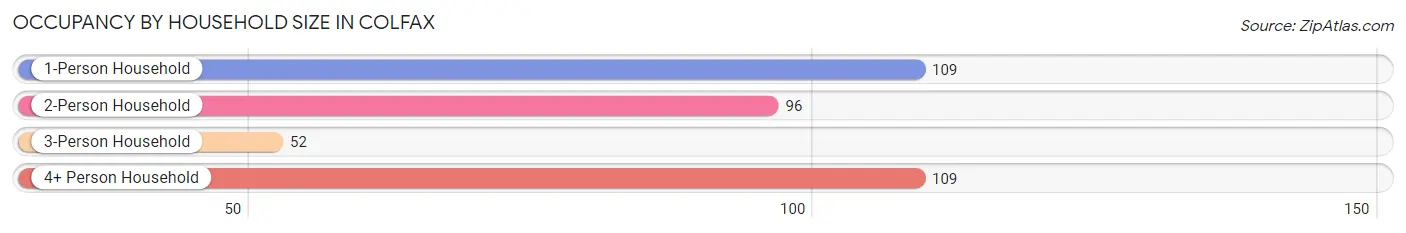
| Household Size | # Housing Units | % Housing Units |
| 1-Person Household | 109 | 29.8% |
| 2-Person Household | 96 | 26.2% |
| 3-Person Household | 52 | 14.2% |
| 4+ Person Household | 109 | 29.8% |
| Total Housing Units | 366 | 100.0% |
Occupancy by Ownership by Household Size in Colfax
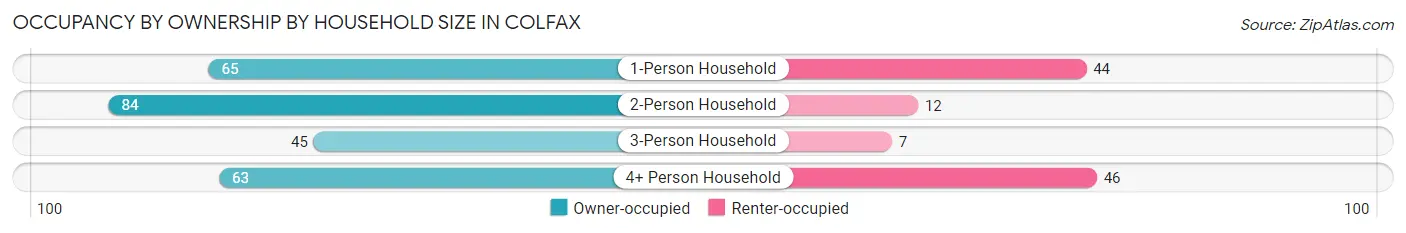
| Household Size | Owner-occupied | Renter-occupied |
| 1-Person Household | 65 (59.6%) | 44 (40.4%) |
| 2-Person Household | 84 (87.5%) | 12 (12.5%) |
| 3-Person Household | 45 (86.5%) | 7 (13.5%) |
| 4+ Person Household | 63 (57.8%) | 46 (42.2%) |
| Total Housing Units | 257 (70.2%) | 109 (29.8%) |
Occupancy by Educational Attainment in Colfax
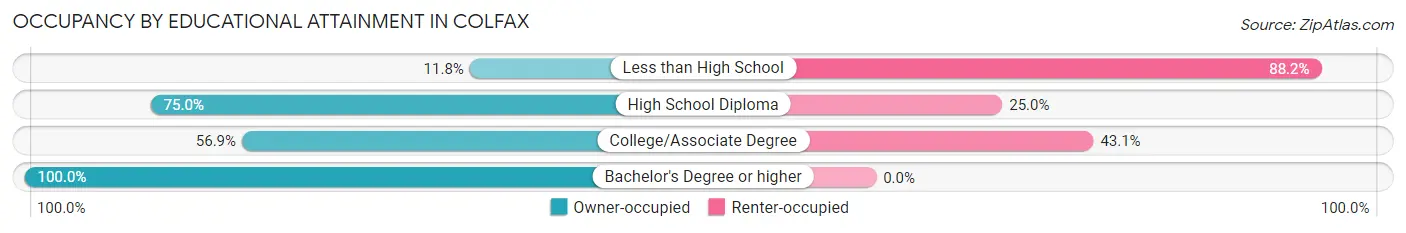
| Household Size | Owner-occupied | Renter-occupied |
| Less than High School | 2 (11.8%) | 15 (88.2%) |
| High School Diploma | 114 (75.0%) | 38 (25.0%) |
| College/Associate Degree | 74 (56.9%) | 56 (43.1%) |
| Bachelor's Degree or higher | 67 (100.0%) | 0 (0.0%) |
Occupancy by Age of Householder in Colfax
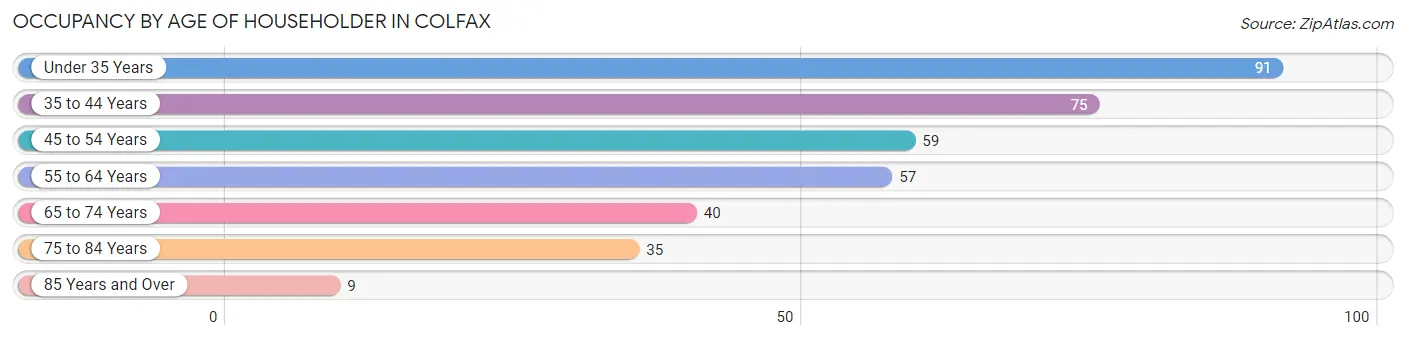
| Age Bracket | # Households | % Households |
| Under 35 Years | 91 | 24.9% |
| 35 to 44 Years | 75 | 20.5% |
| 45 to 54 Years | 59 | 16.1% |
| 55 to 64 Years | 57 | 15.6% |
| 65 to 74 Years | 40 | 10.9% |
| 75 to 84 Years | 35 | 9.6% |
| 85 Years and Over | 9 | 2.5% |
| Total | 366 | 100.0% |
Housing Finances in Colfax
Median Income by Occupancy in Colfax
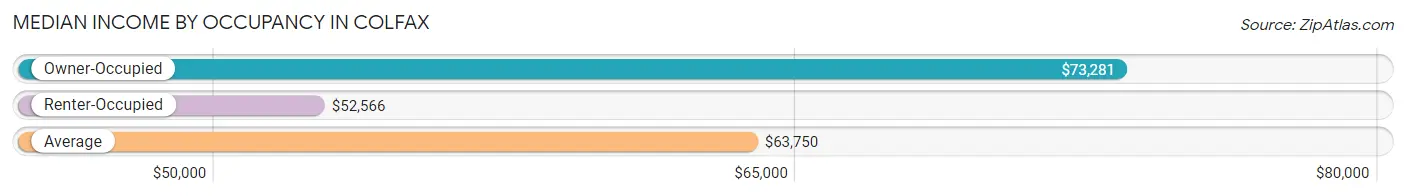
| Occupancy Type | # Households | Median Income |
| Owner-Occupied | 257 (70.2%) | $73,281 |
| Renter-Occupied | 109 (29.8%) | $52,566 |
| Average | 366 (100.0%) | $63,750 |
Occupancy by Householder Income Bracket in Colfax
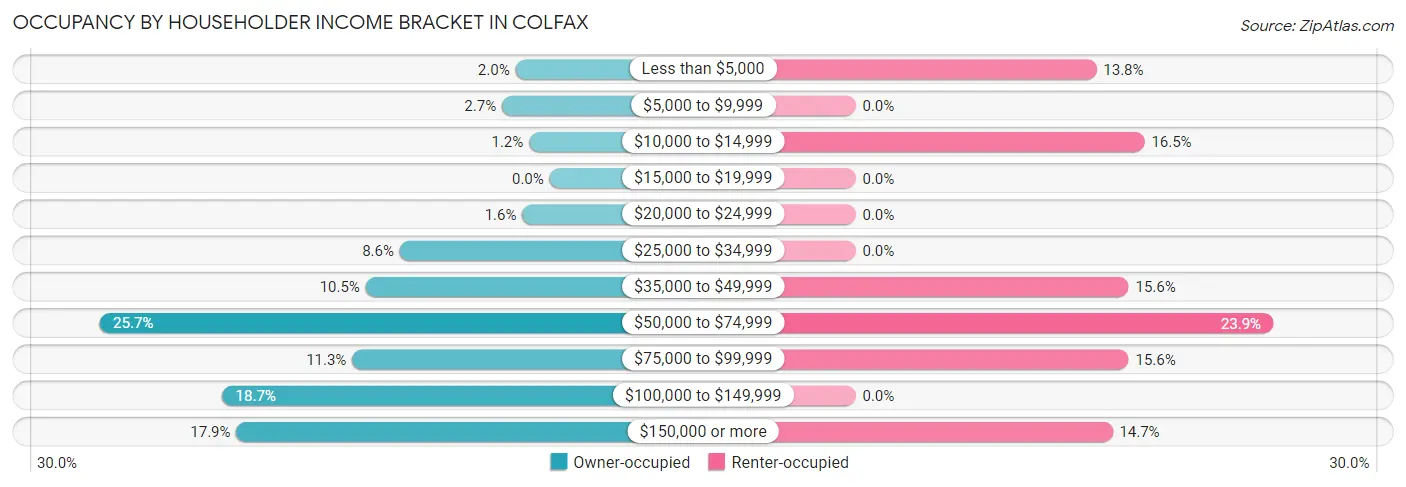
| Income Bracket | Owner-occupied | Renter-occupied |
| Less than $5,000 | 5 (1.9%) | 15 (13.8%) |
| $5,000 to $9,999 | 7 (2.7%) | 0 (0.0%) |
| $10,000 to $14,999 | 3 (1.2%) | 18 (16.5%) |
| $15,000 to $19,999 | 0 (0.0%) | 0 (0.0%) |
| $20,000 to $24,999 | 4 (1.6%) | 0 (0.0%) |
| $25,000 to $34,999 | 22 (8.6%) | 0 (0.0%) |
| $35,000 to $49,999 | 27 (10.5%) | 17 (15.6%) |
| $50,000 to $74,999 | 66 (25.7%) | 26 (23.8%) |
| $75,000 to $99,999 | 29 (11.3%) | 17 (15.6%) |
| $100,000 to $149,999 | 48 (18.7%) | 0 (0.0%) |
| $150,000 or more | 46 (17.9%) | 16 (14.7%) |
| Total | 257 (100.0%) | 109 (100.0%) |
Monthly Housing Cost Tiers in Colfax
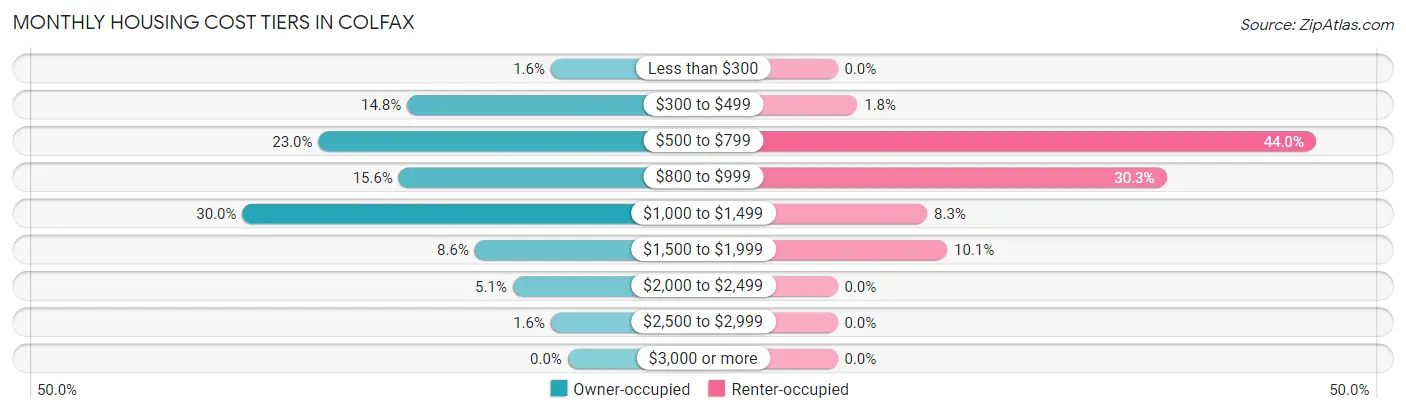
| Monthly Cost | Owner-occupied | Renter-occupied |
| Less than $300 | 4 (1.6%) | 0 (0.0%) |
| $300 to $499 | 38 (14.8%) | 2 (1.8%) |
| $500 to $799 | 59 (23.0%) | 48 (44.0%) |
| $800 to $999 | 40 (15.6%) | 33 (30.3%) |
| $1,000 to $1,499 | 77 (30.0%) | 9 (8.3%) |
| $1,500 to $1,999 | 22 (8.6%) | 11 (10.1%) |
| $2,000 to $2,499 | 13 (5.1%) | 0 (0.0%) |
| $2,500 to $2,999 | 4 (1.6%) | 0 (0.0%) |
| $3,000 or more | 0 (0.0%) | 0 (0.0%) |
| Total | 257 (100.0%) | 109 (100.0%) |
Physical Housing Characteristics in Colfax
Housing Structures in Colfax
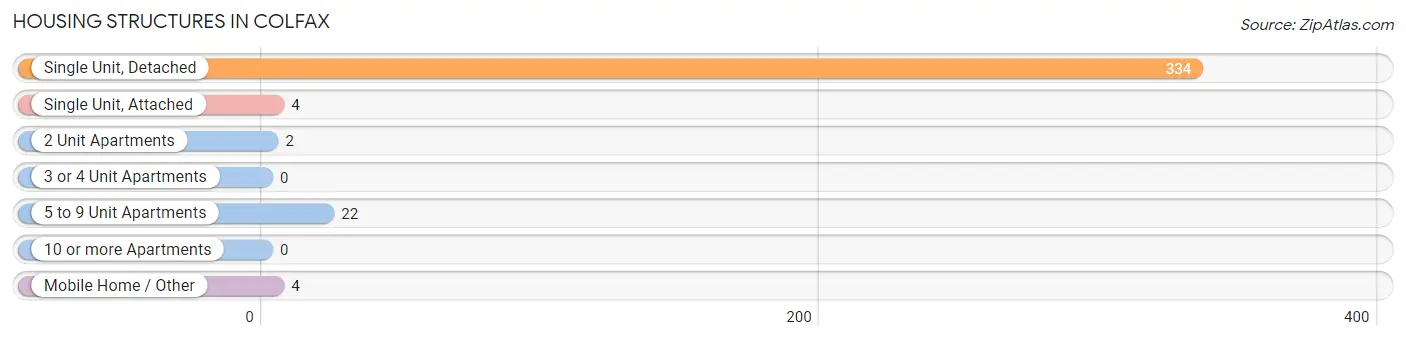
| Structure Type | # Housing Units | % Housing Units |
| Single Unit, Detached | 334 | 91.3% |
| Single Unit, Attached | 4 | 1.1% |
| 2 Unit Apartments | 2 | 0.5% |
| 3 or 4 Unit Apartments | 0 | 0.0% |
| 5 to 9 Unit Apartments | 22 | 6.0% |
| 10 or more Apartments | 0 | 0.0% |
| Mobile Home / Other | 4 | 1.1% |
| Total | 366 | 100.0% |
Housing Structures by Occupancy in Colfax
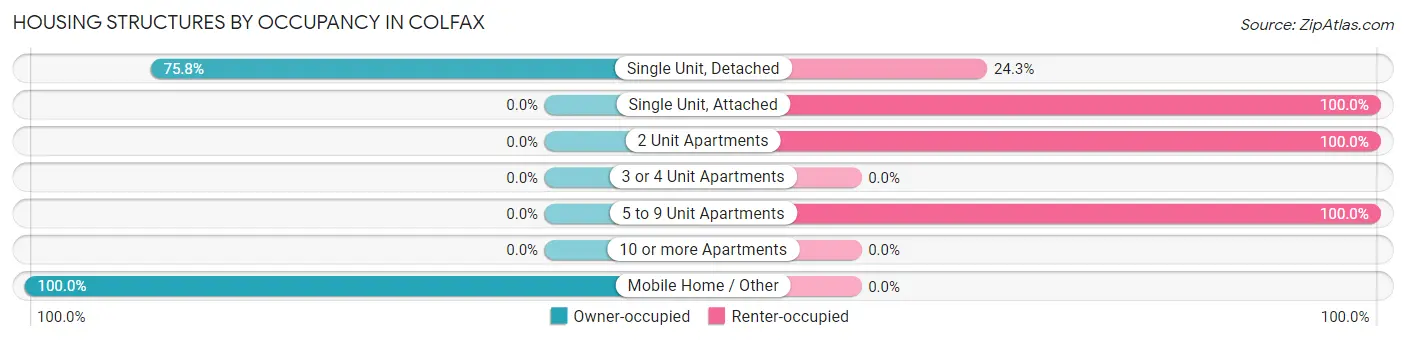
| Structure Type | Owner-occupied | Renter-occupied |
| Single Unit, Detached | 253 (75.7%) | 81 (24.2%) |
| Single Unit, Attached | 0 (0.0%) | 4 (100.0%) |
| 2 Unit Apartments | 0 (0.0%) | 2 (100.0%) |
| 3 or 4 Unit Apartments | 0 (0.0%) | 0 (0.0%) |
| 5 to 9 Unit Apartments | 0 (0.0%) | 22 (100.0%) |
| 10 or more Apartments | 0 (0.0%) | 0 (0.0%) |
| Mobile Home / Other | 4 (100.0%) | 0 (0.0%) |
| Total | 257 (70.2%) | 109 (29.8%) |
Housing Structures by Number of Rooms in Colfax
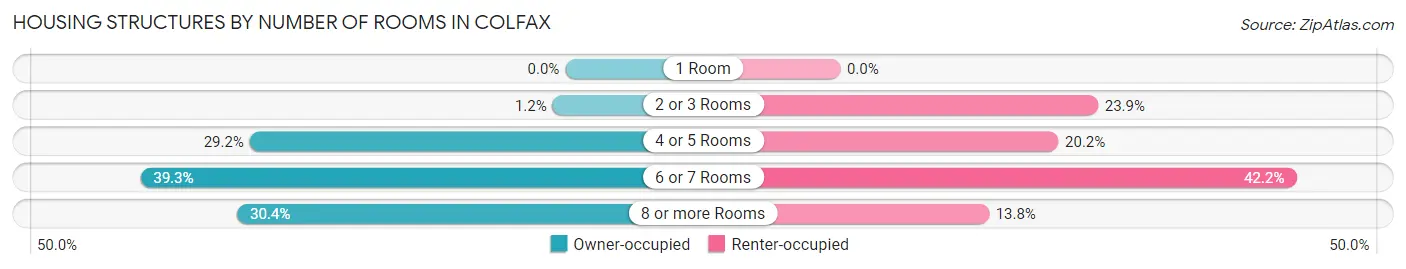
| Number of Rooms | Owner-occupied | Renter-occupied |
| 1 Room | 0 (0.0%) | 0 (0.0%) |
| 2 or 3 Rooms | 3 (1.2%) | 26 (23.8%) |
| 4 or 5 Rooms | 75 (29.2%) | 22 (20.2%) |
| 6 or 7 Rooms | 101 (39.3%) | 46 (42.2%) |
| 8 or more Rooms | 78 (30.3%) | 15 (13.8%) |
| Total | 257 (100.0%) | 109 (100.0%) |
Housing Structure by Heating Type in Colfax
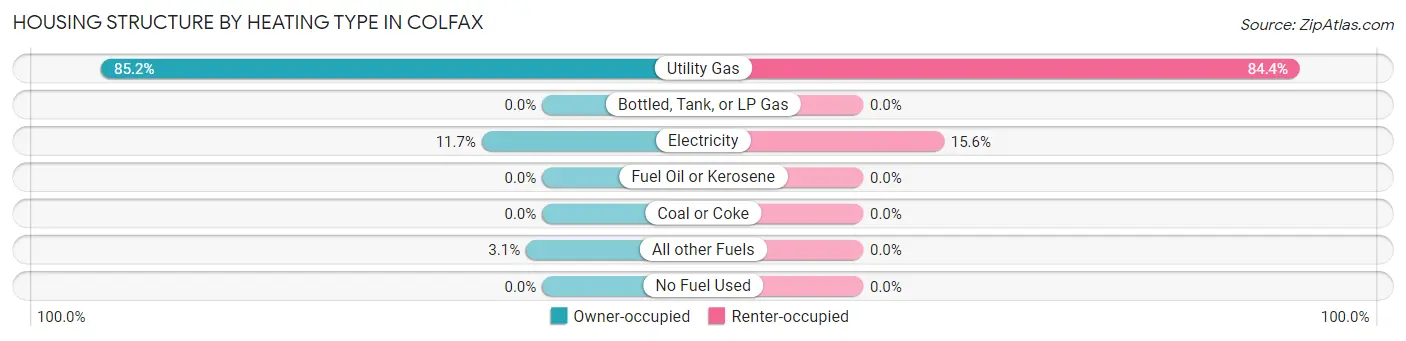
| Heating Type | Owner-occupied | Renter-occupied |
| Utility Gas | 219 (85.2%) | 92 (84.4%) |
| Bottled, Tank, or LP Gas | 0 (0.0%) | 0 (0.0%) |
| Electricity | 30 (11.7%) | 17 (15.6%) |
| Fuel Oil or Kerosene | 0 (0.0%) | 0 (0.0%) |
| Coal or Coke | 0 (0.0%) | 0 (0.0%) |
| All other Fuels | 8 (3.1%) | 0 (0.0%) |
| No Fuel Used | 0 (0.0%) | 0 (0.0%) |
| Total | 257 (100.0%) | 109 (100.0%) |
Household Vehicle Usage in Colfax
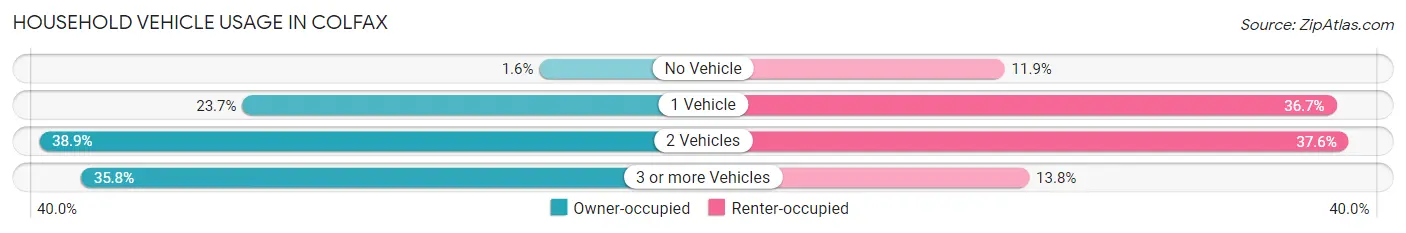
| Vehicles per Household | Owner-occupied | Renter-occupied |
| No Vehicle | 4 (1.6%) | 13 (11.9%) |
| 1 Vehicle | 61 (23.7%) | 40 (36.7%) |
| 2 Vehicles | 100 (38.9%) | 41 (37.6%) |
| 3 or more Vehicles | 92 (35.8%) | 15 (13.8%) |
| Total | 257 (100.0%) | 109 (100.0%) |
Real Estate & Mortgages in Colfax
Real Estate and Mortgage Overview in Colfax
| Characteristic | Without Mortgage | With Mortgage |
| Housing Units | 82 | 175 |
| Median Property Value | $123,300 | $116,100 |
| Median Household Income | $54,167 | $43 |
| Monthly Housing Costs | $493 | $0 |
| Real Estate Taxes | $1,850 | $0 |
Property Value by Mortgage Status in Colfax
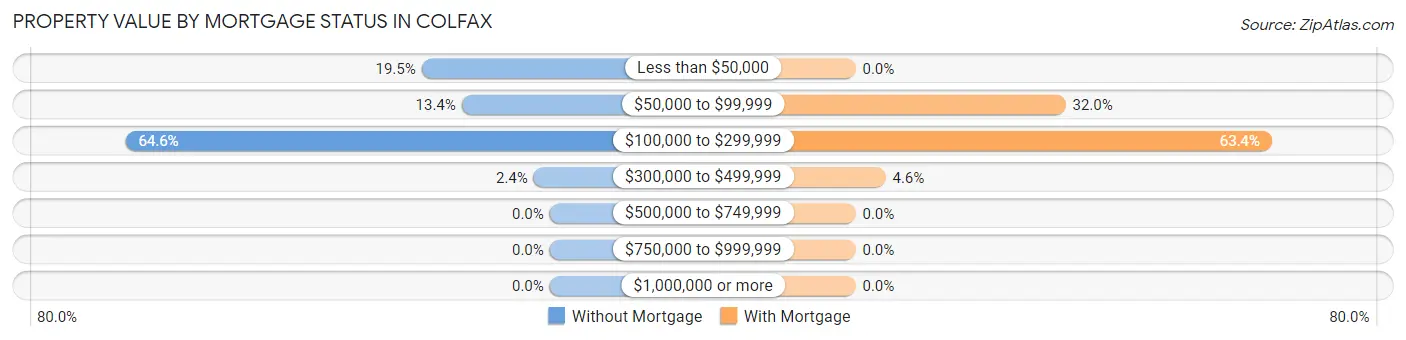
| Property Value | Without Mortgage | With Mortgage |
| Less than $50,000 | 16 (19.5%) | 0 (0.0%) |
| $50,000 to $99,999 | 11 (13.4%) | 56 (32.0%) |
| $100,000 to $299,999 | 53 (64.6%) | 111 (63.4%) |
| $300,000 to $499,999 | 2 (2.4%) | 8 (4.6%) |
| $500,000 to $749,999 | 0 (0.0%) | 0 (0.0%) |
| $750,000 to $999,999 | 0 (0.0%) | 0 (0.0%) |
| $1,000,000 or more | 0 (0.0%) | 0 (0.0%) |
| Total | 82 (100.0%) | 175 (100.0%) |
Household Income by Mortgage Status in Colfax

| Household Income | Without Mortgage | With Mortgage |
| Less than $10,000 | 0 (0.0%) | 0 (0.0%) |
| $10,000 to $24,999 | 4 (4.9%) | 12 (6.9%) |
| $25,000 to $34,999 | 15 (18.3%) | 3 (1.7%) |
| $35,000 to $49,999 | 18 (22.0%) | 7 (4.0%) |
| $50,000 to $74,999 | 27 (32.9%) | 9 (5.1%) |
| $75,000 to $99,999 | 6 (7.3%) | 39 (22.3%) |
| $100,000 to $149,999 | 9 (11.0%) | 23 (13.1%) |
| $150,000 or more | 3 (3.7%) | 39 (22.3%) |
| Total | 82 (100.0%) | 175 (100.0%) |
Property Value to Household Income Ratio in Colfax
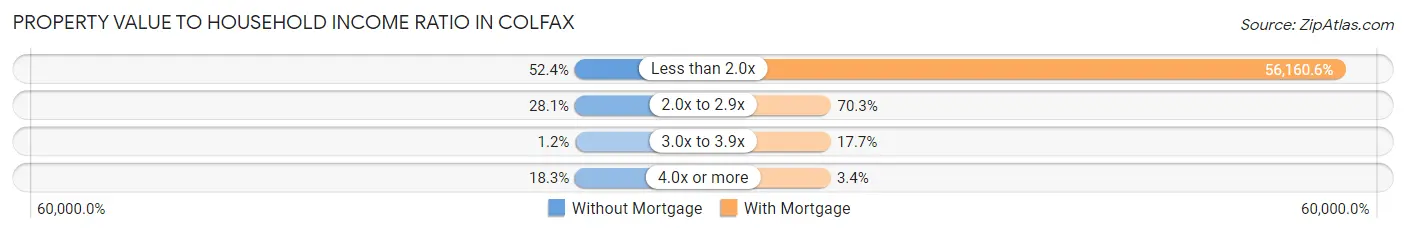
| Value-to-Income Ratio | Without Mortgage | With Mortgage |
| Less than 2.0x | 43 (52.4%) | 98,281 (56,160.6%) |
| 2.0x to 2.9x | 23 (28.1%) | 123 (70.3%) |
| 3.0x to 3.9x | 1 (1.2%) | 31 (17.7%) |
| 4.0x or more | 15 (18.3%) | 6 (3.4%) |
| Total | 82 (100.0%) | 175 (100.0%) |
Real Estate Taxes by Mortgage Status in Colfax
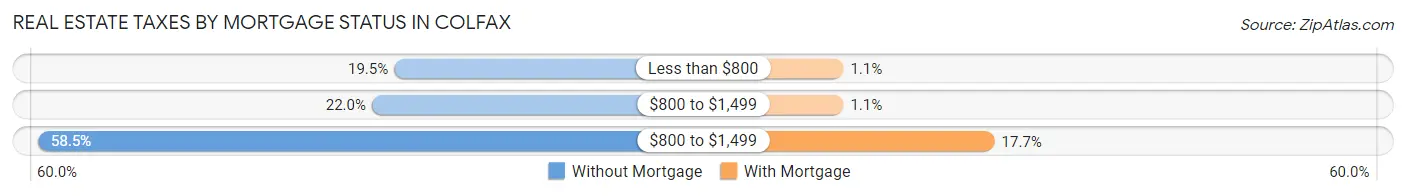
| Property Taxes | Without Mortgage | With Mortgage |
| Less than $800 | 16 (19.5%) | 2 (1.1%) |
| $800 to $1,499 | 18 (22.0%) | 2 (1.1%) |
| $800 to $1,499 | 48 (58.5%) | 31 (17.7%) |
| Total | 82 (100.0%) | 175 (100.0%) |
Health & Disability in Colfax
Health Insurance Coverage by Age in Colfax
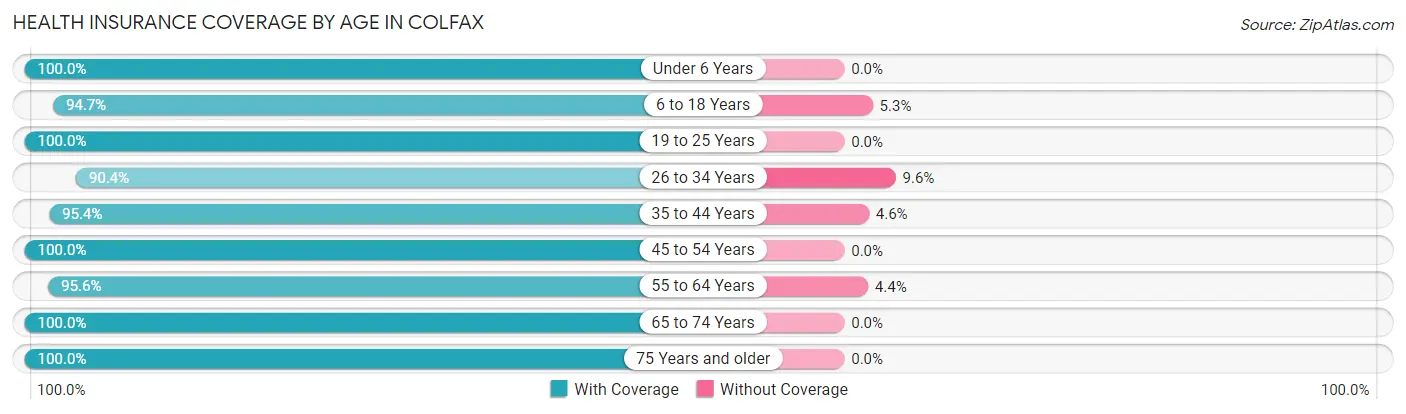
| Age Bracket | With Coverage | Without Coverage |
| Under 6 Years | 67 (100.0%) | 0 (0.0%) |
| 6 to 18 Years | 215 (94.7%) | 12 (5.3%) |
| 19 to 25 Years | 110 (100.0%) | 0 (0.0%) |
| 26 to 34 Years | 104 (90.4%) | 11 (9.6%) |
| 35 to 44 Years | 146 (95.4%) | 7 (4.6%) |
| 45 to 54 Years | 86 (100.0%) | 0 (0.0%) |
| 55 to 64 Years | 87 (95.6%) | 4 (4.4%) |
| 65 to 74 Years | 75 (100.0%) | 0 (0.0%) |
| 75 Years and older | 61 (100.0%) | 0 (0.0%) |
| Total | 951 (96.6%) | 34 (3.5%) |
Health Insurance Coverage by Citizenship Status in Colfax
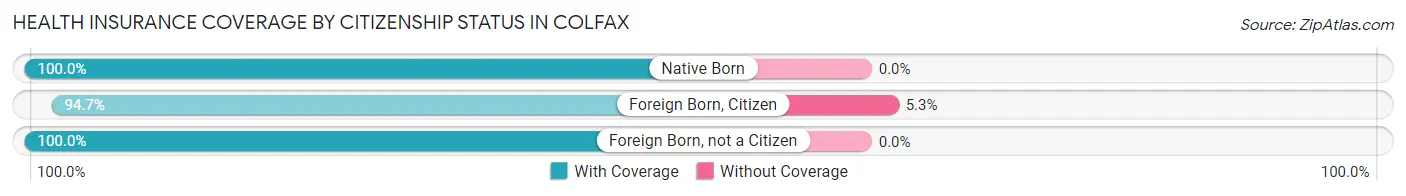
| Citizenship Status | With Coverage | Without Coverage |
| Native Born | 67 (100.0%) | 0 (0.0%) |
| Foreign Born, Citizen | 215 (94.7%) | 12 (5.3%) |
| Foreign Born, not a Citizen | 110 (100.0%) | 0 (0.0%) |
Health Insurance Coverage by Household Income in Colfax
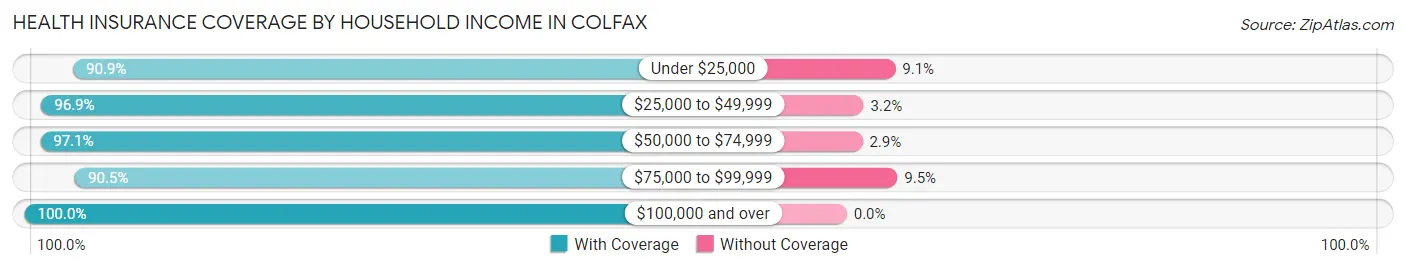
| Household Income | With Coverage | Without Coverage |
| Under $25,000 | 70 (90.9%) | 7 (9.1%) |
| $25,000 to $49,999 | 123 (96.9%) | 4 (3.2%) |
| $50,000 to $74,999 | 231 (97.1%) | 7 (2.9%) |
| $75,000 to $99,999 | 153 (90.5%) | 16 (9.5%) |
| $100,000 and over | 374 (100.0%) | 0 (0.0%) |
Public vs Private Health Insurance Coverage by Age in Colfax
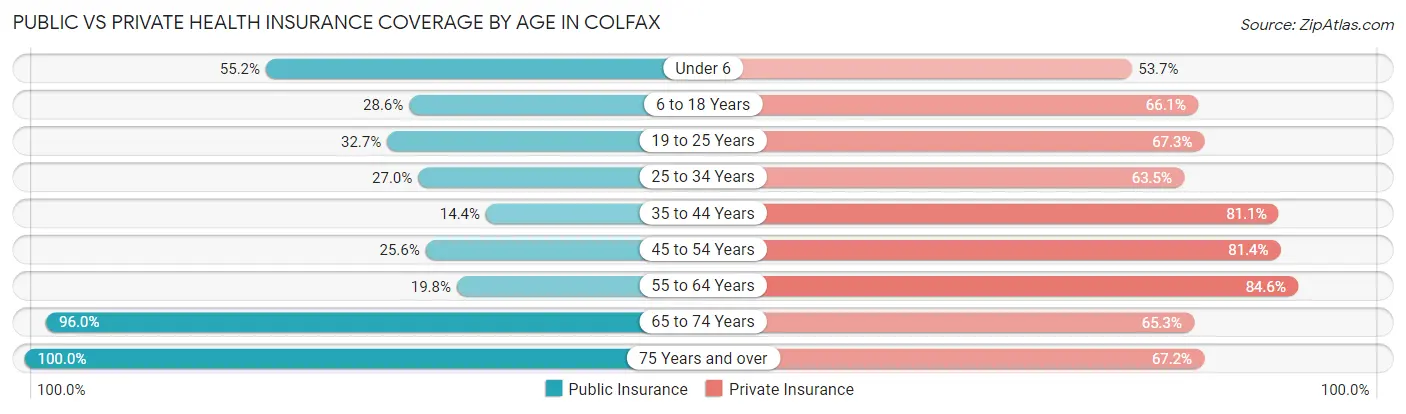
| Age Bracket | Public Insurance | Private Insurance |
| Under 6 | 37 (55.2%) | 36 (53.7%) |
| 6 to 18 Years | 65 (28.6%) | 150 (66.1%) |
| 19 to 25 Years | 36 (32.7%) | 74 (67.3%) |
| 25 to 34 Years | 31 (27.0%) | 73 (63.5%) |
| 35 to 44 Years | 22 (14.4%) | 124 (81.0%) |
| 45 to 54 Years | 22 (25.6%) | 70 (81.4%) |
| 55 to 64 Years | 18 (19.8%) | 77 (84.6%) |
| 65 to 74 Years | 72 (96.0%) | 49 (65.3%) |
| 75 Years and over | 61 (100.0%) | 41 (67.2%) |
| Total | 364 (36.9%) | 694 (70.5%) |
Disability Status by Sex by Age in Colfax
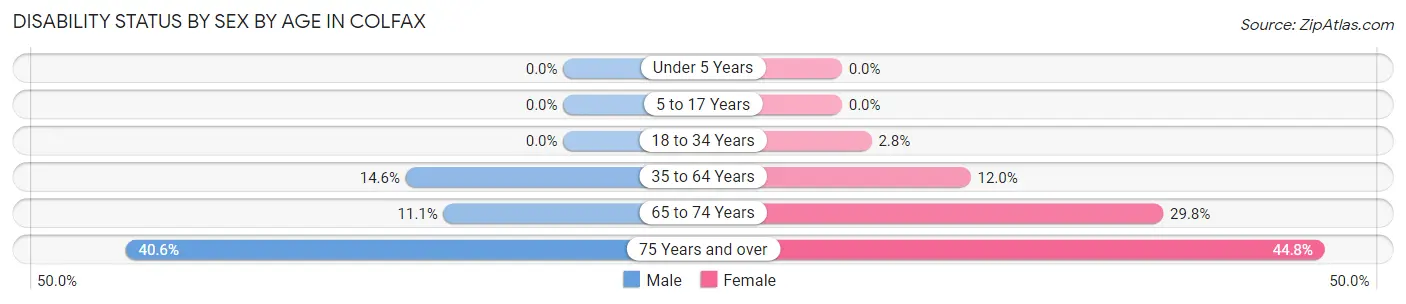
| Age Bracket | Male | Female |
| Under 5 Years | 0 (0.0%) | 0 (0.0%) |
| 5 to 17 Years | 0 (0.0%) | 0 (0.0%) |
| 18 to 34 Years | 0 (0.0%) | 3 (2.8%) |
| 35 to 64 Years | 25 (14.6%) | 19 (11.9%) |
| 65 to 74 Years | 2 (11.1%) | 17 (29.8%) |
| 75 Years and over | 13 (40.6%) | 13 (44.8%) |
Disability Class by Sex by Age in Colfax
Disability Class: Hearing Difficulty
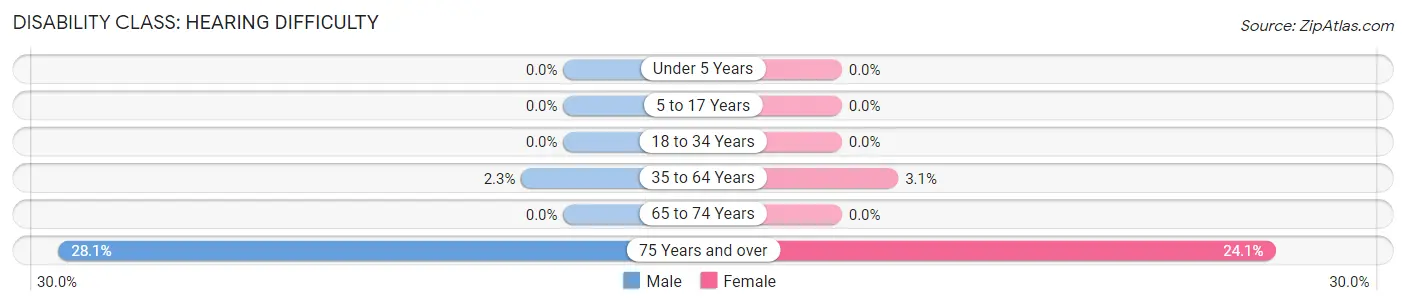
| Age Bracket | Male | Female |
| Under 5 Years | 0 (0.0%) | 0 (0.0%) |
| 5 to 17 Years | 0 (0.0%) | 0 (0.0%) |
| 18 to 34 Years | 0 (0.0%) | 0 (0.0%) |
| 35 to 64 Years | 4 (2.3%) | 5 (3.1%) |
| 65 to 74 Years | 0 (0.0%) | 0 (0.0%) |
| 75 Years and over | 9 (28.1%) | 7 (24.1%) |
Disability Class: Vision Difficulty
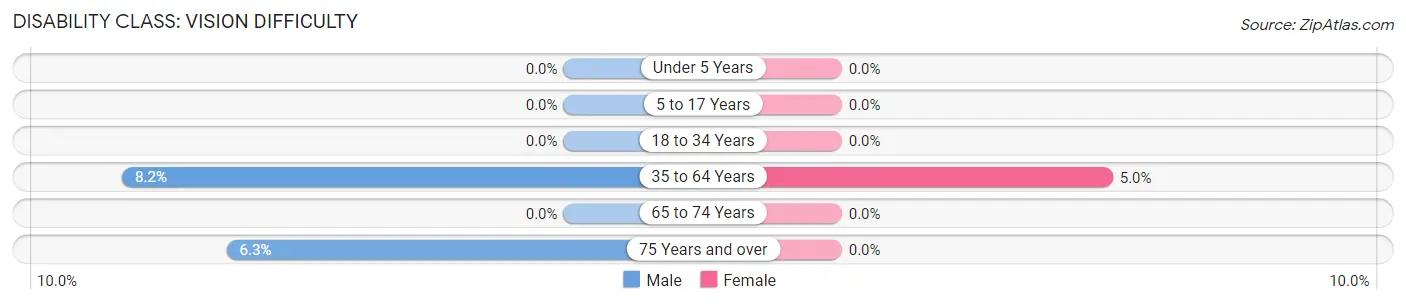
| Age Bracket | Male | Female |
| Under 5 Years | 0 (0.0%) | 0 (0.0%) |
| 5 to 17 Years | 0 (0.0%) | 0 (0.0%) |
| 18 to 34 Years | 0 (0.0%) | 0 (0.0%) |
| 35 to 64 Years | 14 (8.2%) | 8 (5.0%) |
| 65 to 74 Years | 0 (0.0%) | 0 (0.0%) |
| 75 Years and over | 2 (6.2%) | 0 (0.0%) |
Disability Class: Cognitive Difficulty
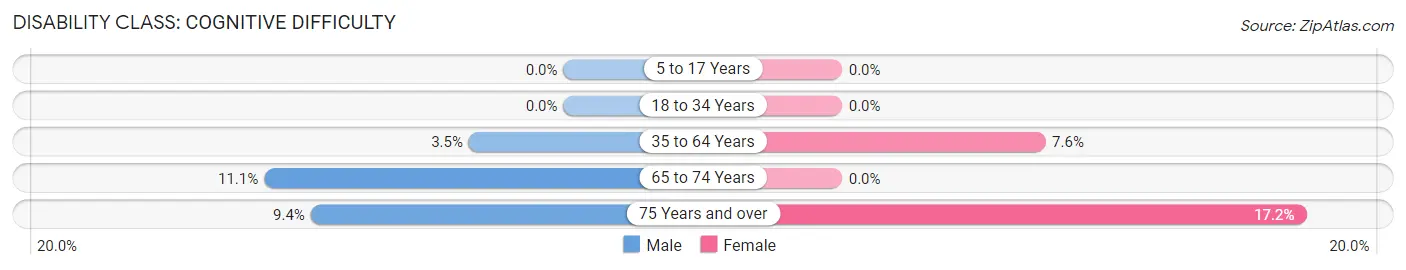
| Age Bracket | Male | Female |
| 5 to 17 Years | 0 (0.0%) | 0 (0.0%) |
| 18 to 34 Years | 0 (0.0%) | 0 (0.0%) |
| 35 to 64 Years | 6 (3.5%) | 12 (7.5%) |
| 65 to 74 Years | 2 (11.1%) | 0 (0.0%) |
| 75 Years and over | 3 (9.4%) | 5 (17.2%) |
Disability Class: Ambulatory Difficulty
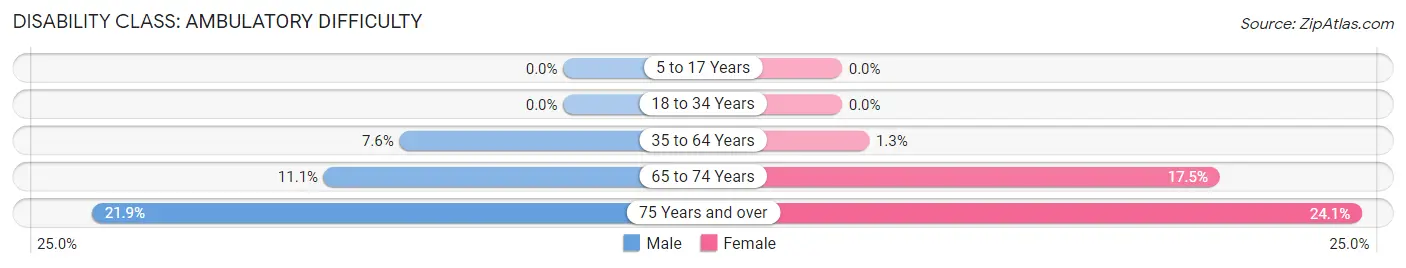
| Age Bracket | Male | Female |
| 5 to 17 Years | 0 (0.0%) | 0 (0.0%) |
| 18 to 34 Years | 0 (0.0%) | 0 (0.0%) |
| 35 to 64 Years | 13 (7.6%) | 2 (1.3%) |
| 65 to 74 Years | 2 (11.1%) | 10 (17.5%) |
| 75 Years and over | 7 (21.9%) | 7 (24.1%) |
Disability Class: Self-Care Difficulty
| Age Bracket | Male | Female |
| 5 to 17 Years | 0 (0.0%) | 0 (0.0%) |
| 18 to 34 Years | 0 (0.0%) | 0 (0.0%) |
| 35 to 64 Years | 0 (0.0%) | 4 (2.5%) |
| 65 to 74 Years | 0 (0.0%) | 0 (0.0%) |
| 75 Years and over | 3 (9.4%) | 6 (20.7%) |
Technology Access in Colfax
Computing Device Access in Colfax
| Device Type | # Households | % Households |
| Desktop or Laptop | 246 | 67.2% |
| Smartphone | 314 | 85.8% |
| Tablet | 175 | 47.8% |
| No Computing Device | 24 | 6.6% |
| Total | 366 | 100.0% |
Internet Access in Colfax
| Internet Type | # Households | % Households |
| Dial-Up Internet | 7 | 1.9% |
| Broadband Home | 199 | 54.4% |
| Cellular Data Only | 85 | 23.2% |
| Satellite Internet | 11 | 3.0% |
| No Internet | 69 | 18.9% |
| Total | 366 | 100.0% |
Colfax Summary
Colfax, Illinois is a small village located in McLean County, Illinois. It is situated in the heart of the Midwest, approximately 25 miles north of Bloomington and 30 miles south of Normal. The village has a population of 1,845 people, according to the 2010 census.
History
Colfax was founded in 1854 by a group of settlers from Ohio. The village was named after Schuyler Colfax, the Vice President of the United States at the time. The village was incorporated in 1858 and has remained a small, rural community ever since.
Geography
Colfax is located in the heart of the Midwest, approximately 25 miles north of Bloomington and 30 miles south of Normal. The village is situated in McLean County, Illinois, and is surrounded by the towns of Arrowsmith, Carlock, and Saybrook. The village is located on the banks of the Mackinaw River, which flows through the village and provides a scenic backdrop.
The village is located in a flat, open area of the Midwest, with rolling hills and farmland in the surrounding area. The village is located in the Central Time Zone and has a humid continental climate, with hot summers and cold winters.
Economy
Colfax is a small, rural community with a limited economy. The village is home to several small businesses, including a grocery store, a hardware store, and a few restaurants. The village also has a few small manufacturing companies, including a plastics manufacturer and a metal fabrication company.
The village is also home to a few farms, which produce corn, soybeans, and other crops. The village is also home to a few small wineries, which produce a variety of wines.
Demographics
According to the 2010 census, the population of Colfax is 1,845 people. The village is predominantly white, with a small Hispanic population. The median household income is $45,000, and the median age is 40 years old.
The village is home to a few churches, including the Colfax United Methodist Church, the Colfax Presbyterian Church, and the Colfax Baptist Church. The village also has a public library, a post office, and a few parks.
Conclusion
Colfax, Illinois is a small village located in McLean County, Illinois. It is situated in the heart of the Midwest, approximately 25 miles north of Bloomington and 30 miles south of Normal. The village has a population of 1,845 people, according to the 2010 census. The village is predominantly white, with a small Hispanic population. The village is home to a few small businesses, farms, and wineries, and is home to a few churches, a public library, a post office, and a few parks.
Common Questions
What is Per Capita Income in Colfax?
Per Capita income in Colfax is $39,797.
What is the Median Family Income in Colfax?
Median Family Income in Colfax is $59,706.
What is the Median Household income in Colfax?
Median Household Income in Colfax is $63,750.
What is Income or Wage Gap in Colfax?
Income or Wage Gap in Colfax is 38.9%.
Women in Colfax earn 61.1 cents for every dollar earned by a man.
What is Inequality or Gini Index in Colfax?
Inequality or Gini Index in Colfax is 0.53.
What is the Total Population of Colfax?
Total Population of Colfax is 1,017.
What is the Total Male Population of Colfax?
Total Male Population of Colfax is 454.
What is the Total Female Population of Colfax?
Total Female Population of Colfax is 563.
What is the Ratio of Males per 100 Females in Colfax?
There are 80.64 Males per 100 Females in Colfax.
What is the Ratio of Females per 100 Males in Colfax?
There are 124.01 Females per 100 Males in Colfax.
What is the Median Population Age in Colfax?
Median Population Age in Colfax is 34.4 Years.
What is the Average Family Size in Colfax
Average Family Size in Colfax is 3.1 People.
What is the Average Household Size in Colfax
Average Household Size in Colfax is 2.7 People.
How Large is the Labor Force in Colfax?
There are 527 People in the Labor Forcein in Colfax.
What is the Percentage of People in the Labor Force in Colfax?
66.8% of People are in the Labor Force in Colfax.
What is the Unemployment Rate in Colfax?
Unemployment Rate in Colfax is 6.6%.