Calhoun, IL Map & Demographics
Calhoun Map
Calhoun Overview
$34,699
PER CAPITA INCOME
$56,875
AVG FAMILY INCOME
$67,083
AVG HOUSEHOLD INCOME
40.9%
WAGE / INCOME GAP [ % ]
59.1¢/ $1
WAGE / INCOME GAP [ $ ]
0.36
INEQUALITY / GINI INDEX
170
TOTAL POPULATION
90
MALE POPULATION
80
FEMALE POPULATION
112.50
MALES / 100 FEMALES
88.89
FEMALES / 100 MALES
40.0
MEDIAN AGE
2.7
AVG FAMILY SIZE
2.5
AVG HOUSEHOLD SIZE
111
LABOR FORCE [ PEOPLE ]
75.0%
PERCENT IN LABOR FORCE
12.6%
UNEMPLOYMENT RATE
Calhoun Zip Codes
Calhoun Area Codes
Income in Calhoun
Income Overview in Calhoun
Per Capita Income in Calhoun is $34,699, while median incomes of families and households are $56,875 and $67,083 respectively.
| Characteristic | Number | Measure |
| Per Capita Income | 170 | $34,699 |
| Median Family Income | 48 | $56,875 |
| Mean Family Income | 48 | $81,525 |
| Median Household Income | 67 | $67,083 |
| Mean Household Income | 67 | $79,831 |
| Income Deficit | 48 | $0 |
| Wage / Income Gap (%) | 170 | 40.92% |
| Wage / Income Gap ($) | 170 | 59.08¢ per $1 |
| Gini / Inequality Index | 170 | 0.36 |
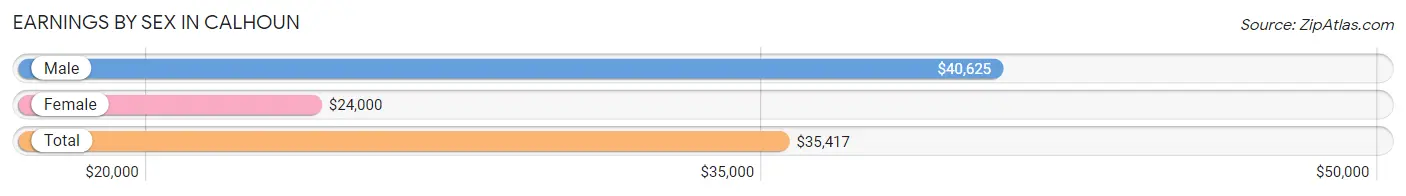
Earnings by Sex in Calhoun
Average Earnings in Calhoun are $35,417, $40,625 for men and $24,000 for women, a difference of 40.9%.
| Sex | Number | Average Earnings |
| Male | 67 (58.3%) | $40,625 |
| Female | 48 (41.7%) | $24,000 |
| Total | 115 (100.0%) | $35,417 |
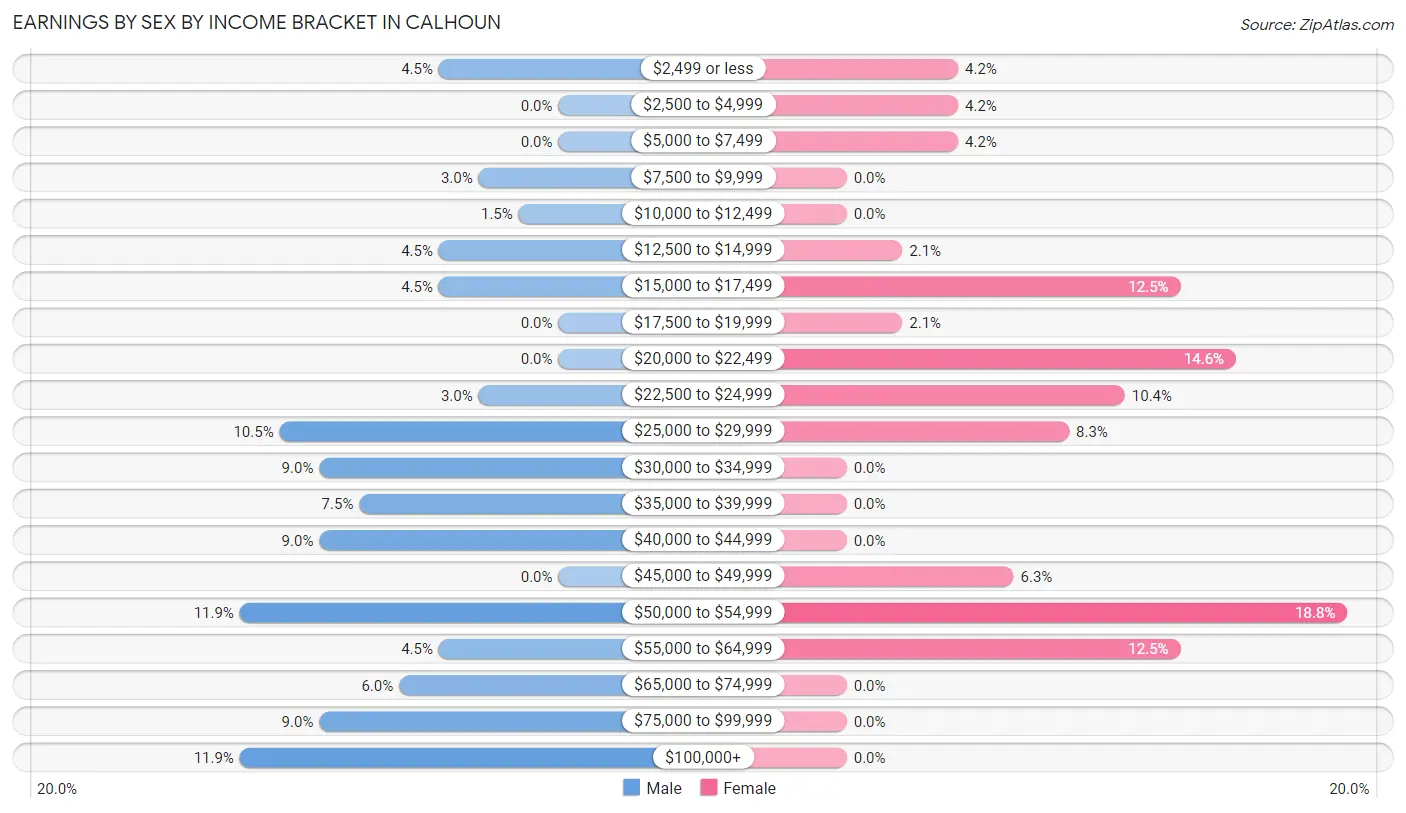
Earnings by Sex by Income Bracket in Calhoun
The most common earnings brackets in Calhoun are $50,000 to $54,999 for men (8 | 11.9%) and $50,000 to $54,999 for women (9 | 18.8%).
| Income | Male | Female |
| $2,499 or less | 3 (4.5%) | 2 (4.2%) |
| $2,500 to $4,999 | 0 (0.0%) | 2 (4.2%) |
| $5,000 to $7,499 | 0 (0.0%) | 2 (4.2%) |
| $7,500 to $9,999 | 2 (3.0%) | 0 (0.0%) |
| $10,000 to $12,499 | 1 (1.5%) | 0 (0.0%) |
| $12,500 to $14,999 | 3 (4.5%) | 1 (2.1%) |
| $15,000 to $17,499 | 3 (4.5%) | 6 (12.5%) |
| $17,500 to $19,999 | 0 (0.0%) | 1 (2.1%) |
| $20,000 to $22,499 | 0 (0.0%) | 7 (14.6%) |
| $22,500 to $24,999 | 2 (3.0%) | 5 (10.4%) |
| $25,000 to $29,999 | 7 (10.4%) | 4 (8.3%) |
| $30,000 to $34,999 | 6 (9.0%) | 0 (0.0%) |
| $35,000 to $39,999 | 5 (7.5%) | 0 (0.0%) |
| $40,000 to $44,999 | 6 (9.0%) | 0 (0.0%) |
| $45,000 to $49,999 | 0 (0.0%) | 3 (6.2%) |
| $50,000 to $54,999 | 8 (11.9%) | 9 (18.8%) |
| $55,000 to $64,999 | 3 (4.5%) | 6 (12.5%) |
| $65,000 to $74,999 | 4 (6.0%) | 0 (0.0%) |
| $75,000 to $99,999 | 6 (9.0%) | 0 (0.0%) |
| $100,000+ | 8 (11.9%) | 0 (0.0%) |
| Total | 67 (100.0%) | 48 (100.0%) |
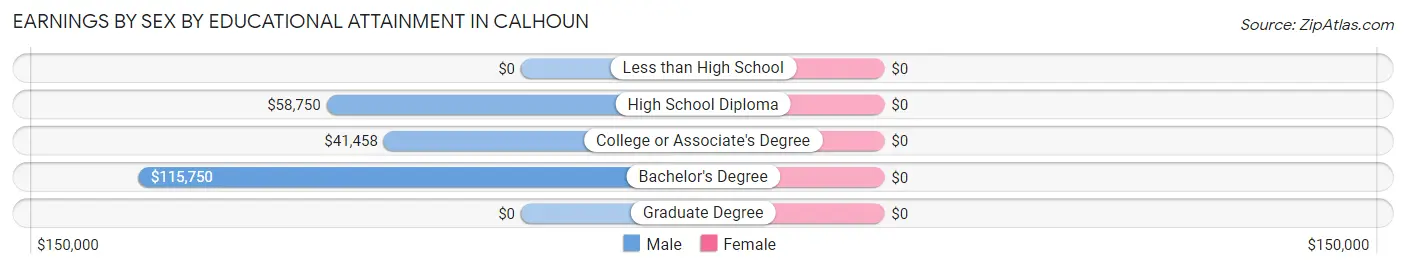
Earnings by Sex by Educational Attainment in Calhoun
| Educational Attainment | Male Income | Female Income |
| Less than High School | - | - |
| High School Diploma | $58,750 | $0 |
| College or Associate's Degree | $41,458 | $0 |
| Bachelor's Degree | $115,750 | $0 |
| Graduate Degree | - | - |
| Total | $50,625 | $24,500 |
Family Income in Calhoun
Family Income Brackets in Calhoun
According to the Calhoun family income data, there are 13 families falling into the $35,000 to $49,999 income range, which is the most common income bracket and makes up 27.1% of all families.
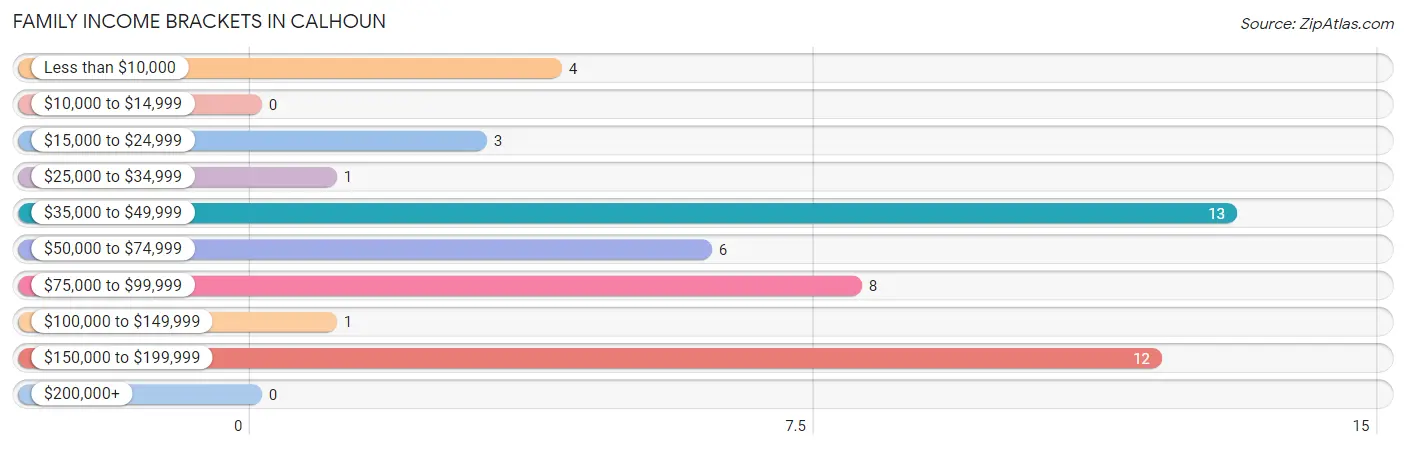
| Income Bracket | # Families | % Families |
| Less than $10,000 | 4 | 8.3% |
| $10,000 to $14,999 | 0 | 0.0% |
| $15,000 to $24,999 | 3 | 6.3% |
| $25,000 to $34,999 | 1 | 2.1% |
| $35,000 to $49,999 | 13 | 27.1% |
| $50,000 to $74,999 | 6 | 12.5% |
| $75,000 to $99,999 | 8 | 16.7% |
| $100,000 to $149,999 | 1 | 2.1% |
| $150,000 to $199,999 | 12 | 25.0% |
| $200,000+ | 0 | 0.0% |
Family Income by Famaliy Size in Calhoun
2-person families (31 | 64.6%) account for the highest median family income in Calhoun with $49,688 per family, while 2-person families (31 | 64.6%) have the highest median income of $24,844 per family member.
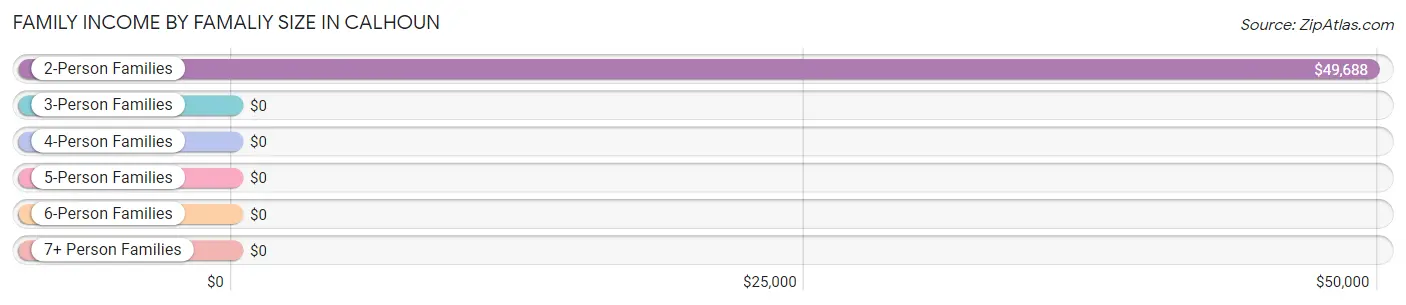
| Income Bracket | # Families | Median Income |
| 2-Person Families | 31 (64.6%) | $49,688 |
| 3-Person Families | 14 (29.2%) | $0 |
| 4-Person Families | 1 (2.1%) | $0 |
| 5-Person Families | 2 (4.2%) | $0 |
| 6-Person Families | 0 (0.0%) | $0 |
| 7+ Person Families | 0 (0.0%) | $0 |
| Total | 48 (100.0%) | $56,875 |
Family Income by Number of Earners in Calhoun
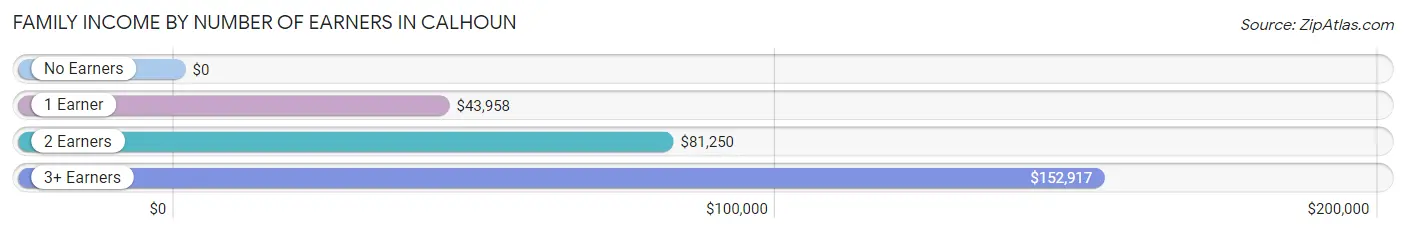
| Number of Earners | # Families | Median Income |
| No Earners | 6 (12.5%) | $0 |
| 1 Earner | 13 (27.1%) | $43,958 |
| 2 Earners | 24 (50.0%) | $81,250 |
| 3+ Earners | 5 (10.4%) | $152,917 |
| Total | 48 (100.0%) | $56,875 |
Household Income in Calhoun
Household Income Brackets in Calhoun
With 15 households falling in the category, the $75,000 to $99,999 income range is the most frequent in Calhoun, accounting for 22.4% of all households.
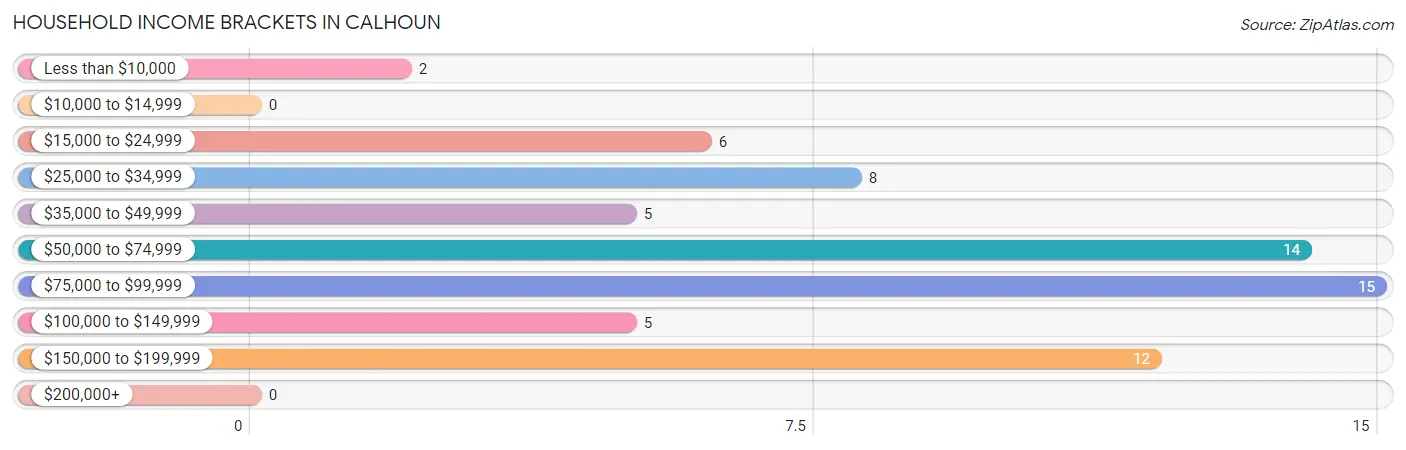
| Income Bracket | # Households | % Households |
| Less than $10,000 | 2 | 3.0% |
| $10,000 to $14,999 | 0 | 0.0% |
| $15,000 to $24,999 | 6 | 9.0% |
| $25,000 to $34,999 | 8 | 11.9% |
| $35,000 to $49,999 | 5 | 7.5% |
| $50,000 to $74,999 | 14 | 20.9% |
| $75,000 to $99,999 | 15 | 22.4% |
| $100,000 to $149,999 | 5 | 7.5% |
| $150,000 to $199,999 | 12 | 17.9% |
| $200,000+ | 0 | 0.0% |
Household Income by Householder Age in Calhoun
The median household income in Calhoun is $67,083, with the highest median household income of $88,250 found in the 45 to 64 years age bracket for the primary householder. A total of 35 households (52.2%) fall into this category. Meanwhile, the 15 to 24 years age bracket for the primary householder has the lowest median household income of $0, with 2 households (3.0%) in this group.
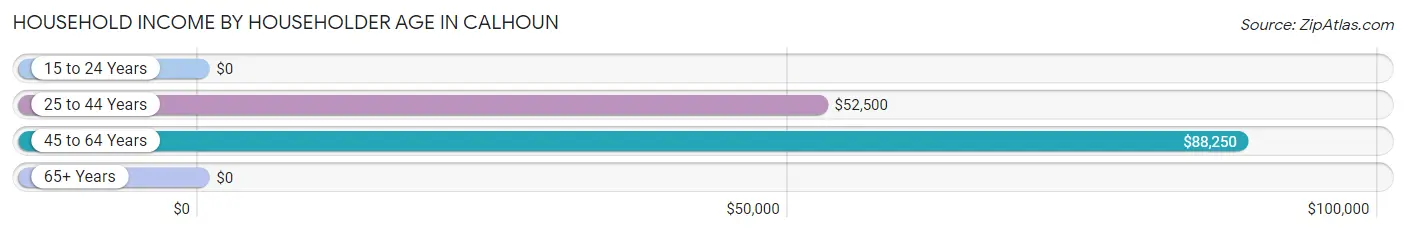
| Income Bracket | # Households | Median Income |
| 15 to 24 Years | 2 (3.0%) | $0 |
| 25 to 44 Years | 18 (26.9%) | $52,500 |
| 45 to 64 Years | 35 (52.2%) | $88,250 |
| 65+ Years | 12 (17.9%) | $0 |
| Total | 67 (100.0%) | $67,083 |
Poverty in Calhoun
Income Below Poverty by Sex and Age in Calhoun
With 12.4% poverty level for males and 18.8% for females among the residents of Calhoun, under 5 year old males and 6 to 11 year old females are the most vulnerable to poverty, with 4 males (80.0%) and 2 females (40.0%) in their respective age groups living below the poverty level.
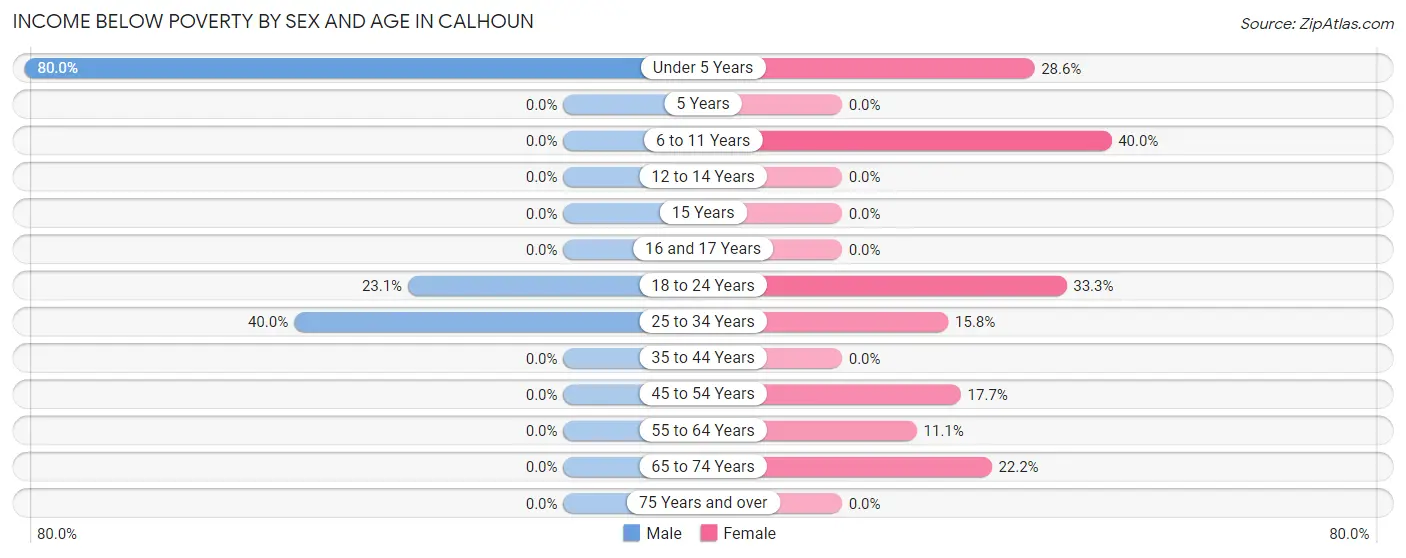
| Age Bracket | Male | Female |
| Under 5 Years | 4 (80.0%) | 2 (28.6%) |
| 5 Years | 0 (0.0%) | 0 (0.0%) |
| 6 to 11 Years | 0 (0.0%) | 2 (40.0%) |
| 12 to 14 Years | 0 (0.0%) | 0 (0.0%) |
| 15 Years | 0 (0.0%) | 0 (0.0%) |
| 16 and 17 Years | 0 (0.0%) | 0 (0.0%) |
| 18 to 24 Years | 3 (23.1%) | 2 (33.3%) |
| 25 to 34 Years | 4 (40.0%) | 3 (15.8%) |
| 35 to 44 Years | 0 (0.0%) | 0 (0.0%) |
| 45 to 54 Years | 0 (0.0%) | 3 (17.6%) |
| 55 to 64 Years | 0 (0.0%) | 1 (11.1%) |
| 65 to 74 Years | 0 (0.0%) | 2 (22.2%) |
| 75 Years and over | 0 (0.0%) | 0 (0.0%) |
| Total | 11 (12.4%) | 15 (18.8%) |
Income Above Poverty by Sex and Age in Calhoun
According to the poverty statistics in Calhoun, males aged 5 years and females aged 16 and 17 years are the age groups that are most secure financially, with 100.0% of males and 100.0% of females in these age groups living above the poverty line.
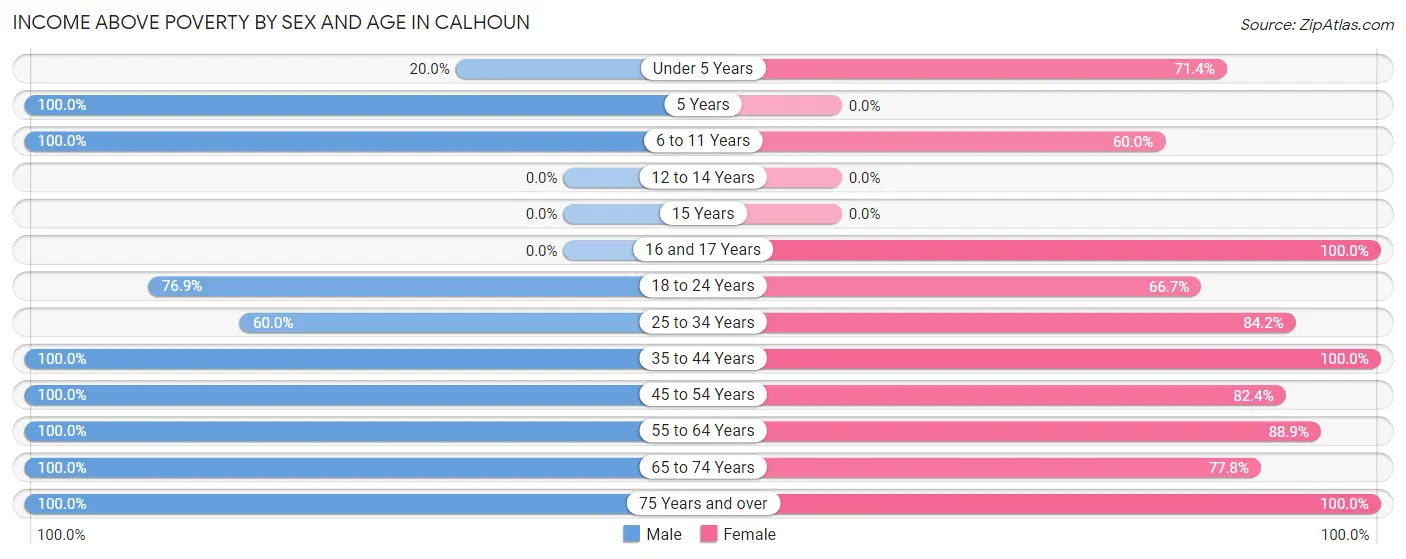
| Age Bracket | Male | Female |
| Under 5 Years | 1 (20.0%) | 5 (71.4%) |
| 5 Years | 2 (100.0%) | 0 (0.0%) |
| 6 to 11 Years | 2 (100.0%) | 3 (60.0%) |
| 12 to 14 Years | 0 (0.0%) | 0 (0.0%) |
| 15 Years | 0 (0.0%) | 0 (0.0%) |
| 16 and 17 Years | 0 (0.0%) | 1 (100.0%) |
| 18 to 24 Years | 10 (76.9%) | 4 (66.7%) |
| 25 to 34 Years | 6 (60.0%) | 16 (84.2%) |
| 35 to 44 Years | 20 (100.0%) | 2 (100.0%) |
| 45 to 54 Years | 16 (100.0%) | 14 (82.4%) |
| 55 to 64 Years | 15 (100.0%) | 8 (88.9%) |
| 65 to 74 Years | 4 (100.0%) | 7 (77.8%) |
| 75 Years and over | 2 (100.0%) | 5 (100.0%) |
| Total | 78 (87.6%) | 65 (81.2%) |
Income Below Poverty Among Married-Couple Families in Calhoun
The poverty statistics for married-couple families in Calhoun show that 6.9% or 2 of the total 29 families live below the poverty line. Families with 1 or 2 children have the highest poverty rate of 33.3%, comprising of 2 families. On the other hand, families with no children have the lowest poverty rate of 0.0%, which includes 0 families.
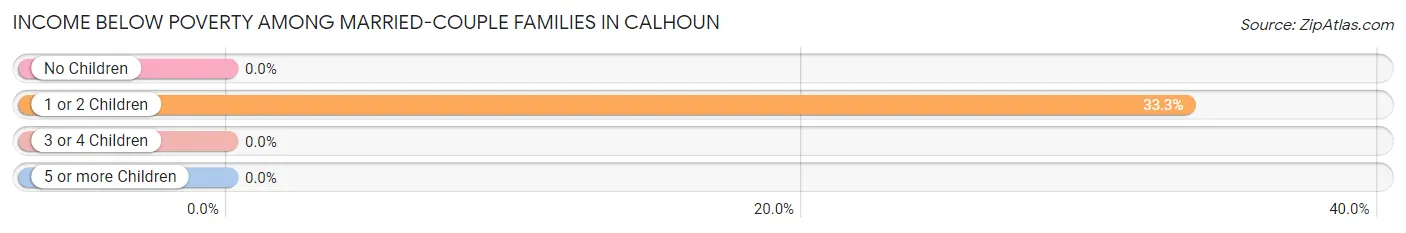
| Children | Above Poverty | Below Poverty |
| No Children | 21 (100.0%) | 0 (0.0%) |
| 1 or 2 Children | 4 (66.7%) | 2 (33.3%) |
| 3 or 4 Children | 2 (100.0%) | 0 (0.0%) |
| 5 or more Children | 0 (0.0%) | 0 (0.0%) |
| Total | 27 (93.1%) | 2 (6.9%) |
Income Below Poverty Among Single-Parent Households in Calhoun
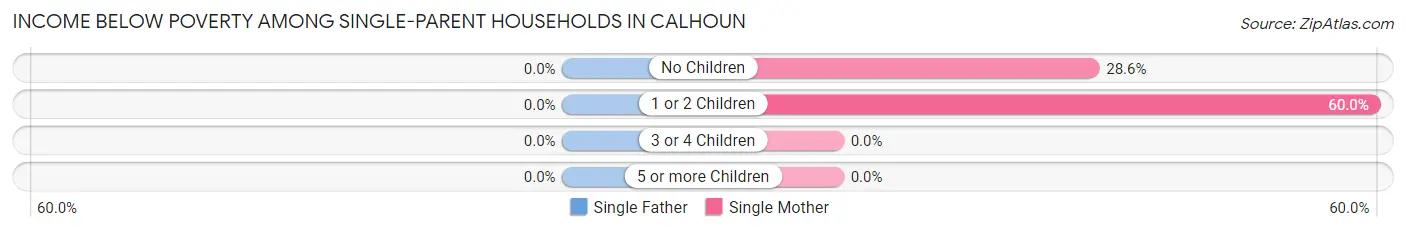
| Children | Single Father | Single Mother |
| No Children | 0 (0.0%) | 2 (28.6%) |
| 1 or 2 Children | 0 (0.0%) | 3 (60.0%) |
| 3 or 4 Children | 0 (0.0%) | 0 (0.0%) |
| 5 or more Children | 0 (0.0%) | 0 (0.0%) |
| Total | 0 (0.0%) | 5 (41.7%) |
Income Below Poverty Among Married-Couple vs Single-Parent Households in Calhoun
The poverty data for Calhoun shows that 2 of the married-couple family households (6.9%) and 5 of the single-parent households (26.3%) are living below the poverty level. Within the married-couple family households, those with 1 or 2 children have the highest poverty rate, with 2 households (33.3%) falling below the poverty line. Among the single-parent households, those with 1 or 2 children have the highest poverty rate, with 3 household (50.0%) living below poverty.
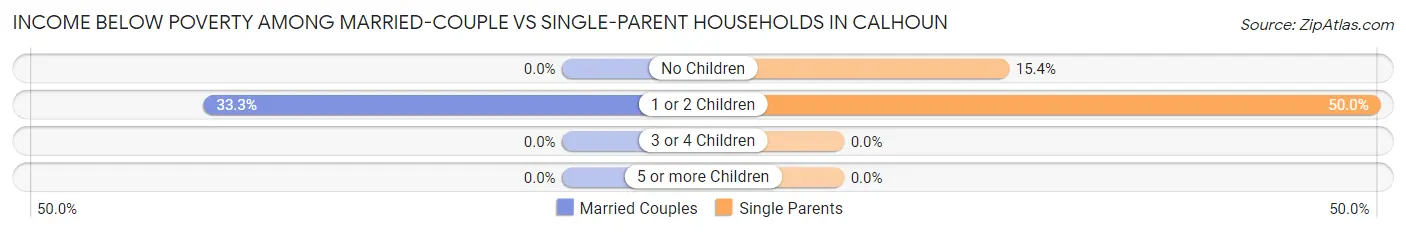
| Children | Married-Couple Families | Single-Parent Households |
| No Children | 0 (0.0%) | 2 (15.4%) |
| 1 or 2 Children | 2 (33.3%) | 3 (50.0%) |
| 3 or 4 Children | 0 (0.0%) | 0 (0.0%) |
| 5 or more Children | 0 (0.0%) | 0 (0.0%) |
| Total | 2 (6.9%) | 5 (26.3%) |
Race in Calhoun
The most populous races in Calhoun are White / Caucasian (161 | 94.7%), and Two or more Races (9 | 5.3%).
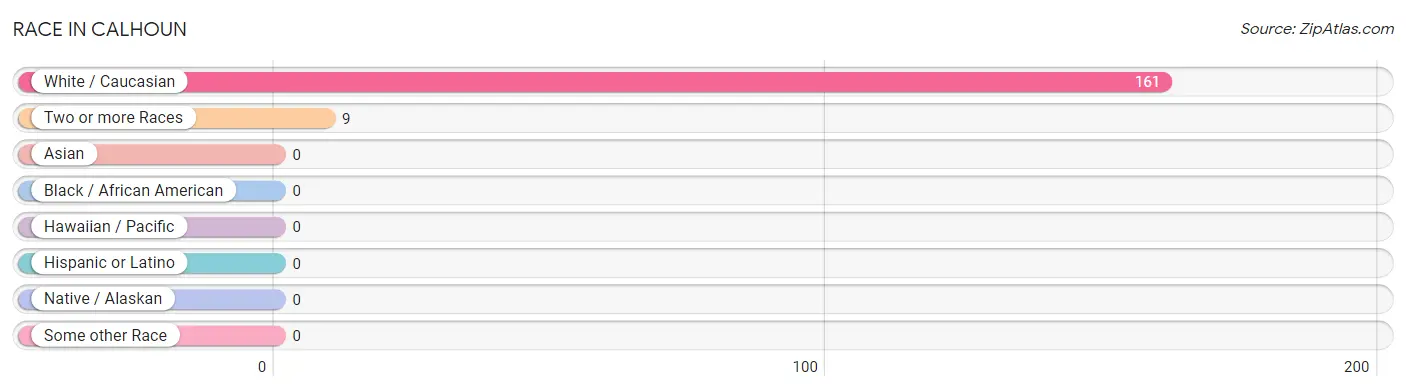
| Race | # Population | % Population |
| Asian | 0 | 0.0% |
| Black / African American | 0 | 0.0% |
| Hawaiian / Pacific | 0 | 0.0% |
| Hispanic or Latino | 0 | 0.0% |
| Native / Alaskan | 0 | 0.0% |
| White / Caucasian | 161 | 94.7% |
| Two or more Races | 9 | 5.3% |
| Some other Race | 0 | 0.0% |
| Total | 170 | 100.0% |
Ancestry in Calhoun
The most populous ancestries reported in Calhoun are English (41 | 24.1%), German (28 | 16.5%), Irish (25 | 14.7%), American (7 | 4.1%), and Scottish (7 | 4.1%), together accounting for 63.5% of all Calhoun residents.
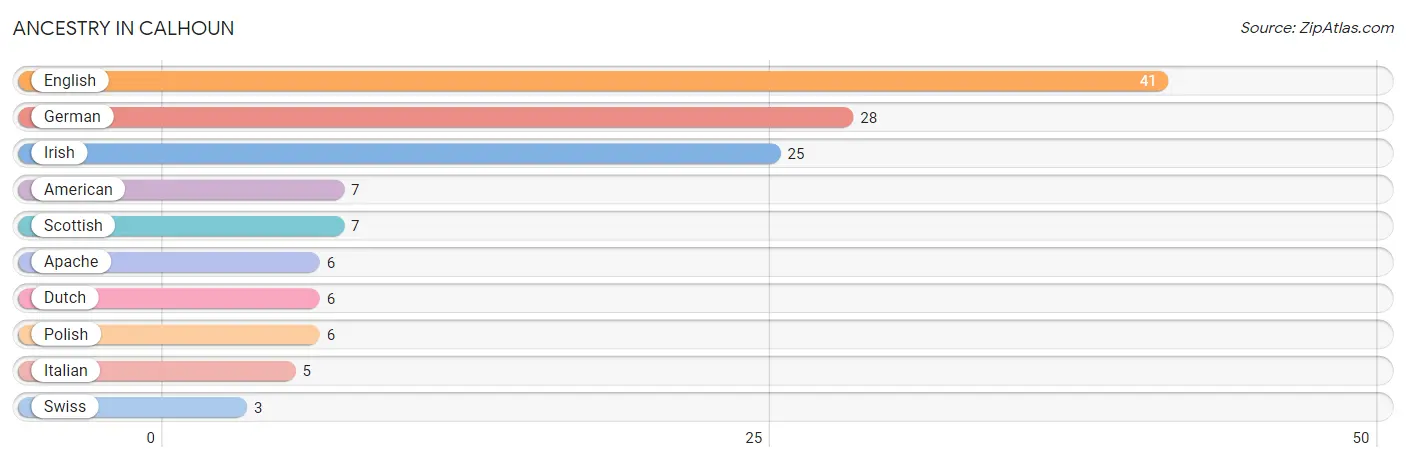
| Ancestry | # Population | % Population |
| American | 7 | 4.1% |
| Apache | 6 | 3.5% |
| Dutch | 6 | 3.5% |
| English | 41 | 24.1% |
| German | 28 | 16.5% |
| Irish | 25 | 14.7% |
| Italian | 5 | 2.9% |
| Polish | 6 | 3.5% |
| Scottish | 7 | 4.1% |
| Swiss | 3 | 1.8% | View All 10 Rows |
Immigrants in Calhoun

| Immigration Origin | # Population | % Population | View All 0 Rows |
Sex and Age in Calhoun
Sex and Age in Calhoun
The most populous age groups in Calhoun are 45 to 49 Years (14 | 15.6%) for men and 30 to 34 Years (12 | 15.0%) for women.
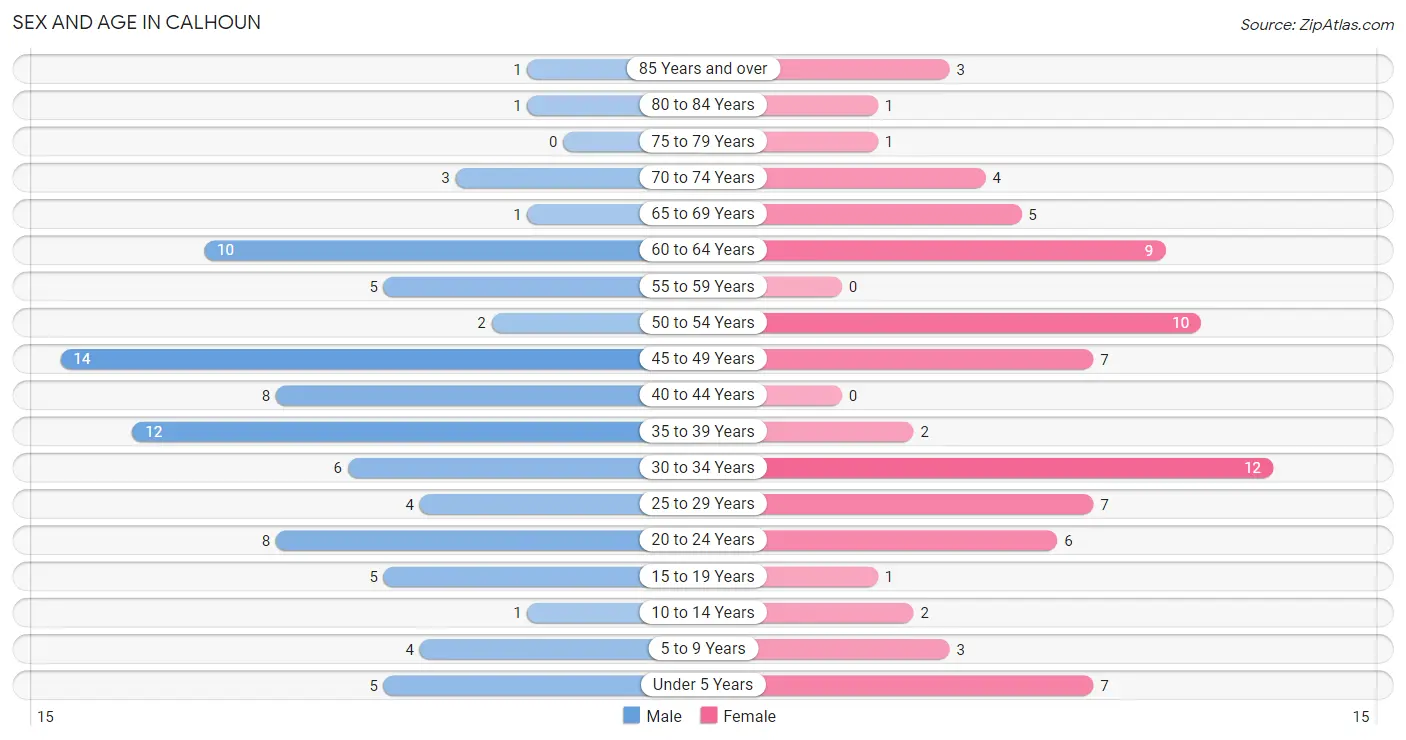
| Age Bracket | Male | Female |
| Under 5 Years | 5 (5.6%) | 7 (8.7%) |
| 5 to 9 Years | 4 (4.4%) | 3 (3.7%) |
| 10 to 14 Years | 1 (1.1%) | 2 (2.5%) |
| 15 to 19 Years | 5 (5.6%) | 1 (1.3%) |
| 20 to 24 Years | 8 (8.9%) | 6 (7.5%) |
| 25 to 29 Years | 4 (4.4%) | 7 (8.7%) |
| 30 to 34 Years | 6 (6.7%) | 12 (15.0%) |
| 35 to 39 Years | 12 (13.3%) | 2 (2.5%) |
| 40 to 44 Years | 8 (8.9%) | 0 (0.0%) |
| 45 to 49 Years | 14 (15.6%) | 7 (8.7%) |
| 50 to 54 Years | 2 (2.2%) | 10 (12.5%) |
| 55 to 59 Years | 5 (5.6%) | 0 (0.0%) |
| 60 to 64 Years | 10 (11.1%) | 9 (11.3%) |
| 65 to 69 Years | 1 (1.1%) | 5 (6.2%) |
| 70 to 74 Years | 3 (3.3%) | 4 (5.0%) |
| 75 to 79 Years | 0 (0.0%) | 1 (1.3%) |
| 80 to 84 Years | 1 (1.1%) | 1 (1.3%) |
| 85 Years and over | 1 (1.1%) | 3 (3.7%) |
| Total | 90 (100.0%) | 80 (100.0%) |
Families and Households in Calhoun
Median Family Size in Calhoun
The median family size in Calhoun is 2.73 persons per family, with married-couple families (29 | 60.4%) accounting for the largest median family size of 2.86 persons per family. On the other hand, single male/father families (7 | 14.6%) represent the smallest median family size with 2.29 persons per family.
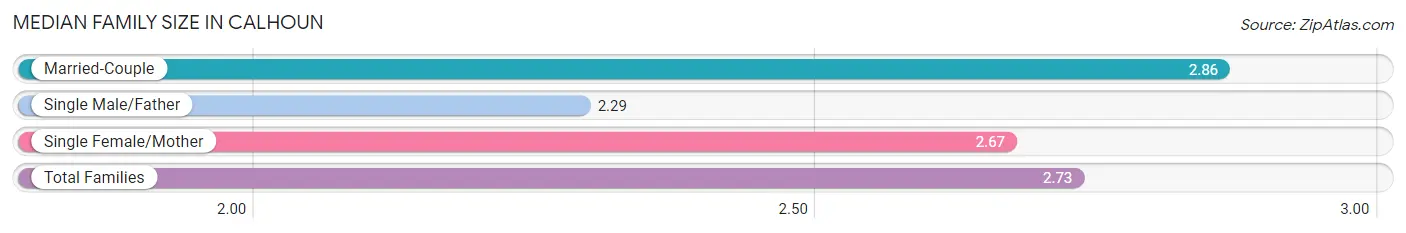
| Family Type | # Families | Family Size |
| Married-Couple | 29 (60.4%) | 2.86 |
| Single Male/Father | 7 (14.6%) | 2.29 |
| Single Female/Mother | 12 (25.0%) | 2.67 |
| Total Families | 48 (100.0%) | 2.73 |
Median Household Size in Calhoun
The median household size in Calhoun is 2.54 persons per household, with single female/mother households (12 | 17.9%) accounting for the largest median household size of 3.58 persons per household. non-family households (19 | 28.4%) represent the smallest median household size with 1.21 persons per household.
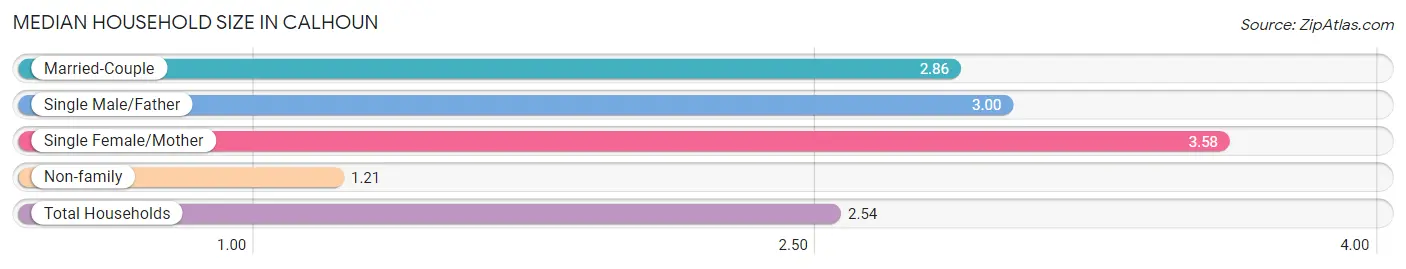
| Household Type | # Households | Household Size |
| Married-Couple | 29 (43.3%) | 2.86 |
| Single Male/Father | 7 (10.4%) | 3.00 |
| Single Female/Mother | 12 (17.9%) | 3.58 |
| Non-family | 19 (28.4%) | 1.21 |
| Total Households | 67 (100.0%) | 2.54 |
Household Size by Marriage Status in Calhoun
Out of a total of 67 households in Calhoun, 48 (71.6%) are family households, while 19 (28.4%) are nonfamily households. The most numerous type of family households are 2-person households, comprising 23, and the most common type of nonfamily households are 1-person households, comprising 14.
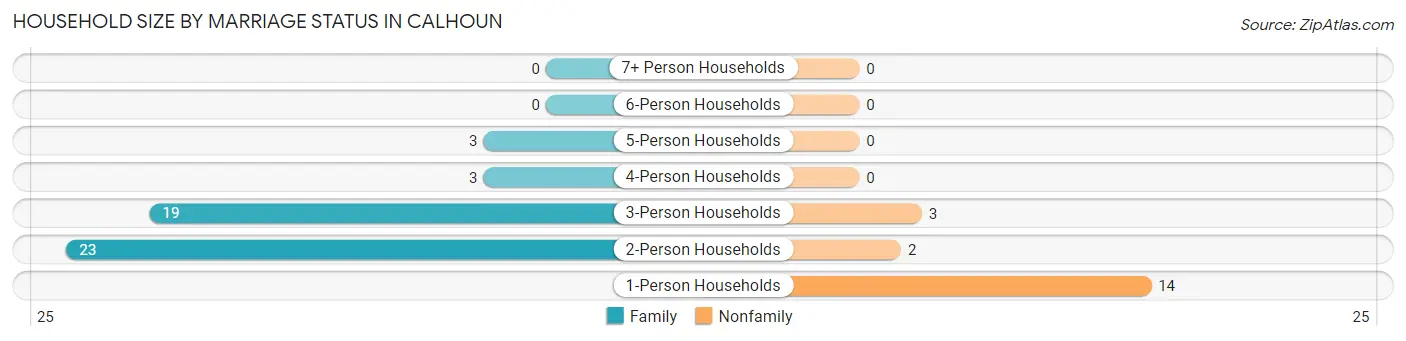
| Household Size | Family Households | Nonfamily Households |
| 1-Person Households | - | 14 (20.9%) |
| 2-Person Households | 23 (34.3%) | 2 (3.0%) |
| 3-Person Households | 19 (28.4%) | 3 (4.5%) |
| 4-Person Households | 3 (4.5%) | 0 (0.0%) |
| 5-Person Households | 3 (4.5%) | 0 (0.0%) |
| 6-Person Households | 0 (0.0%) | 0 (0.0%) |
| 7+ Person Households | 0 (0.0%) | 0 (0.0%) |
| Total | 48 (71.6%) | 19 (28.4%) |
Female Fertility in Calhoun
Fertility by Age in Calhoun
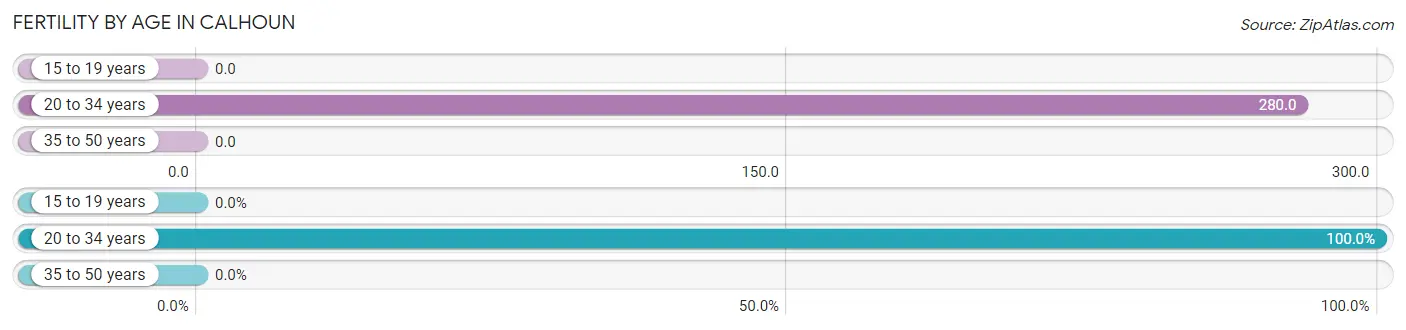
Average fertility rate in Calhoun is 200.0 births per 1,000 women. Women in the age bracket of 20 to 34 years have the highest fertility rate with 280.0 births per 1,000 women. Women in the age bracket of 20 to 34 years acount for 100.0% of all women with births.
| Age Bracket | Women with Births | Births / 1,000 Women |
| 15 to 19 years | 0 (0.0%) | 0.0 |
| 20 to 34 years | 7 (100.0%) | 280.0 |
| 35 to 50 years | 0 (0.0%) | 0.0 |
| Total | 7 (100.0%) | 200.0 |
Fertility by Age by Marriage Status in Calhoun
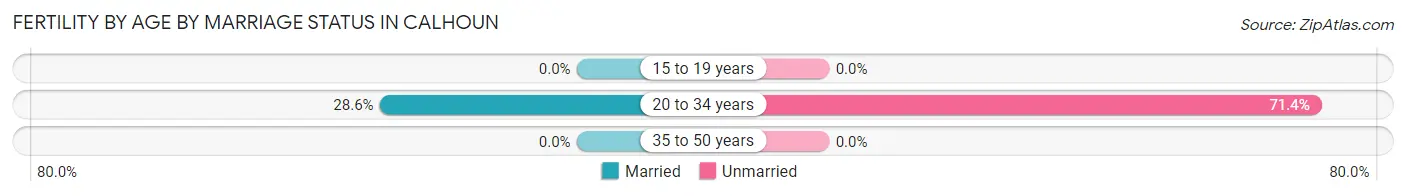
28.6% of women with births (7) in Calhoun are married. The highest percentage of unmarried women with births falls into 20 to 34 years age bracket with 71.4% of them unmarried at the time of birth, while the lowest percentage of unmarried women with births belong to 20 to 34 years age bracket with 71.4% of them unmarried.
| Age Bracket | Married | Unmarried |
| 15 to 19 years | 0 (0.0%) | 0 (0.0%) |
| 20 to 34 years | 2 (28.6%) | 5 (71.4%) |
| 35 to 50 years | 0 (0.0%) | 0 (0.0%) |
| Total | 2 (28.6%) | 5 (71.4%) |
Fertility by Education in Calhoun
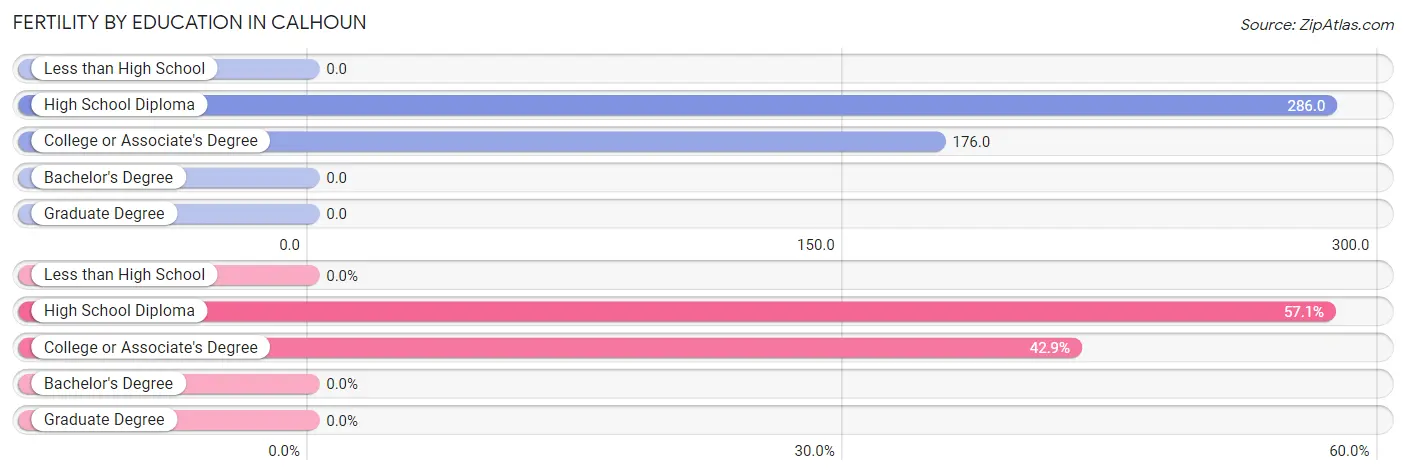
| Educational Attainment | Women with Births | Births / 1,000 Women |
| Less than High School | 0 (0.0%) | 0.0 |
| High School Diploma | 4 (57.1%) | 286.0 |
| College or Associate's Degree | 3 (42.9%) | 176.0 |
| Bachelor's Degree | 0 (0.0%) | 0.0 |
| Graduate Degree | 0 (0.0%) | 0.0 |
| Total | 7 (100.0%) | 200.0 |
Fertility by Education by Marriage Status in Calhoun
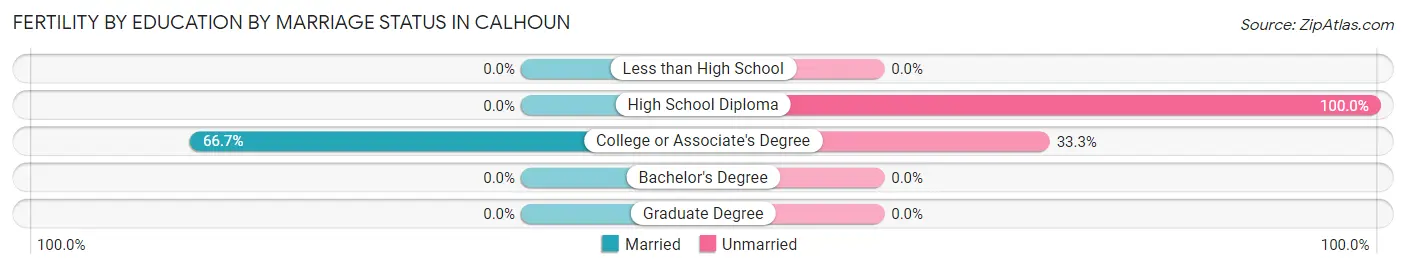
71.4% of women with births in Calhoun are unmarried. Women with the educational attainment of college or associate's degree are most likely to be married with 66.7% of them married at childbirth, while women with the educational attainment of high school diploma are least likely to be married with 100.0% of them unmarried at childbirth.
| Educational Attainment | Married | Unmarried |
| Less than High School | 0 (0.0%) | 0 (0.0%) |
| High School Diploma | 0 (0.0%) | 4 (100.0%) |
| College or Associate's Degree | 2 (66.7%) | 1 (33.3%) |
| Bachelor's Degree | 0 (0.0%) | 0 (0.0%) |
| Graduate Degree | 0 (0.0%) | 0 (0.0%) |
| Total | 2 (28.6%) | 5 (71.4%) |
Employment Characteristics in Calhoun
Employment by Class of Employer in Calhoun
Among the 93 employed individuals in Calhoun, private company employees (79 | 85.0%), self-employed (not incorporated) (5 | 5.4%), and not-for-profit organizations (3 | 3.2%) make up the most common classes of employment.
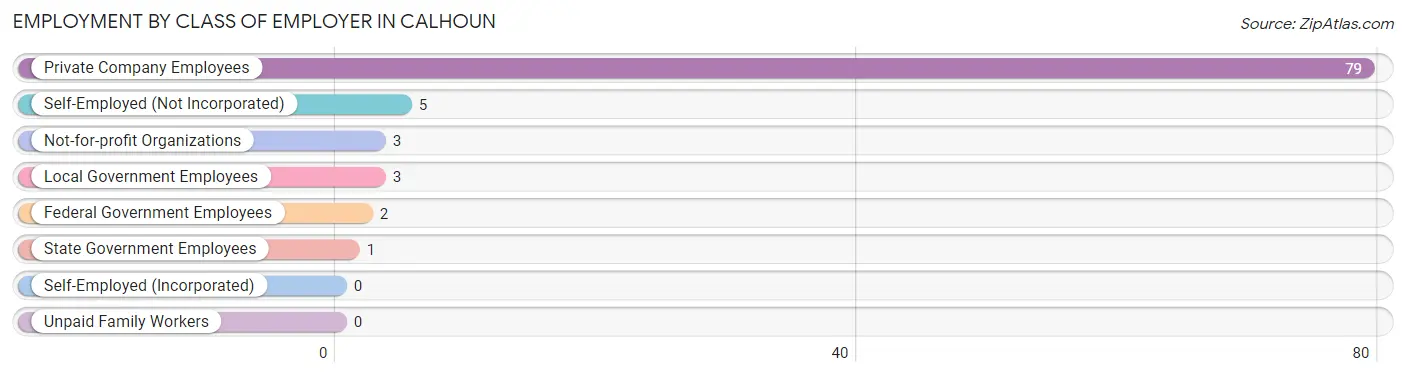
| Employer Class | # Employees | % Employees |
| Private Company Employees | 79 | 85.0% |
| Self-Employed (Incorporated) | 0 | 0.0% |
| Self-Employed (Not Incorporated) | 5 | 5.4% |
| Not-for-profit Organizations | 3 | 3.2% |
| Local Government Employees | 3 | 3.2% |
| State Government Employees | 1 | 1.1% |
| Federal Government Employees | 2 | 2.1% |
| Unpaid Family Workers | 0 | 0.0% |
| Total | 93 | 100.0% |
Employment Status by Age in Calhoun
According to the labor force statistics for Calhoun, out of the total population over 16 years of age (148), 75.0% or 111 individuals are in the labor force, with 12.6% or 14 of them unemployed. The age group with the highest labor force participation rate is 55 to 59 years, with 100.0% or 5 individuals in the labor force. Within the labor force, the 30 to 34 years age range has the highest percentage of unemployed individuals, with 42.9% or 6 of them being unemployed.
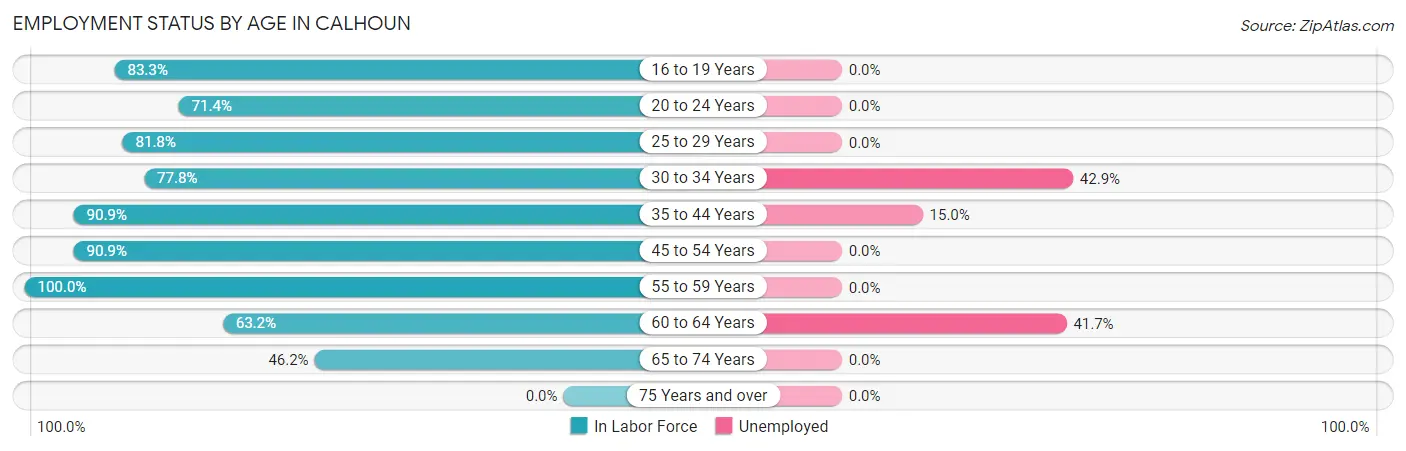
| Age Bracket | In Labor Force | Unemployed |
| 16 to 19 Years | 5 (83.3%) | 0 (0.0%) |
| 20 to 24 Years | 10 (71.4%) | 0 (0.0%) |
| 25 to 29 Years | 9 (81.8%) | 0 (0.0%) |
| 30 to 34 Years | 14 (77.8%) | 6 (42.9%) |
| 35 to 44 Years | 20 (90.9%) | 3 (15.0%) |
| 45 to 54 Years | 30 (90.9%) | 0 (0.0%) |
| 55 to 59 Years | 5 (100.0%) | 0 (0.0%) |
| 60 to 64 Years | 12 (63.2%) | 5 (41.7%) |
| 65 to 74 Years | 6 (46.2%) | 0 (0.0%) |
| 75 Years and over | 0 (0.0%) | 0 (0.0%) |
| Total | 111 (75.0%) | 14 (12.6%) |
Employment Status by Educational Attainment in Calhoun
According to labor force statistics for Calhoun, 83.3% of individuals (90) out of the total population between 25 and 64 years of age (108) are in the labor force, with 15.6% or 14 of them being unemployed. The group with the highest labor force participation rate are those with the educational attainment of bachelor's degree or higher, with 87.5% or 7 individuals in the labor force. Within the labor force, individuals with bachelor's degree or higher education have the highest percentage of unemployment, with 71.4% or 5 of them being unemployed.
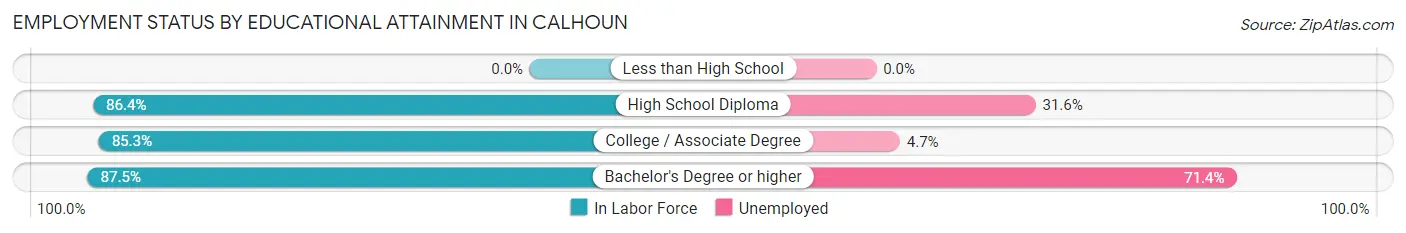
| Educational Attainment | In Labor Force | Unemployed |
| Less than High School | 0 (0.0%) | 0 (0.0%) |
| High School Diploma | 19 (86.4%) | 7 (31.6%) |
| College / Associate Degree | 64 (85.3%) | 4 (4.7%) |
| Bachelor's Degree or higher | 7 (87.5%) | 6 (71.4%) |
| Total | 90 (83.3%) | 17 (15.6%) |
Employment Occupations by Sex in Calhoun
Management, Business, Science and Arts Occupations
The most common Management, Business, Science and Arts occupations in Calhoun are Health Diagnosing & Treating (7 | 7.2%), Health Technologists (7 | 7.2%), Management (5 | 5.1%), Community & Social Service (4 | 4.1%), and Education Instruction & Library (4 | 4.1%).
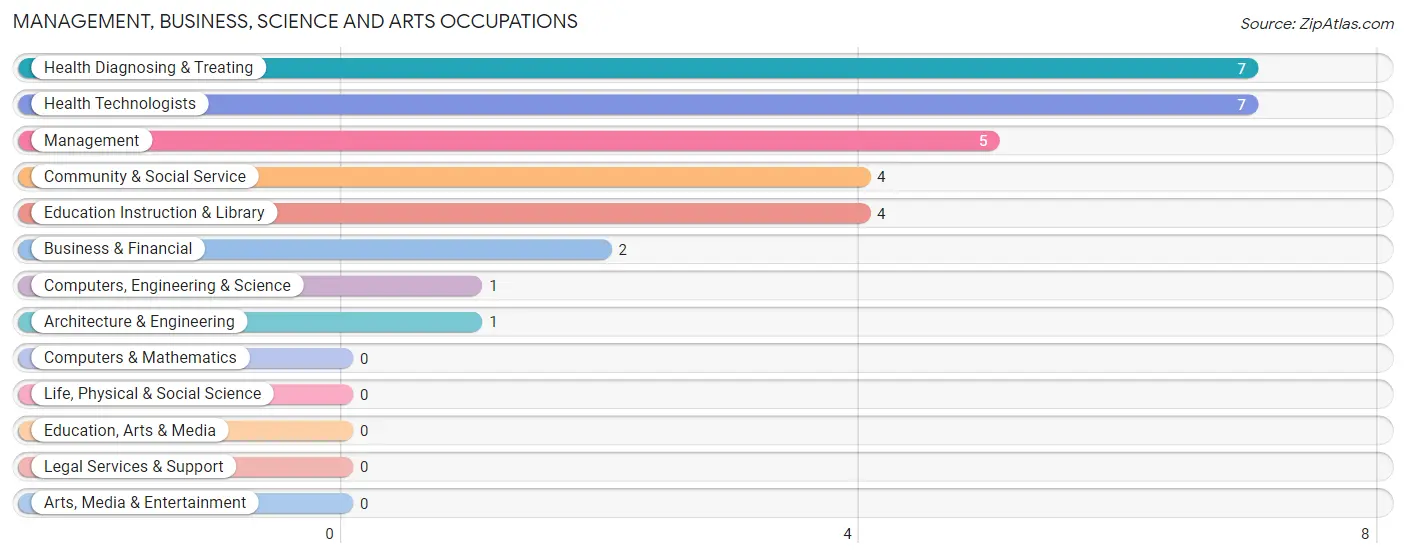
Management, Business, Science and Arts Occupations by Sex
Within the Management, Business, Science and Arts occupations in Calhoun, the most male-oriented occupations are Management (100.0%), Computers, Engineering & Science (100.0%), and Architecture & Engineering (100.0%), while the most female-oriented occupations are Community & Social Service (100.0%), Education Instruction & Library (100.0%), and Health Diagnosing & Treating (100.0%).
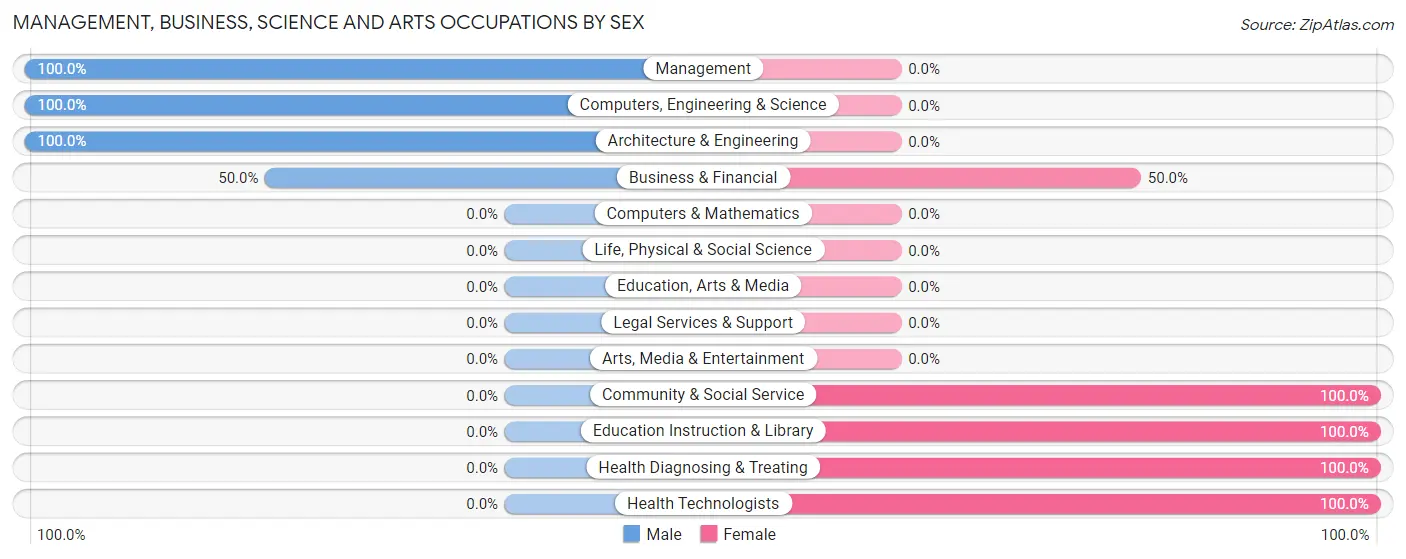
| Occupation | Male | Female |
| Management | 5 (100.0%) | 0 (0.0%) |
| Business & Financial | 1 (50.0%) | 1 (50.0%) |
| Computers, Engineering & Science | 1 (100.0%) | 0 (0.0%) |
| Computers & Mathematics | 0 (0.0%) | 0 (0.0%) |
| Architecture & Engineering | 1 (100.0%) | 0 (0.0%) |
| Life, Physical & Social Science | 0 (0.0%) | 0 (0.0%) |
| Community & Social Service | 0 (0.0%) | 4 (100.0%) |
| Education, Arts & Media | 0 (0.0%) | 0 (0.0%) |
| Legal Services & Support | 0 (0.0%) | 0 (0.0%) |
| Education Instruction & Library | 0 (0.0%) | 4 (100.0%) |
| Arts, Media & Entertainment | 0 (0.0%) | 0 (0.0%) |
| Health Diagnosing & Treating | 0 (0.0%) | 7 (100.0%) |
| Health Technologists | 0 (0.0%) | 7 (100.0%) |
| Total (Category) | 7 (36.8%) | 12 (63.2%) |
| Total (Overall) | 58 (59.8%) | 39 (40.2%) |
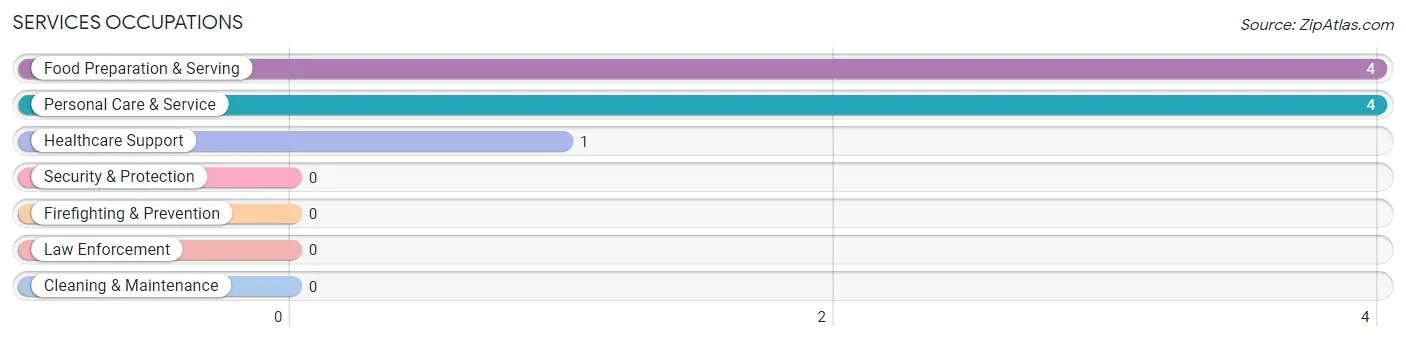
Services Occupations
The most common Services occupations in Calhoun are Food Preparation & Serving (4 | 4.1%), Personal Care & Service (4 | 4.1%), and Healthcare Support (1 | 1.0%).
Services Occupations by Sex
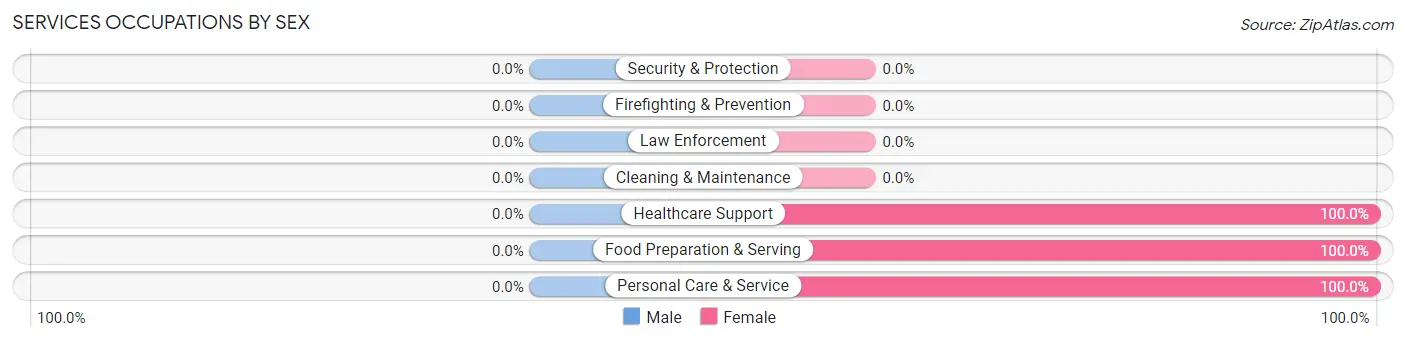
| Occupation | Male | Female |
| Healthcare Support | 0 (0.0%) | 1 (100.0%) |
| Security & Protection | 0 (0.0%) | 0 (0.0%) |
| Firefighting & Prevention | 0 (0.0%) | 0 (0.0%) |
| Law Enforcement | 0 (0.0%) | 0 (0.0%) |
| Food Preparation & Serving | 0 (0.0%) | 4 (100.0%) |
| Cleaning & Maintenance | 0 (0.0%) | 0 (0.0%) |
| Personal Care & Service | 0 (0.0%) | 4 (100.0%) |
| Total (Category) | 0 (0.0%) | 9 (100.0%) |
| Total (Overall) | 58 (59.8%) | 39 (40.2%) |
Sales and Office Occupations
The most common Sales and Office occupations in Calhoun are Sales & Related (11 | 11.3%), and Office & Administration (10 | 10.3%).

Sales and Office Occupations by Sex
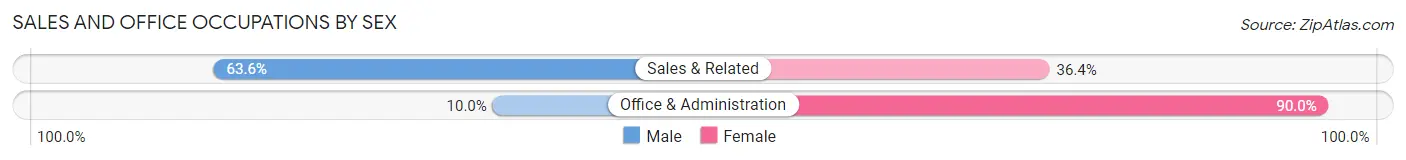
| Occupation | Male | Female |
| Sales & Related | 7 (63.6%) | 4 (36.4%) |
| Office & Administration | 1 (10.0%) | 9 (90.0%) |
| Total (Category) | 8 (38.1%) | 13 (61.9%) |
| Total (Overall) | 58 (59.8%) | 39 (40.2%) |
Natural Resources, Construction and Maintenance Occupations
The most common Natural Resources, Construction and Maintenance occupations in Calhoun are Construction & Extraction (4 | 4.1%), Farming, Fishing & Forestry (3 | 3.1%), and Installation, Maintenance & Repair (2 | 2.1%).
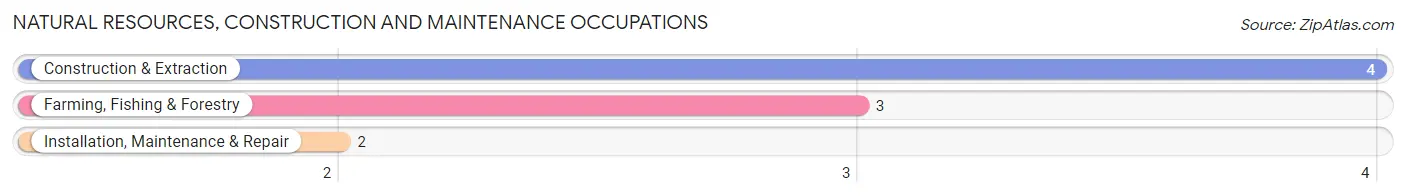
Natural Resources, Construction and Maintenance Occupations by Sex
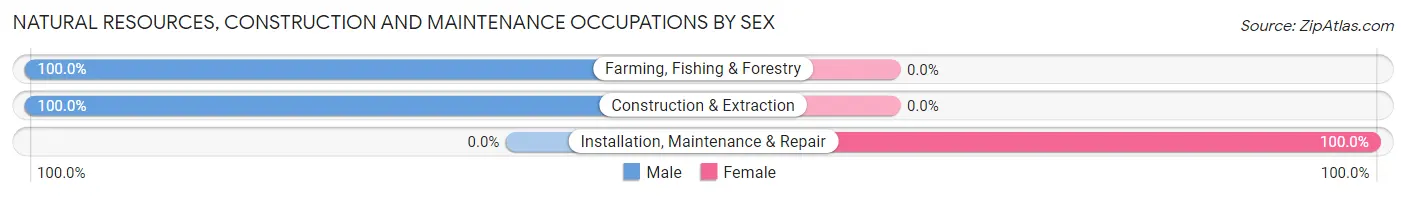
| Occupation | Male | Female |
| Farming, Fishing & Forestry | 3 (100.0%) | 0 (0.0%) |
| Construction & Extraction | 4 (100.0%) | 0 (0.0%) |
| Installation, Maintenance & Repair | 0 (0.0%) | 2 (100.0%) |
| Total (Category) | 7 (77.8%) | 2 (22.2%) |
| Total (Overall) | 58 (59.8%) | 39 (40.2%) |
Production, Transportation and Moving Occupations
The most common Production, Transportation and Moving occupations in Calhoun are Production (24 | 24.7%), Material Moving (10 | 10.3%), and Transportation (5 | 5.1%).
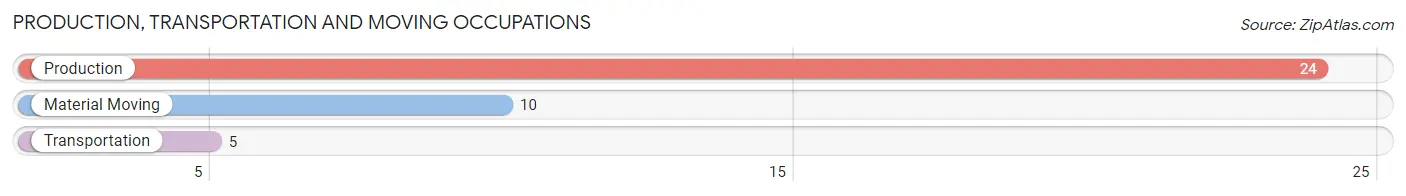
Production, Transportation and Moving Occupations by Sex
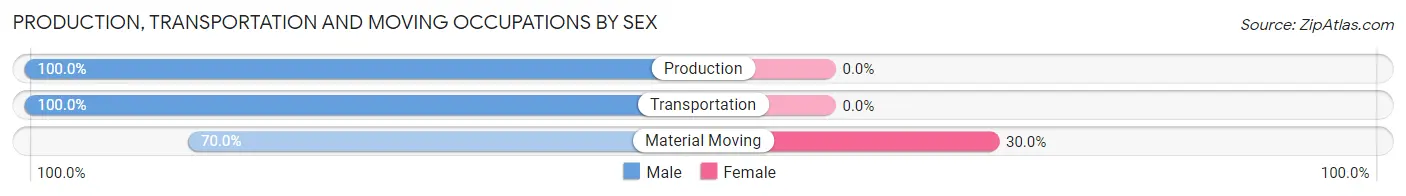
| Occupation | Male | Female |
| Production | 24 (100.0%) | 0 (0.0%) |
| Transportation | 5 (100.0%) | 0 (0.0%) |
| Material Moving | 7 (70.0%) | 3 (30.0%) |
| Total (Category) | 36 (92.3%) | 3 (7.7%) |
| Total (Overall) | 58 (59.8%) | 39 (40.2%) |
Employment Industries by Sex in Calhoun
Employment Industries in Calhoun
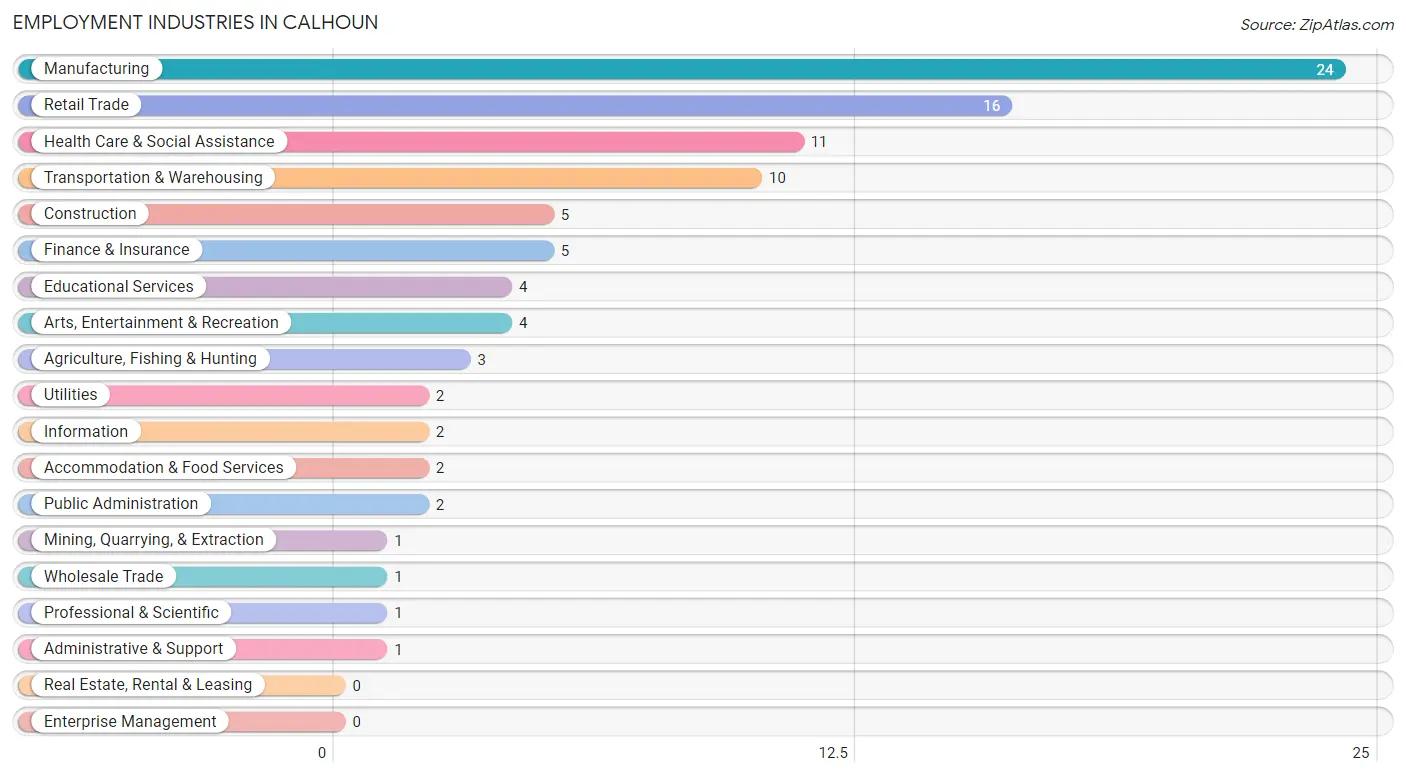
The major employment industries in Calhoun include Manufacturing (24 | 24.7%), Retail Trade (16 | 16.5%), Health Care & Social Assistance (11 | 11.3%), Transportation & Warehousing (10 | 10.3%), and Construction (5 | 5.1%).
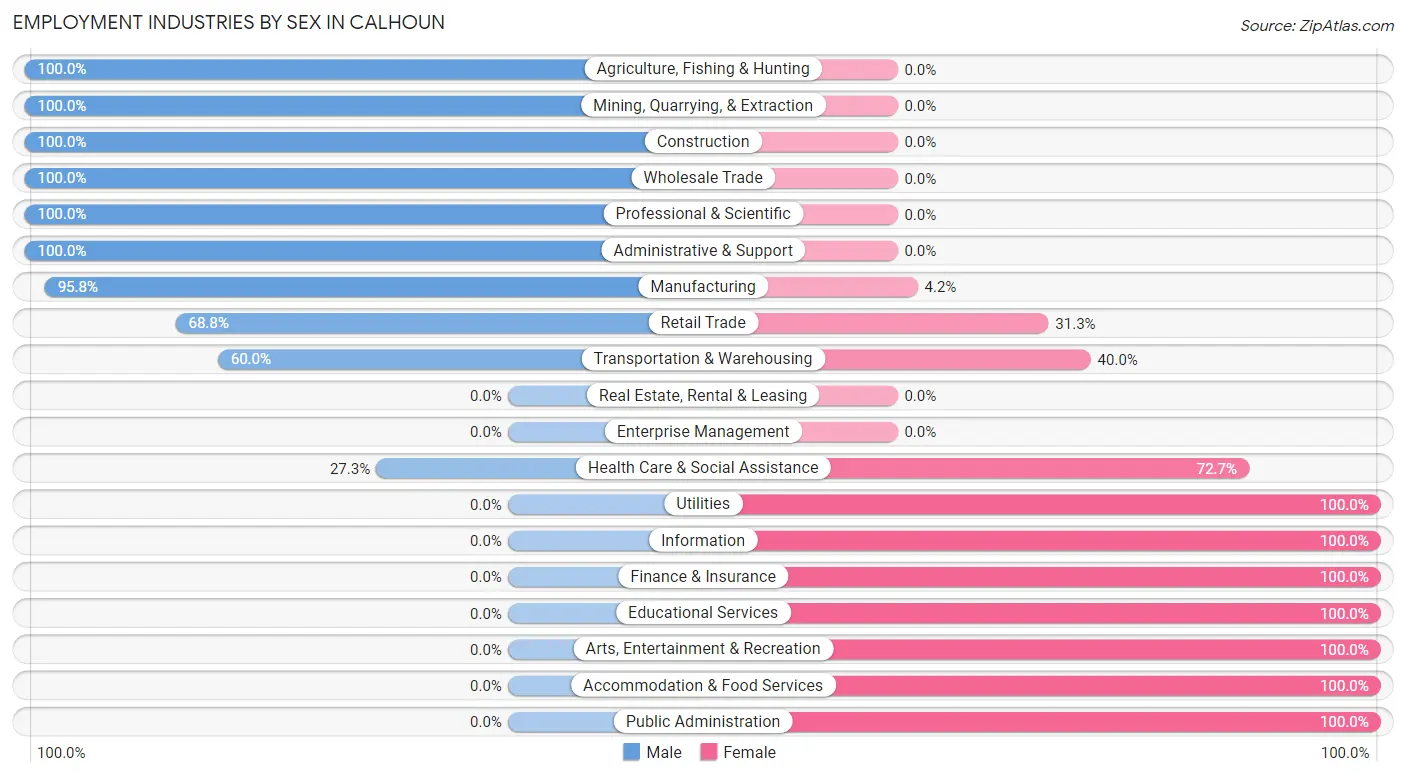
Employment Industries by Sex in Calhoun
The Calhoun industries that see more men than women are Agriculture, Fishing & Hunting (100.0%), Mining, Quarrying, & Extraction (100.0%), and Construction (100.0%), whereas the industries that tend to have a higher number of women are Utilities (100.0%), Information (100.0%), and Finance & Insurance (100.0%).
| Industry | Male | Female |
| Agriculture, Fishing & Hunting | 3 (100.0%) | 0 (0.0%) |
| Mining, Quarrying, & Extraction | 1 (100.0%) | 0 (0.0%) |
| Construction | 5 (100.0%) | 0 (0.0%) |
| Manufacturing | 23 (95.8%) | 1 (4.2%) |
| Wholesale Trade | 1 (100.0%) | 0 (0.0%) |
| Retail Trade | 11 (68.8%) | 5 (31.2%) |
| Transportation & Warehousing | 6 (60.0%) | 4 (40.0%) |
| Utilities | 0 (0.0%) | 2 (100.0%) |
| Information | 0 (0.0%) | 2 (100.0%) |
| Finance & Insurance | 0 (0.0%) | 5 (100.0%) |
| Real Estate, Rental & Leasing | 0 (0.0%) | 0 (0.0%) |
| Professional & Scientific | 1 (100.0%) | 0 (0.0%) |
| Enterprise Management | 0 (0.0%) | 0 (0.0%) |
| Administrative & Support | 1 (100.0%) | 0 (0.0%) |
| Educational Services | 0 (0.0%) | 4 (100.0%) |
| Health Care & Social Assistance | 3 (27.3%) | 8 (72.7%) |
| Arts, Entertainment & Recreation | 0 (0.0%) | 4 (100.0%) |
| Accommodation & Food Services | 0 (0.0%) | 2 (100.0%) |
| Public Administration | 0 (0.0%) | 2 (100.0%) |
| Total | 58 (59.8%) | 39 (40.2%) |
Education in Calhoun
School Enrollment in Calhoun
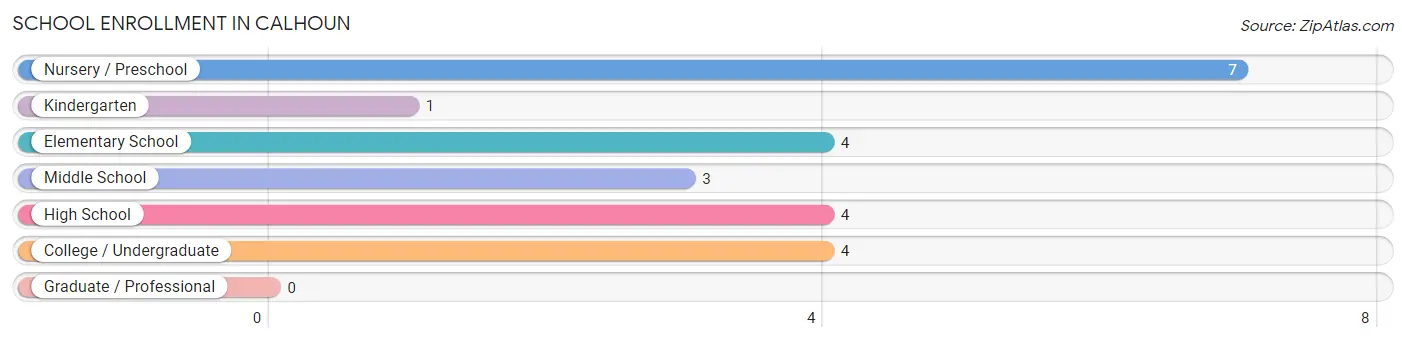
The most common levels of schooling among the 23 students in Calhoun are nursery / preschool (7 | 30.4%), elementary school (4 | 17.4%), and high school (4 | 17.4%).
| School Level | # Students | % Students |
| Nursery / Preschool | 7 | 30.4% |
| Kindergarten | 1 | 4.3% |
| Elementary School | 4 | 17.4% |
| Middle School | 3 | 13.0% |
| High School | 4 | 17.4% |
| College / Undergraduate | 4 | 17.4% |
| Graduate / Professional | 0 | 0.0% |
| Total | 23 | 100.0% |
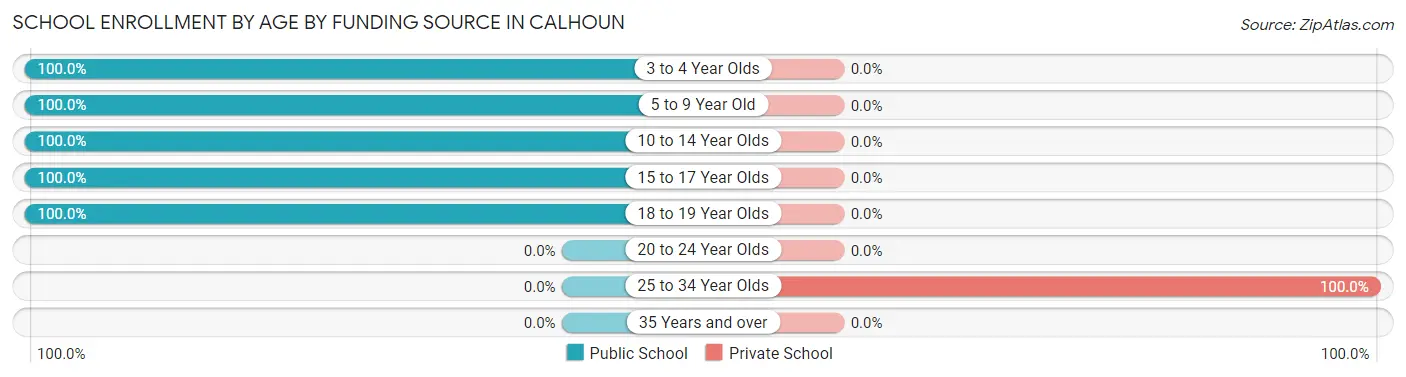
School Enrollment by Age by Funding Source in Calhoun
Out of a total of 23 students who are enrolled in schools in Calhoun, 2 (8.7%) attend a private institution, while the remaining 21 (91.3%) are enrolled in public schools. The age group of 25 to 34 year olds has the highest likelihood of being enrolled in private schools, with 2 (100.0% in the age bracket) enrolled. Conversely, the age group of 3 to 4 year olds has the lowest likelihood of being enrolled in a private school, with 5 (100.0% in the age bracket) attending a public institution.
| Age Bracket | Public School | Private School |
| 3 to 4 Year Olds | 5 (100.0%) | 0 (0.0%) |
| 5 to 9 Year Old | 7 (100.0%) | 0 (0.0%) |
| 10 to 14 Year Olds | 3 (100.0%) | 0 (0.0%) |
| 15 to 17 Year Olds | 1 (100.0%) | 0 (0.0%) |
| 18 to 19 Year Olds | 5 (100.0%) | 0 (0.0%) |
| 20 to 24 Year Olds | 0 (0.0%) | 0 (0.0%) |
| 25 to 34 Year Olds | 0 (0.0%) | 2 (100.0%) |
| 35 Years and over | 0 (0.0%) | 0 (0.0%) |
| Total | 21 (91.3%) | 2 (8.7%) |
Educational Attainment by Field of Study in Calhoun
Science & technology (5 | 45.5%), education (3 | 27.3%), literature & languages (2 | 18.2%), and engineering (1 | 9.1%) are the most common fields of study among 11 individuals in Calhoun who have obtained a bachelor's degree or higher.
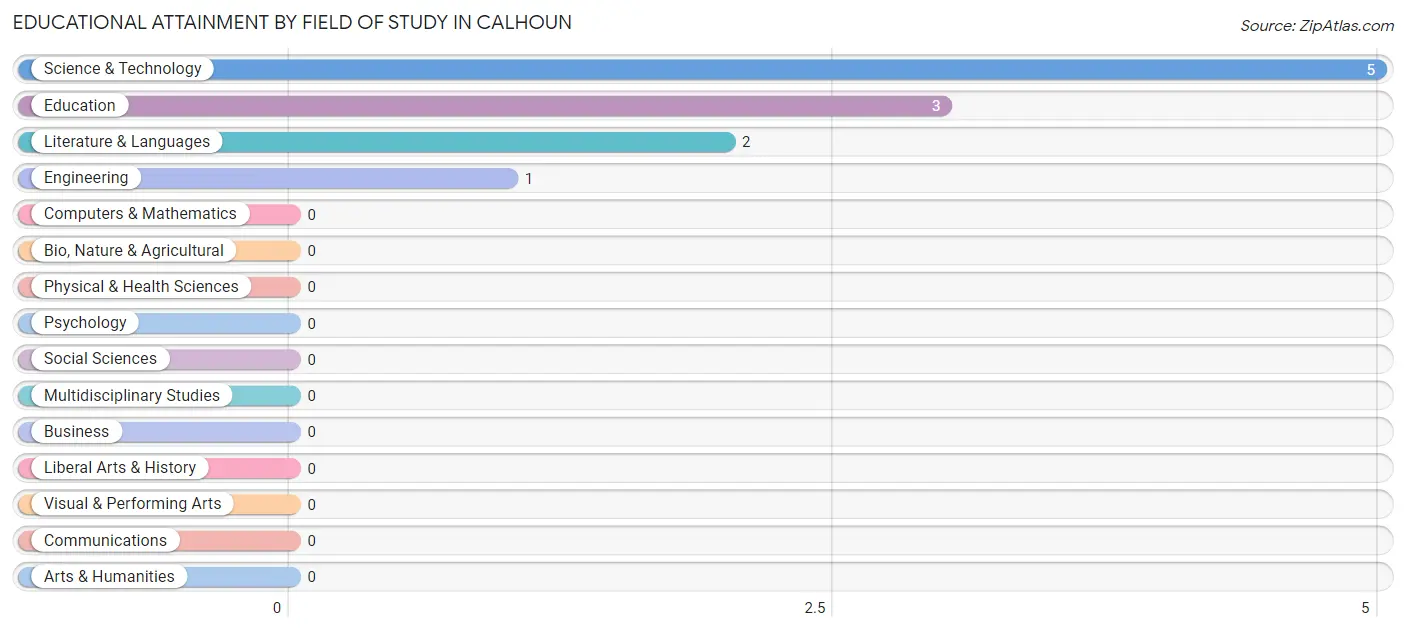
| Field of Study | # Graduates | % Graduates |
| Computers & Mathematics | 0 | 0.0% |
| Bio, Nature & Agricultural | 0 | 0.0% |
| Physical & Health Sciences | 0 | 0.0% |
| Psychology | 0 | 0.0% |
| Social Sciences | 0 | 0.0% |
| Engineering | 1 | 9.1% |
| Multidisciplinary Studies | 0 | 0.0% |
| Science & Technology | 5 | 45.5% |
| Business | 0 | 0.0% |
| Education | 3 | 27.3% |
| Literature & Languages | 2 | 18.2% |
| Liberal Arts & History | 0 | 0.0% |
| Visual & Performing Arts | 0 | 0.0% |
| Communications | 0 | 0.0% |
| Arts & Humanities | 0 | 0.0% |
| Total | 11 | 100.0% |
Transportation & Commute in Calhoun
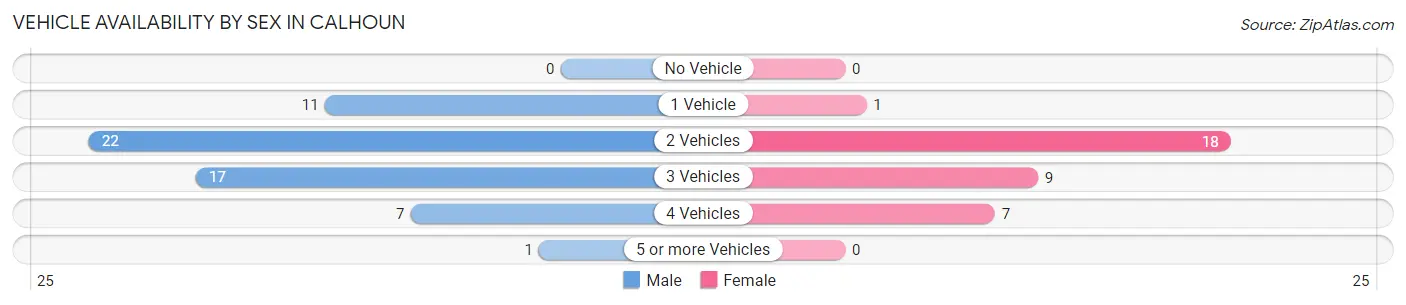
Vehicle Availability by Sex in Calhoun
The most prevalent vehicle ownership categories in Calhoun are males with 2 vehicles (22, accounting for 37.9%) and females with 2 vehicles (18, making up 62.9%).
| Vehicles Available | Male | Female |
| No Vehicle | 0 (0.0%) | 0 (0.0%) |
| 1 Vehicle | 11 (19.0%) | 1 (2.9%) |
| 2 Vehicles | 22 (37.9%) | 18 (51.4%) |
| 3 Vehicles | 17 (29.3%) | 9 (25.7%) |
| 4 Vehicles | 7 (12.1%) | 7 (20.0%) |
| 5 or more Vehicles | 1 (1.7%) | 0 (0.0%) |
| Total | 58 (100.0%) | 35 (100.0%) |
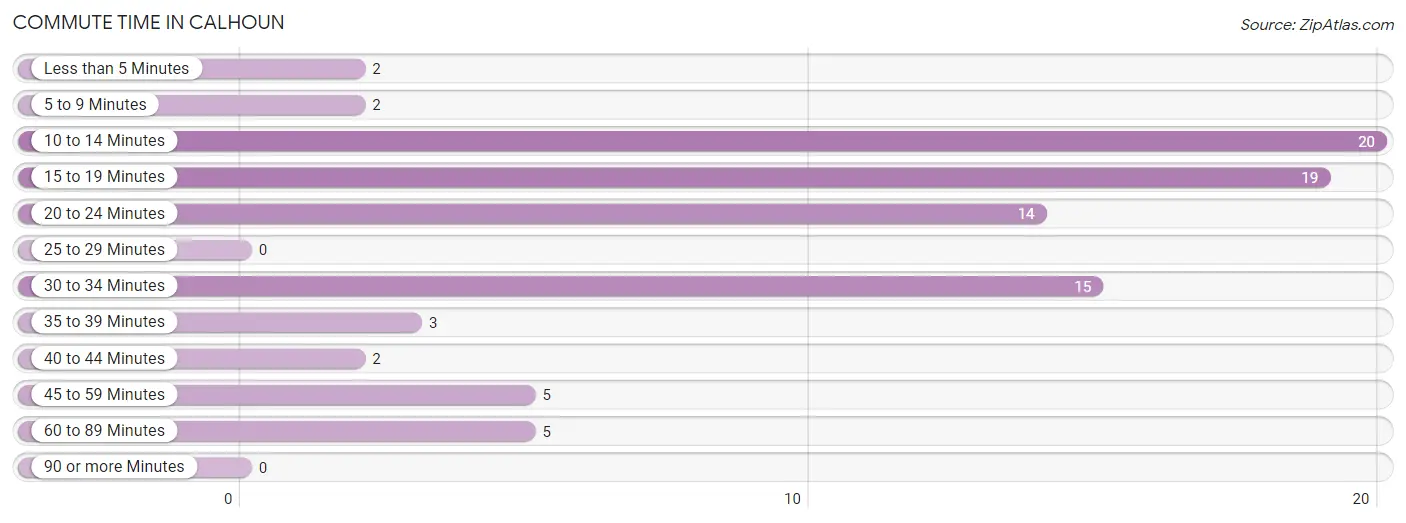
Commute Time in Calhoun
The most frequently occuring commute durations in Calhoun are 10 to 14 minutes (20 commuters, 23.0%), 15 to 19 minutes (19 commuters, 21.8%), and 30 to 34 minutes (15 commuters, 17.2%).
| Commute Time | # Commuters | % Commuters |
| Less than 5 Minutes | 2 | 2.3% |
| 5 to 9 Minutes | 2 | 2.3% |
| 10 to 14 Minutes | 20 | 23.0% |
| 15 to 19 Minutes | 19 | 21.8% |
| 20 to 24 Minutes | 14 | 16.1% |
| 25 to 29 Minutes | 0 | 0.0% |
| 30 to 34 Minutes | 15 | 17.2% |
| 35 to 39 Minutes | 3 | 3.5% |
| 40 to 44 Minutes | 2 | 2.3% |
| 45 to 59 Minutes | 5 | 5.8% |
| 60 to 89 Minutes | 5 | 5.8% |
| 90 or more Minutes | 0 | 0.0% |
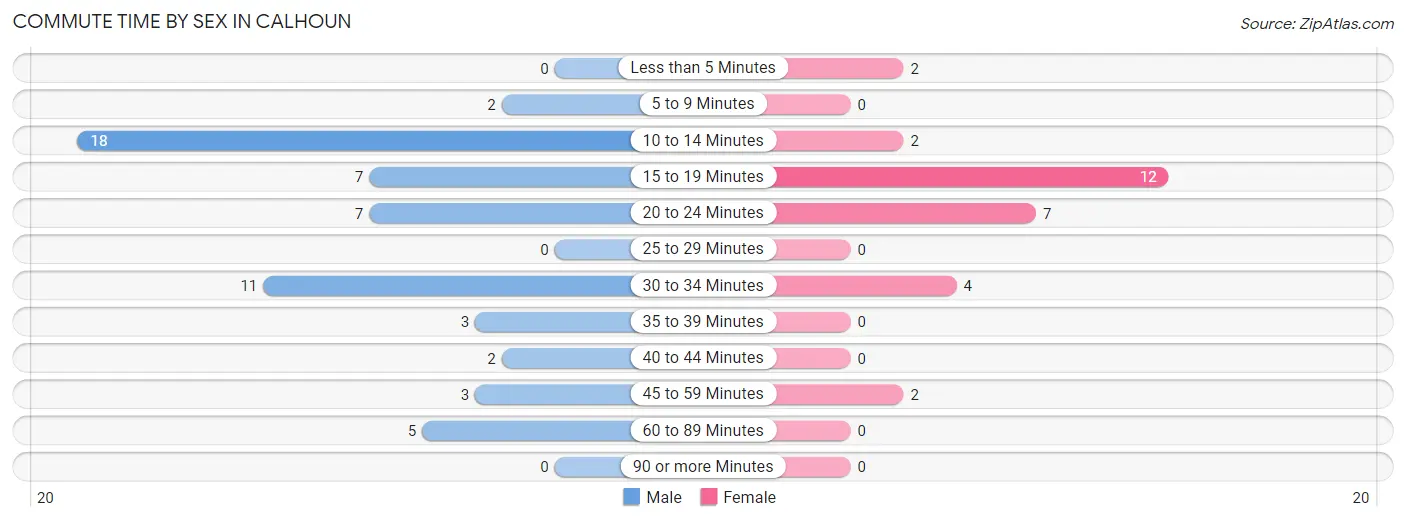
Commute Time by Sex in Calhoun
The most common commute times in Calhoun are 10 to 14 minutes (18 commuters, 31.0%) for males and 15 to 19 minutes (12 commuters, 41.4%) for females.
| Commute Time | Male | Female |
| Less than 5 Minutes | 0 (0.0%) | 2 (6.9%) |
| 5 to 9 Minutes | 2 (3.5%) | 0 (0.0%) |
| 10 to 14 Minutes | 18 (31.0%) | 2 (6.9%) |
| 15 to 19 Minutes | 7 (12.1%) | 12 (41.4%) |
| 20 to 24 Minutes | 7 (12.1%) | 7 (24.1%) |
| 25 to 29 Minutes | 0 (0.0%) | 0 (0.0%) |
| 30 to 34 Minutes | 11 (19.0%) | 4 (13.8%) |
| 35 to 39 Minutes | 3 (5.2%) | 0 (0.0%) |
| 40 to 44 Minutes | 2 (3.5%) | 0 (0.0%) |
| 45 to 59 Minutes | 3 (5.2%) | 2 (6.9%) |
| 60 to 89 Minutes | 5 (8.6%) | 0 (0.0%) |
| 90 or more Minutes | 0 (0.0%) | 0 (0.0%) |
Time of Departure to Work by Sex in Calhoun
The most frequent times of departure to work in Calhoun are 6:30 AM to 6:59 AM (19, 32.8%) for males and 7:00 AM to 7:29 AM (13, 44.8%) for females.
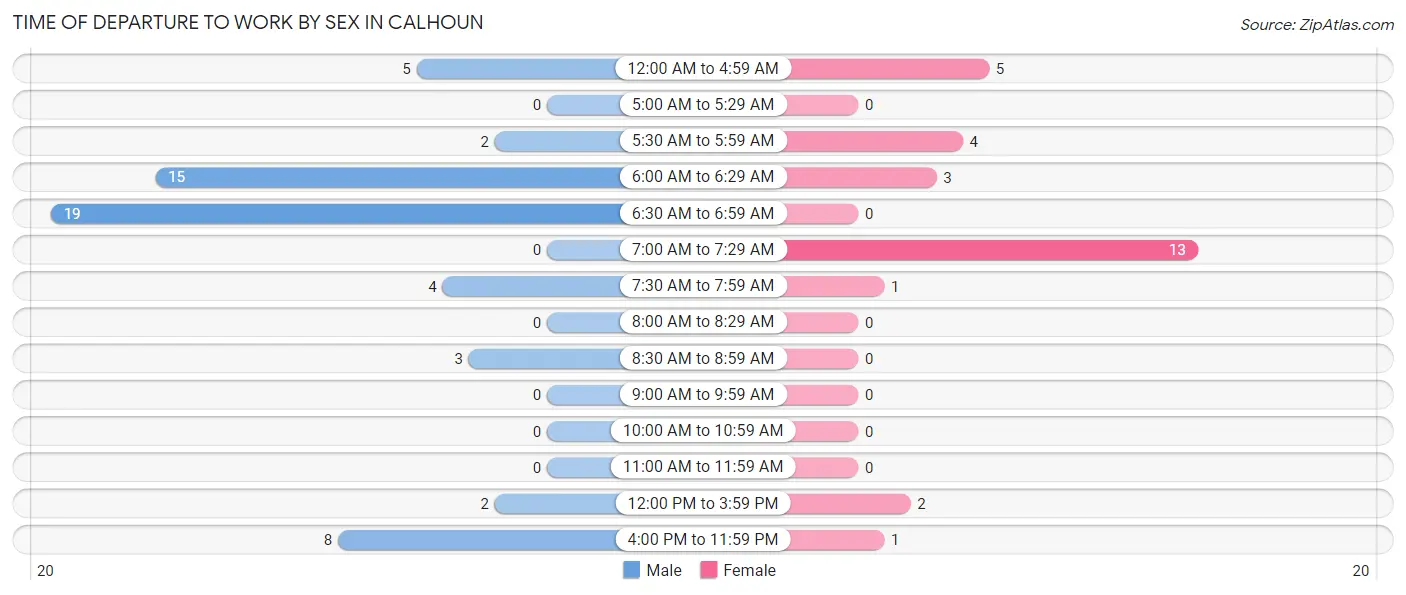
| Time of Departure | Male | Female |
| 12:00 AM to 4:59 AM | 5 (8.6%) | 5 (17.2%) |
| 5:00 AM to 5:29 AM | 0 (0.0%) | 0 (0.0%) |
| 5:30 AM to 5:59 AM | 2 (3.5%) | 4 (13.8%) |
| 6:00 AM to 6:29 AM | 15 (25.9%) | 3 (10.3%) |
| 6:30 AM to 6:59 AM | 19 (32.8%) | 0 (0.0%) |
| 7:00 AM to 7:29 AM | 0 (0.0%) | 13 (44.8%) |
| 7:30 AM to 7:59 AM | 4 (6.9%) | 1 (3.5%) |
| 8:00 AM to 8:29 AM | 0 (0.0%) | 0 (0.0%) |
| 8:30 AM to 8:59 AM | 3 (5.2%) | 0 (0.0%) |
| 9:00 AM to 9:59 AM | 0 (0.0%) | 0 (0.0%) |
| 10:00 AM to 10:59 AM | 0 (0.0%) | 0 (0.0%) |
| 11:00 AM to 11:59 AM | 0 (0.0%) | 0 (0.0%) |
| 12:00 PM to 3:59 PM | 2 (3.5%) | 2 (6.9%) |
| 4:00 PM to 11:59 PM | 8 (13.8%) | 1 (3.5%) |
| Total | 58 (100.0%) | 29 (100.0%) |
Housing Occupancy in Calhoun
Occupancy by Ownership in Calhoun
Of the total 67 dwellings in Calhoun, owner-occupied units account for 62 (92.5%), while renter-occupied units make up 5 (7.5%).
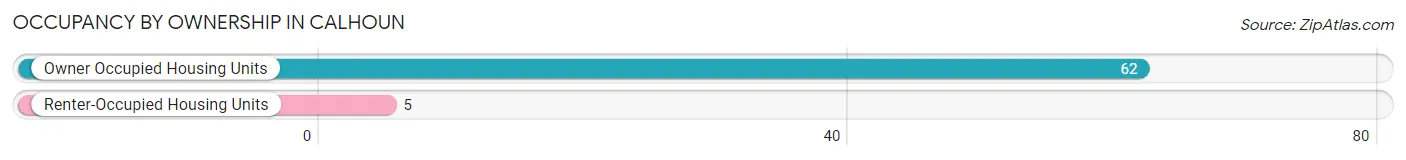
| Occupancy | # Housing Units | % Housing Units |
| Owner Occupied Housing Units | 62 | 92.5% |
| Renter-Occupied Housing Units | 5 | 7.5% |
| Total Occupied Housing Units | 67 | 100.0% |
Occupancy by Household Size in Calhoun
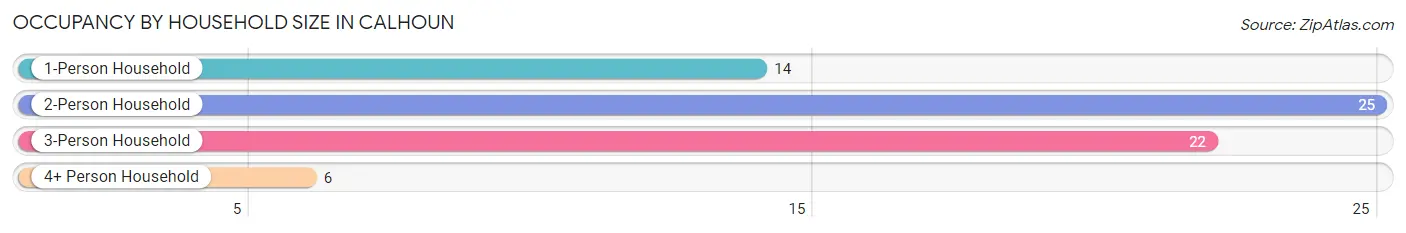
| Household Size | # Housing Units | % Housing Units |
| 1-Person Household | 14 | 20.9% |
| 2-Person Household | 25 | 37.3% |
| 3-Person Household | 22 | 32.8% |
| 4+ Person Household | 6 | 9.0% |
| Total Housing Units | 67 | 100.0% |
Occupancy by Ownership by Household Size in Calhoun
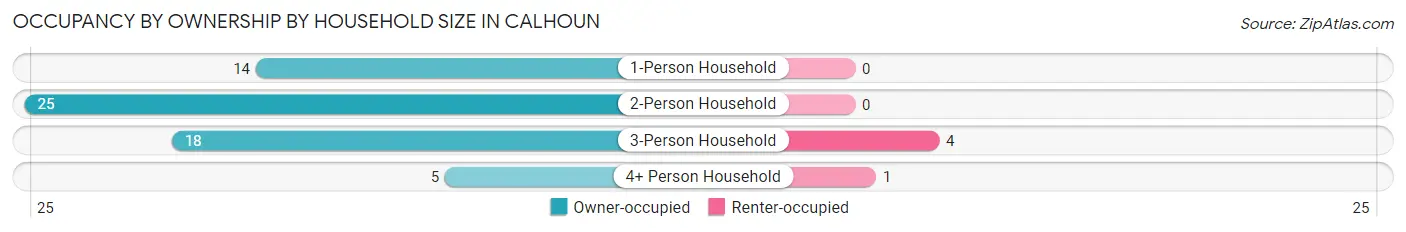
| Household Size | Owner-occupied | Renter-occupied |
| 1-Person Household | 14 (100.0%) | 0 (0.0%) |
| 2-Person Household | 25 (100.0%) | 0 (0.0%) |
| 3-Person Household | 18 (81.8%) | 4 (18.2%) |
| 4+ Person Household | 5 (83.3%) | 1 (16.7%) |
| Total Housing Units | 62 (92.5%) | 5 (7.5%) |
Occupancy by Educational Attainment in Calhoun
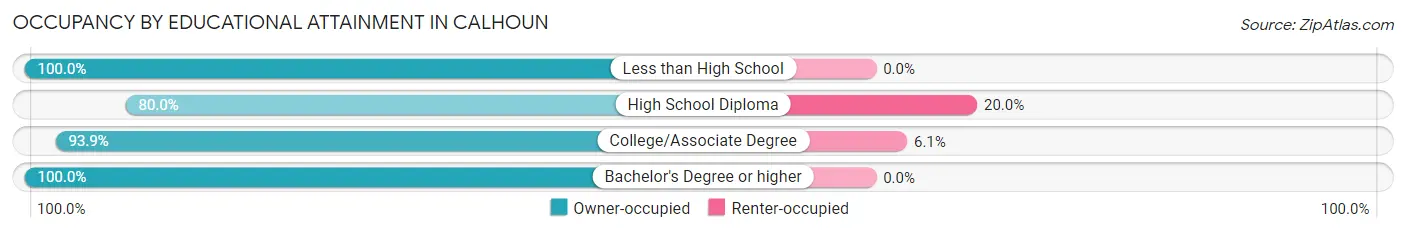
| Household Size | Owner-occupied | Renter-occupied |
| Less than High School | 4 (100.0%) | 0 (0.0%) |
| High School Diploma | 8 (80.0%) | 2 (20.0%) |
| College/Associate Degree | 46 (93.9%) | 3 (6.1%) |
| Bachelor's Degree or higher | 4 (100.0%) | 0 (0.0%) |
Occupancy by Age of Householder in Calhoun
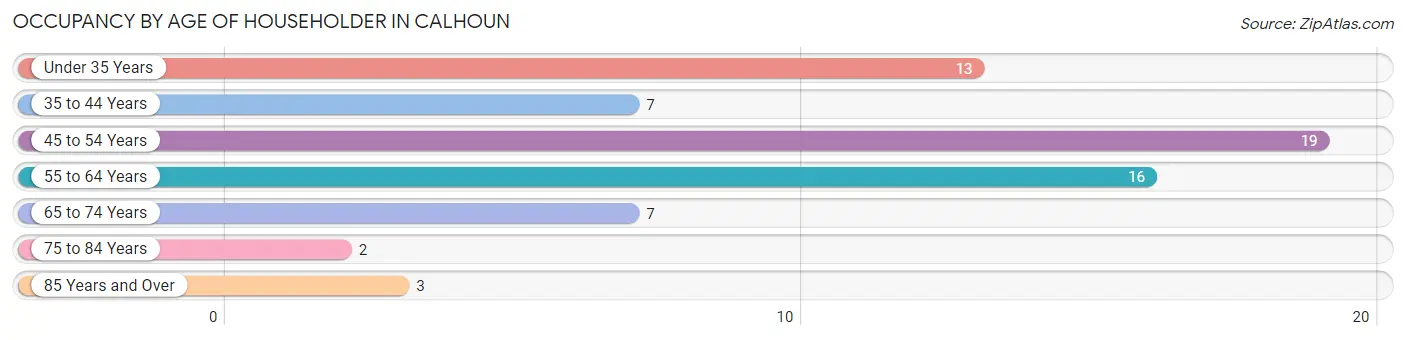
| Age Bracket | # Households | % Households |
| Under 35 Years | 13 | 19.4% |
| 35 to 44 Years | 7 | 10.4% |
| 45 to 54 Years | 19 | 28.4% |
| 55 to 64 Years | 16 | 23.9% |
| 65 to 74 Years | 7 | 10.4% |
| 75 to 84 Years | 2 | 3.0% |
| 85 Years and Over | 3 | 4.5% |
| Total | 67 | 100.0% |
Housing Finances in Calhoun
Median Income by Occupancy in Calhoun
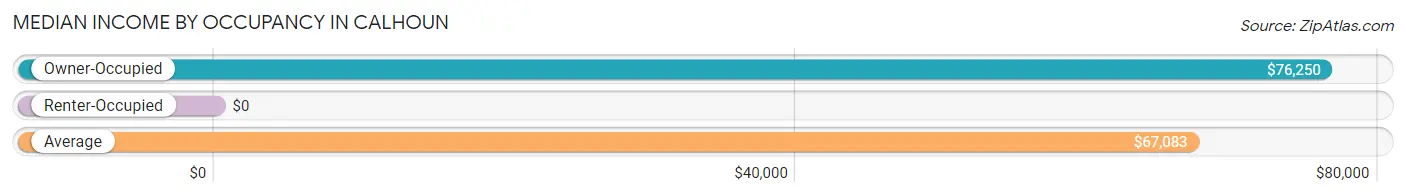
| Occupancy Type | # Households | Median Income |
| Owner-Occupied | 62 (92.5%) | $76,250 |
| Renter-Occupied | 5 (7.5%) | $0 |
| Average | 67 (100.0%) | $67,083 |
Occupancy by Householder Income Bracket in Calhoun
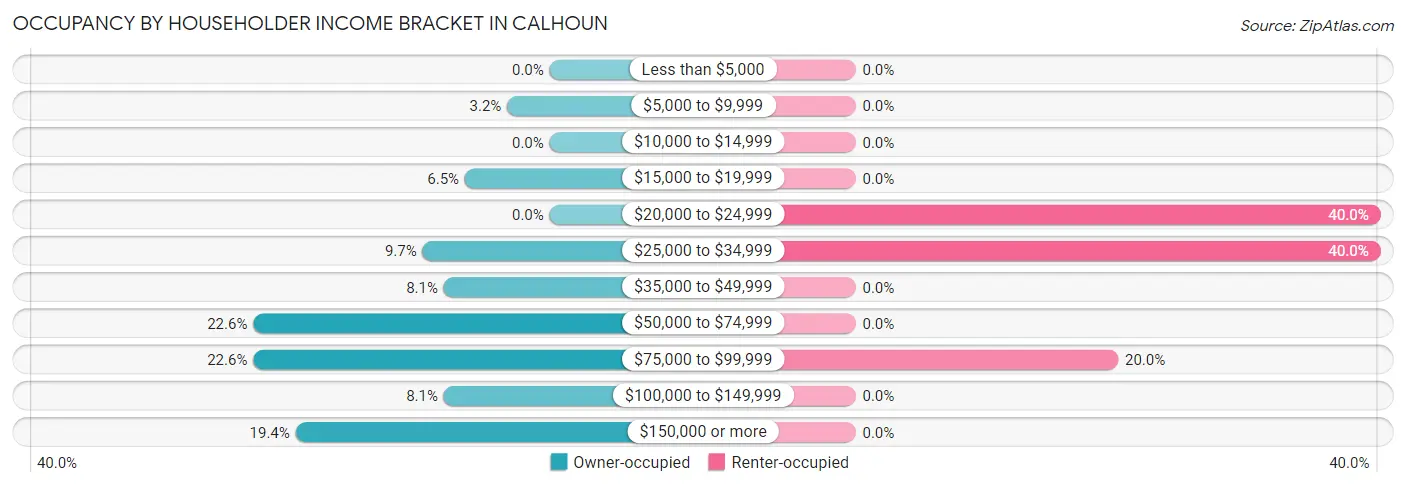
| Income Bracket | Owner-occupied | Renter-occupied |
| Less than $5,000 | 0 (0.0%) | 0 (0.0%) |
| $5,000 to $9,999 | 2 (3.2%) | 0 (0.0%) |
| $10,000 to $14,999 | 0 (0.0%) | 0 (0.0%) |
| $15,000 to $19,999 | 4 (6.5%) | 0 (0.0%) |
| $20,000 to $24,999 | 0 (0.0%) | 2 (40.0%) |
| $25,000 to $34,999 | 6 (9.7%) | 2 (40.0%) |
| $35,000 to $49,999 | 5 (8.1%) | 0 (0.0%) |
| $50,000 to $74,999 | 14 (22.6%) | 0 (0.0%) |
| $75,000 to $99,999 | 14 (22.6%) | 1 (20.0%) |
| $100,000 to $149,999 | 5 (8.1%) | 0 (0.0%) |
| $150,000 or more | 12 (19.4%) | 0 (0.0%) |
| Total | 62 (100.0%) | 5 (100.0%) |
Monthly Housing Cost Tiers in Calhoun
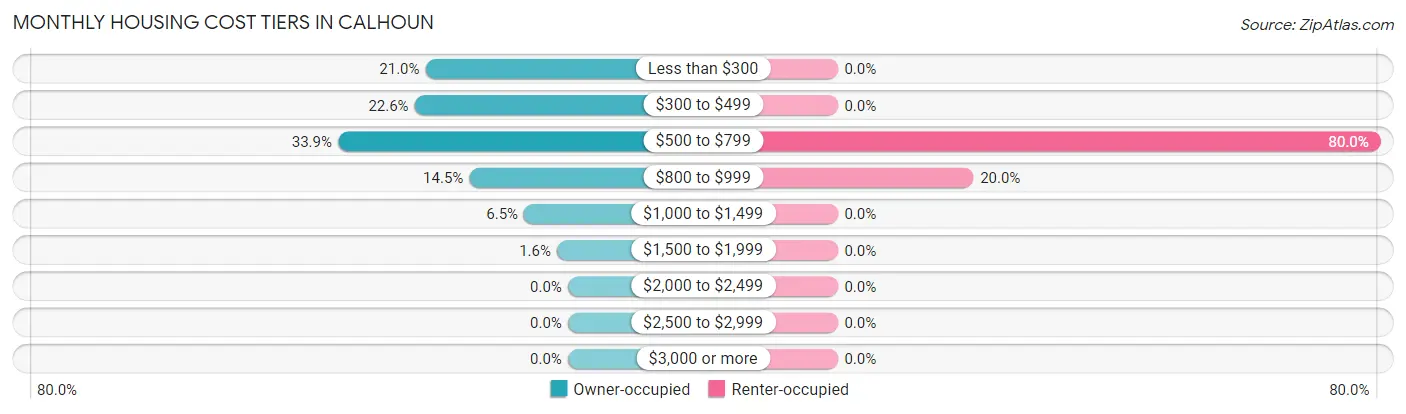
| Monthly Cost | Owner-occupied | Renter-occupied |
| Less than $300 | 13 (21.0%) | 0 (0.0%) |
| $300 to $499 | 14 (22.6%) | 0 (0.0%) |
| $500 to $799 | 21 (33.9%) | 4 (80.0%) |
| $800 to $999 | 9 (14.5%) | 1 (20.0%) |
| $1,000 to $1,499 | 4 (6.5%) | 0 (0.0%) |
| $1,500 to $1,999 | 1 (1.6%) | 0 (0.0%) |
| $2,000 to $2,499 | 0 (0.0%) | 0 (0.0%) |
| $2,500 to $2,999 | 0 (0.0%) | 0 (0.0%) |
| $3,000 or more | 0 (0.0%) | 0 (0.0%) |
| Total | 62 (100.0%) | 5 (100.0%) |
Physical Housing Characteristics in Calhoun
Housing Structures in Calhoun
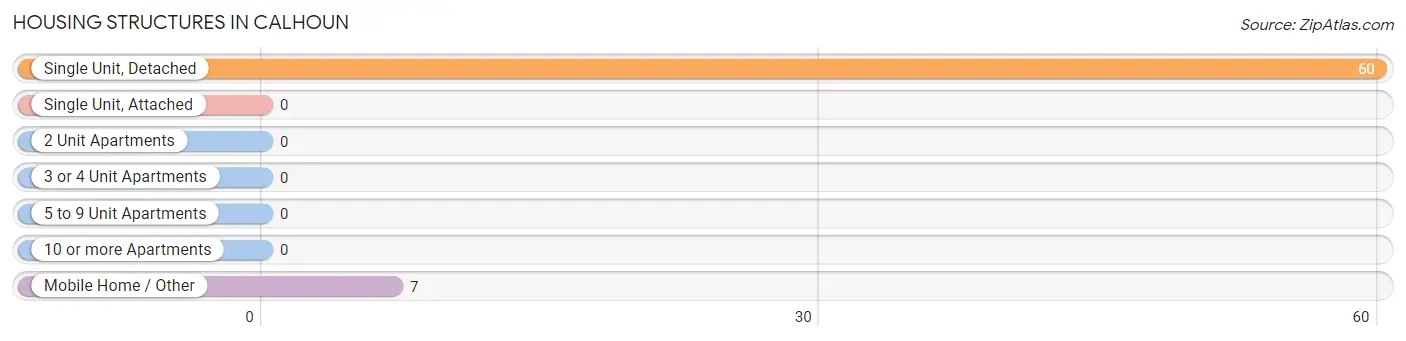
| Structure Type | # Housing Units | % Housing Units |
| Single Unit, Detached | 60 | 89.5% |
| Single Unit, Attached | 0 | 0.0% |
| 2 Unit Apartments | 0 | 0.0% |
| 3 or 4 Unit Apartments | 0 | 0.0% |
| 5 to 9 Unit Apartments | 0 | 0.0% |
| 10 or more Apartments | 0 | 0.0% |
| Mobile Home / Other | 7 | 10.4% |
| Total | 67 | 100.0% |
Housing Structures by Occupancy in Calhoun
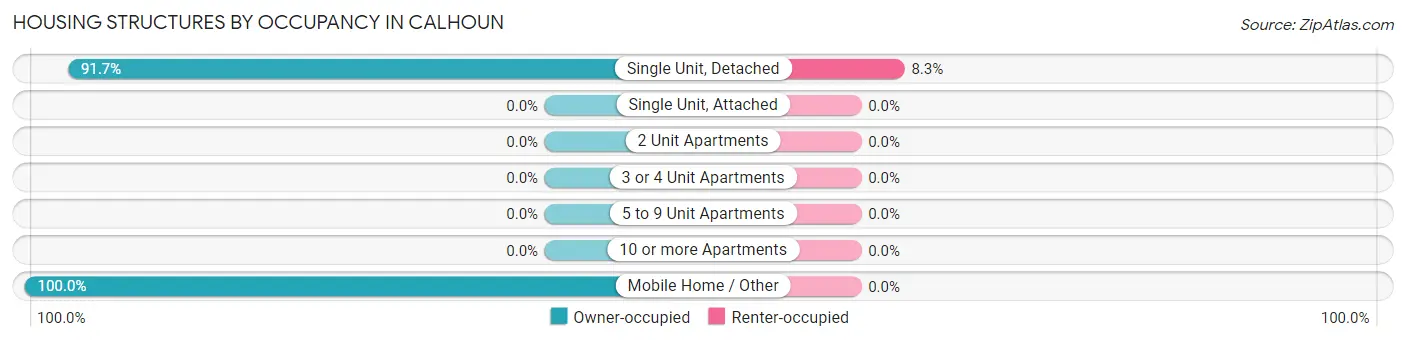
| Structure Type | Owner-occupied | Renter-occupied |
| Single Unit, Detached | 55 (91.7%) | 5 (8.3%) |
| Single Unit, Attached | 0 (0.0%) | 0 (0.0%) |
| 2 Unit Apartments | 0 (0.0%) | 0 (0.0%) |
| 3 or 4 Unit Apartments | 0 (0.0%) | 0 (0.0%) |
| 5 to 9 Unit Apartments | 0 (0.0%) | 0 (0.0%) |
| 10 or more Apartments | 0 (0.0%) | 0 (0.0%) |
| Mobile Home / Other | 7 (100.0%) | 0 (0.0%) |
| Total | 62 (92.5%) | 5 (7.5%) |
Housing Structures by Number of Rooms in Calhoun
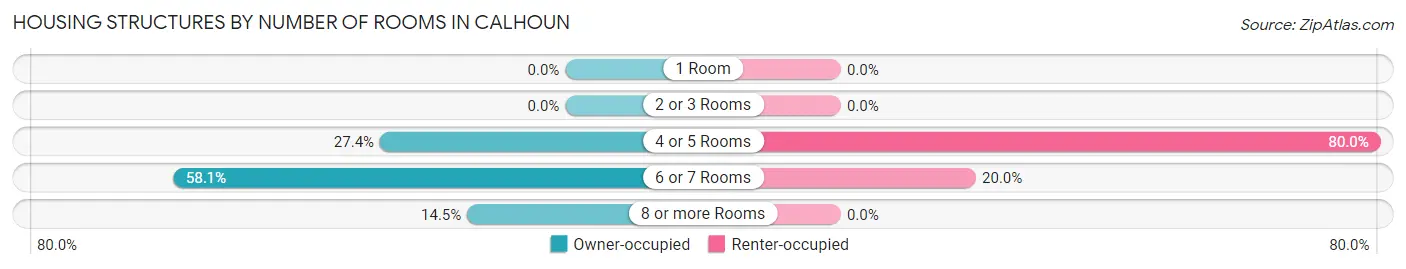
| Number of Rooms | Owner-occupied | Renter-occupied |
| 1 Room | 0 (0.0%) | 0 (0.0%) |
| 2 or 3 Rooms | 0 (0.0%) | 0 (0.0%) |
| 4 or 5 Rooms | 17 (27.4%) | 4 (80.0%) |
| 6 or 7 Rooms | 36 (58.1%) | 1 (20.0%) |
| 8 or more Rooms | 9 (14.5%) | 0 (0.0%) |
| Total | 62 (100.0%) | 5 (100.0%) |
Housing Structure by Heating Type in Calhoun
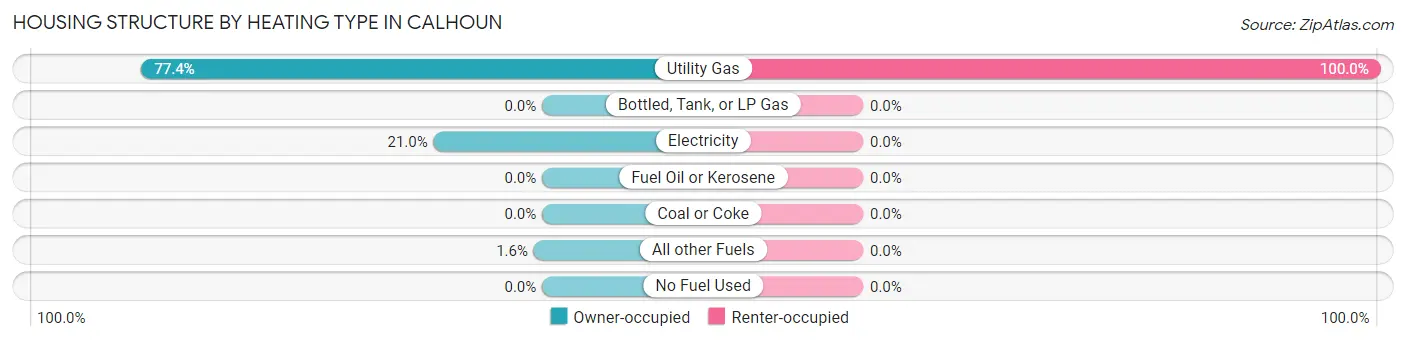
| Heating Type | Owner-occupied | Renter-occupied |
| Utility Gas | 48 (77.4%) | 5 (100.0%) |
| Bottled, Tank, or LP Gas | 0 (0.0%) | 0 (0.0%) |
| Electricity | 13 (21.0%) | 0 (0.0%) |
| Fuel Oil or Kerosene | 0 (0.0%) | 0 (0.0%) |
| Coal or Coke | 0 (0.0%) | 0 (0.0%) |
| All other Fuels | 1 (1.6%) | 0 (0.0%) |
| No Fuel Used | 0 (0.0%) | 0 (0.0%) |
| Total | 62 (100.0%) | 5 (100.0%) |
Household Vehicle Usage in Calhoun
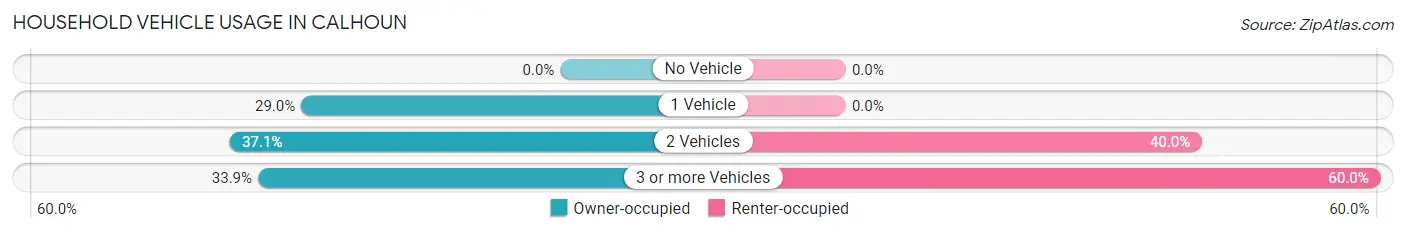
| Vehicles per Household | Owner-occupied | Renter-occupied |
| No Vehicle | 0 (0.0%) | 0 (0.0%) |
| 1 Vehicle | 18 (29.0%) | 0 (0.0%) |
| 2 Vehicles | 23 (37.1%) | 2 (40.0%) |
| 3 or more Vehicles | 21 (33.9%) | 3 (60.0%) |
| Total | 62 (100.0%) | 5 (100.0%) |
Real Estate & Mortgages in Calhoun
Real Estate and Mortgage Overview in Calhoun
| Characteristic | Without Mortgage | With Mortgage |
| Housing Units | 45 | 17 |
| Median Property Value | $47,800 | $0 |
| Median Household Income | $80,313 | $3 |
| Monthly Housing Costs | $442 | $0 |
| Real Estate Taxes | $867 | $1 |
Property Value by Mortgage Status in Calhoun
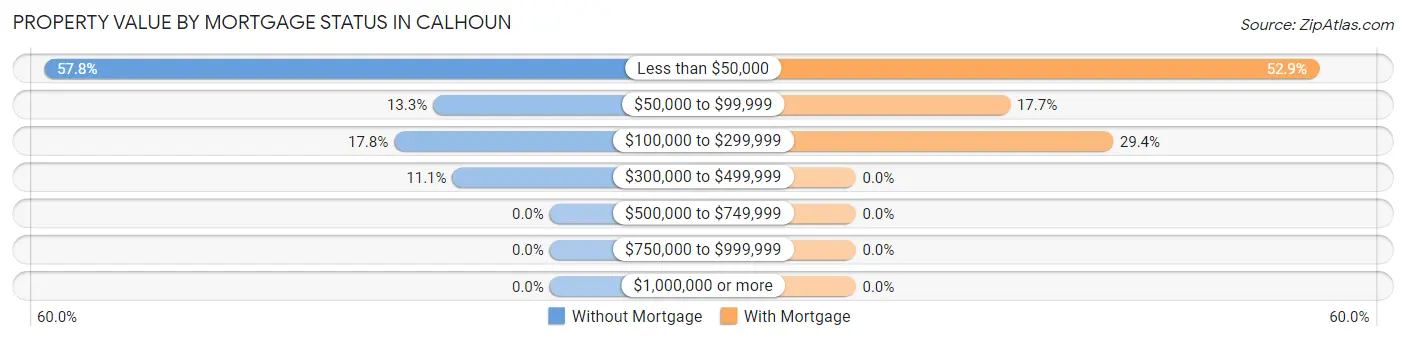
| Property Value | Without Mortgage | With Mortgage |
| Less than $50,000 | 26 (57.8%) | 9 (52.9%) |
| $50,000 to $99,999 | 6 (13.3%) | 3 (17.6%) |
| $100,000 to $299,999 | 8 (17.8%) | 5 (29.4%) |
| $300,000 to $499,999 | 5 (11.1%) | 0 (0.0%) |
| $500,000 to $749,999 | 0 (0.0%) | 0 (0.0%) |
| $750,000 to $999,999 | 0 (0.0%) | 0 (0.0%) |
| $1,000,000 or more | 0 (0.0%) | 0 (0.0%) |
| Total | 45 (100.0%) | 17 (100.0%) |
Household Income by Mortgage Status in Calhoun
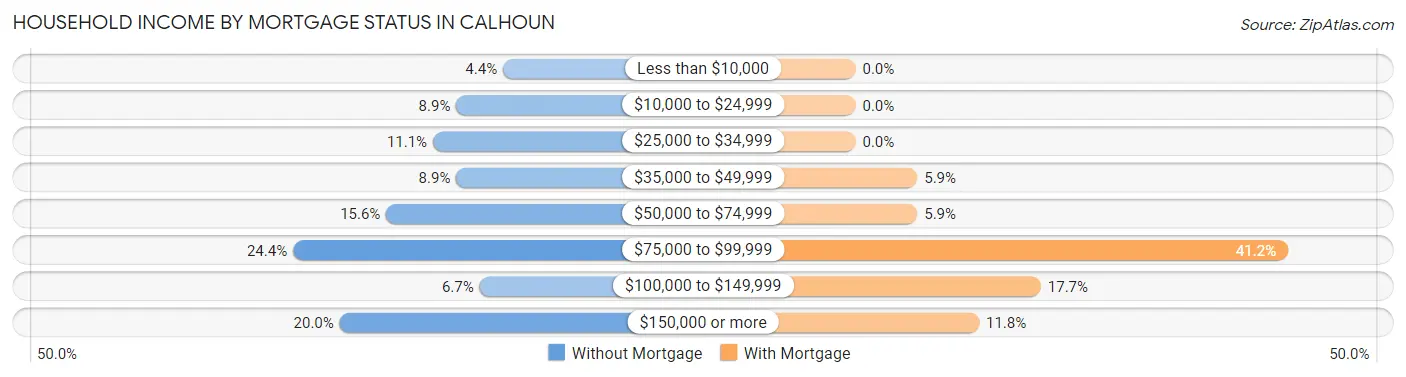
| Household Income | Without Mortgage | With Mortgage |
| Less than $10,000 | 2 (4.4%) | 0 (0.0%) |
| $10,000 to $24,999 | 4 (8.9%) | 0 (0.0%) |
| $25,000 to $34,999 | 5 (11.1%) | 0 (0.0%) |
| $35,000 to $49,999 | 4 (8.9%) | 1 (5.9%) |
| $50,000 to $74,999 | 7 (15.6%) | 1 (5.9%) |
| $75,000 to $99,999 | 11 (24.4%) | 7 (41.2%) |
| $100,000 to $149,999 | 3 (6.7%) | 3 (17.6%) |
| $150,000 or more | 9 (20.0%) | 2 (11.8%) |
| Total | 45 (100.0%) | 17 (100.0%) |
Property Value to Household Income Ratio in Calhoun
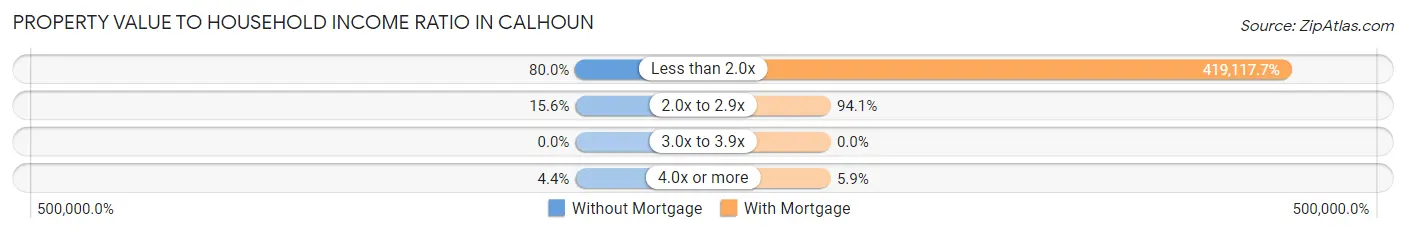
| Value-to-Income Ratio | Without Mortgage | With Mortgage |
| Less than 2.0x | 36 (80.0%) | 71,250 (419,117.6%) |
| 2.0x to 2.9x | 7 (15.6%) | 16 (94.1%) |
| 3.0x to 3.9x | 0 (0.0%) | 0 (0.0%) |
| 4.0x or more | 2 (4.4%) | 1 (5.9%) |
| Total | 45 (100.0%) | 17 (100.0%) |
Real Estate Taxes by Mortgage Status in Calhoun
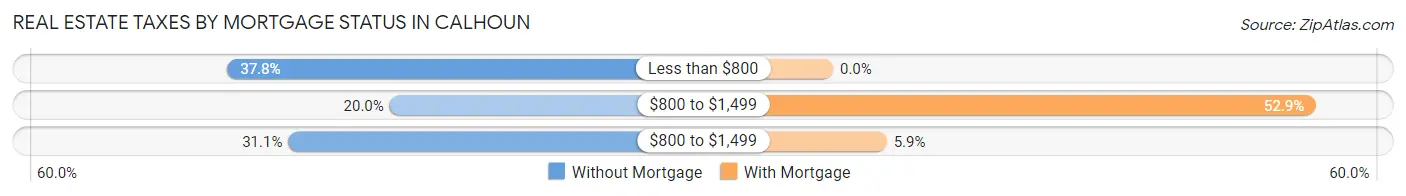
| Property Taxes | Without Mortgage | With Mortgage |
| Less than $800 | 17 (37.8%) | 0 (0.0%) |
| $800 to $1,499 | 9 (20.0%) | 9 (52.9%) |
| $800 to $1,499 | 14 (31.1%) | 1 (5.9%) |
| Total | 45 (100.0%) | 17 (100.0%) |
Health & Disability in Calhoun
Health Insurance Coverage by Age in Calhoun
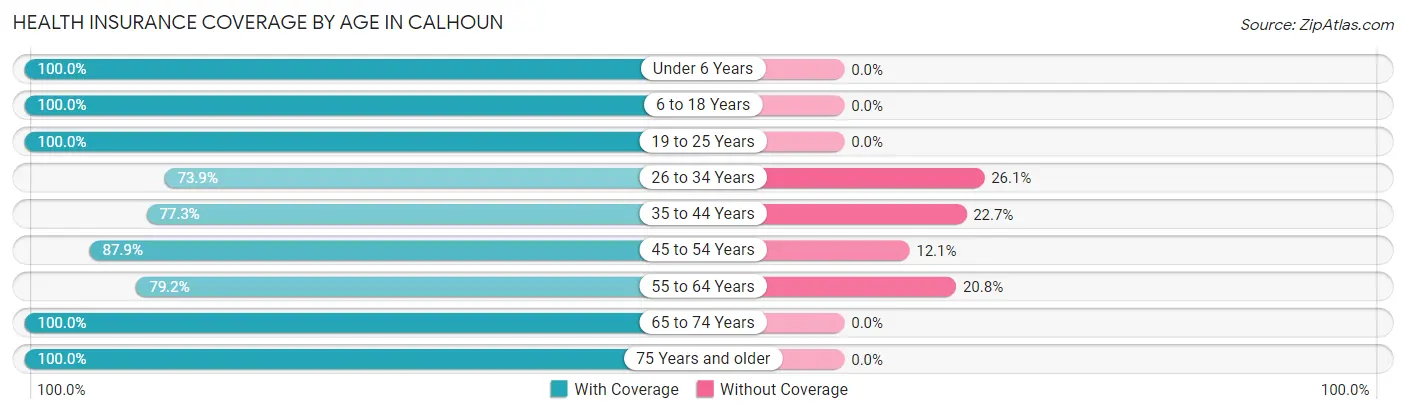
| Age Bracket | With Coverage | Without Coverage |
| Under 6 Years | 14 (100.0%) | 0 (0.0%) |
| 6 to 18 Years | 12 (100.0%) | 0 (0.0%) |
| 19 to 25 Years | 22 (100.0%) | 0 (0.0%) |
| 26 to 34 Years | 17 (73.9%) | 6 (26.1%) |
| 35 to 44 Years | 17 (77.3%) | 5 (22.7%) |
| 45 to 54 Years | 29 (87.9%) | 4 (12.1%) |
| 55 to 64 Years | 19 (79.2%) | 5 (20.8%) |
| 65 to 74 Years | 13 (100.0%) | 0 (0.0%) |
| 75 Years and older | 7 (100.0%) | 0 (0.0%) |
| Total | 150 (88.2%) | 20 (11.8%) |
Health Insurance Coverage by Citizenship Status in Calhoun
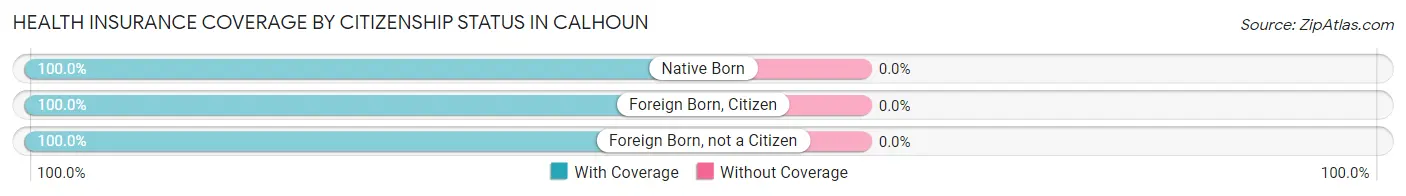
| Citizenship Status | With Coverage | Without Coverage |
| Native Born | 14 (100.0%) | 0 (0.0%) |
| Foreign Born, Citizen | 12 (100.0%) | 0 (0.0%) |
| Foreign Born, not a Citizen | 22 (100.0%) | 0 (0.0%) |
Health Insurance Coverage by Household Income in Calhoun
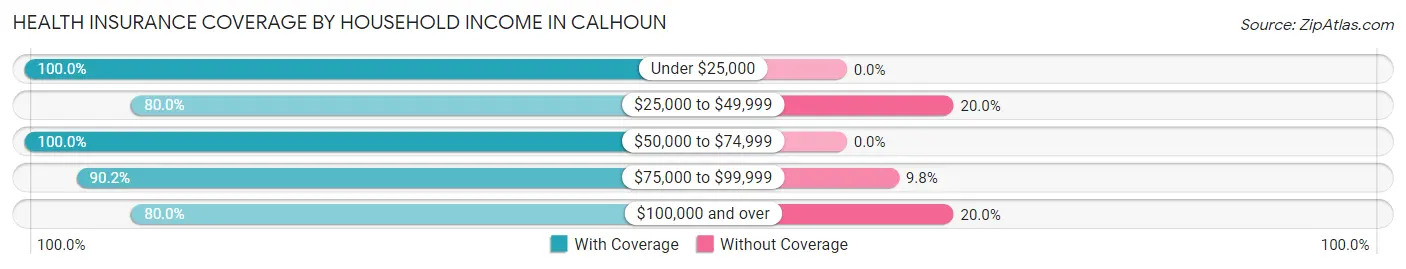
| Household Income | With Coverage | Without Coverage |
| Under $25,000 | 17 (100.0%) | 0 (0.0%) |
| $25,000 to $49,999 | 20 (80.0%) | 5 (20.0%) |
| $50,000 to $74,999 | 32 (100.0%) | 0 (0.0%) |
| $75,000 to $99,999 | 37 (90.2%) | 4 (9.8%) |
| $100,000 and over | 44 (80.0%) | 11 (20.0%) |
Public vs Private Health Insurance Coverage by Age in Calhoun
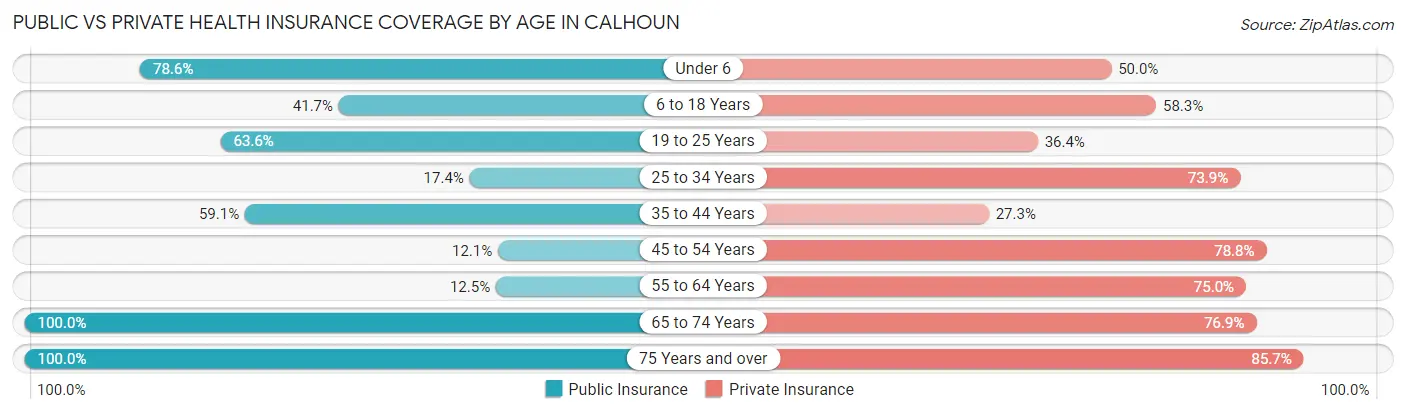
| Age Bracket | Public Insurance | Private Insurance |
| Under 6 | 11 (78.6%) | 7 (50.0%) |
| 6 to 18 Years | 5 (41.7%) | 7 (58.3%) |
| 19 to 25 Years | 14 (63.6%) | 8 (36.4%) |
| 25 to 34 Years | 4 (17.4%) | 17 (73.9%) |
| 35 to 44 Years | 13 (59.1%) | 6 (27.3%) |
| 45 to 54 Years | 4 (12.1%) | 26 (78.8%) |
| 55 to 64 Years | 3 (12.5%) | 18 (75.0%) |
| 65 to 74 Years | 13 (100.0%) | 10 (76.9%) |
| 75 Years and over | 7 (100.0%) | 6 (85.7%) |
| Total | 74 (43.5%) | 105 (61.8%) |
Disability Status by Sex by Age in Calhoun
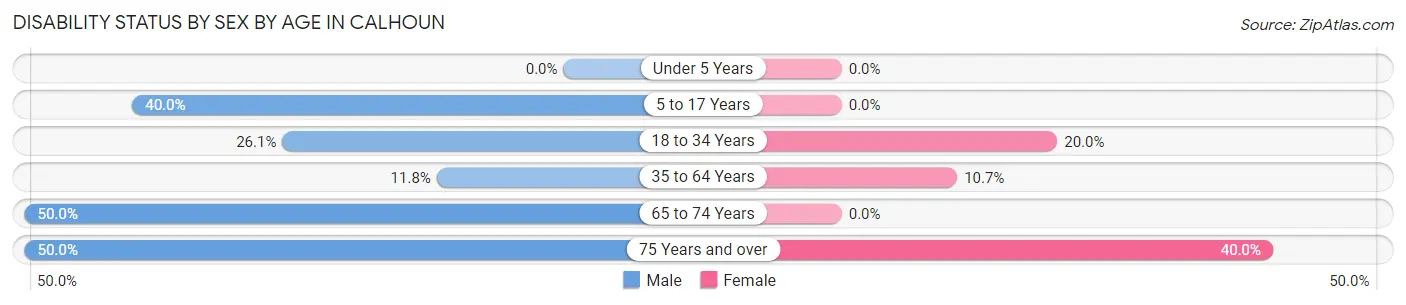
| Age Bracket | Male | Female |
| Under 5 Years | 0 (0.0%) | 0 (0.0%) |
| 5 to 17 Years | 2 (40.0%) | 0 (0.0%) |
| 18 to 34 Years | 6 (26.1%) | 5 (20.0%) |
| 35 to 64 Years | 6 (11.8%) | 3 (10.7%) |
| 65 to 74 Years | 2 (50.0%) | 0 (0.0%) |
| 75 Years and over | 1 (50.0%) | 2 (40.0%) |
Disability Class by Sex by Age in Calhoun
Disability Class: Hearing Difficulty
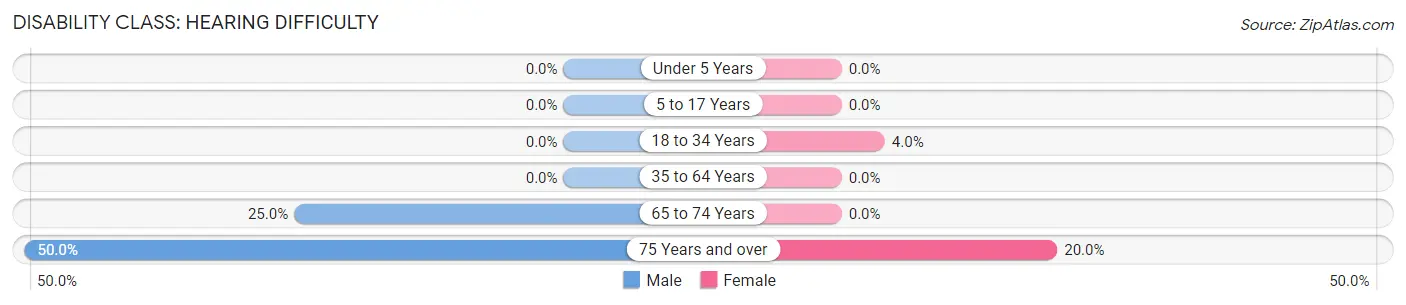
| Age Bracket | Male | Female |
| Under 5 Years | 0 (0.0%) | 0 (0.0%) |
| 5 to 17 Years | 0 (0.0%) | 0 (0.0%) |
| 18 to 34 Years | 0 (0.0%) | 1 (4.0%) |
| 35 to 64 Years | 0 (0.0%) | 0 (0.0%) |
| 65 to 74 Years | 1 (25.0%) | 0 (0.0%) |
| 75 Years and over | 1 (50.0%) | 1 (20.0%) |
Disability Class: Vision Difficulty
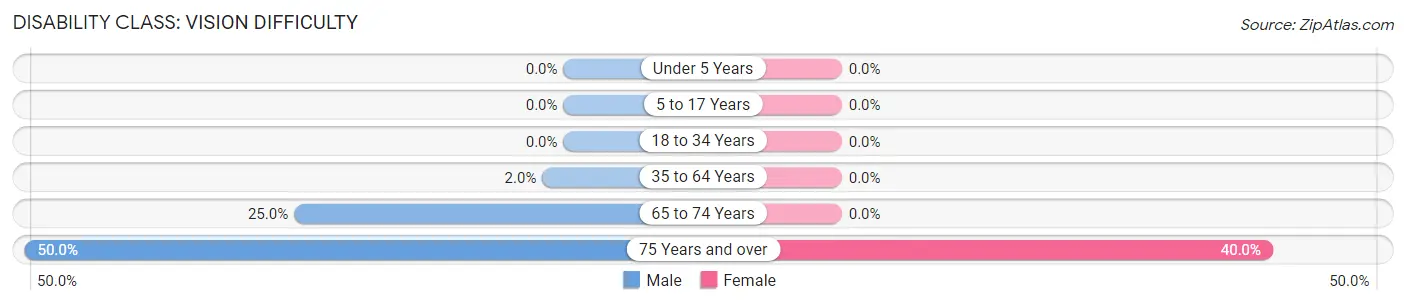
| Age Bracket | Male | Female |
| Under 5 Years | 0 (0.0%) | 0 (0.0%) |
| 5 to 17 Years | 0 (0.0%) | 0 (0.0%) |
| 18 to 34 Years | 0 (0.0%) | 0 (0.0%) |
| 35 to 64 Years | 1 (2.0%) | 0 (0.0%) |
| 65 to 74 Years | 1 (25.0%) | 0 (0.0%) |
| 75 Years and over | 1 (50.0%) | 2 (40.0%) |
Disability Class: Cognitive Difficulty
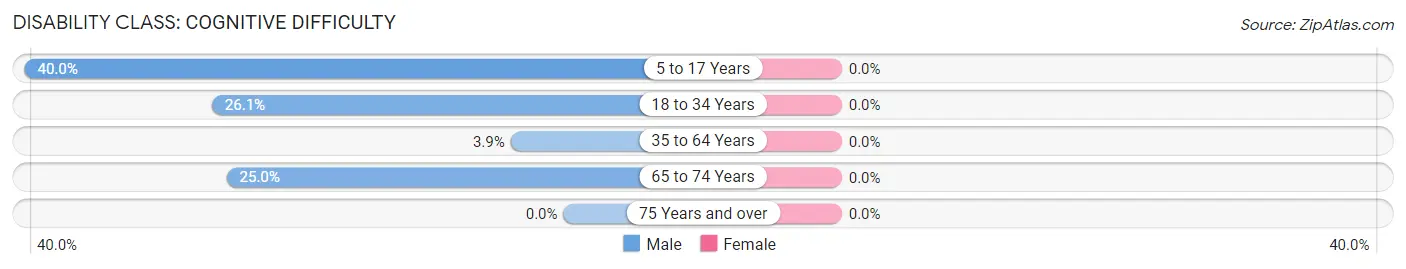
| Age Bracket | Male | Female |
| 5 to 17 Years | 2 (40.0%) | 0 (0.0%) |
| 18 to 34 Years | 6 (26.1%) | 0 (0.0%) |
| 35 to 64 Years | 2 (3.9%) | 0 (0.0%) |
| 65 to 74 Years | 1 (25.0%) | 0 (0.0%) |
| 75 Years and over | 0 (0.0%) | 0 (0.0%) |
Disability Class: Ambulatory Difficulty
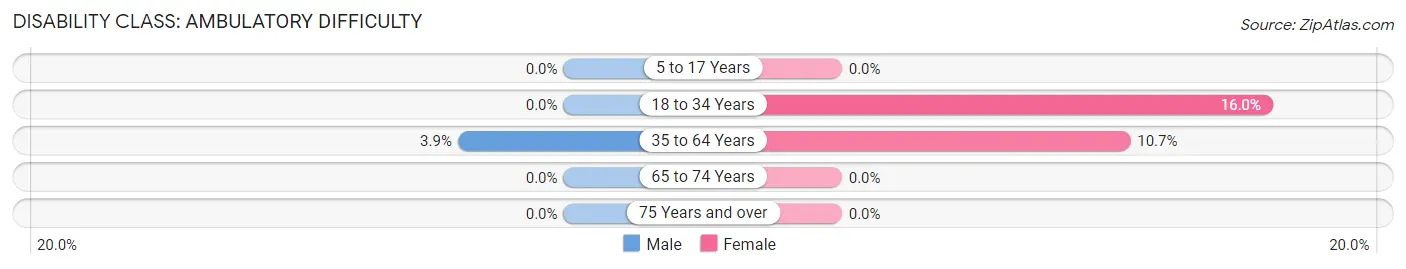
| Age Bracket | Male | Female |
| 5 to 17 Years | 0 (0.0%) | 0 (0.0%) |
| 18 to 34 Years | 0 (0.0%) | 4 (16.0%) |
| 35 to 64 Years | 2 (3.9%) | 3 (10.7%) |
| 65 to 74 Years | 0 (0.0%) | 0 (0.0%) |
| 75 Years and over | 0 (0.0%) | 0 (0.0%) |
Disability Class: Self-Care Difficulty
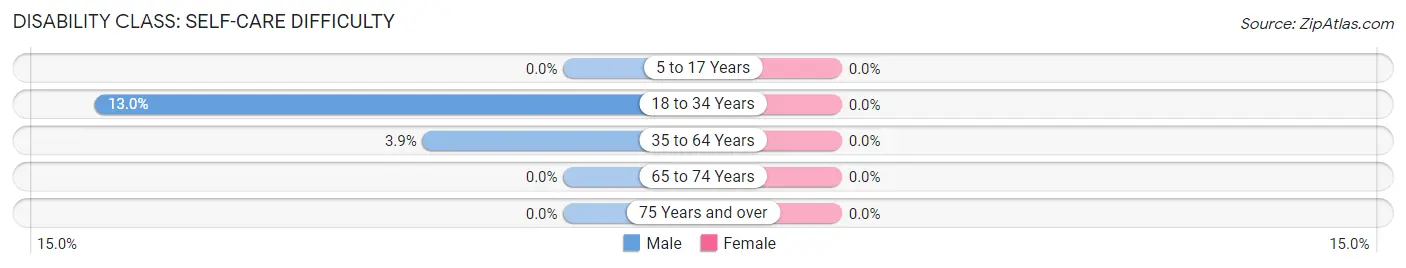
| Age Bracket | Male | Female |
| 5 to 17 Years | 0 (0.0%) | 0 (0.0%) |
| 18 to 34 Years | 3 (13.0%) | 0 (0.0%) |
| 35 to 64 Years | 2 (3.9%) | 0 (0.0%) |
| 65 to 74 Years | 0 (0.0%) | 0 (0.0%) |
| 75 Years and over | 0 (0.0%) | 0 (0.0%) |
Technology Access in Calhoun
Computing Device Access in Calhoun
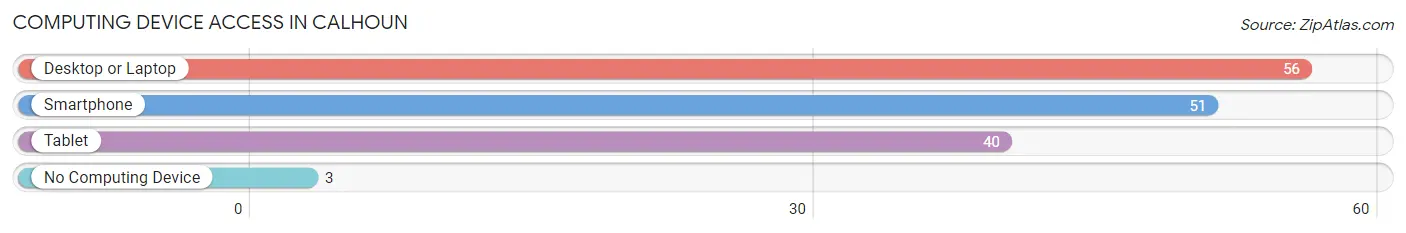
| Device Type | # Households | % Households |
| Desktop or Laptop | 56 | 83.6% |
| Smartphone | 51 | 76.1% |
| Tablet | 40 | 59.7% |
| No Computing Device | 3 | 4.5% |
| Total | 67 | 100.0% |
Internet Access in Calhoun
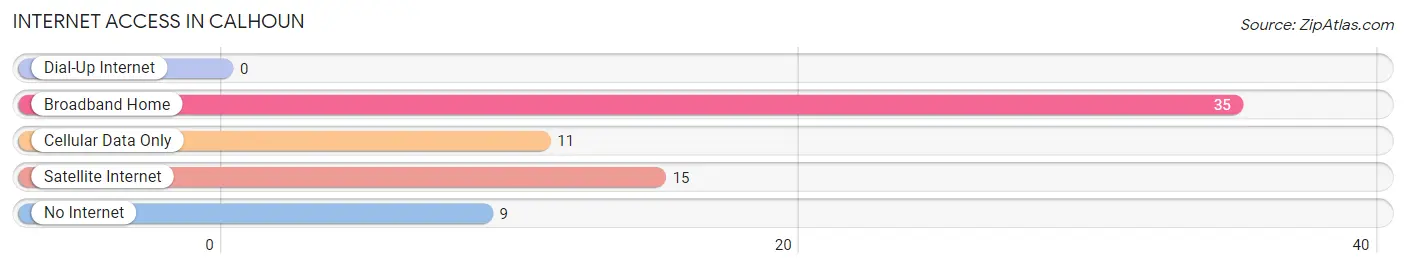
| Internet Type | # Households | % Households |
| Dial-Up Internet | 0 | 0.0% |
| Broadband Home | 35 | 52.2% |
| Cellular Data Only | 11 | 16.4% |
| Satellite Internet | 15 | 22.4% |
| No Internet | 9 | 13.4% |
| Total | 67 | 100.0% |
Calhoun Summary
Calhoun, Illinois is a small village located in Greene County, Illinois. It is situated on the banks of the Illinois River, approximately 25 miles south of Springfield. The village has a population of approximately 1,000 people and is part of the St. Louis metropolitan area.
History
Calhoun was founded in 1819 by a group of settlers from Kentucky. The village was named after John C. Calhoun, a prominent politician from the early 19th century. The village was originally a farming community, but it soon became a center for the timber industry. The timber industry was the main source of income for the village until the late 19th century, when the railroad arrived and the village began to develop into a small industrial center.
In the early 20th century, Calhoun was a thriving community with a variety of businesses, including a flour mill, a sawmill, a brickyard, and a furniture factory. The village also had a number of churches, schools, and other civic organizations.
Geography
Calhoun is located in the western part of Greene County, Illinois. It is situated on the banks of the Illinois River, approximately 25 miles south of Springfield. The village is surrounded by rolling hills and farmland. The climate in Calhoun is generally mild, with hot summers and cold winters.
Economy
Calhoun’s economy is largely based on agriculture and tourism. The village is home to a number of small businesses, including a grocery store, a hardware store, and a few restaurants. The village also has a number of small manufacturing companies, including a furniture factory and a brickyard.
Tourism is an important part of the local economy. The village is home to a number of historic sites, including the Calhoun County Courthouse, the Calhoun County Jail, and the Calhoun County Museum. The village also hosts a number of festivals and events throughout the year, including the Calhoun County Fair and the Calhoun County Music Festival.
Demographics
As of the 2010 census, the population of Calhoun was 1,000 people. The racial makeup of the village was 97.2% White, 0.7% African American, 0.3% Native American, 0.2% Asian, and 1.6% from other races. The median household income in Calhoun was $37,500, and the median family income was $45,000.
Calhoun is a small, rural village with a strong sense of community. The village is home to a number of civic organizations, including the Calhoun County Historical Society and the Calhoun County Chamber of Commerce. The village also has a number of churches, schools, and other community organizations.
Common Questions
What is Per Capita Income in Calhoun?
Per Capita income in Calhoun is $34,699.
What is the Median Family Income in Calhoun?
Median Family Income in Calhoun is $56,875.
What is the Median Household income in Calhoun?
Median Household Income in Calhoun is $67,083.
What is Income or Wage Gap in Calhoun?
Income or Wage Gap in Calhoun is 40.9%.
Women in Calhoun earn 59.1 cents for every dollar earned by a man.
What is Inequality or Gini Index in Calhoun?
Inequality or Gini Index in Calhoun is 0.36.
What is the Total Population of Calhoun?
Total Population of Calhoun is 170.
What is the Total Male Population of Calhoun?
Total Male Population of Calhoun is 90.
What is the Total Female Population of Calhoun?
Total Female Population of Calhoun is 80.
What is the Ratio of Males per 100 Females in Calhoun?
There are 112.50 Males per 100 Females in Calhoun.
What is the Ratio of Females per 100 Males in Calhoun?
There are 88.89 Females per 100 Males in Calhoun.
What is the Median Population Age in Calhoun?
Median Population Age in Calhoun is 40.0 Years.
What is the Average Family Size in Calhoun
Average Family Size in Calhoun is 2.7 People.
What is the Average Household Size in Calhoun
Average Household Size in Calhoun is 2.5 People.
How Large is the Labor Force in Calhoun?
There are 111 People in the Labor Forcein in Calhoun.
What is the Percentage of People in the Labor Force in Calhoun?
75.0% of People are in the Labor Force in Calhoun.
What is the Unemployment Rate in Calhoun?
Unemployment Rate in Calhoun is 12.6%.