Bridgeport, IL Map & Demographics
Bridgeport Map
Bridgeport Overview
$33,626
PER CAPITA INCOME
$49,861
AVG FAMILY INCOME
$47,778
AVG HOUSEHOLD INCOME
41.1%
WAGE / INCOME GAP [ % ]
58.9¢/ $1
WAGE / INCOME GAP [ $ ]
0.51
INEQUALITY / GINI INDEX
2,030
TOTAL POPULATION
1,083
MALE POPULATION
947
FEMALE POPULATION
114.36
MALES / 100 FEMALES
87.44
FEMALES / 100 MALES
38.8
MEDIAN AGE
3.2
AVG FAMILY SIZE
2.5
AVG HOUSEHOLD SIZE
914
LABOR FORCE [ PEOPLE ]
59.1%
PERCENT IN LABOR FORCE
9.1%
UNEMPLOYMENT RATE
Bridgeport Zip Codes
Bridgeport Area Codes
Income in Bridgeport
Income Overview in Bridgeport
Per Capita Income in Bridgeport is $33,626, while median incomes of families and households are $49,861 and $47,778 respectively.
| Characteristic | Number | Measure |
| Per Capita Income | 2,030 | $33,626 |
| Median Family Income | 489 | $49,861 |
| Mean Family Income | 489 | $102,487 |
| Median Household Income | 820 | $47,778 |
| Mean Household Income | 820 | $83,493 |
| Income Deficit | 489 | $0 |
| Wage / Income Gap (%) | 2,030 | 41.07% |
| Wage / Income Gap ($) | 2,030 | 58.93¢ per $1 |
| Gini / Inequality Index | 2,030 | 0.51 |
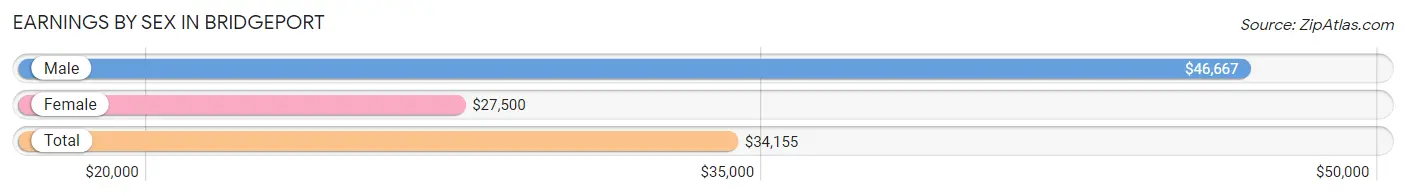
Earnings by Sex in Bridgeport
Average Earnings in Bridgeport are $34,155, $46,667 for men and $27,500 for women, a difference of 41.1%.
| Sex | Number | Average Earnings |
| Male | 550 (55.9%) | $46,667 |
| Female | 434 (44.1%) | $27,500 |
| Total | 984 (100.0%) | $34,155 |
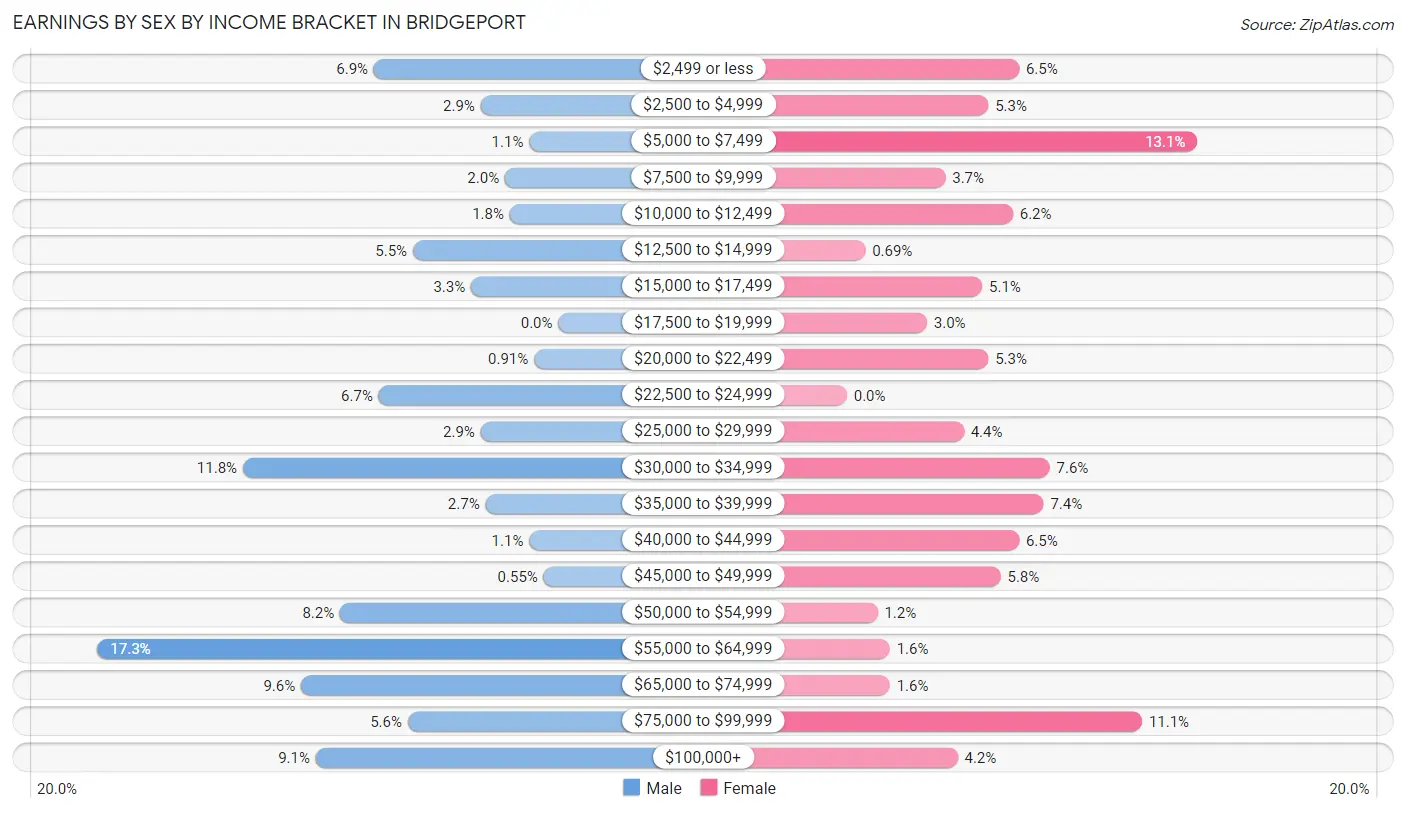
Earnings by Sex by Income Bracket in Bridgeport
The most common earnings brackets in Bridgeport are $55,000 to $64,999 for men (95 | 17.3%) and $5,000 to $7,499 for women (57 | 13.1%).
| Income | Male | Female |
| $2,499 or less | 38 (6.9%) | 28 (6.5%) |
| $2,500 to $4,999 | 16 (2.9%) | 23 (5.3%) |
| $5,000 to $7,499 | 6 (1.1%) | 57 (13.1%) |
| $7,500 to $9,999 | 11 (2.0%) | 16 (3.7%) |
| $10,000 to $12,499 | 10 (1.8%) | 27 (6.2%) |
| $12,500 to $14,999 | 30 (5.4%) | 3 (0.7%) |
| $15,000 to $17,499 | 18 (3.3%) | 22 (5.1%) |
| $17,500 to $19,999 | 0 (0.0%) | 13 (3.0%) |
| $20,000 to $22,499 | 5 (0.9%) | 23 (5.3%) |
| $22,500 to $24,999 | 37 (6.7%) | 0 (0.0%) |
| $25,000 to $29,999 | 16 (2.9%) | 19 (4.4%) |
| $30,000 to $34,999 | 65 (11.8%) | 33 (7.6%) |
| $35,000 to $39,999 | 15 (2.7%) | 32 (7.4%) |
| $40,000 to $44,999 | 6 (1.1%) | 28 (6.5%) |
| $45,000 to $49,999 | 3 (0.5%) | 25 (5.8%) |
| $50,000 to $54,999 | 45 (8.2%) | 5 (1.1%) |
| $55,000 to $64,999 | 95 (17.3%) | 7 (1.6%) |
| $65,000 to $74,999 | 53 (9.6%) | 7 (1.6%) |
| $75,000 to $99,999 | 31 (5.6%) | 48 (11.1%) |
| $100,000+ | 50 (9.1%) | 18 (4.2%) |
| Total | 550 (100.0%) | 434 (100.0%) |
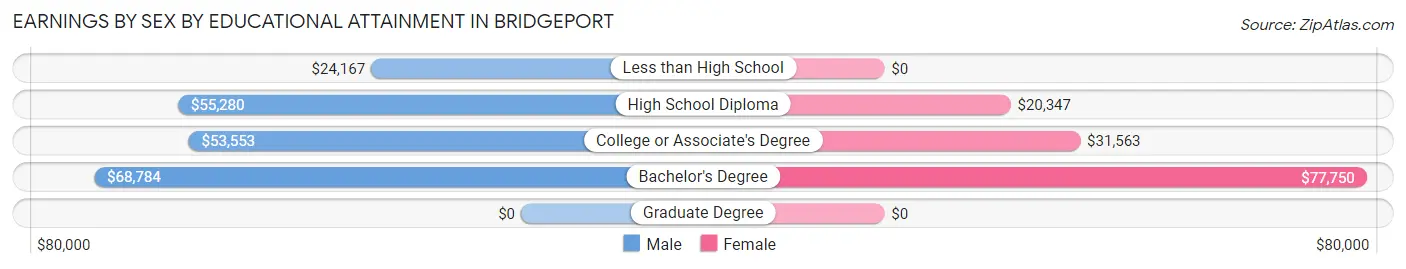
Earnings by Sex by Educational Attainment in Bridgeport
Average earnings in Bridgeport are $55,093 for men and $32,143 for women, a difference of 41.7%. Men with an educational attainment of bachelor's degree enjoy the highest average annual earnings of $68,784, while those with less than high school education earn the least with $24,167. Women with an educational attainment of bachelor's degree earn the most with the average annual earnings of $77,750, while those with high school diploma education have the smallest earnings of $20,347.
| Educational Attainment | Male Income | Female Income |
| Less than High School | $24,167 | $0 |
| High School Diploma | $55,280 | $20,347 |
| College or Associate's Degree | $53,553 | $31,563 |
| Bachelor's Degree | $68,784 | $77,750 |
| Graduate Degree | - | - |
| Total | $55,093 | $32,143 |
Family Income in Bridgeport
Family Income Brackets in Bridgeport
According to the Bridgeport family income data, there are 96 families falling into the $35,000 to $49,999 income range, which is the most common income bracket and makes up 19.6% of all families. Conversely, the $10,000 to $14,999 income bracket is the least frequent group with only 12 families (2.5%) belonging to this category.
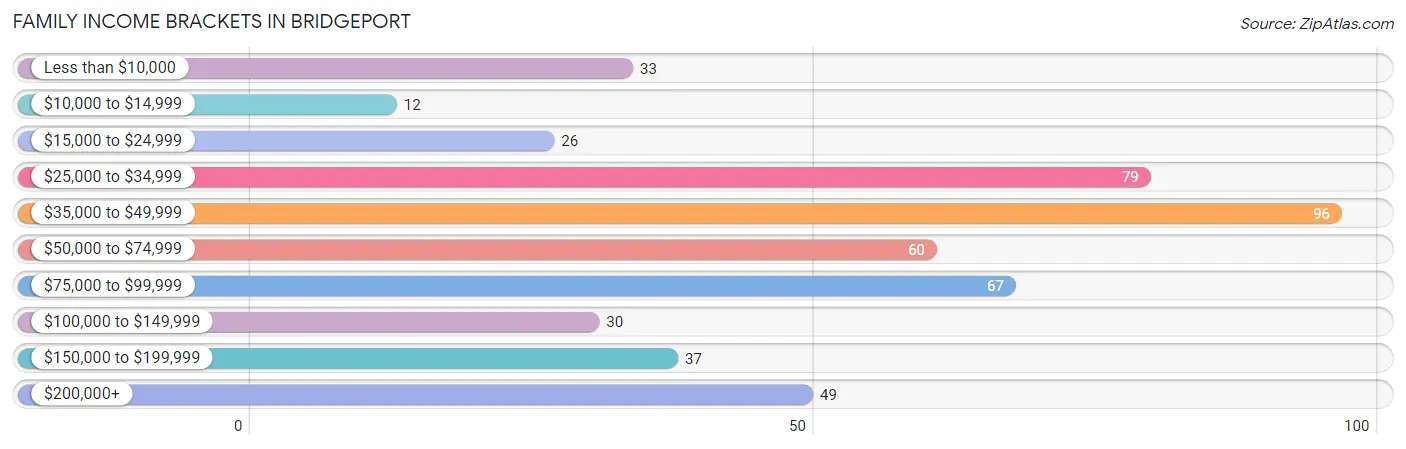
| Income Bracket | # Families | % Families |
| Less than $10,000 | 33 | 6.7% |
| $10,000 to $14,999 | 12 | 2.5% |
| $15,000 to $24,999 | 26 | 5.3% |
| $25,000 to $34,999 | 79 | 16.2% |
| $35,000 to $49,999 | 96 | 19.6% |
| $50,000 to $74,999 | 60 | 12.3% |
| $75,000 to $99,999 | 67 | 13.7% |
| $100,000 to $149,999 | 30 | 6.1% |
| $150,000 to $199,999 | 37 | 7.6% |
| $200,000+ | 49 | 10.0% |
Family Income by Famaliy Size in Bridgeport
5-person families (55 | 11.3%) account for the highest median family income in Bridgeport with $157,782 per family, while 5-person families (55 | 11.3%) have the highest median income of $31,556 per family member.
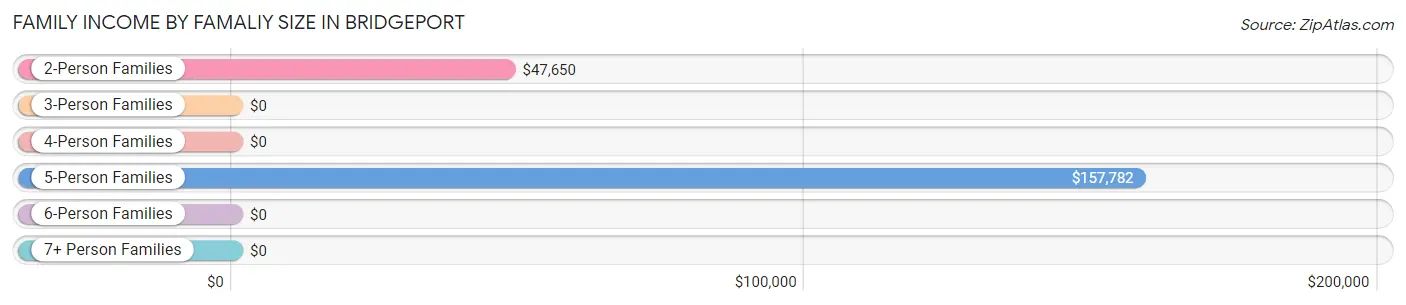
| Income Bracket | # Families | Median Income |
| 2-Person Families | 287 (58.7%) | $47,650 |
| 3-Person Families | 64 (13.1%) | $0 |
| 4-Person Families | 57 (11.7%) | $0 |
| 5-Person Families | 55 (11.3%) | $157,782 |
| 6-Person Families | 10 (2.0%) | $0 |
| 7+ Person Families | 16 (3.3%) | $0 |
| Total | 489 (100.0%) | $49,861 |
Family Income by Number of Earners in Bridgeport
The median family income in Bridgeport is $49,861, with families comprising 3+ earners (51) having the highest median family income of $158,750, while families with 1 earner (212) have the lowest median family income of $36,750, accounting for 10.4% and 43.3% of families, respectively.
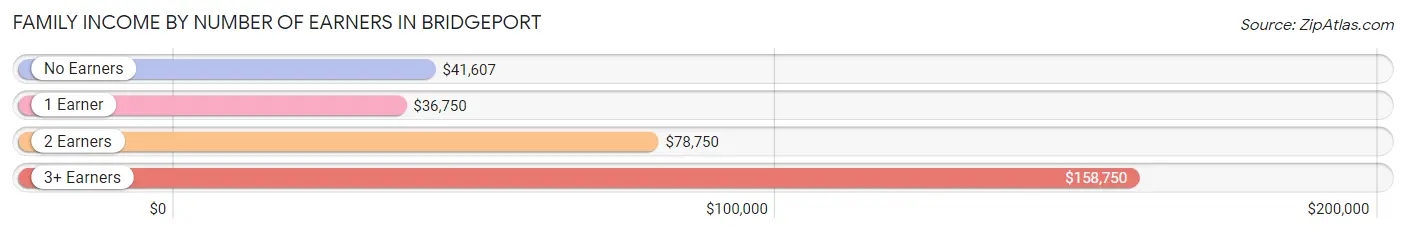
| Number of Earners | # Families | Median Income |
| No Earners | 65 (13.3%) | $41,607 |
| 1 Earner | 212 (43.3%) | $36,750 |
| 2 Earners | 161 (32.9%) | $78,750 |
| 3+ Earners | 51 (10.4%) | $158,750 |
| Total | 489 (100.0%) | $49,861 |
Household Income in Bridgeport
Household Income Brackets in Bridgeport
With 176 households falling in the category, the $35,000 to $49,999 income range is the most frequent in Bridgeport, accounting for 21.5% of all households. In contrast, only 27 households (3.3%) fall into the less than $10,000 income bracket, making it the least populous group.
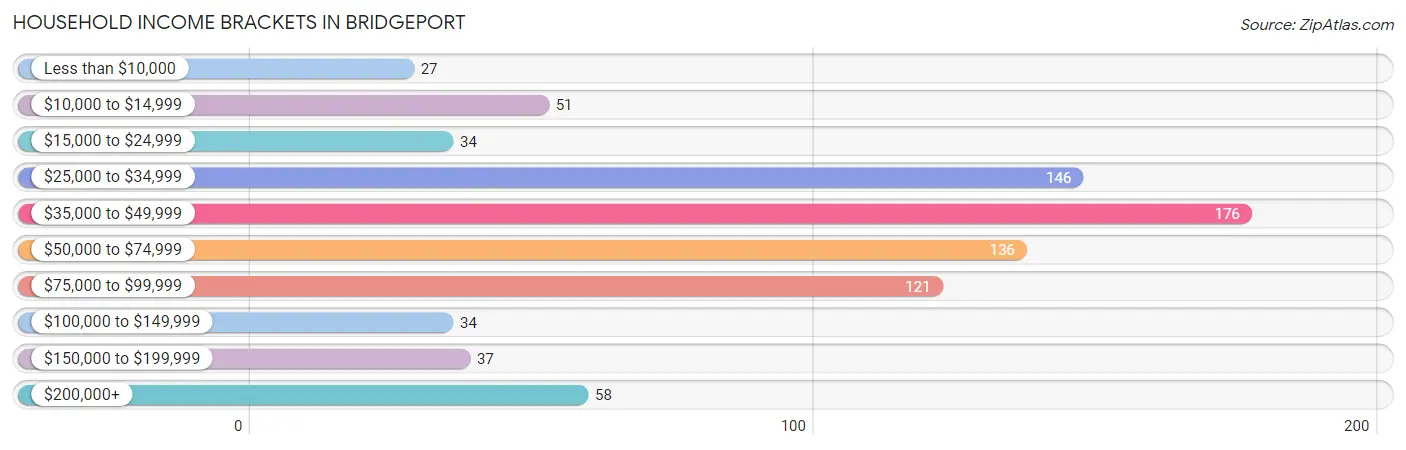
| Income Bracket | # Households | % Households |
| Less than $10,000 | 27 | 3.3% |
| $10,000 to $14,999 | 51 | 6.2% |
| $15,000 to $24,999 | 34 | 4.1% |
| $25,000 to $34,999 | 146 | 17.8% |
| $35,000 to $49,999 | 176 | 21.5% |
| $50,000 to $74,999 | 136 | 16.6% |
| $75,000 to $99,999 | 121 | 14.8% |
| $100,000 to $149,999 | 34 | 4.1% |
| $150,000 to $199,999 | 37 | 4.5% |
| $200,000+ | 58 | 7.1% |
Household Income by Householder Age in Bridgeport
The median household income in Bridgeport is $47,778, with the highest median household income of $63,250 found in the 45 to 64 years age bracket for the primary householder. A total of 379 households (46.2%) fall into this category. Meanwhile, the 15 to 24 years age bracket for the primary householder has the lowest median household income of $0, with 75 households (9.1%) in this group.
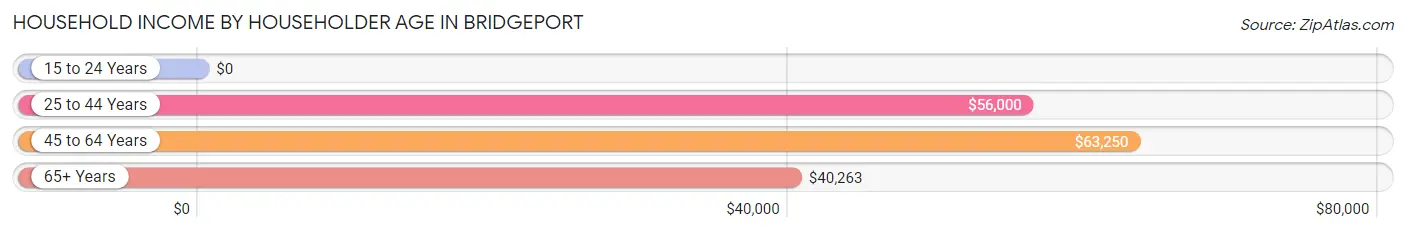
| Income Bracket | # Households | Median Income |
| 15 to 24 Years | 75 (9.1%) | $0 |
| 25 to 44 Years | 186 (22.7%) | $56,000 |
| 45 to 64 Years | 379 (46.2%) | $63,250 |
| 65+ Years | 180 (22.0%) | $40,263 |
| Total | 820 (100.0%) | $47,778 |
Poverty in Bridgeport
Income Below Poverty by Sex and Age in Bridgeport
With 15.4% poverty level for males and 23.9% for females among the residents of Bridgeport, under 5 year old males and 18 to 24 year old females are the most vulnerable to poverty, with 47 males (72.3%) and 39 females (50.6%) in their respective age groups living below the poverty level.
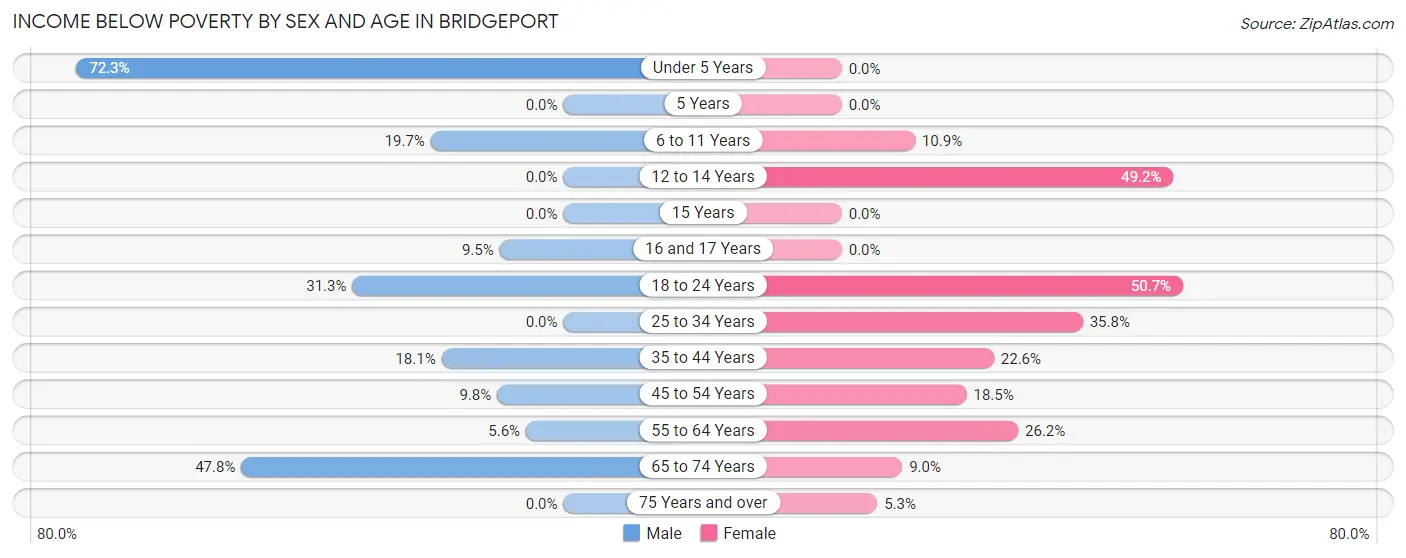
| Age Bracket | Male | Female |
| Under 5 Years | 47 (72.3%) | 0 (0.0%) |
| 5 Years | 0 (0.0%) | 0 (0.0%) |
| 6 to 11 Years | 13 (19.7%) | 10 (10.9%) |
| 12 to 14 Years | 0 (0.0%) | 32 (49.2%) |
| 15 Years | 0 (0.0%) | 0 (0.0%) |
| 16 and 17 Years | 9 (9.5%) | 0 (0.0%) |
| 18 to 24 Years | 21 (31.3%) | 39 (50.6%) |
| 25 to 34 Years | 0 (0.0%) | 39 (35.8%) |
| 35 to 44 Years | 19 (18.1%) | 21 (22.6%) |
| 45 to 54 Years | 19 (9.8%) | 25 (18.5%) |
| 55 to 64 Years | 6 (5.6%) | 50 (26.2%) |
| 65 to 74 Years | 33 (47.8%) | 7 (9.0%) |
| 75 Years and over | 0 (0.0%) | 3 (5.3%) |
| Total | 167 (15.4%) | 226 (23.9%) |
Income Above Poverty by Sex and Age in Bridgeport
According to the poverty statistics in Bridgeport, males aged 5 years and females aged under 5 years are the age groups that are most secure financially, with 100.0% of males and 100.0% of females in these age groups living above the poverty line.
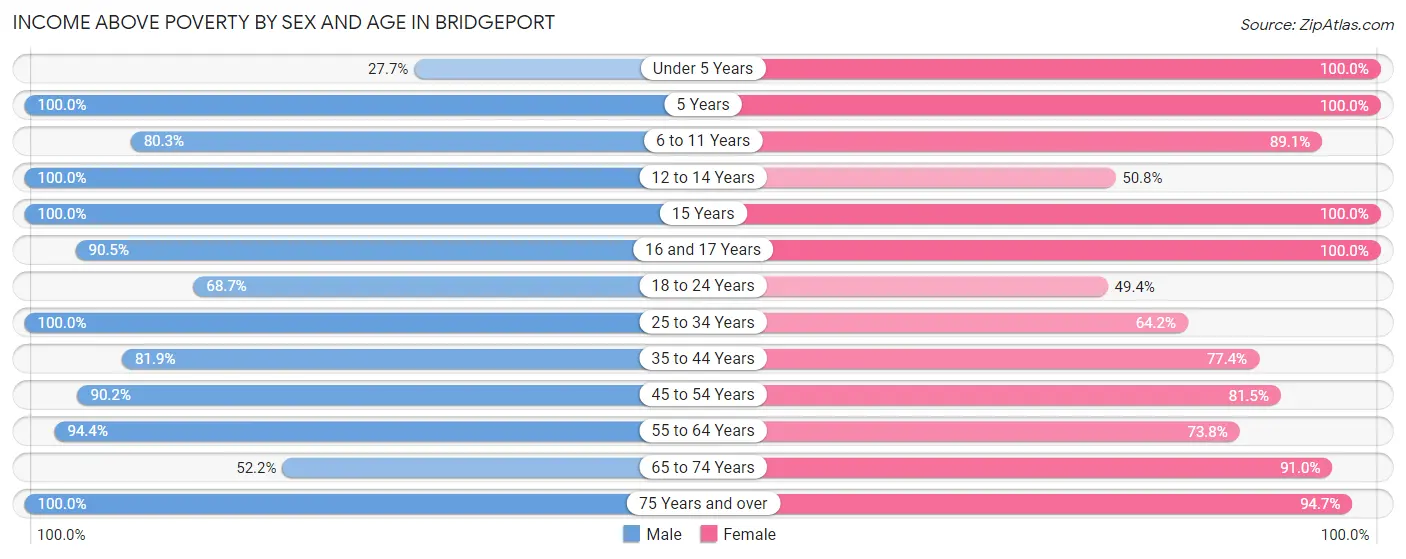
| Age Bracket | Male | Female |
| Under 5 Years | 18 (27.7%) | 27 (100.0%) |
| 5 Years | 41 (100.0%) | 11 (100.0%) |
| 6 to 11 Years | 53 (80.3%) | 82 (89.1%) |
| 12 to 14 Years | 105 (100.0%) | 33 (50.8%) |
| 15 Years | 2 (100.0%) | 10 (100.0%) |
| 16 and 17 Years | 86 (90.5%) | 2 (100.0%) |
| 18 to 24 Years | 46 (68.7%) | 38 (49.3%) |
| 25 to 34 Years | 121 (100.0%) | 70 (64.2%) |
| 35 to 44 Years | 86 (81.9%) | 72 (77.4%) |
| 45 to 54 Years | 174 (90.2%) | 110 (81.5%) |
| 55 to 64 Years | 102 (94.4%) | 141 (73.8%) |
| 65 to 74 Years | 36 (52.2%) | 71 (91.0%) |
| 75 Years and over | 46 (100.0%) | 54 (94.7%) |
| Total | 916 (84.6%) | 721 (76.1%) |
Income Below Poverty Among Married-Couple Families in Bridgeport
The poverty statistics for married-couple families in Bridgeport show that 10.4% or 31 of the total 298 families live below the poverty line. Families with 5 or more children have the highest poverty rate of 81.2%, comprising of 13 families. On the other hand, families with no children have the lowest poverty rate of 0.0%, which includes 0 families.
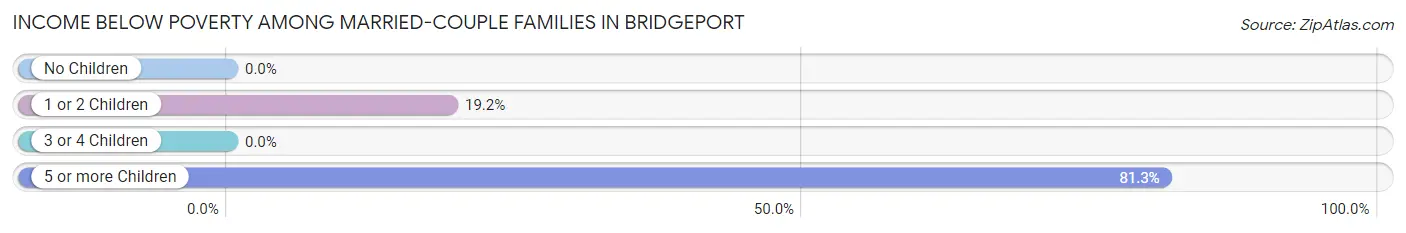
| Children | Above Poverty | Below Poverty |
| No Children | 131 (100.0%) | 0 (0.0%) |
| 1 or 2 Children | 76 (80.8%) | 18 (19.2%) |
| 3 or 4 Children | 57 (100.0%) | 0 (0.0%) |
| 5 or more Children | 3 (18.8%) | 13 (81.2%) |
| Total | 267 (89.6%) | 31 (10.4%) |
Income Below Poverty Among Single-Parent Households in Bridgeport
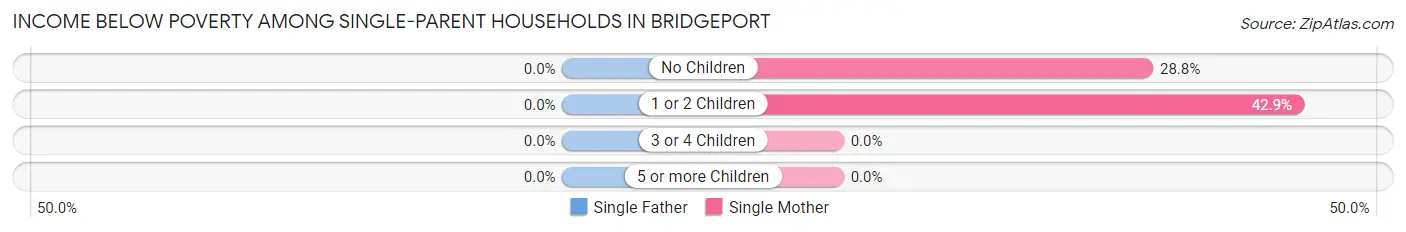
| Children | Single Father | Single Mother |
| No Children | 0 (0.0%) | 17 (28.8%) |
| 1 or 2 Children | 0 (0.0%) | 33 (42.9%) |
| 3 or 4 Children | 0 (0.0%) | 0 (0.0%) |
| 5 or more Children | 0 (0.0%) | 0 (0.0%) |
| Total | 0 (0.0%) | 50 (34.7%) |
Income Below Poverty Among Married-Couple vs Single-Parent Households in Bridgeport
The poverty data for Bridgeport shows that 31 of the married-couple family households (10.4%) and 50 of the single-parent households (26.2%) are living below the poverty level. Within the married-couple family households, those with 5 or more children have the highest poverty rate, with 13 households (81.2%) falling below the poverty line. Among the single-parent households, those with 1 or 2 children have the highest poverty rate, with 33 household (31.1%) living below poverty.
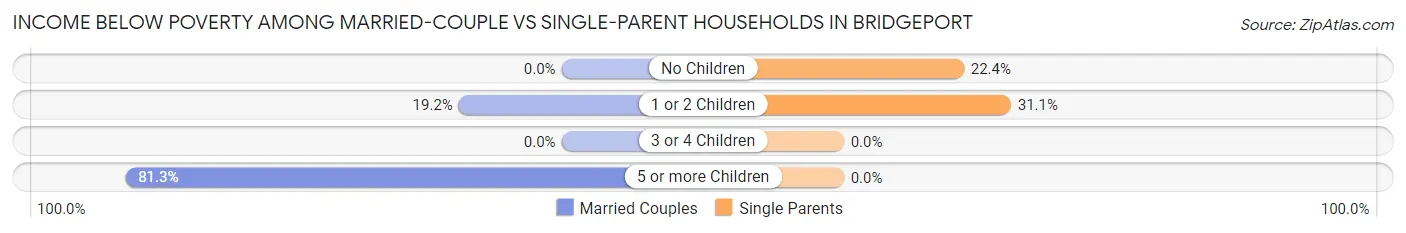
| Children | Married-Couple Families | Single-Parent Households |
| No Children | 0 (0.0%) | 17 (22.4%) |
| 1 or 2 Children | 18 (19.2%) | 33 (31.1%) |
| 3 or 4 Children | 0 (0.0%) | 0 (0.0%) |
| 5 or more Children | 13 (81.2%) | 0 (0.0%) |
| Total | 31 (10.4%) | 50 (26.2%) |
Race in Bridgeport
The most populous races in Bridgeport are White / Caucasian (1,892 | 93.2%), Black / African American (118 | 5.8%), and Two or more Races (20 | 1.0%).
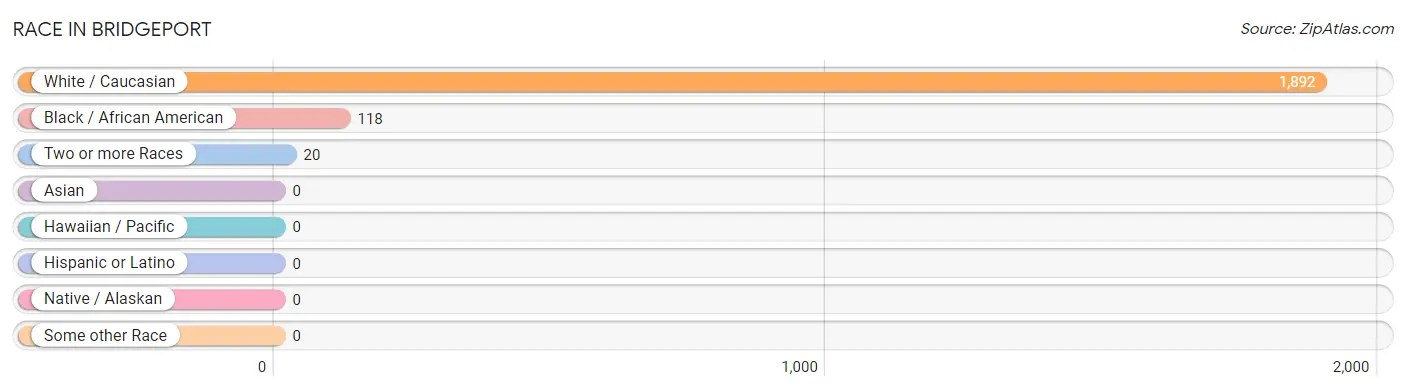
| Race | # Population | % Population |
| Asian | 0 | 0.0% |
| Black / African American | 118 | 5.8% |
| Hawaiian / Pacific | 0 | 0.0% |
| Hispanic or Latino | 0 | 0.0% |
| Native / Alaskan | 0 | 0.0% |
| White / Caucasian | 1,892 | 93.2% |
| Two or more Races | 20 | 1.0% |
| Some other Race | 0 | 0.0% |
| Total | 2,030 | 100.0% |
Ancestry in Bridgeport
The most populous ancestries reported in Bridgeport are German (397 | 19.6%), English (306 | 15.1%), Irish (208 | 10.2%), American (131 | 6.5%), and French (119 | 5.9%), together accounting for 57.2% of all Bridgeport residents.
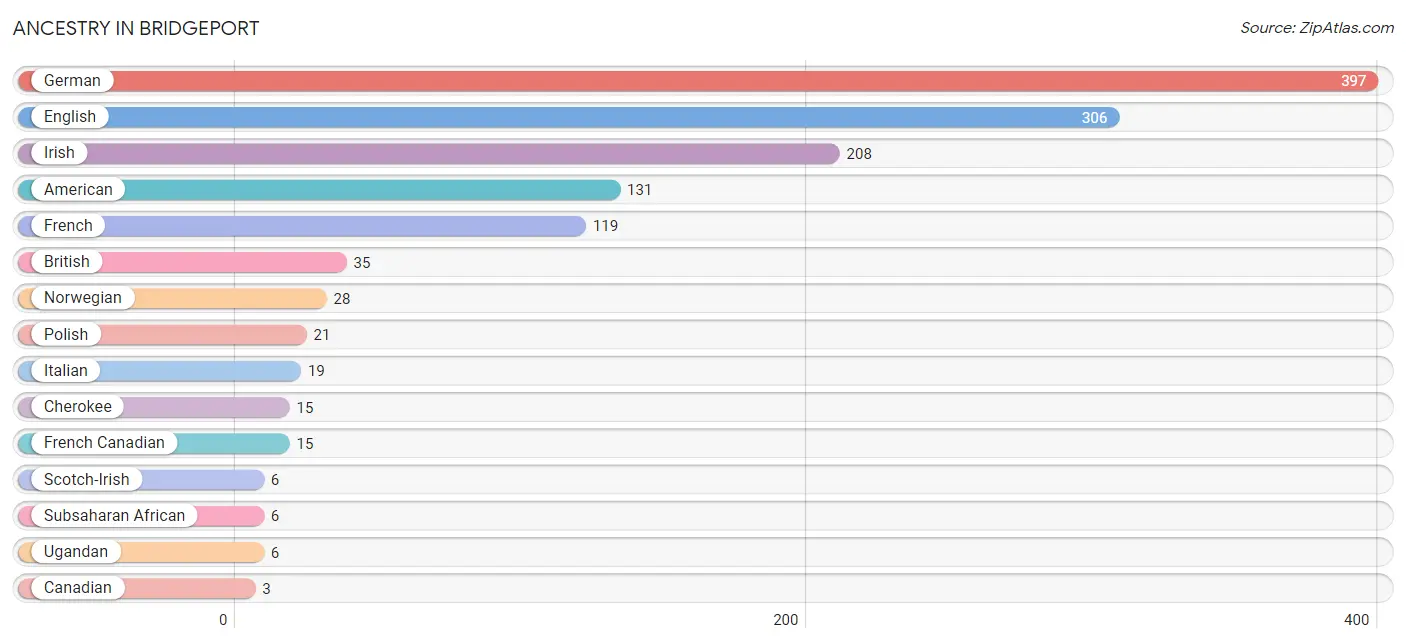
| Ancestry | # Population | % Population |
| American | 131 | 6.5% |
| British | 35 | 1.7% |
| Canadian | 3 | 0.2% |
| Cherokee | 15 | 0.7% |
| English | 306 | 15.1% |
| French | 119 | 5.9% |
| French Canadian | 15 | 0.7% |
| German | 397 | 19.6% |
| Irish | 208 | 10.2% |
| Italian | 19 | 0.9% |
| Norwegian | 28 | 1.4% |
| Polish | 21 | 1.0% |
| Scotch-Irish | 6 | 0.3% |
| Scottish | 3 | 0.2% |
| Subsaharan African | 6 | 0.3% |
| Swiss | 3 | 0.2% |
| Ugandan | 6 | 0.3% | View All 17 Rows |
Immigrants in Bridgeport
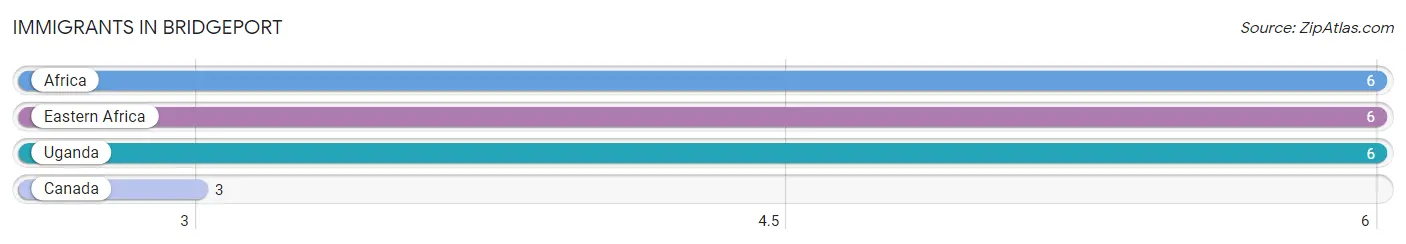
The most numerous immigrant groups reported in Bridgeport came from Africa (6 | 0.3%), Eastern Africa (6 | 0.3%), Uganda (6 | 0.3%), and Canada (3 | 0.2%), together accounting for 1.1% of all Bridgeport residents.
| Immigration Origin | # Population | % Population |
| Africa | 6 | 0.3% |
| Canada | 3 | 0.2% |
| Eastern Africa | 6 | 0.3% |
| Uganda | 6 | 0.3% | View All 4 Rows |
Sex and Age in Bridgeport
Sex and Age in Bridgeport
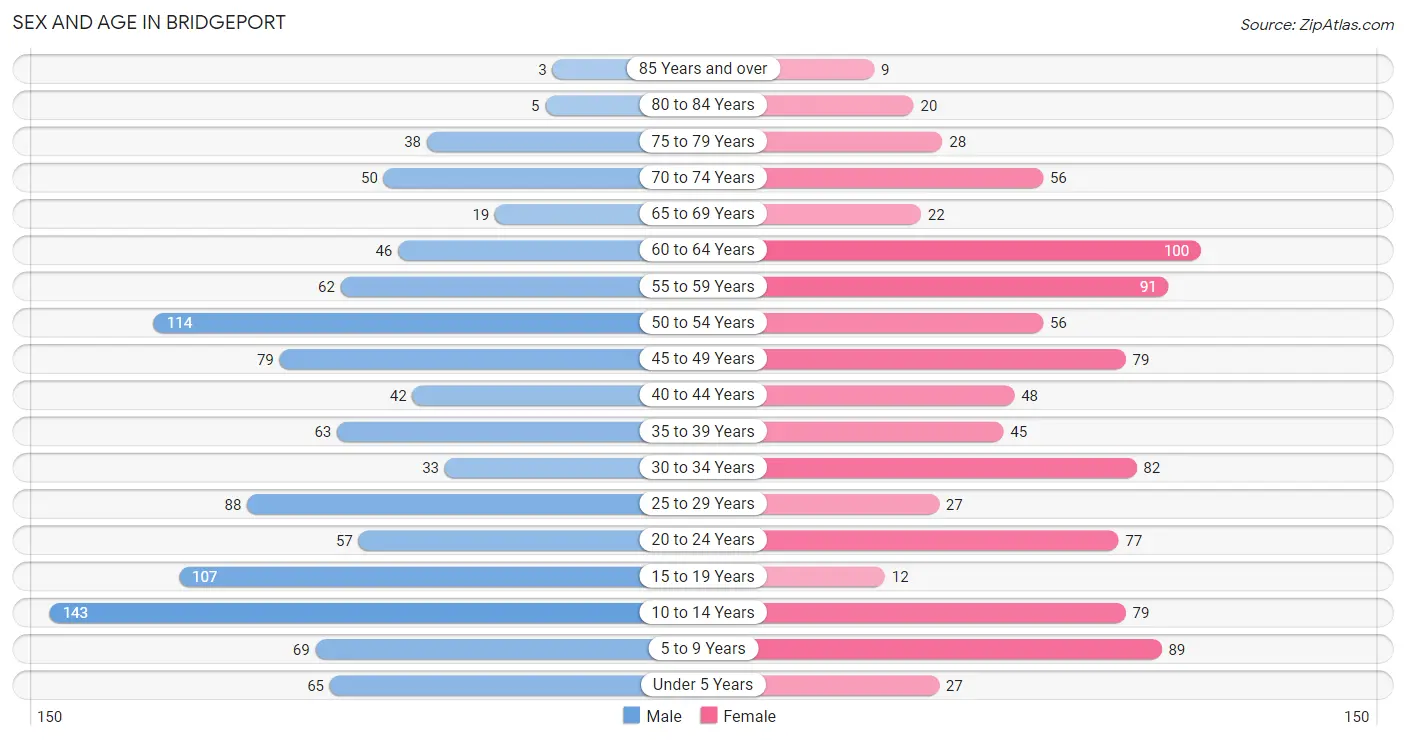
The most populous age groups in Bridgeport are 10 to 14 Years (143 | 13.2%) for men and 60 to 64 Years (100 | 10.6%) for women.
| Age Bracket | Male | Female |
| Under 5 Years | 65 (6.0%) | 27 (2.9%) |
| 5 to 9 Years | 69 (6.4%) | 89 (9.4%) |
| 10 to 14 Years | 143 (13.2%) | 79 (8.3%) |
| 15 to 19 Years | 107 (9.9%) | 12 (1.3%) |
| 20 to 24 Years | 57 (5.3%) | 77 (8.1%) |
| 25 to 29 Years | 88 (8.1%) | 27 (2.9%) |
| 30 to 34 Years | 33 (3.0%) | 82 (8.7%) |
| 35 to 39 Years | 63 (5.8%) | 45 (4.8%) |
| 40 to 44 Years | 42 (3.9%) | 48 (5.1%) |
| 45 to 49 Years | 79 (7.3%) | 79 (8.3%) |
| 50 to 54 Years | 114 (10.5%) | 56 (5.9%) |
| 55 to 59 Years | 62 (5.7%) | 91 (9.6%) |
| 60 to 64 Years | 46 (4.3%) | 100 (10.6%) |
| 65 to 69 Years | 19 (1.8%) | 22 (2.3%) |
| 70 to 74 Years | 50 (4.6%) | 56 (5.9%) |
| 75 to 79 Years | 38 (3.5%) | 28 (3.0%) |
| 80 to 84 Years | 5 (0.5%) | 20 (2.1%) |
| 85 Years and over | 3 (0.3%) | 9 (0.9%) |
| Total | 1,083 (100.0%) | 947 (100.0%) |
Families and Households in Bridgeport
Median Family Size in Bridgeport
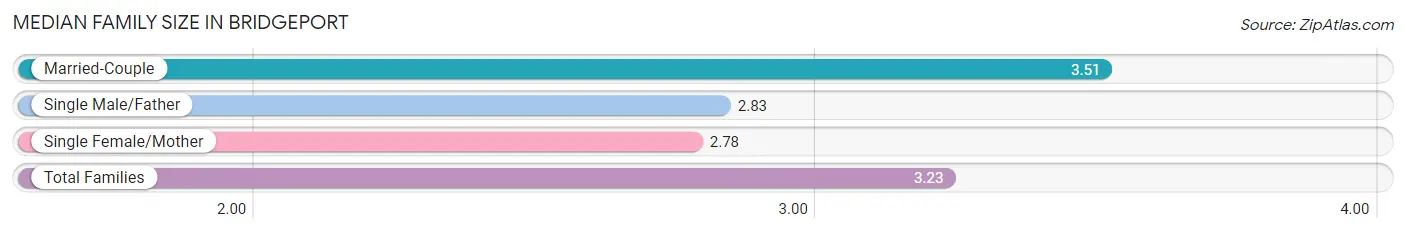
The median family size in Bridgeport is 3.23 persons per family, with married-couple families (298 | 60.9%) accounting for the largest median family size of 3.51 persons per family. On the other hand, single female/mother families (144 | 29.4%) represent the smallest median family size with 2.78 persons per family.
| Family Type | # Families | Family Size |
| Married-Couple | 298 (60.9%) | 3.51 |
| Single Male/Father | 47 (9.6%) | 2.83 |
| Single Female/Mother | 144 (29.4%) | 2.78 |
| Total Families | 489 (100.0%) | 3.23 |
Median Household Size in Bridgeport
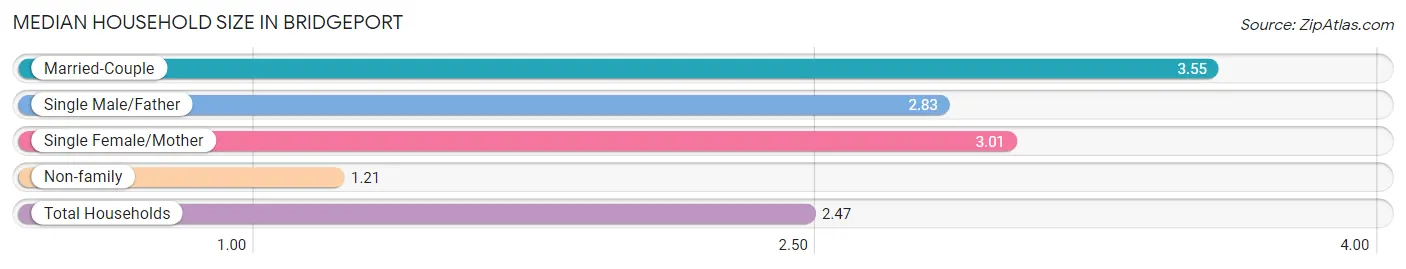
The median household size in Bridgeport is 2.47 persons per household, with married-couple households (298 | 36.3%) accounting for the largest median household size of 3.55 persons per household. non-family households (331 | 40.4%) represent the smallest median household size with 1.21 persons per household.
| Household Type | # Households | Household Size |
| Married-Couple | 298 (36.3%) | 3.55 |
| Single Male/Father | 47 (5.7%) | 2.83 |
| Single Female/Mother | 144 (17.6%) | 3.01 |
| Non-family | 331 (40.4%) | 1.21 |
| Total Households | 820 (100.0%) | 2.47 |
Household Size by Marriage Status in Bridgeport
Out of a total of 820 households in Bridgeport, 489 (59.6%) are family households, while 331 (40.4%) are nonfamily households. The most numerous type of family households are 2-person households, comprising 263, and the most common type of nonfamily households are 1-person households, comprising 207.
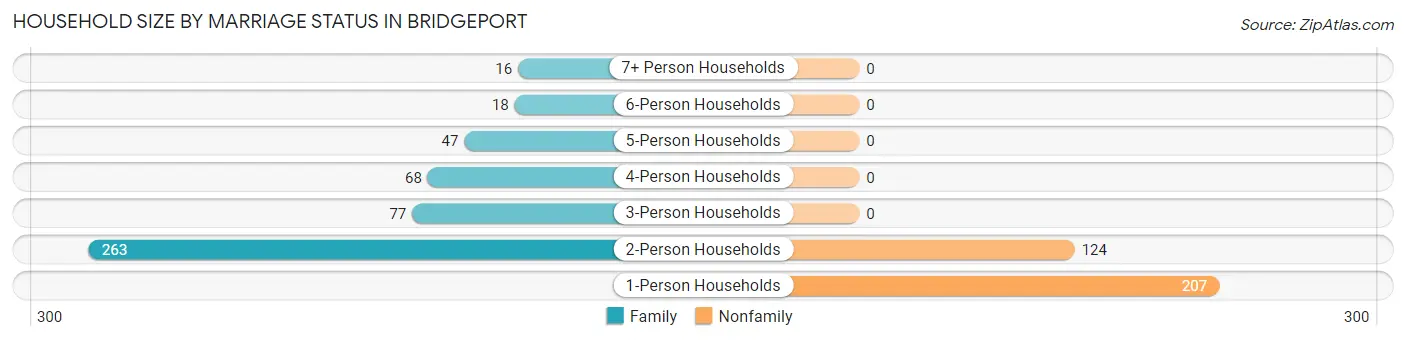
| Household Size | Family Households | Nonfamily Households |
| 1-Person Households | - | 207 (25.2%) |
| 2-Person Households | 263 (32.1%) | 124 (15.1%) |
| 3-Person Households | 77 (9.4%) | 0 (0.0%) |
| 4-Person Households | 68 (8.3%) | 0 (0.0%) |
| 5-Person Households | 47 (5.7%) | 0 (0.0%) |
| 6-Person Households | 18 (2.2%) | 0 (0.0%) |
| 7+ Person Households | 16 (1.9%) | 0 (0.0%) |
| Total | 489 (59.6%) | 331 (40.4%) |
Female Fertility in Bridgeport
Fertility by Age in Bridgeport
Average fertility rate in Bridgeport is 64.0 births per 1,000 women. Women in the age bracket of 20 to 34 years have the highest fertility rate with 129.0 births per 1,000 women. Women in the age bracket of 20 to 34 years acount for 100.0% of all women with births.
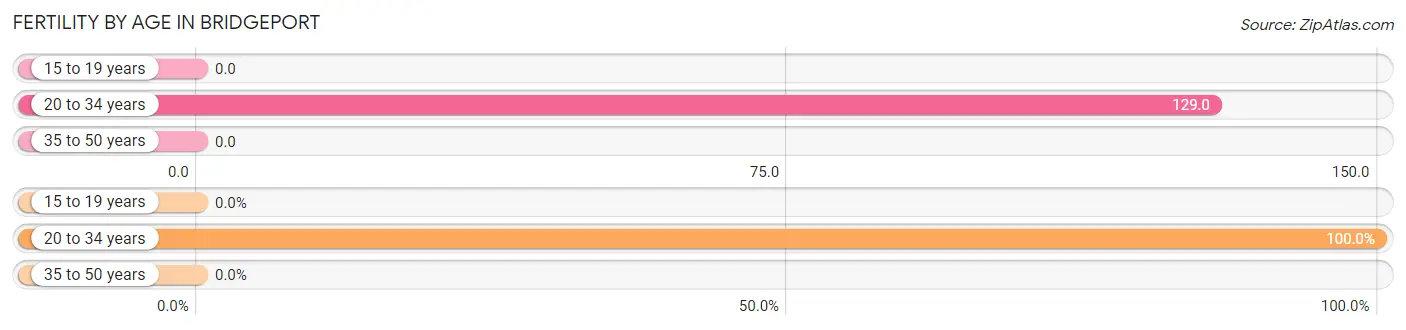
| Age Bracket | Women with Births | Births / 1,000 Women |
| 15 to 19 years | 0 (0.0%) | 0.0 |
| 20 to 34 years | 24 (100.0%) | 129.0 |
| 35 to 50 years | 0 (0.0%) | 0.0 |
| Total | 24 (100.0%) | 64.0 |
Fertility by Age by Marriage Status in Bridgeport
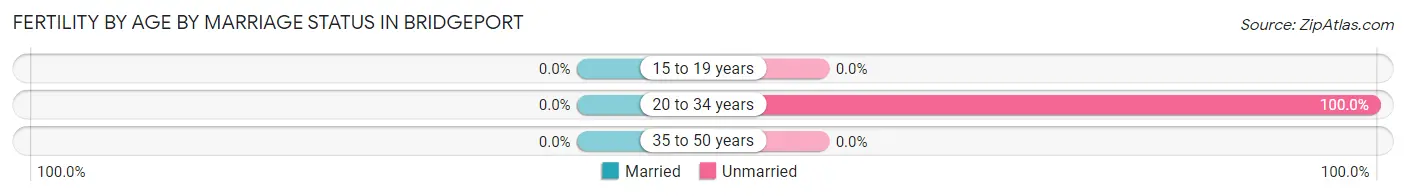
| Age Bracket | Married | Unmarried |
| 15 to 19 years | 0 (0.0%) | 0 (0.0%) |
| 20 to 34 years | 0 (0.0%) | 24 (100.0%) |
| 35 to 50 years | 0 (0.0%) | 0 (0.0%) |
| Total | 0 (0.0%) | 24 (100.0%) |
Fertility by Education in Bridgeport
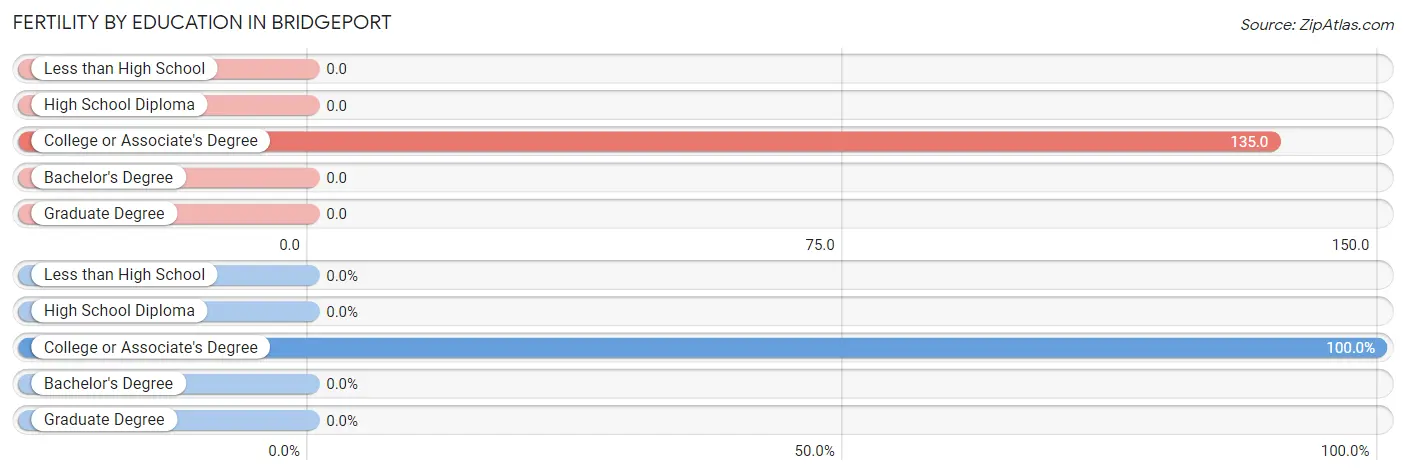
| Educational Attainment | Women with Births | Births / 1,000 Women |
| Less than High School | 0 (0.0%) | 0.0 |
| High School Diploma | 0 (0.0%) | 0.0 |
| College or Associate's Degree | 24 (100.0%) | 135.0 |
| Bachelor's Degree | 0 (0.0%) | 0.0 |
| Graduate Degree | 0 (0.0%) | 0.0 |
| Total | 24 (100.0%) | 64.0 |
Fertility by Education by Marriage Status in Bridgeport
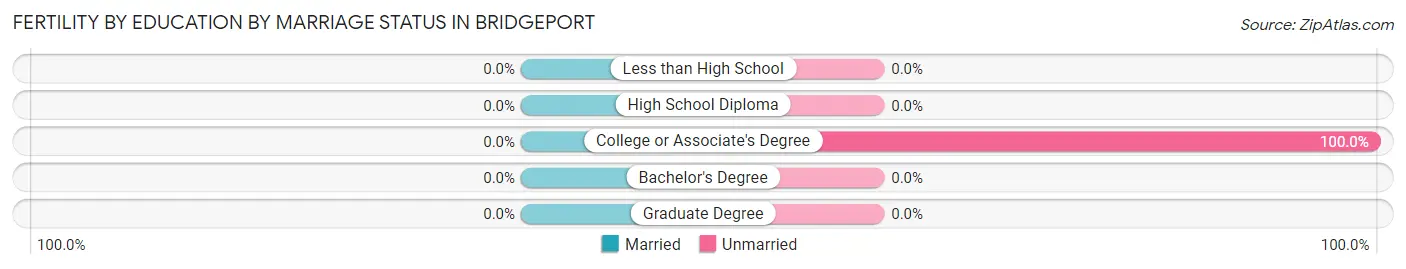
| Educational Attainment | Married | Unmarried |
| Less than High School | 0 (0.0%) | 0 (0.0%) |
| High School Diploma | 0 (0.0%) | 0 (0.0%) |
| College or Associate's Degree | 0 (0.0%) | 24 (100.0%) |
| Bachelor's Degree | 0 (0.0%) | 0 (0.0%) |
| Graduate Degree | 0 (0.0%) | 0 (0.0%) |
| Total | 0 (0.0%) | 24 (100.0%) |
Employment Characteristics in Bridgeport
Employment by Class of Employer in Bridgeport
Among the 829 employed individuals in Bridgeport, private company employees (680 | 82.0%), not-for-profit organizations (40 | 4.8%), and local government employees (38 | 4.6%) make up the most common classes of employment.
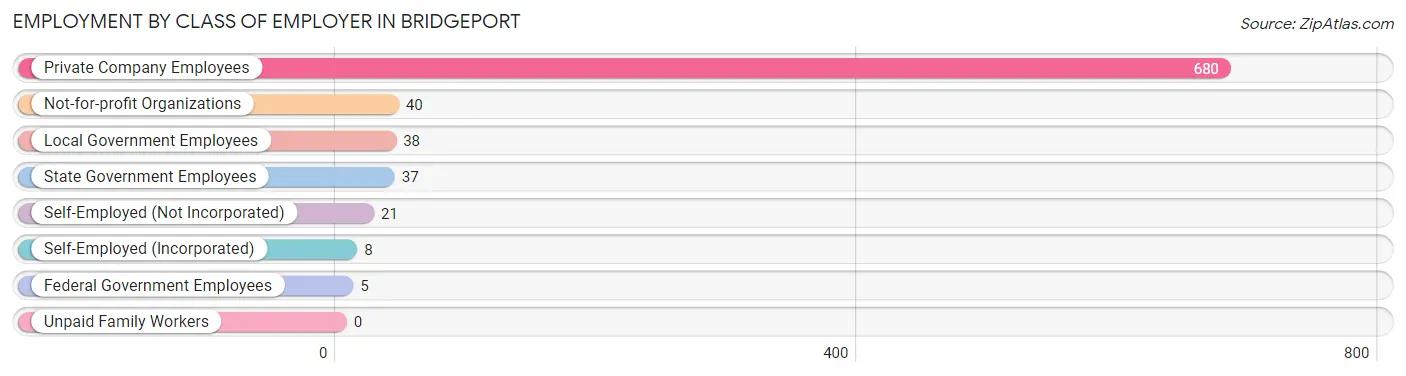
| Employer Class | # Employees | % Employees |
| Private Company Employees | 680 | 82.0% |
| Self-Employed (Incorporated) | 8 | 1.0% |
| Self-Employed (Not Incorporated) | 21 | 2.5% |
| Not-for-profit Organizations | 40 | 4.8% |
| Local Government Employees | 38 | 4.6% |
| State Government Employees | 37 | 4.5% |
| Federal Government Employees | 5 | 0.6% |
| Unpaid Family Workers | 0 | 0.0% |
| Total | 829 | 100.0% |
Employment Status by Age in Bridgeport
According to the labor force statistics for Bridgeport, out of the total population over 16 years of age (1,546), 59.1% or 914 individuals are in the labor force, with 9.1% or 83 of them unemployed. The age group with the highest labor force participation rate is 25 to 29 years, with 93.0% or 107 individuals in the labor force. Within the labor force, the 16 to 19 years age range has the highest percentage of unemployed individuals, with 88.0% or 22 of them being unemployed.
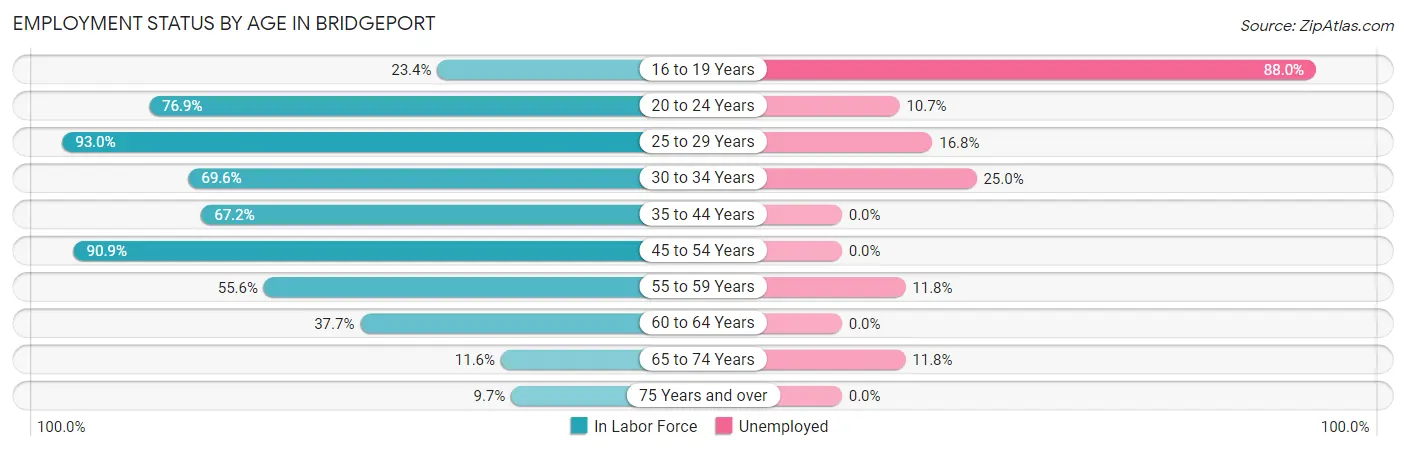
| Age Bracket | In Labor Force | Unemployed |
| 16 to 19 Years | 25 (23.4%) | 22 (88.0%) |
| 20 to 24 Years | 103 (76.9%) | 11 (10.7%) |
| 25 to 29 Years | 107 (93.0%) | 18 (16.8%) |
| 30 to 34 Years | 80 (69.6%) | 20 (25.0%) |
| 35 to 44 Years | 133 (67.2%) | 0 (0.0%) |
| 45 to 54 Years | 298 (90.9%) | 0 (0.0%) |
| 55 to 59 Years | 85 (55.6%) | 10 (11.8%) |
| 60 to 64 Years | 55 (37.7%) | 0 (0.0%) |
| 65 to 74 Years | 17 (11.6%) | 2 (11.8%) |
| 75 Years and over | 10 (9.7%) | 0 (0.0%) |
| Total | 914 (59.1%) | 83 (9.1%) |
Employment Status by Educational Attainment in Bridgeport
According to labor force statistics for Bridgeport, 71.8% of individuals (757) out of the total population between 25 and 64 years of age (1,055) are in the labor force, with 6.3% or 48 of them being unemployed. The group with the highest labor force participation rate are those with the educational attainment of bachelor's degree or higher, with 97.5% or 117 individuals in the labor force. Within the labor force, individuals with less than high school education have the highest percentage of unemployment, with 38.5% or 10 of them being unemployed.
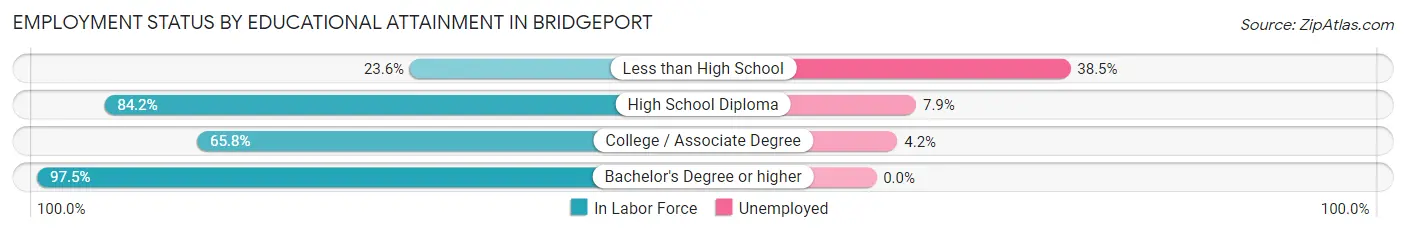
| Educational Attainment | In Labor Force | Unemployed |
| Less than High School | 26 (23.6%) | 42 (38.5%) |
| High School Diploma | 330 (84.2%) | 31 (7.9%) |
| College / Associate Degree | 285 (65.8%) | 18 (4.2%) |
| Bachelor's Degree or higher | 117 (97.5%) | 0 (0.0%) |
| Total | 757 (71.8%) | 66 (6.3%) |
Employment Occupations by Sex in Bridgeport
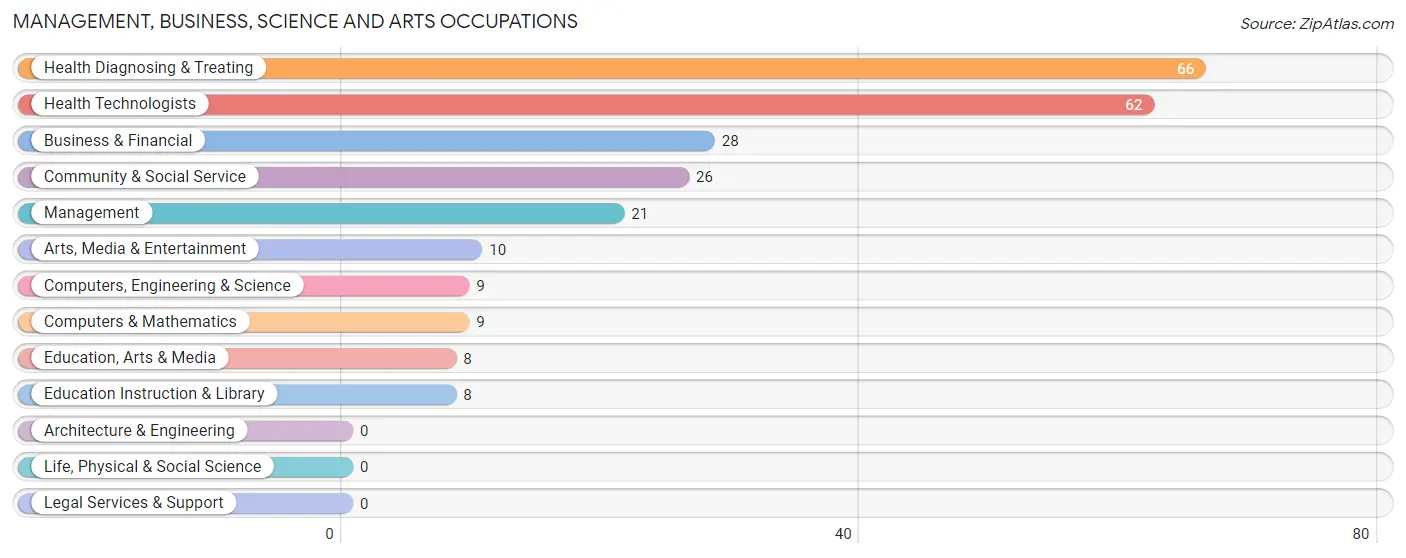
Management, Business, Science and Arts Occupations
The most common Management, Business, Science and Arts occupations in Bridgeport are Health Diagnosing & Treating (66 | 8.0%), Health Technologists (62 | 7.5%), Business & Financial (28 | 3.4%), Community & Social Service (26 | 3.1%), and Management (21 | 2.5%).
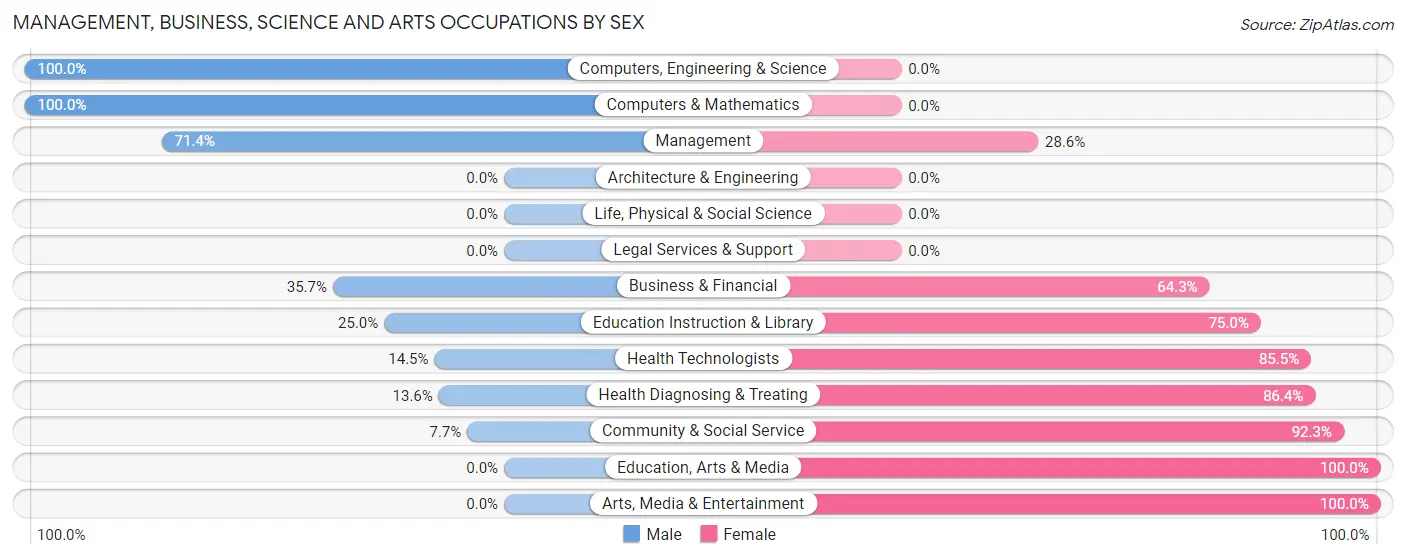
Management, Business, Science and Arts Occupations by Sex
Within the Management, Business, Science and Arts occupations in Bridgeport, the most male-oriented occupations are Computers, Engineering & Science (100.0%), Computers & Mathematics (100.0%), and Management (71.4%), while the most female-oriented occupations are Education, Arts & Media (100.0%), Arts, Media & Entertainment (100.0%), and Community & Social Service (92.3%).
| Occupation | Male | Female |
| Management | 15 (71.4%) | 6 (28.6%) |
| Business & Financial | 10 (35.7%) | 18 (64.3%) |
| Computers, Engineering & Science | 9 (100.0%) | 0 (0.0%) |
| Computers & Mathematics | 9 (100.0%) | 0 (0.0%) |
| Architecture & Engineering | 0 (0.0%) | 0 (0.0%) |
| Life, Physical & Social Science | 0 (0.0%) | 0 (0.0%) |
| Community & Social Service | 2 (7.7%) | 24 (92.3%) |
| Education, Arts & Media | 0 (0.0%) | 8 (100.0%) |
| Legal Services & Support | 0 (0.0%) | 0 (0.0%) |
| Education Instruction & Library | 2 (25.0%) | 6 (75.0%) |
| Arts, Media & Entertainment | 0 (0.0%) | 10 (100.0%) |
| Health Diagnosing & Treating | 9 (13.6%) | 57 (86.4%) |
| Health Technologists | 9 (14.5%) | 53 (85.5%) |
| Total (Category) | 45 (30.0%) | 105 (70.0%) |
| Total (Overall) | 431 (51.9%) | 399 (48.1%) |
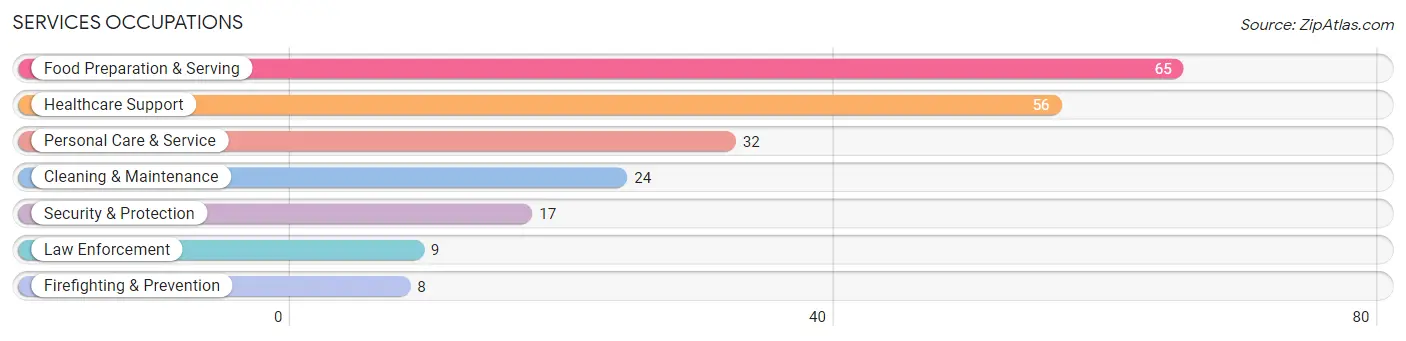
Services Occupations
The most common Services occupations in Bridgeport are Food Preparation & Serving (65 | 7.8%), Healthcare Support (56 | 6.8%), Personal Care & Service (32 | 3.9%), Cleaning & Maintenance (24 | 2.9%), and Security & Protection (17 | 2.1%).
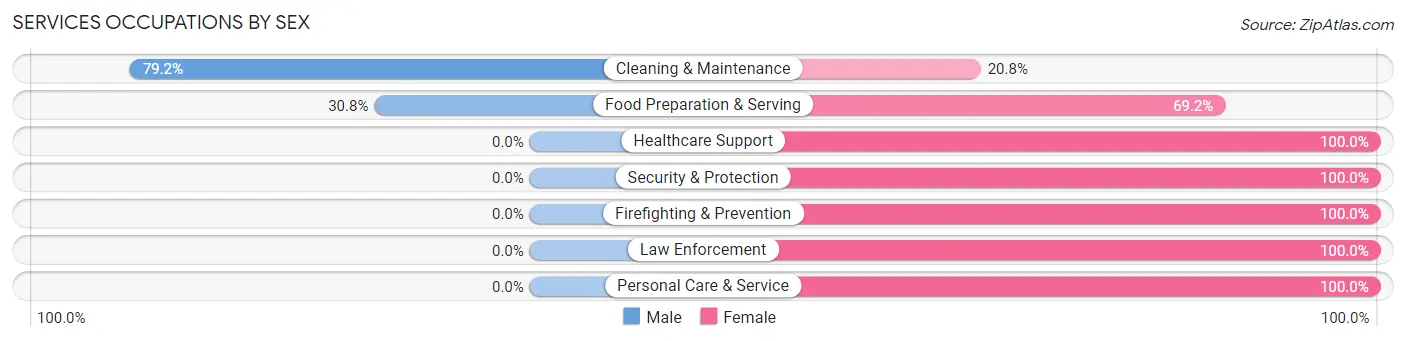
Services Occupations by Sex
Within the Services occupations in Bridgeport, the most male-oriented occupations are Cleaning & Maintenance (79.2%), and Food Preparation & Serving (30.8%), while the most female-oriented occupations are Healthcare Support (100.0%), Security & Protection (100.0%), and Firefighting & Prevention (100.0%).
| Occupation | Male | Female |
| Healthcare Support | 0 (0.0%) | 56 (100.0%) |
| Security & Protection | 0 (0.0%) | 17 (100.0%) |
| Firefighting & Prevention | 0 (0.0%) | 8 (100.0%) |
| Law Enforcement | 0 (0.0%) | 9 (100.0%) |
| Food Preparation & Serving | 20 (30.8%) | 45 (69.2%) |
| Cleaning & Maintenance | 19 (79.2%) | 5 (20.8%) |
| Personal Care & Service | 0 (0.0%) | 32 (100.0%) |
| Total (Category) | 39 (20.1%) | 155 (79.9%) |
| Total (Overall) | 431 (51.9%) | 399 (48.1%) |
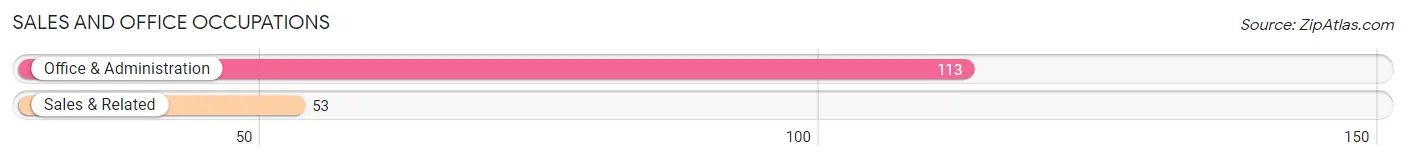
Sales and Office Occupations
The most common Sales and Office occupations in Bridgeport are Office & Administration (113 | 13.6%), and Sales & Related (53 | 6.4%).
Sales and Office Occupations by Sex
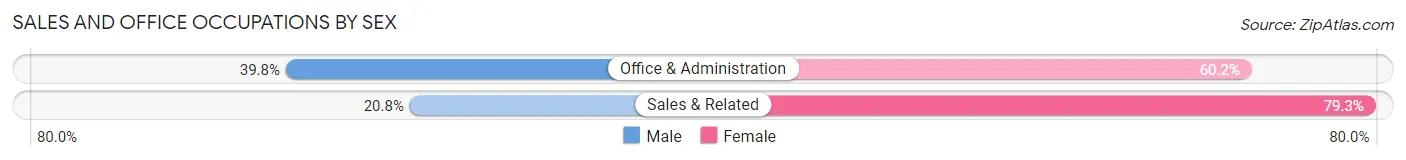
| Occupation | Male | Female |
| Sales & Related | 11 (20.7%) | 42 (79.2%) |
| Office & Administration | 45 (39.8%) | 68 (60.2%) |
| Total (Category) | 56 (33.7%) | 110 (66.3%) |
| Total (Overall) | 431 (51.9%) | 399 (48.1%) |
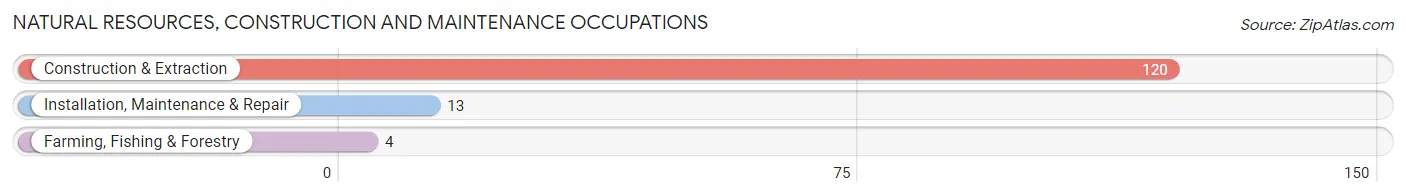
Natural Resources, Construction and Maintenance Occupations
The most common Natural Resources, Construction and Maintenance occupations in Bridgeport are Construction & Extraction (120 | 14.5%), Installation, Maintenance & Repair (13 | 1.6%), and Farming, Fishing & Forestry (4 | 0.5%).
Natural Resources, Construction and Maintenance Occupations by Sex
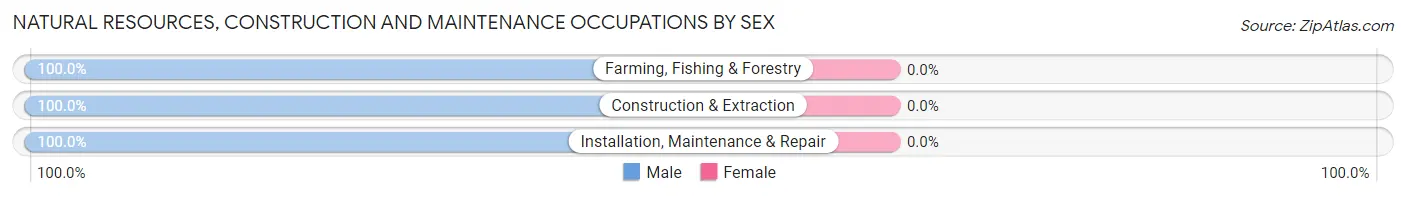
| Occupation | Male | Female |
| Farming, Fishing & Forestry | 4 (100.0%) | 0 (0.0%) |
| Construction & Extraction | 120 (100.0%) | 0 (0.0%) |
| Installation, Maintenance & Repair | 13 (100.0%) | 0 (0.0%) |
| Total (Category) | 137 (100.0%) | 0 (0.0%) |
| Total (Overall) | 431 (51.9%) | 399 (48.1%) |
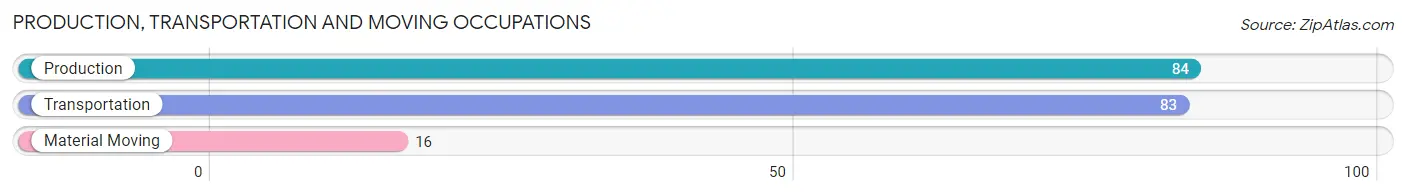
Production, Transportation and Moving Occupations
The most common Production, Transportation and Moving occupations in Bridgeport are Production (84 | 10.1%), Transportation (83 | 10.0%), and Material Moving (16 | 1.9%).
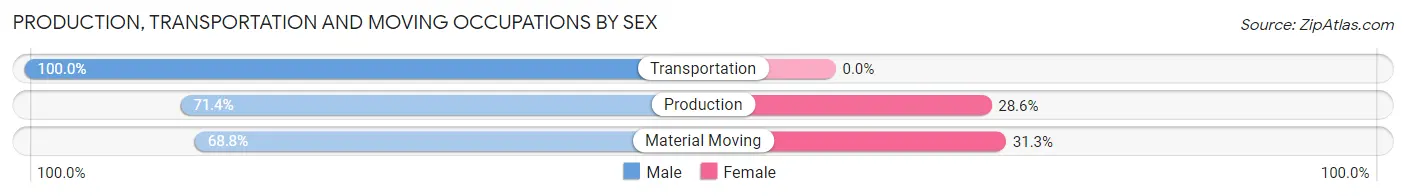
Production, Transportation and Moving Occupations by Sex
| Occupation | Male | Female |
| Production | 60 (71.4%) | 24 (28.6%) |
| Transportation | 83 (100.0%) | 0 (0.0%) |
| Material Moving | 11 (68.8%) | 5 (31.2%) |
| Total (Category) | 154 (84.2%) | 29 (15.9%) |
| Total (Overall) | 431 (51.9%) | 399 (48.1%) |
Employment Industries by Sex in Bridgeport
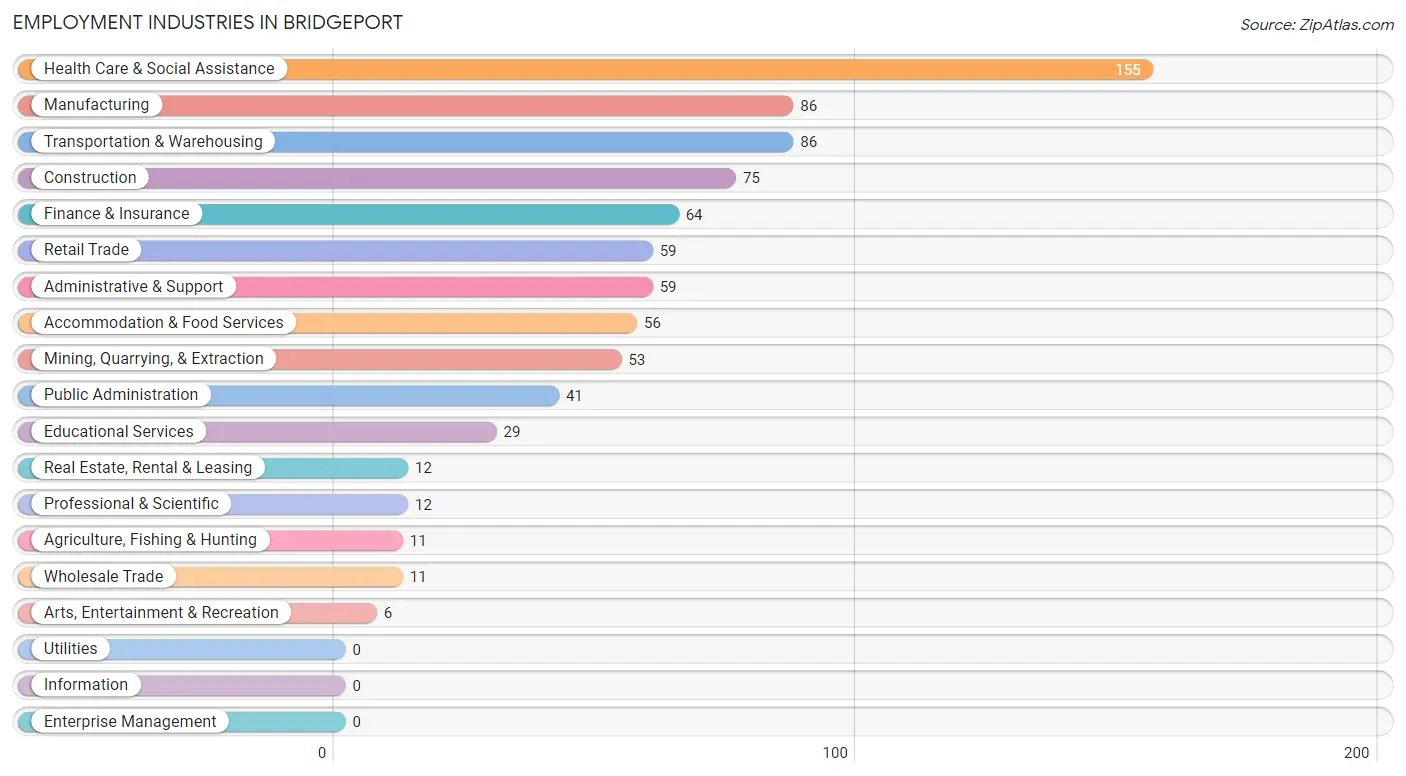
Employment Industries in Bridgeport
The major employment industries in Bridgeport include Health Care & Social Assistance (155 | 18.7%), Manufacturing (86 | 10.4%), Transportation & Warehousing (86 | 10.4%), Construction (75 | 9.0%), and Finance & Insurance (64 | 7.7%).
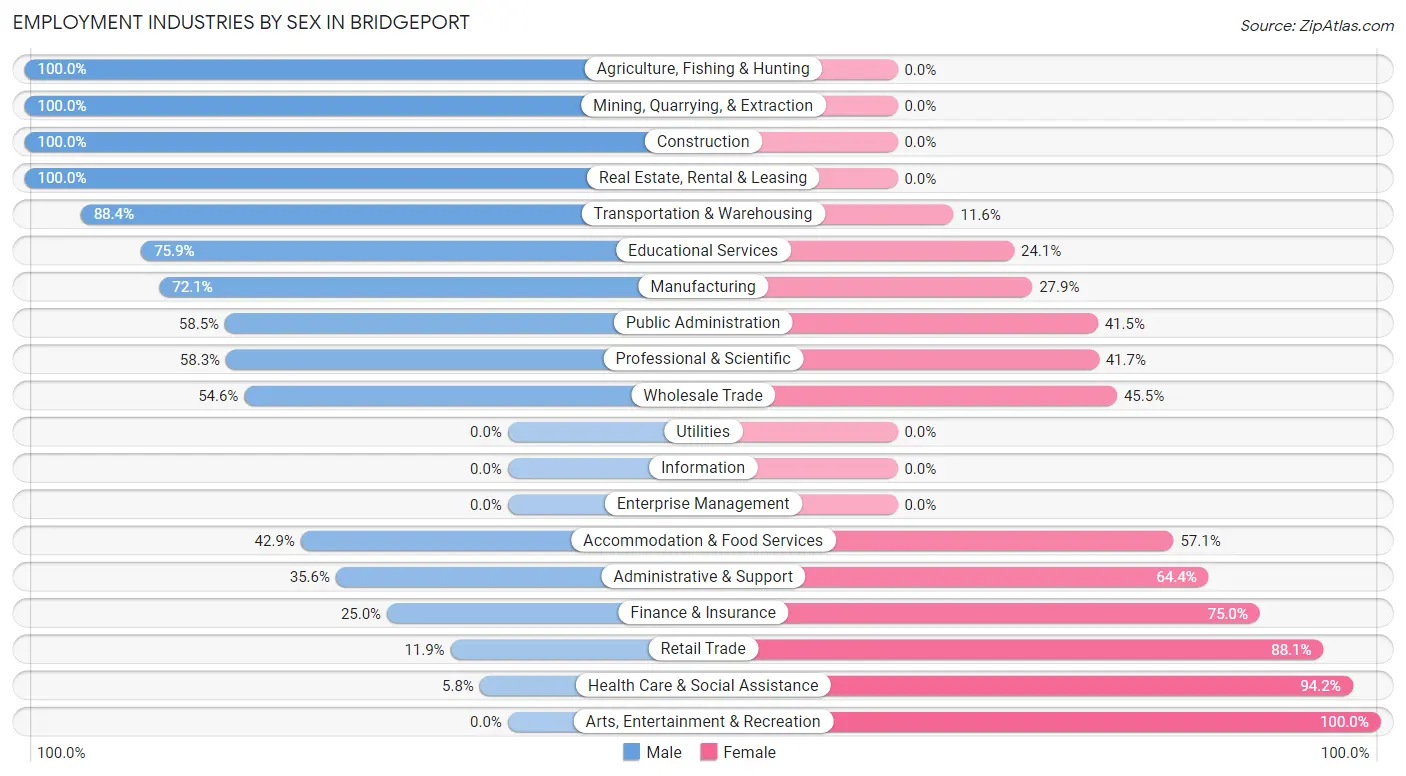
Employment Industries by Sex in Bridgeport
The Bridgeport industries that see more men than women are Agriculture, Fishing & Hunting (100.0%), Mining, Quarrying, & Extraction (100.0%), and Construction (100.0%), whereas the industries that tend to have a higher number of women are Arts, Entertainment & Recreation (100.0%), Health Care & Social Assistance (94.2%), and Retail Trade (88.1%).
| Industry | Male | Female |
| Agriculture, Fishing & Hunting | 11 (100.0%) | 0 (0.0%) |
| Mining, Quarrying, & Extraction | 53 (100.0%) | 0 (0.0%) |
| Construction | 75 (100.0%) | 0 (0.0%) |
| Manufacturing | 62 (72.1%) | 24 (27.9%) |
| Wholesale Trade | 6 (54.5%) | 5 (45.5%) |
| Retail Trade | 7 (11.9%) | 52 (88.1%) |
| Transportation & Warehousing | 76 (88.4%) | 10 (11.6%) |
| Utilities | 0 (0.0%) | 0 (0.0%) |
| Information | 0 (0.0%) | 0 (0.0%) |
| Finance & Insurance | 16 (25.0%) | 48 (75.0%) |
| Real Estate, Rental & Leasing | 12 (100.0%) | 0 (0.0%) |
| Professional & Scientific | 7 (58.3%) | 5 (41.7%) |
| Enterprise Management | 0 (0.0%) | 0 (0.0%) |
| Administrative & Support | 21 (35.6%) | 38 (64.4%) |
| Educational Services | 22 (75.9%) | 7 (24.1%) |
| Health Care & Social Assistance | 9 (5.8%) | 146 (94.2%) |
| Arts, Entertainment & Recreation | 0 (0.0%) | 6 (100.0%) |
| Accommodation & Food Services | 24 (42.9%) | 32 (57.1%) |
| Public Administration | 24 (58.5%) | 17 (41.5%) |
| Total | 431 (51.9%) | 399 (48.1%) |
Education in Bridgeport
School Enrollment in Bridgeport
The most common levels of schooling among the 561 students in Bridgeport are middle school (188 | 33.5%), high school (118 | 21.0%), and elementary school (103 | 18.4%).
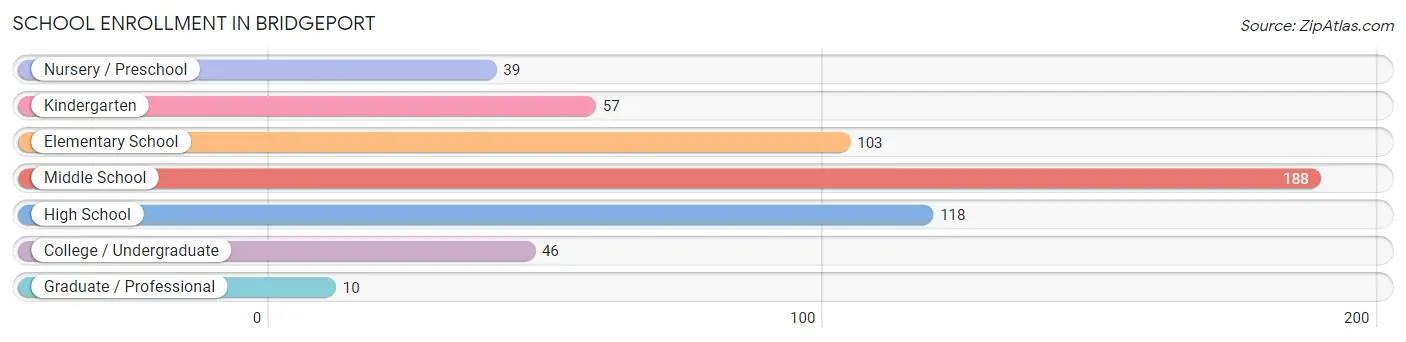
| School Level | # Students | % Students |
| Nursery / Preschool | 39 | 7.0% |
| Kindergarten | 57 | 10.2% |
| Elementary School | 103 | 18.4% |
| Middle School | 188 | 33.5% |
| High School | 118 | 21.0% |
| College / Undergraduate | 46 | 8.2% |
| Graduate / Professional | 10 | 1.8% |
| Total | 561 | 100.0% |
School Enrollment by Age by Funding Source in Bridgeport
Out of a total of 561 students who are enrolled in schools in Bridgeport, 8 (1.4%) attend a private institution, while the remaining 553 (98.6%) are enrolled in public schools. The age group of 3 to 4 year olds has the highest likelihood of being enrolled in private schools, with 4 (11.4% in the age bracket) enrolled. Conversely, the age group of 10 to 14 year olds has the lowest likelihood of being enrolled in a private school, with 222 (100.0% in the age bracket) attending a public institution.
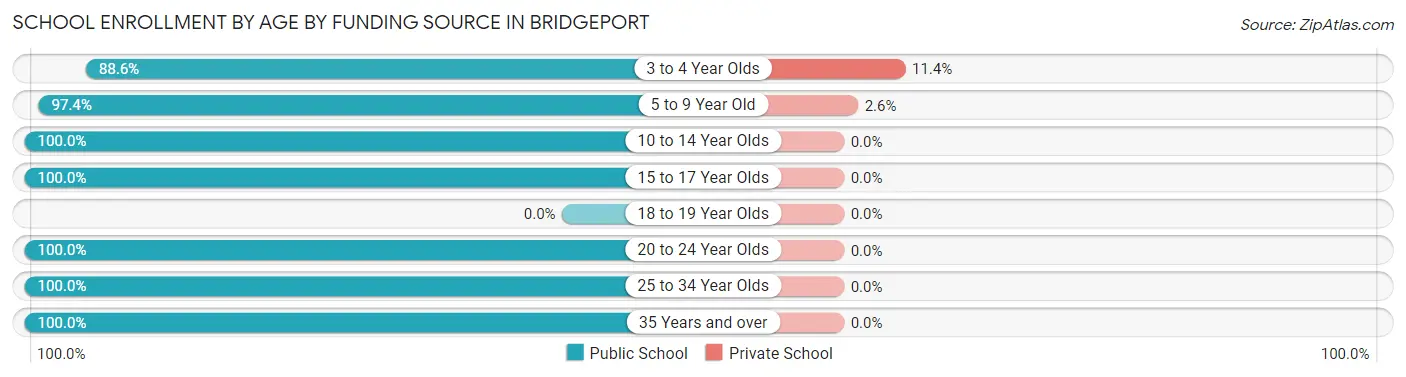
| Age Bracket | Public School | Private School |
| 3 to 4 Year Olds | 31 (88.6%) | 4 (11.4%) |
| 5 to 9 Year Old | 149 (97.4%) | 4 (2.6%) |
| 10 to 14 Year Olds | 222 (100.0%) | 0 (0.0%) |
| 15 to 17 Year Olds | 95 (100.0%) | 0 (0.0%) |
| 18 to 19 Year Olds | 0 (0.0%) | 0 (0.0%) |
| 20 to 24 Year Olds | 45 (100.0%) | 0 (0.0%) |
| 25 to 34 Year Olds | 2 (100.0%) | 0 (0.0%) |
| 35 Years and over | 9 (100.0%) | 0 (0.0%) |
| Total | 553 (98.6%) | 8 (1.4%) |
Educational Attainment by Field of Study in Bridgeport
Business (56 | 38.9%), science & technology (40 | 27.8%), arts & humanities (19 | 13.2%), education (18 | 12.5%), and social sciences (9 | 6.2%) are the most common fields of study among 144 individuals in Bridgeport who have obtained a bachelor's degree or higher.
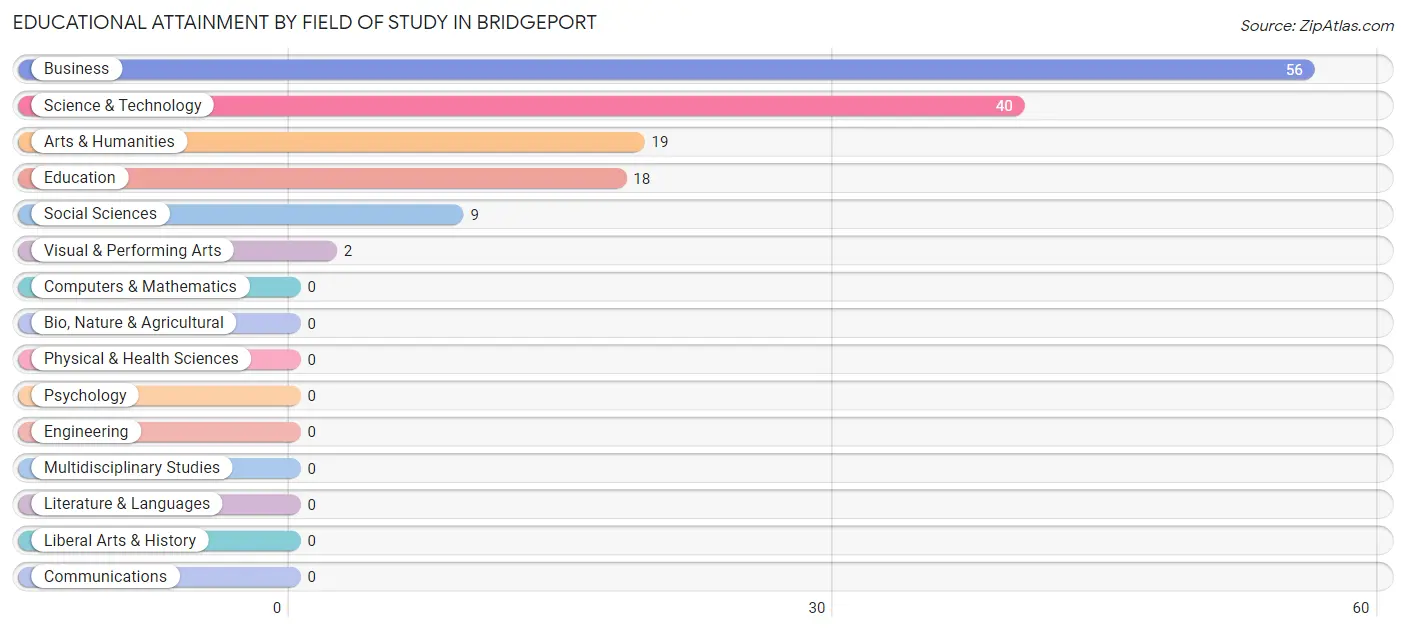
| Field of Study | # Graduates | % Graduates |
| Computers & Mathematics | 0 | 0.0% |
| Bio, Nature & Agricultural | 0 | 0.0% |
| Physical & Health Sciences | 0 | 0.0% |
| Psychology | 0 | 0.0% |
| Social Sciences | 9 | 6.2% |
| Engineering | 0 | 0.0% |
| Multidisciplinary Studies | 0 | 0.0% |
| Science & Technology | 40 | 27.8% |
| Business | 56 | 38.9% |
| Education | 18 | 12.5% |
| Literature & Languages | 0 | 0.0% |
| Liberal Arts & History | 0 | 0.0% |
| Visual & Performing Arts | 2 | 1.4% |
| Communications | 0 | 0.0% |
| Arts & Humanities | 19 | 13.2% |
| Total | 144 | 100.0% |
Transportation & Commute in Bridgeport
Vehicle Availability by Sex in Bridgeport
The most prevalent vehicle ownership categories in Bridgeport are males with 1 vehicle (189, accounting for 43.9%) and females with 1 vehicle (103, making up 47.5%).
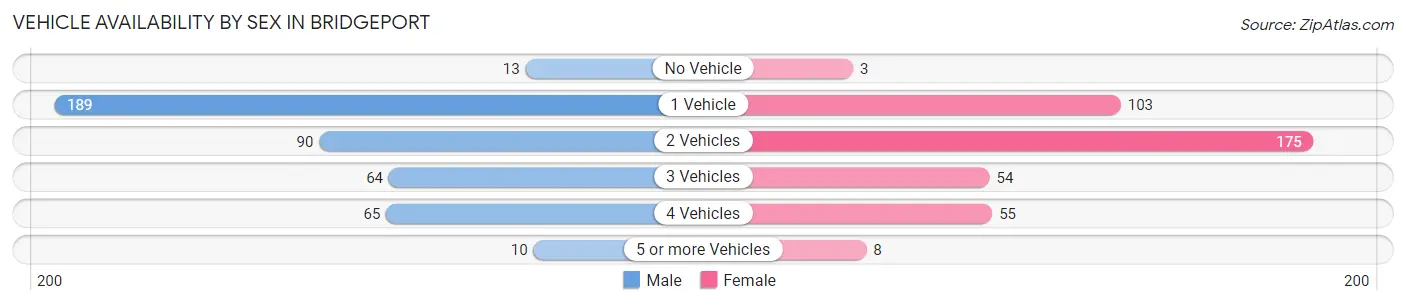
| Vehicles Available | Male | Female |
| No Vehicle | 13 (3.0%) | 3 (0.7%) |
| 1 Vehicle | 189 (43.9%) | 103 (25.9%) |
| 2 Vehicles | 90 (20.9%) | 175 (44.0%) |
| 3 Vehicles | 64 (14.8%) | 54 (13.6%) |
| 4 Vehicles | 65 (15.1%) | 55 (13.8%) |
| 5 or more Vehicles | 10 (2.3%) | 8 (2.0%) |
| Total | 431 (100.0%) | 398 (100.0%) |
Commute Time in Bridgeport
The most frequently occuring commute durations in Bridgeport are 15 to 19 minutes (146 commuters, 19.5%), 25 to 29 minutes (126 commuters, 16.8%), and 5 to 9 minutes (111 commuters, 14.8%).
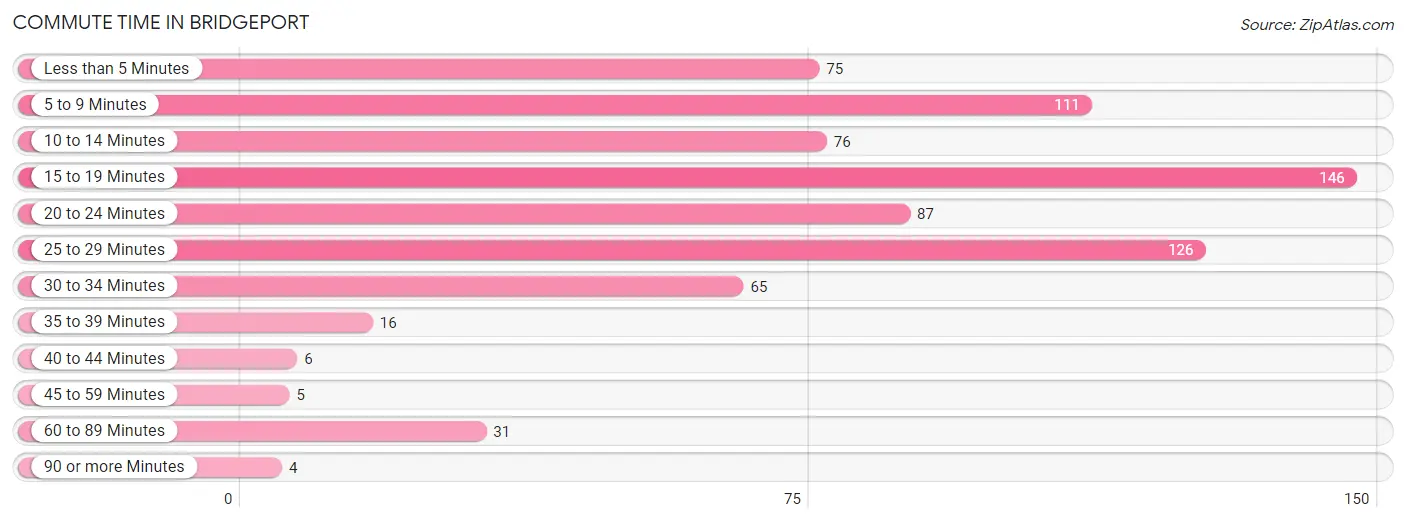
| Commute Time | # Commuters | % Commuters |
| Less than 5 Minutes | 75 | 10.0% |
| 5 to 9 Minutes | 111 | 14.8% |
| 10 to 14 Minutes | 76 | 10.2% |
| 15 to 19 Minutes | 146 | 19.5% |
| 20 to 24 Minutes | 87 | 11.6% |
| 25 to 29 Minutes | 126 | 16.8% |
| 30 to 34 Minutes | 65 | 8.7% |
| 35 to 39 Minutes | 16 | 2.1% |
| 40 to 44 Minutes | 6 | 0.8% |
| 45 to 59 Minutes | 5 | 0.7% |
| 60 to 89 Minutes | 31 | 4.1% |
| 90 or more Minutes | 4 | 0.5% |
Commute Time by Sex in Bridgeport
The most common commute times in Bridgeport are 15 to 19 minutes (118 commuters, 28.2%) for males and 25 to 29 minutes (81 commuters, 24.6%) for females.
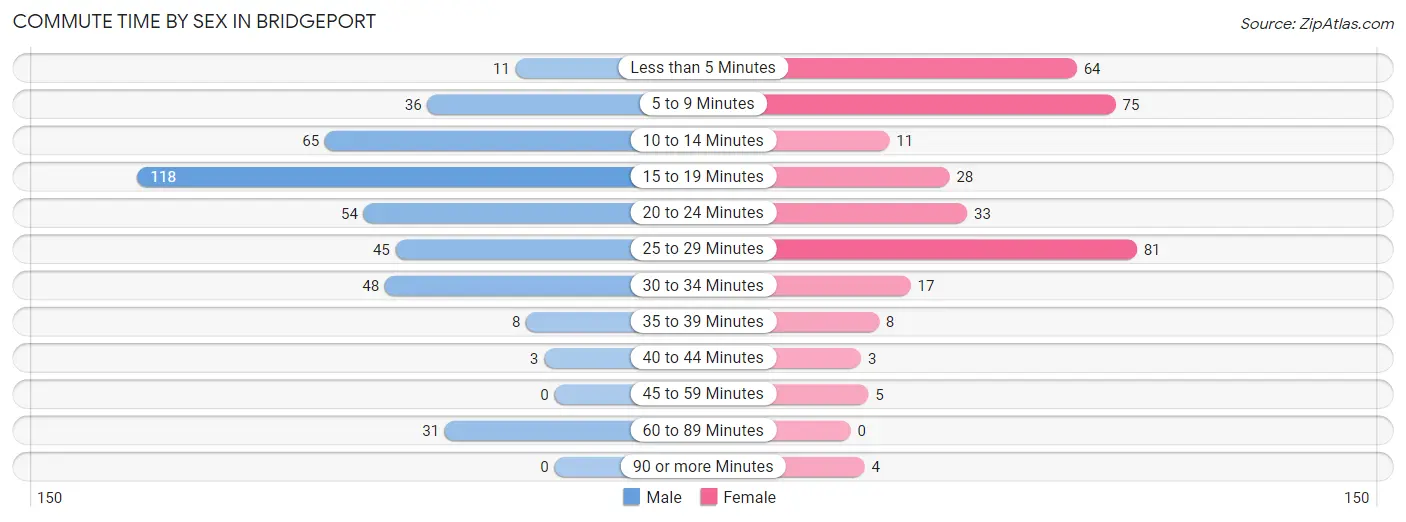
| Commute Time | Male | Female |
| Less than 5 Minutes | 11 (2.6%) | 64 (19.5%) |
| 5 to 9 Minutes | 36 (8.6%) | 75 (22.8%) |
| 10 to 14 Minutes | 65 (15.5%) | 11 (3.3%) |
| 15 to 19 Minutes | 118 (28.2%) | 28 (8.5%) |
| 20 to 24 Minutes | 54 (12.9%) | 33 (10.0%) |
| 25 to 29 Minutes | 45 (10.7%) | 81 (24.6%) |
| 30 to 34 Minutes | 48 (11.5%) | 17 (5.2%) |
| 35 to 39 Minutes | 8 (1.9%) | 8 (2.4%) |
| 40 to 44 Minutes | 3 (0.7%) | 3 (0.9%) |
| 45 to 59 Minutes | 0 (0.0%) | 5 (1.5%) |
| 60 to 89 Minutes | 31 (7.4%) | 0 (0.0%) |
| 90 or more Minutes | 0 (0.0%) | 4 (1.2%) |
Time of Departure to Work by Sex in Bridgeport
The most frequent times of departure to work in Bridgeport are 5:30 AM to 5:59 AM (105, 25.1%) for males and 7:00 AM to 7:29 AM (62, 18.8%) for females.
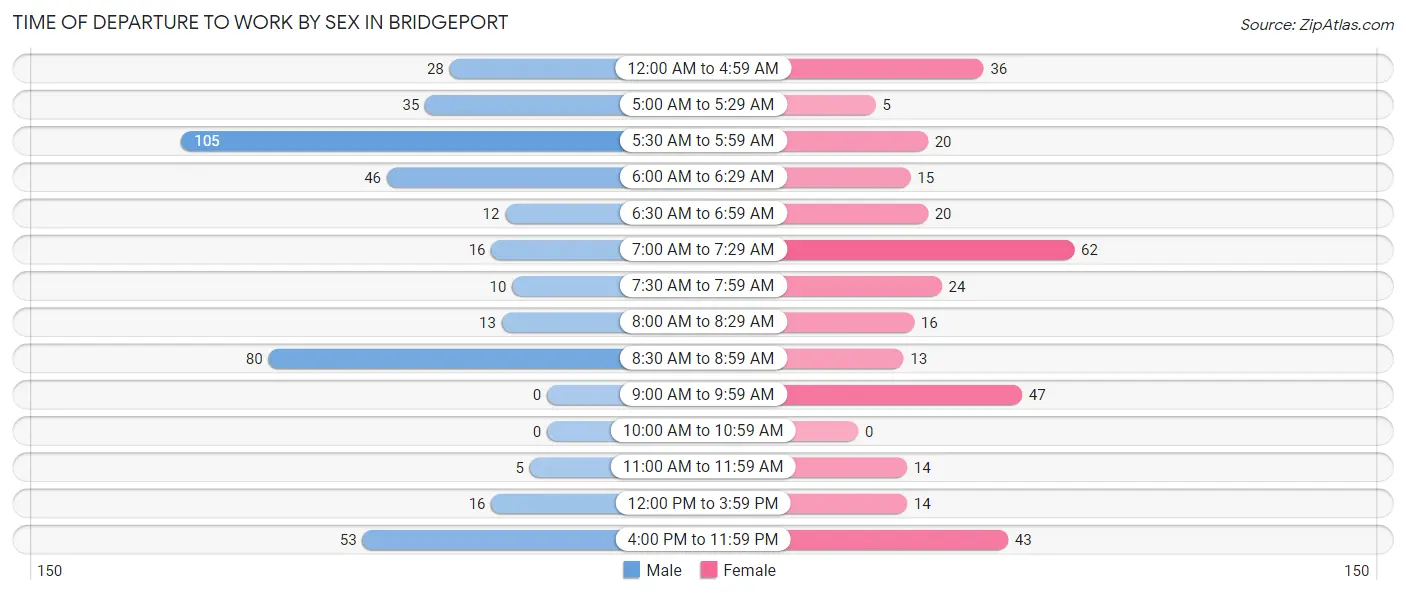
| Time of Departure | Male | Female |
| 12:00 AM to 4:59 AM | 28 (6.7%) | 36 (10.9%) |
| 5:00 AM to 5:29 AM | 35 (8.4%) | 5 (1.5%) |
| 5:30 AM to 5:59 AM | 105 (25.1%) | 20 (6.1%) |
| 6:00 AM to 6:29 AM | 46 (11.0%) | 15 (4.6%) |
| 6:30 AM to 6:59 AM | 12 (2.9%) | 20 (6.1%) |
| 7:00 AM to 7:29 AM | 16 (3.8%) | 62 (18.8%) |
| 7:30 AM to 7:59 AM | 10 (2.4%) | 24 (7.3%) |
| 8:00 AM to 8:29 AM | 13 (3.1%) | 16 (4.9%) |
| 8:30 AM to 8:59 AM | 80 (19.1%) | 13 (4.0%) |
| 9:00 AM to 9:59 AM | 0 (0.0%) | 47 (14.3%) |
| 10:00 AM to 10:59 AM | 0 (0.0%) | 0 (0.0%) |
| 11:00 AM to 11:59 AM | 5 (1.2%) | 14 (4.3%) |
| 12:00 PM to 3:59 PM | 16 (3.8%) | 14 (4.3%) |
| 4:00 PM to 11:59 PM | 53 (12.7%) | 43 (13.1%) |
| Total | 419 (100.0%) | 329 (100.0%) |
Housing Occupancy in Bridgeport
Occupancy by Ownership in Bridgeport
Of the total 820 dwellings in Bridgeport, owner-occupied units account for 529 (64.5%), while renter-occupied units make up 291 (35.5%).
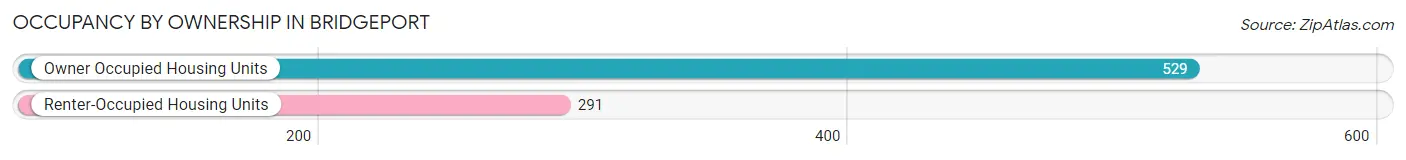
| Occupancy | # Housing Units | % Housing Units |
| Owner Occupied Housing Units | 529 | 64.5% |
| Renter-Occupied Housing Units | 291 | 35.5% |
| Total Occupied Housing Units | 820 | 100.0% |
Occupancy by Household Size in Bridgeport
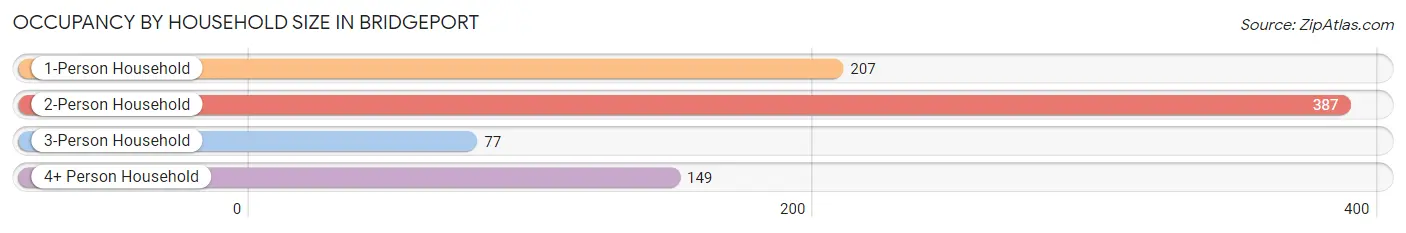
| Household Size | # Housing Units | % Housing Units |
| 1-Person Household | 207 | 25.2% |
| 2-Person Household | 387 | 47.2% |
| 3-Person Household | 77 | 9.4% |
| 4+ Person Household | 149 | 18.2% |
| Total Housing Units | 820 | 100.0% |
Occupancy by Ownership by Household Size in Bridgeport
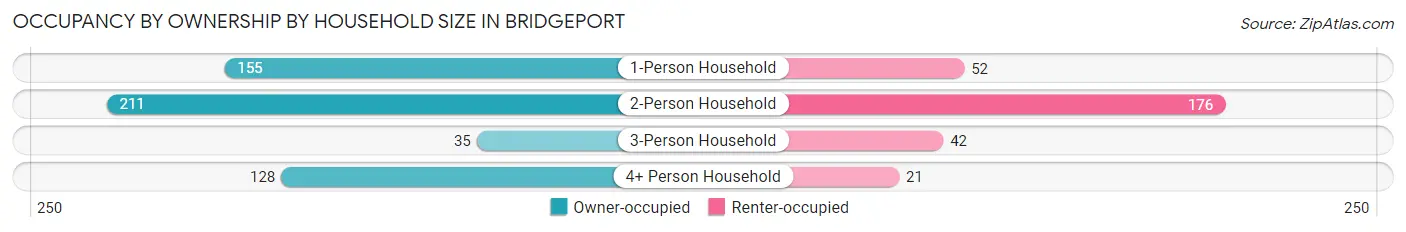
| Household Size | Owner-occupied | Renter-occupied |
| 1-Person Household | 155 (74.9%) | 52 (25.1%) |
| 2-Person Household | 211 (54.5%) | 176 (45.5%) |
| 3-Person Household | 35 (45.5%) | 42 (54.5%) |
| 4+ Person Household | 128 (85.9%) | 21 (14.1%) |
| Total Housing Units | 529 (64.5%) | 291 (35.5%) |
Occupancy by Educational Attainment in Bridgeport
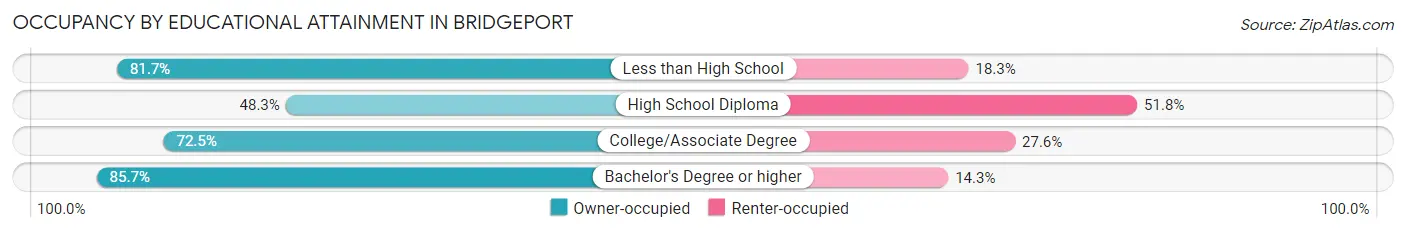
| Household Size | Owner-occupied | Renter-occupied |
| Less than High School | 58 (81.7%) | 13 (18.3%) |
| High School Diploma | 165 (48.2%) | 177 (51.7%) |
| College/Associate Degree | 234 (72.5%) | 89 (27.6%) |
| Bachelor's Degree or higher | 72 (85.7%) | 12 (14.3%) |
Occupancy by Age of Householder in Bridgeport
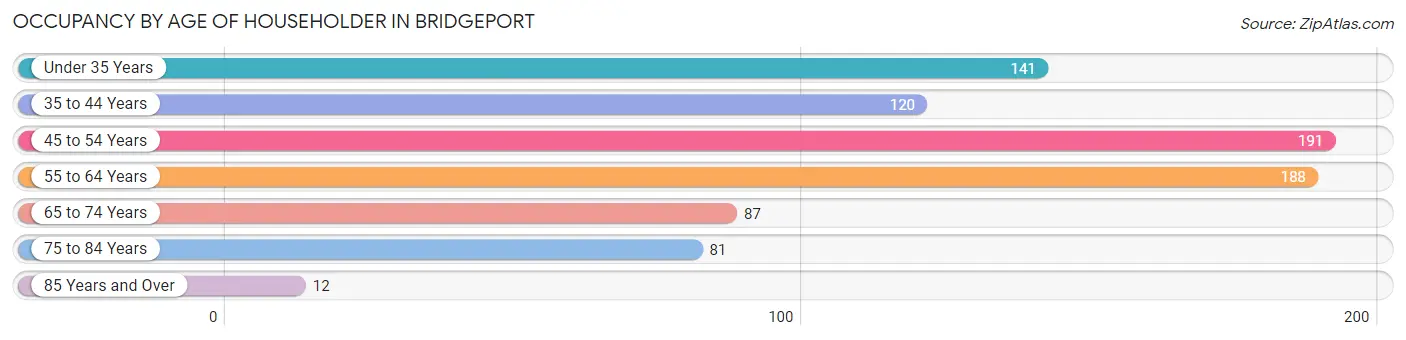
| Age Bracket | # Households | % Households |
| Under 35 Years | 141 | 17.2% |
| 35 to 44 Years | 120 | 14.6% |
| 45 to 54 Years | 191 | 23.3% |
| 55 to 64 Years | 188 | 22.9% |
| 65 to 74 Years | 87 | 10.6% |
| 75 to 84 Years | 81 | 9.9% |
| 85 Years and Over | 12 | 1.5% |
| Total | 820 | 100.0% |
Housing Finances in Bridgeport
Median Income by Occupancy in Bridgeport
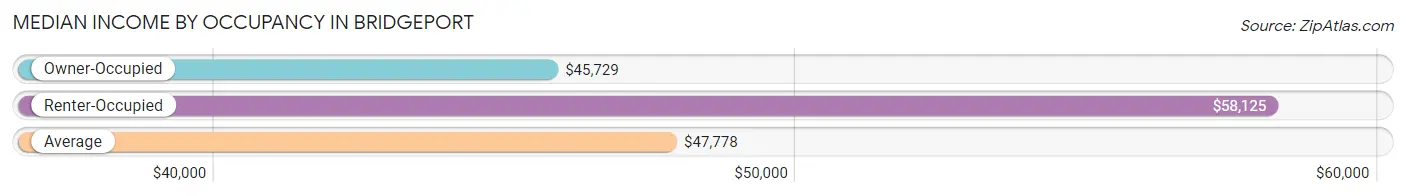
| Occupancy Type | # Households | Median Income |
| Owner-Occupied | 529 (64.5%) | $45,729 |
| Renter-Occupied | 291 (35.5%) | $58,125 |
| Average | 820 (100.0%) | $47,778 |
Occupancy by Householder Income Bracket in Bridgeport
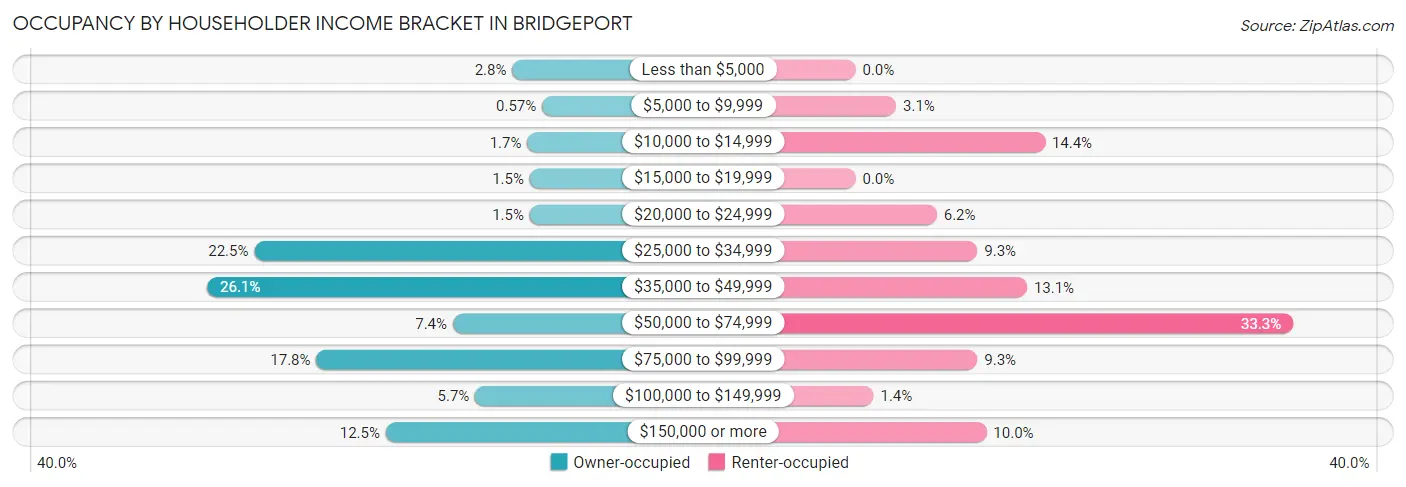
| Income Bracket | Owner-occupied | Renter-occupied |
| Less than $5,000 | 15 (2.8%) | 0 (0.0%) |
| $5,000 to $9,999 | 3 (0.6%) | 9 (3.1%) |
| $10,000 to $14,999 | 9 (1.7%) | 42 (14.4%) |
| $15,000 to $19,999 | 8 (1.5%) | 0 (0.0%) |
| $20,000 to $24,999 | 8 (1.5%) | 18 (6.2%) |
| $25,000 to $34,999 | 119 (22.5%) | 27 (9.3%) |
| $35,000 to $49,999 | 138 (26.1%) | 38 (13.1%) |
| $50,000 to $74,999 | 39 (7.4%) | 97 (33.3%) |
| $75,000 to $99,999 | 94 (17.8%) | 27 (9.3%) |
| $100,000 to $149,999 | 30 (5.7%) | 4 (1.4%) |
| $150,000 or more | 66 (12.5%) | 29 (10.0%) |
| Total | 529 (100.0%) | 291 (100.0%) |
Monthly Housing Cost Tiers in Bridgeport
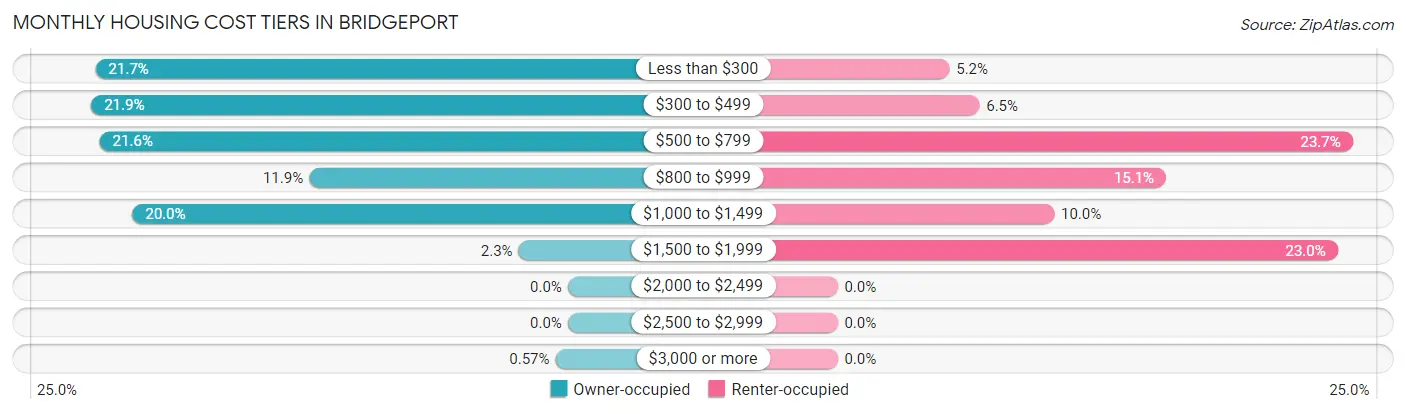
| Monthly Cost | Owner-occupied | Renter-occupied |
| Less than $300 | 115 (21.7%) | 15 (5.1%) |
| $300 to $499 | 116 (21.9%) | 19 (6.5%) |
| $500 to $799 | 114 (21.5%) | 69 (23.7%) |
| $800 to $999 | 63 (11.9%) | 44 (15.1%) |
| $1,000 to $1,499 | 106 (20.0%) | 29 (10.0%) |
| $1,500 to $1,999 | 12 (2.3%) | 67 (23.0%) |
| $2,000 to $2,499 | 0 (0.0%) | 0 (0.0%) |
| $2,500 to $2,999 | 0 (0.0%) | 0 (0.0%) |
| $3,000 or more | 3 (0.6%) | 0 (0.0%) |
| Total | 529 (100.0%) | 291 (100.0%) |
Physical Housing Characteristics in Bridgeport
Housing Structures in Bridgeport
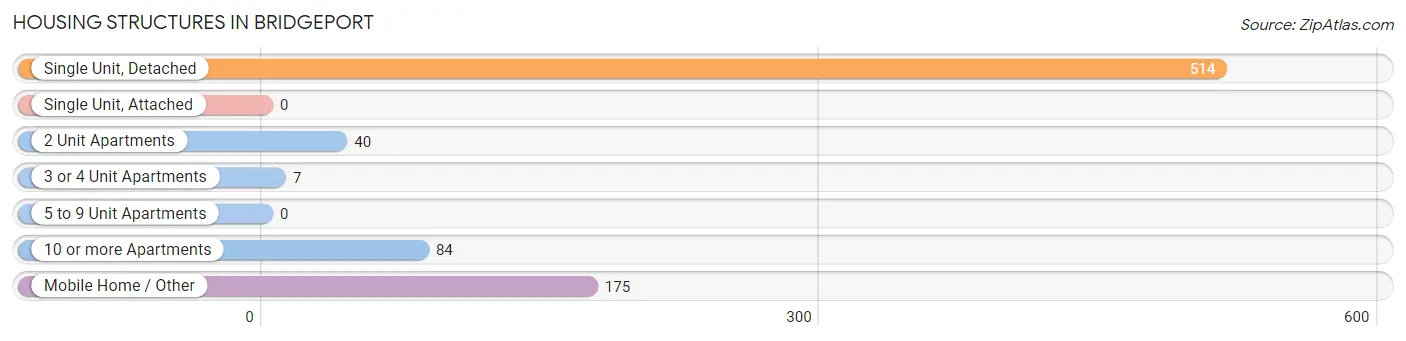
| Structure Type | # Housing Units | % Housing Units |
| Single Unit, Detached | 514 | 62.7% |
| Single Unit, Attached | 0 | 0.0% |
| 2 Unit Apartments | 40 | 4.9% |
| 3 or 4 Unit Apartments | 7 | 0.9% |
| 5 to 9 Unit Apartments | 0 | 0.0% |
| 10 or more Apartments | 84 | 10.2% |
| Mobile Home / Other | 175 | 21.3% |
| Total | 820 | 100.0% |
Housing Structures by Occupancy in Bridgeport
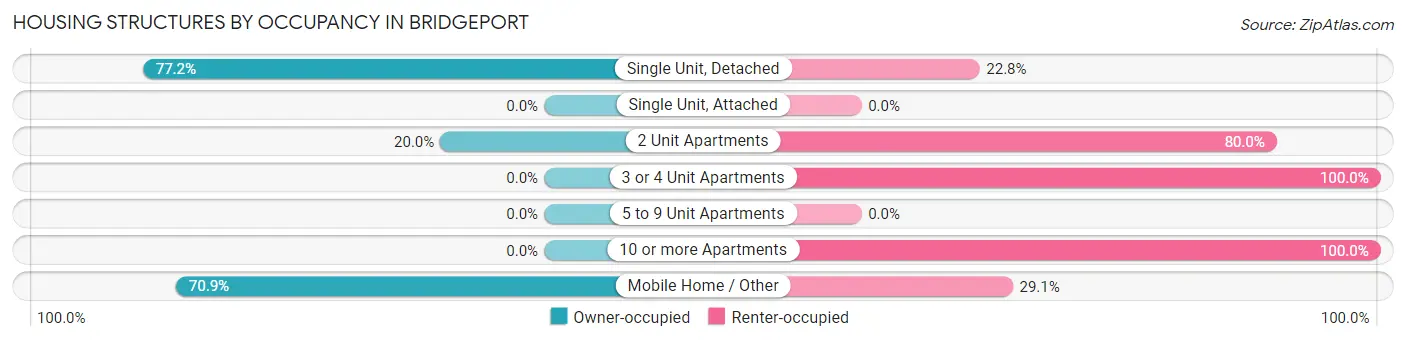
| Structure Type | Owner-occupied | Renter-occupied |
| Single Unit, Detached | 397 (77.2%) | 117 (22.8%) |
| Single Unit, Attached | 0 (0.0%) | 0 (0.0%) |
| 2 Unit Apartments | 8 (20.0%) | 32 (80.0%) |
| 3 or 4 Unit Apartments | 0 (0.0%) | 7 (100.0%) |
| 5 to 9 Unit Apartments | 0 (0.0%) | 0 (0.0%) |
| 10 or more Apartments | 0 (0.0%) | 84 (100.0%) |
| Mobile Home / Other | 124 (70.9%) | 51 (29.1%) |
| Total | 529 (64.5%) | 291 (35.5%) |
Housing Structures by Number of Rooms in Bridgeport
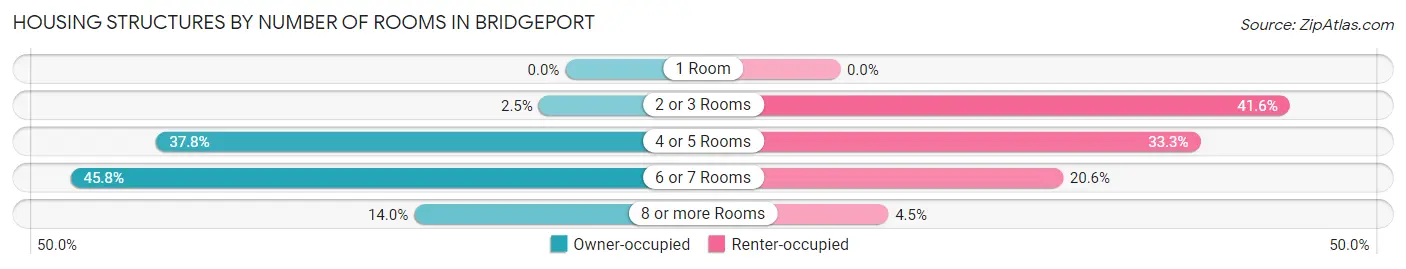
| Number of Rooms | Owner-occupied | Renter-occupied |
| 1 Room | 0 (0.0%) | 0 (0.0%) |
| 2 or 3 Rooms | 13 (2.5%) | 121 (41.6%) |
| 4 or 5 Rooms | 200 (37.8%) | 97 (33.3%) |
| 6 or 7 Rooms | 242 (45.8%) | 60 (20.6%) |
| 8 or more Rooms | 74 (14.0%) | 13 (4.5%) |
| Total | 529 (100.0%) | 291 (100.0%) |
Housing Structure by Heating Type in Bridgeport
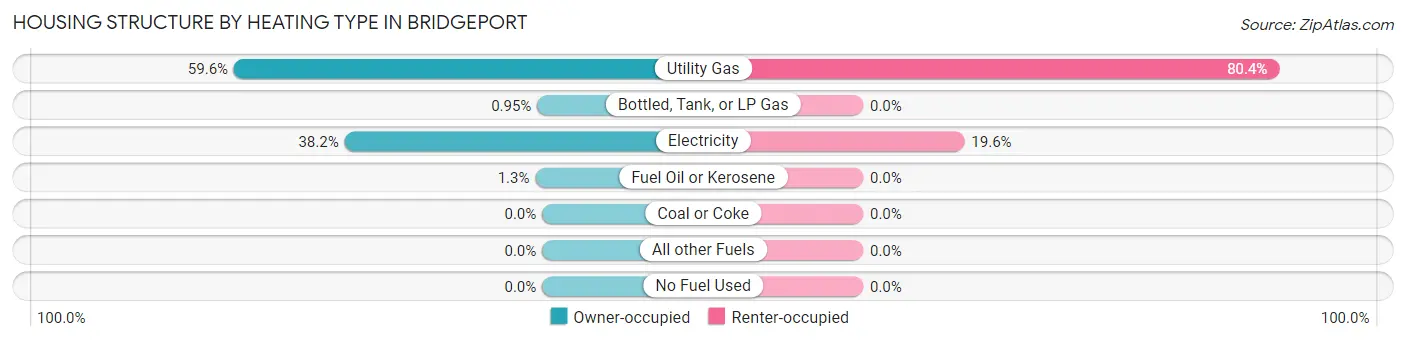
| Heating Type | Owner-occupied | Renter-occupied |
| Utility Gas | 315 (59.6%) | 234 (80.4%) |
| Bottled, Tank, or LP Gas | 5 (0.9%) | 0 (0.0%) |
| Electricity | 202 (38.2%) | 57 (19.6%) |
| Fuel Oil or Kerosene | 7 (1.3%) | 0 (0.0%) |
| Coal or Coke | 0 (0.0%) | 0 (0.0%) |
| All other Fuels | 0 (0.0%) | 0 (0.0%) |
| No Fuel Used | 0 (0.0%) | 0 (0.0%) |
| Total | 529 (100.0%) | 291 (100.0%) |
Household Vehicle Usage in Bridgeport
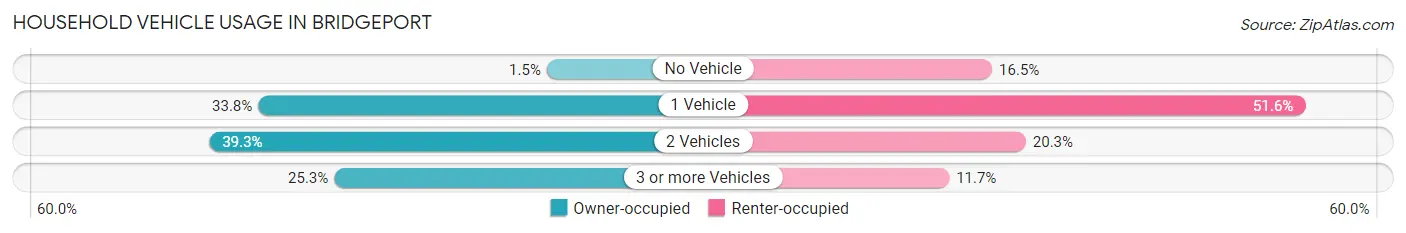
| Vehicles per Household | Owner-occupied | Renter-occupied |
| No Vehicle | 8 (1.5%) | 48 (16.5%) |
| 1 Vehicle | 179 (33.8%) | 150 (51.5%) |
| 2 Vehicles | 208 (39.3%) | 59 (20.3%) |
| 3 or more Vehicles | 134 (25.3%) | 34 (11.7%) |
| Total | 529 (100.0%) | 291 (100.0%) |
Real Estate & Mortgages in Bridgeport
Real Estate and Mortgage Overview in Bridgeport
| Characteristic | Without Mortgage | With Mortgage |
| Housing Units | 280 | 249 |
| Median Property Value | $33,600 | $81,600 |
| Median Household Income | $37,895 | $47 |
| Monthly Housing Costs | $371 | $0 |
| Real Estate Taxes | $441 | $4 |
Property Value by Mortgage Status in Bridgeport
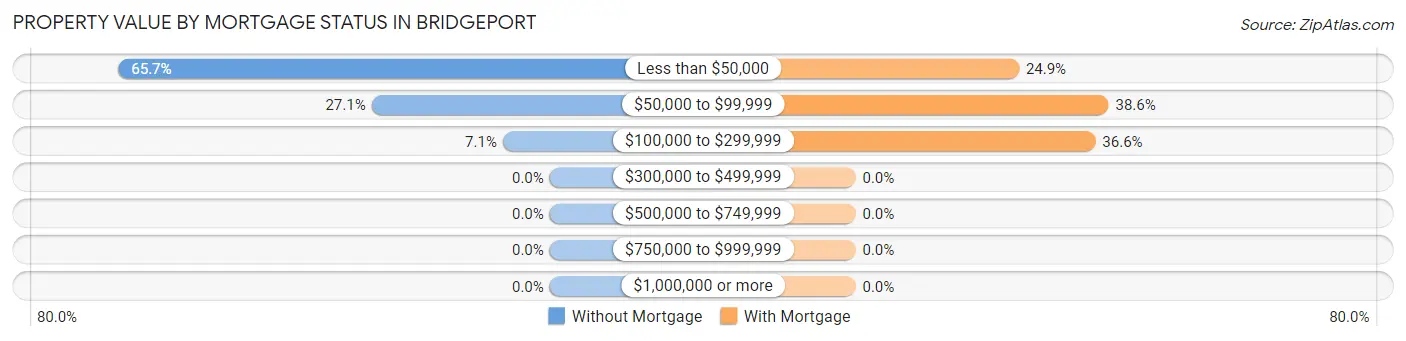
| Property Value | Without Mortgage | With Mortgage |
| Less than $50,000 | 184 (65.7%) | 62 (24.9%) |
| $50,000 to $99,999 | 76 (27.1%) | 96 (38.6%) |
| $100,000 to $299,999 | 20 (7.1%) | 91 (36.5%) |
| $300,000 to $499,999 | 0 (0.0%) | 0 (0.0%) |
| $500,000 to $749,999 | 0 (0.0%) | 0 (0.0%) |
| $750,000 to $999,999 | 0 (0.0%) | 0 (0.0%) |
| $1,000,000 or more | 0 (0.0%) | 0 (0.0%) |
| Total | 280 (100.0%) | 249 (100.0%) |
Household Income by Mortgage Status in Bridgeport
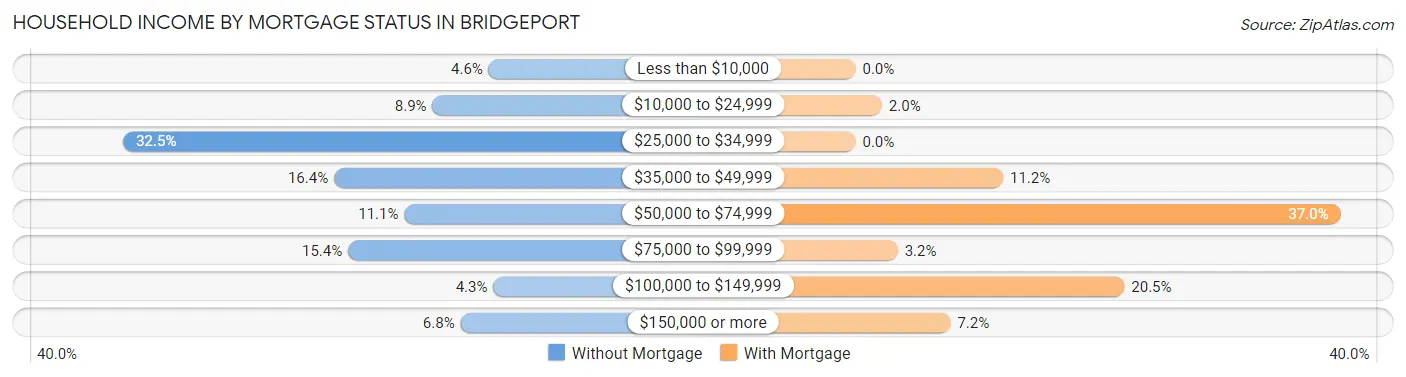
| Household Income | Without Mortgage | With Mortgage |
| Less than $10,000 | 13 (4.6%) | 0 (0.0%) |
| $10,000 to $24,999 | 25 (8.9%) | 5 (2.0%) |
| $25,000 to $34,999 | 91 (32.5%) | 0 (0.0%) |
| $35,000 to $49,999 | 46 (16.4%) | 28 (11.2%) |
| $50,000 to $74,999 | 31 (11.1%) | 92 (36.9%) |
| $75,000 to $99,999 | 43 (15.4%) | 8 (3.2%) |
| $100,000 to $149,999 | 12 (4.3%) | 51 (20.5%) |
| $150,000 or more | 19 (6.8%) | 18 (7.2%) |
| Total | 280 (100.0%) | 249 (100.0%) |
Property Value to Household Income Ratio in Bridgeport
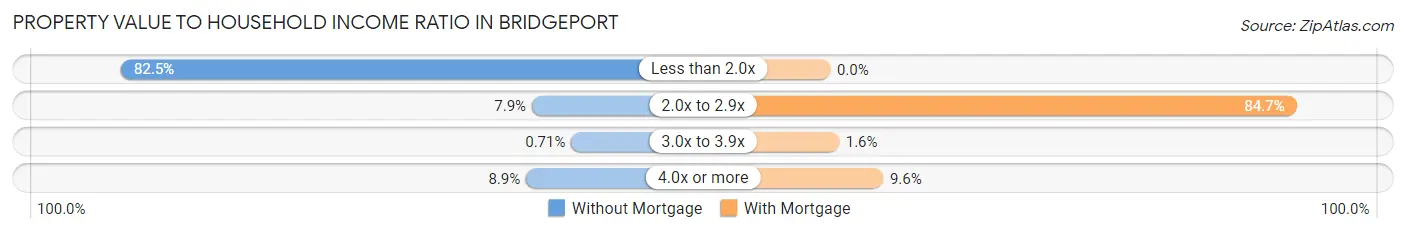
| Value-to-Income Ratio | Without Mortgage | With Mortgage |
| Less than 2.0x | 231 (82.5%) | 0 (0.0%) |
| 2.0x to 2.9x | 22 (7.9%) | 211 (84.7%) |
| 3.0x to 3.9x | 2 (0.7%) | 4 (1.6%) |
| 4.0x or more | 25 (8.9%) | 24 (9.6%) |
| Total | 280 (100.0%) | 249 (100.0%) |
Real Estate Taxes by Mortgage Status in Bridgeport
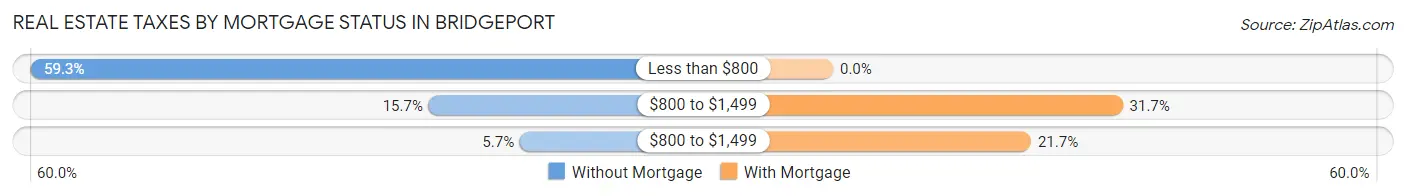
| Property Taxes | Without Mortgage | With Mortgage |
| Less than $800 | 166 (59.3%) | 0 (0.0%) |
| $800 to $1,499 | 44 (15.7%) | 79 (31.7%) |
| $800 to $1,499 | 16 (5.7%) | 54 (21.7%) |
| Total | 280 (100.0%) | 249 (100.0%) |
Health & Disability in Bridgeport
Health Insurance Coverage by Age in Bridgeport
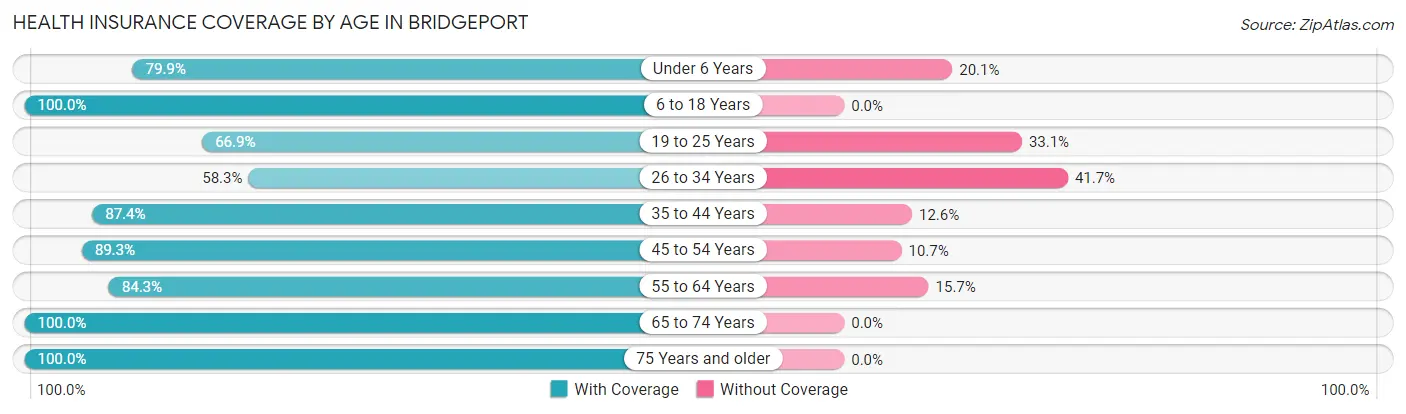
| Age Bracket | With Coverage | Without Coverage |
| Under 6 Years | 115 (79.9%) | 29 (20.1%) |
| 6 to 18 Years | 437 (100.0%) | 0 (0.0%) |
| 19 to 25 Years | 109 (66.9%) | 54 (33.1%) |
| 26 to 34 Years | 123 (58.3%) | 88 (41.7%) |
| 35 to 44 Years | 173 (87.4%) | 25 (12.6%) |
| 45 to 54 Years | 293 (89.3%) | 35 (10.7%) |
| 55 to 64 Years | 252 (84.3%) | 47 (15.7%) |
| 65 to 74 Years | 147 (100.0%) | 0 (0.0%) |
| 75 Years and older | 103 (100.0%) | 0 (0.0%) |
| Total | 1,752 (86.3%) | 278 (13.7%) |
Health Insurance Coverage by Citizenship Status in Bridgeport
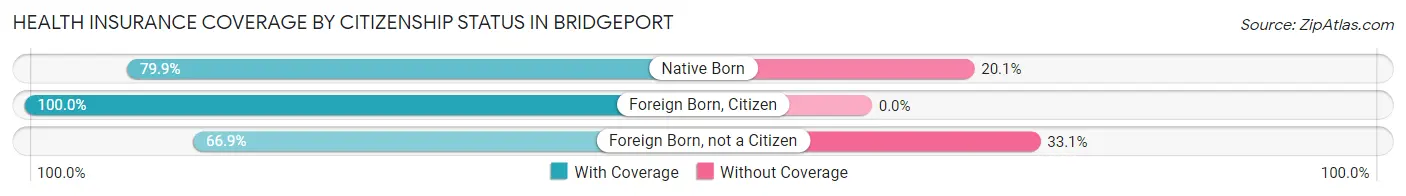
| Citizenship Status | With Coverage | Without Coverage |
| Native Born | 115 (79.9%) | 29 (20.1%) |
| Foreign Born, Citizen | 437 (100.0%) | 0 (0.0%) |
| Foreign Born, not a Citizen | 109 (66.9%) | 54 (33.1%) |
Health Insurance Coverage by Household Income in Bridgeport
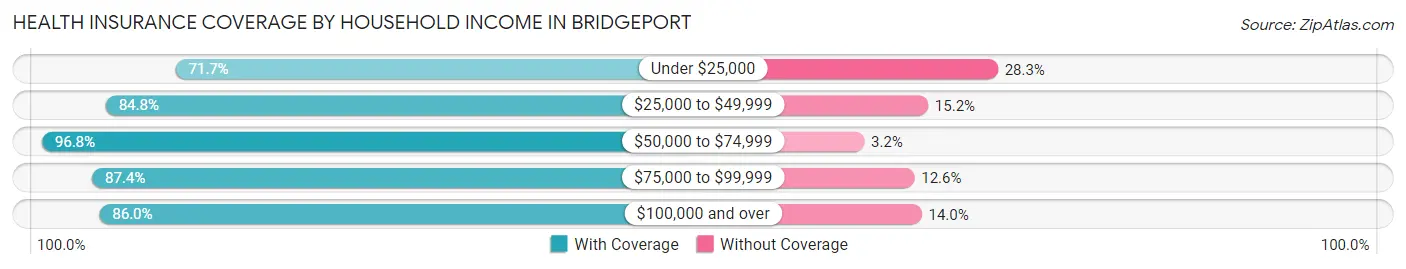
| Household Income | With Coverage | Without Coverage |
| Under $25,000 | 137 (71.7%) | 54 (28.3%) |
| $25,000 to $49,999 | 608 (84.8%) | 109 (15.2%) |
| $50,000 to $74,999 | 329 (96.8%) | 11 (3.2%) |
| $75,000 to $99,999 | 318 (87.4%) | 46 (12.6%) |
| $100,000 and over | 356 (86.0%) | 58 (14.0%) |
Public vs Private Health Insurance Coverage by Age in Bridgeport
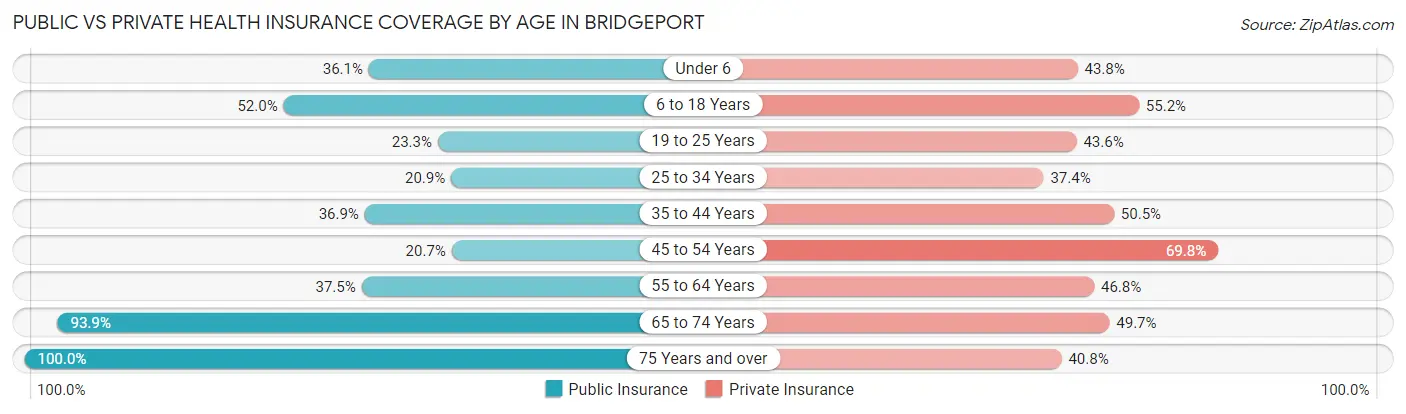
| Age Bracket | Public Insurance | Private Insurance |
| Under 6 | 52 (36.1%) | 63 (43.8%) |
| 6 to 18 Years | 227 (51.9%) | 241 (55.1%) |
| 19 to 25 Years | 38 (23.3%) | 71 (43.6%) |
| 25 to 34 Years | 44 (20.8%) | 79 (37.4%) |
| 35 to 44 Years | 73 (36.9%) | 100 (50.5%) |
| 45 to 54 Years | 68 (20.7%) | 229 (69.8%) |
| 55 to 64 Years | 112 (37.5%) | 140 (46.8%) |
| 65 to 74 Years | 138 (93.9%) | 73 (49.7%) |
| 75 Years and over | 103 (100.0%) | 42 (40.8%) |
| Total | 855 (42.1%) | 1,038 (51.1%) |
Disability Status by Sex by Age in Bridgeport
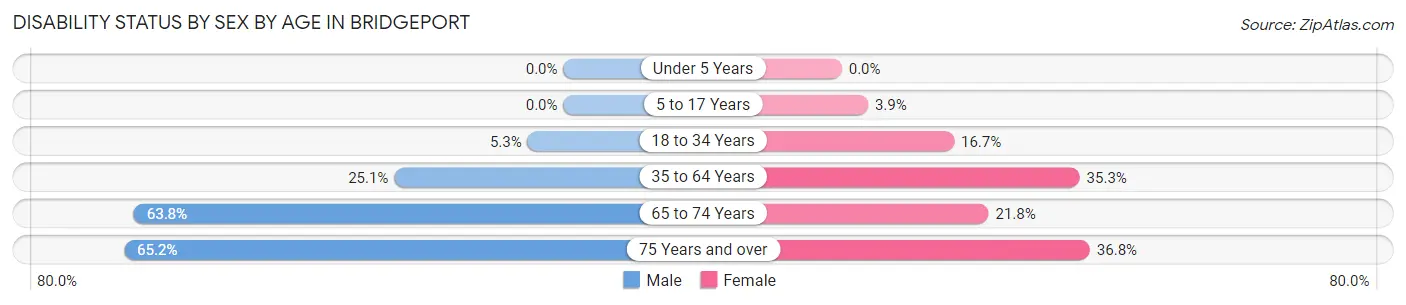
| Age Bracket | Male | Female |
| Under 5 Years | 0 (0.0%) | 0 (0.0%) |
| 5 to 17 Years | 0 (0.0%) | 7 (3.9%) |
| 18 to 34 Years | 10 (5.3%) | 31 (16.7%) |
| 35 to 64 Years | 102 (25.1%) | 148 (35.3%) |
| 65 to 74 Years | 44 (63.8%) | 17 (21.8%) |
| 75 Years and over | 30 (65.2%) | 21 (36.8%) |
Disability Class by Sex by Age in Bridgeport
Disability Class: Hearing Difficulty
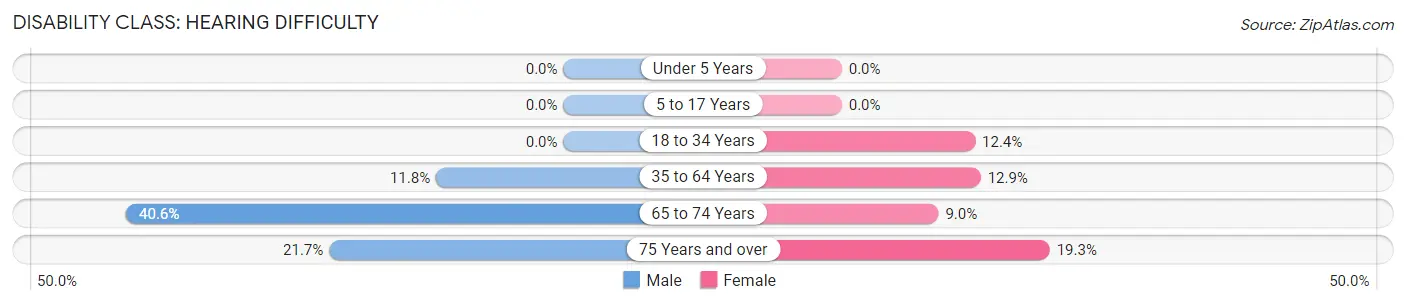
| Age Bracket | Male | Female |
| Under 5 Years | 0 (0.0%) | 0 (0.0%) |
| 5 to 17 Years | 0 (0.0%) | 0 (0.0%) |
| 18 to 34 Years | 0 (0.0%) | 23 (12.4%) |
| 35 to 64 Years | 48 (11.8%) | 54 (12.9%) |
| 65 to 74 Years | 28 (40.6%) | 7 (9.0%) |
| 75 Years and over | 10 (21.7%) | 11 (19.3%) |
Disability Class: Vision Difficulty
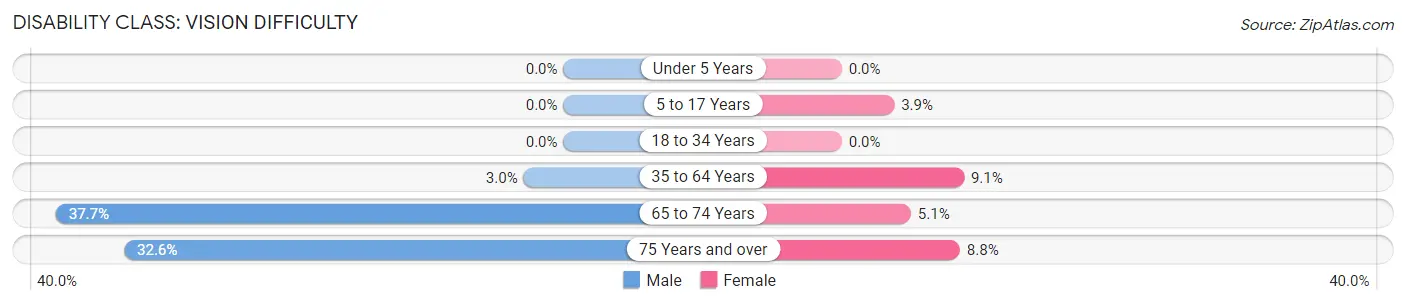
| Age Bracket | Male | Female |
| Under 5 Years | 0 (0.0%) | 0 (0.0%) |
| 5 to 17 Years | 0 (0.0%) | 7 (3.9%) |
| 18 to 34 Years | 0 (0.0%) | 0 (0.0%) |
| 35 to 64 Years | 12 (3.0%) | 38 (9.1%) |
| 65 to 74 Years | 26 (37.7%) | 4 (5.1%) |
| 75 Years and over | 15 (32.6%) | 5 (8.8%) |
Disability Class: Cognitive Difficulty
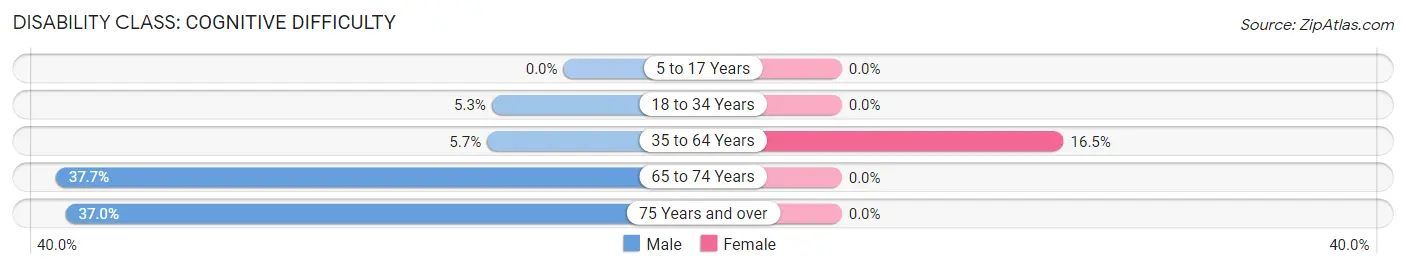
| Age Bracket | Male | Female |
| 5 to 17 Years | 0 (0.0%) | 0 (0.0%) |
| 18 to 34 Years | 10 (5.3%) | 0 (0.0%) |
| 35 to 64 Years | 23 (5.7%) | 69 (16.5%) |
| 65 to 74 Years | 26 (37.7%) | 0 (0.0%) |
| 75 Years and over | 17 (37.0%) | 0 (0.0%) |
Disability Class: Ambulatory Difficulty
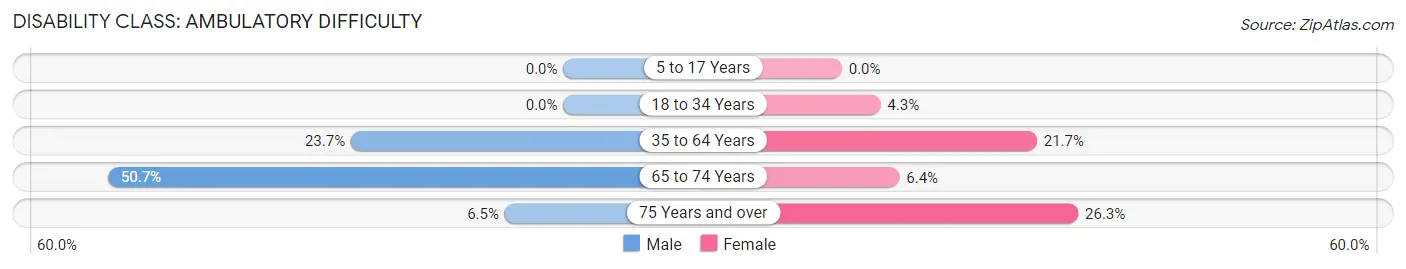
| Age Bracket | Male | Female |
| 5 to 17 Years | 0 (0.0%) | 0 (0.0%) |
| 18 to 34 Years | 0 (0.0%) | 8 (4.3%) |
| 35 to 64 Years | 96 (23.6%) | 91 (21.7%) |
| 65 to 74 Years | 35 (50.7%) | 5 (6.4%) |
| 75 Years and over | 3 (6.5%) | 15 (26.3%) |
Disability Class: Self-Care Difficulty
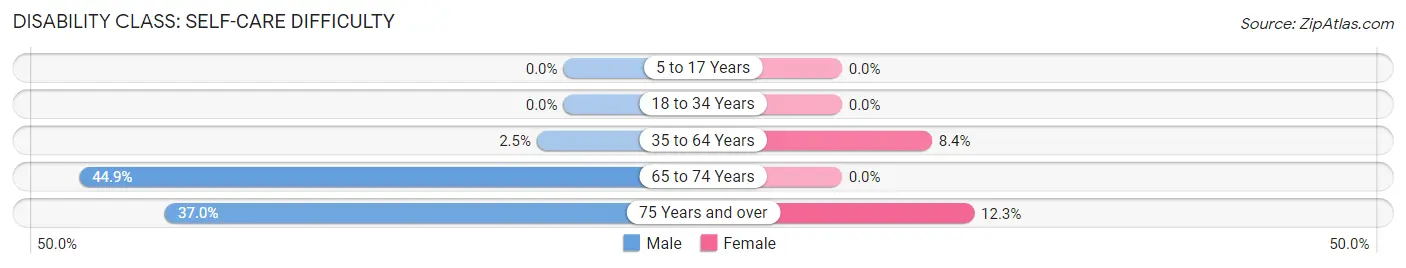
| Age Bracket | Male | Female |
| 5 to 17 Years | 0 (0.0%) | 0 (0.0%) |
| 18 to 34 Years | 0 (0.0%) | 0 (0.0%) |
| 35 to 64 Years | 10 (2.5%) | 35 (8.4%) |
| 65 to 74 Years | 31 (44.9%) | 0 (0.0%) |
| 75 Years and over | 17 (37.0%) | 7 (12.3%) |
Technology Access in Bridgeport
Computing Device Access in Bridgeport
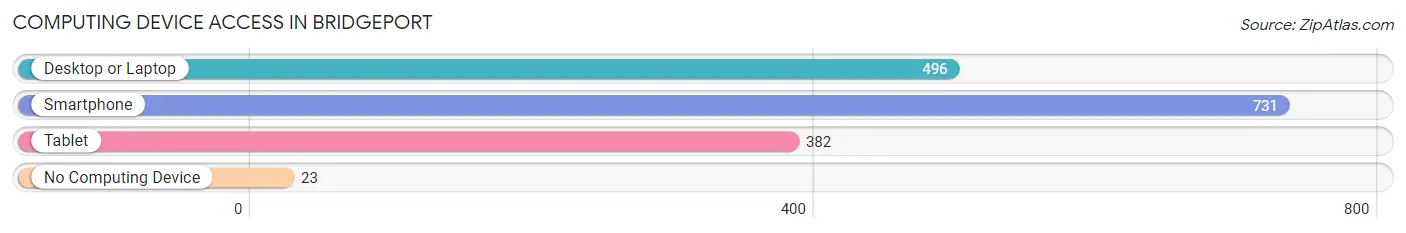
| Device Type | # Households | % Households |
| Desktop or Laptop | 496 | 60.5% |
| Smartphone | 731 | 89.1% |
| Tablet | 382 | 46.6% |
| No Computing Device | 23 | 2.8% |
| Total | 820 | 100.0% |
Internet Access in Bridgeport
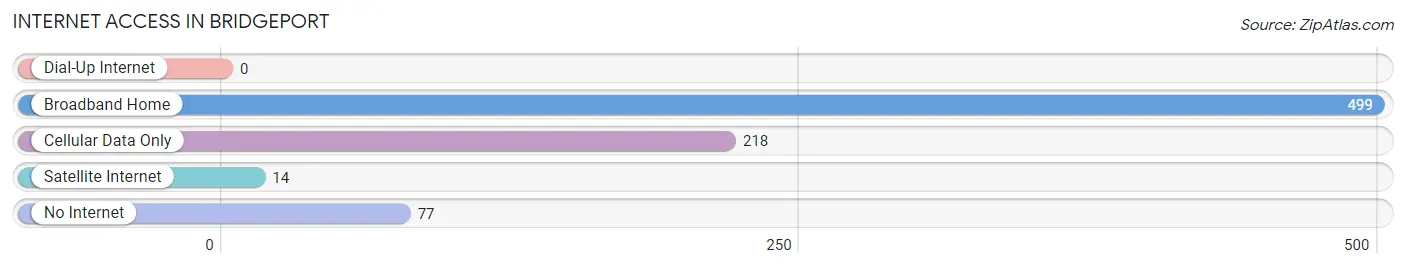
| Internet Type | # Households | % Households |
| Dial-Up Internet | 0 | 0.0% |
| Broadband Home | 499 | 60.9% |
| Cellular Data Only | 218 | 26.6% |
| Satellite Internet | 14 | 1.7% |
| No Internet | 77 | 9.4% |
| Total | 820 | 100.0% |
Bridgeport Summary
Bridgeport, Illinois is a small city located in Lawrence County, Illinois. It is situated on the banks of the Embarras River, and is the county seat of Lawrence County. The city has a population of approximately 1,500 people, and is part of the larger Decatur Metropolitan Statistical Area.
History
Bridgeport was founded in 1819 by a group of settlers from Kentucky. The city was named after the bridge that was built over the Embarras River. The bridge was built by a man named John Bridge, who was a local entrepreneur. The city was incorporated in 1837, and was the first city in Lawrence County.
In the late 19th century, Bridgeport was a thriving industrial center. It was home to several factories, including a flour mill, a sawmill, a brickyard, and a furniture factory. The city also had a railroad station, which connected it to the rest of the state.
Geography
Bridgeport is located in the southeastern part of Lawrence County, Illinois. It is situated on the banks of the Embarras River, and is surrounded by rolling hills and farmland. The city has a total area of 1.2 square miles, all of which is land.
The climate in Bridgeport is characterized by hot, humid summers and cold, wet winters. The average annual temperature is 54 degrees Fahrenheit, and the average annual precipitation is 40 inches.
Economy
The economy of Bridgeport is largely based on agriculture and manufacturing. The city is home to several factories, including a flour mill, a sawmill, a brickyard, and a furniture factory. The city also has a railroad station, which connects it to the rest of the state.
The city is also home to several small businesses, including restaurants, retail stores, and service providers. The city also has a small tourism industry, with several attractions, such as the Embarras River Museum and the Lawrence County Historical Society.
Demographics
As of the 2010 census, the population of Bridgeport was 1,500 people. The racial makeup of the city was 97.3% White, 0.7% African American, 0.3% Native American, 0.3% Asian, and 1.3% from other races. The median household income was $37,500, and the median family income was $45,000.
The city has a high rate of poverty, with 28.3% of the population living below the poverty line. The unemployment rate is also high, at 8.3%. The city has a high rate of crime, with a violent crime rate of 8.3 per 1,000 people.
Conclusion
Bridgeport, Illinois is a small city located in Lawrence County, Illinois. It is situated on the banks of the Embarras River, and is the county seat of Lawrence County. The city has a population of approximately 1,500 people, and is part of the larger Decatur Metropolitan Statistical Area. The economy of Bridgeport is largely based on agriculture and manufacturing, and the city is home to several small businesses. The city has a high rate of poverty, with 28.3% of the population living below the poverty line. The city also has a high rate of crime, with a violent crime rate of 8.3 per 1,000 people.
Common Questions
What is Per Capita Income in Bridgeport?
Per Capita income in Bridgeport is $33,626.
What is the Median Family Income in Bridgeport?
Median Family Income in Bridgeport is $49,861.
What is the Median Household income in Bridgeport?
Median Household Income in Bridgeport is $47,778.
What is Income or Wage Gap in Bridgeport?
Income or Wage Gap in Bridgeport is 41.1%.
Women in Bridgeport earn 58.9 cents for every dollar earned by a man.
What is Inequality or Gini Index in Bridgeport?
Inequality or Gini Index in Bridgeport is 0.51.
What is the Total Population of Bridgeport?
Total Population of Bridgeport is 2,030.
What is the Total Male Population of Bridgeport?
Total Male Population of Bridgeport is 1,083.
What is the Total Female Population of Bridgeport?
Total Female Population of Bridgeport is 947.
What is the Ratio of Males per 100 Females in Bridgeport?
There are 114.36 Males per 100 Females in Bridgeport.
What is the Ratio of Females per 100 Males in Bridgeport?
There are 87.44 Females per 100 Males in Bridgeport.
What is the Median Population Age in Bridgeport?
Median Population Age in Bridgeport is 38.8 Years.
What is the Average Family Size in Bridgeport
Average Family Size in Bridgeport is 3.2 People.
What is the Average Household Size in Bridgeport
Average Household Size in Bridgeport is 2.5 People.
How Large is the Labor Force in Bridgeport?
There are 914 People in the Labor Forcein in Bridgeport.
What is the Percentage of People in the Labor Force in Bridgeport?
59.1% of People are in the Labor Force in Bridgeport.
What is the Unemployment Rate in Bridgeport?
Unemployment Rate in Bridgeport is 9.1%.