Bingham, IL Map & Demographics
Bingham Map
Bingham Overview
$16,518
PER CAPITA INCOME
$55,833
AVG FAMILY INCOME
$48,750
AVG HOUSEHOLD INCOME
0.40
INEQUALITY / GINI INDEX
141
TOTAL POPULATION
76
MALE POPULATION
65
FEMALE POPULATION
116.92
MALES / 100 FEMALES
85.53
FEMALES / 100 MALES
36.4
MEDIAN AGE
4.7
AVG FAMILY SIZE
3.4
AVG HOUSEHOLD SIZE
57
LABOR FORCE [ PEOPLE ]
57.0%
PERCENT IN LABOR FORCE
Bingham Zip Codes
Income in Bingham
Income Overview in Bingham
Per Capita Income in Bingham is $16,518, while median incomes of families and households are $55,833 and $48,750 respectively.
| Characteristic | Number | Measure |
| Per Capita Income | 141 | $16,518 |
| Median Family Income | 24 | $55,833 |
| Mean Family Income | 24 | $60,054 |
| Median Household Income | 42 | $48,750 |
| Mean Household Income | 42 | $47,826 |
| Income Deficit | 24 | $0 |
| Wage / Income Gap (%) | 141 | 0.00% |
| Wage / Income Gap ($) | 141 | 100.00¢ per $1 |
| Gini / Inequality Index | 141 | 0.40 |
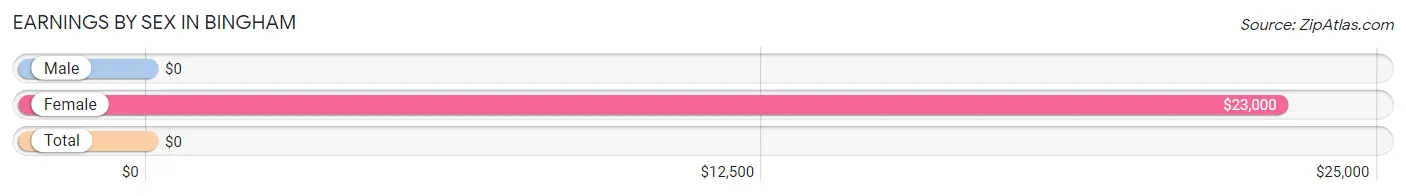
Earnings by Sex in Bingham
| Sex | Number | Average Earnings |
| Male | 31 (52.5%) | $0 |
| Female | 28 (47.5%) | $23,000 |
| Total | 59 (100.0%) | $0 |
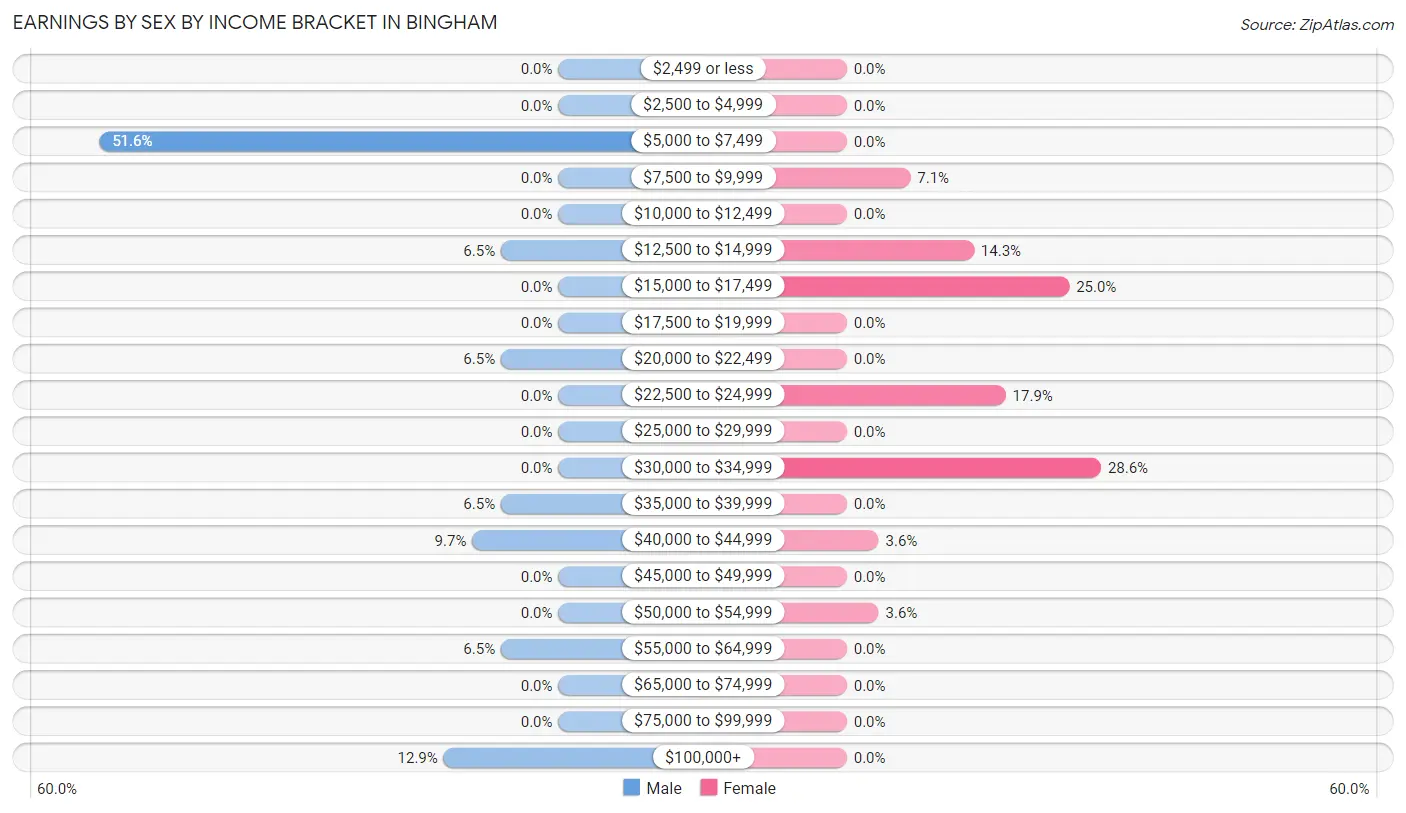
Earnings by Sex by Income Bracket in Bingham
The most common earnings brackets in Bingham are $5,000 to $7,499 for men (16 | 51.6%) and $30,000 to $34,999 for women (8 | 28.6%).
| Income | Male | Female |
| $2,499 or less | 0 (0.0%) | 0 (0.0%) |
| $2,500 to $4,999 | 0 (0.0%) | 0 (0.0%) |
| $5,000 to $7,499 | 16 (51.6%) | 0 (0.0%) |
| $7,500 to $9,999 | 0 (0.0%) | 2 (7.1%) |
| $10,000 to $12,499 | 0 (0.0%) | 0 (0.0%) |
| $12,500 to $14,999 | 2 (6.5%) | 4 (14.3%) |
| $15,000 to $17,499 | 0 (0.0%) | 7 (25.0%) |
| $17,500 to $19,999 | 0 (0.0%) | 0 (0.0%) |
| $20,000 to $22,499 | 2 (6.5%) | 0 (0.0%) |
| $22,500 to $24,999 | 0 (0.0%) | 5 (17.9%) |
| $25,000 to $29,999 | 0 (0.0%) | 0 (0.0%) |
| $30,000 to $34,999 | 0 (0.0%) | 8 (28.6%) |
| $35,000 to $39,999 | 2 (6.5%) | 0 (0.0%) |
| $40,000 to $44,999 | 3 (9.7%) | 1 (3.6%) |
| $45,000 to $49,999 | 0 (0.0%) | 0 (0.0%) |
| $50,000 to $54,999 | 0 (0.0%) | 1 (3.6%) |
| $55,000 to $64,999 | 2 (6.5%) | 0 (0.0%) |
| $65,000 to $74,999 | 0 (0.0%) | 0 (0.0%) |
| $75,000 to $99,999 | 0 (0.0%) | 0 (0.0%) |
| $100,000+ | 4 (12.9%) | 0 (0.0%) |
| Total | 31 (100.0%) | 28 (100.0%) |
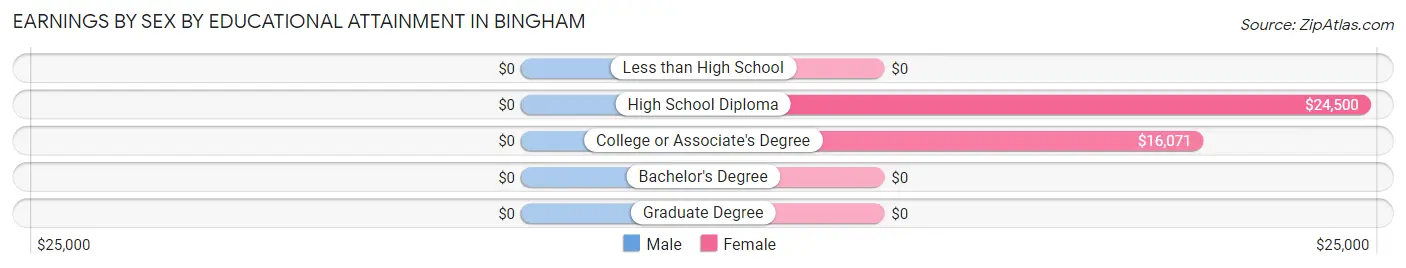
Earnings by Sex by Educational Attainment in Bingham
| Educational Attainment | Male Income | Female Income |
| Less than High School | - | - |
| High School Diploma | - | - |
| College or Associate's Degree | - | - |
| Bachelor's Degree | - | - |
| Graduate Degree | - | - |
| Total | - | - |
Family Income in Bingham
Family Income Brackets in Bingham
According to the Bingham family income data, there are 7 families falling into the $50,000 to $74,999 income range, which is the most common income bracket and makes up 29.2% of all families.
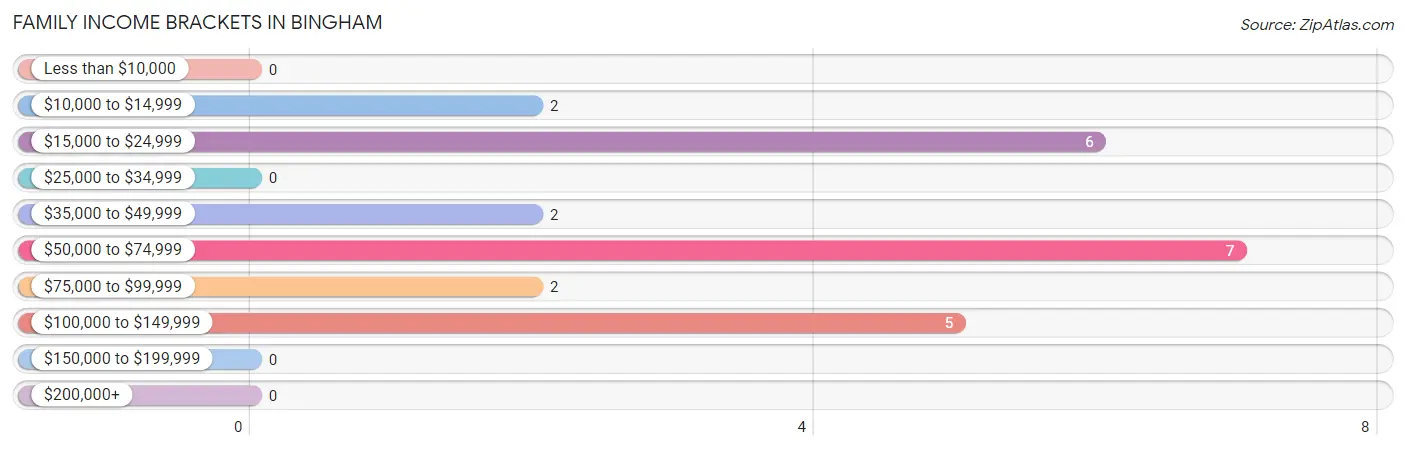
| Income Bracket | # Families | % Families |
| Less than $10,000 | 0 | 0.0% |
| $10,000 to $14,999 | 2 | 8.3% |
| $15,000 to $24,999 | 6 | 25.0% |
| $25,000 to $34,999 | 0 | 0.0% |
| $35,000 to $49,999 | 2 | 8.3% |
| $50,000 to $74,999 | 7 | 29.2% |
| $75,000 to $99,999 | 2 | 8.3% |
| $100,000 to $149,999 | 5 | 20.8% |
| $150,000 to $199,999 | 0 | 0.0% |
| $200,000+ | 0 | 0.0% |
Family Income by Famaliy Size in Bingham
3-person families (4 | 16.7%) account for the highest median family income in Bingham with $93,750 per family, while 3-person families (4 | 16.7%) have the highest median income of $31,250 per family member.
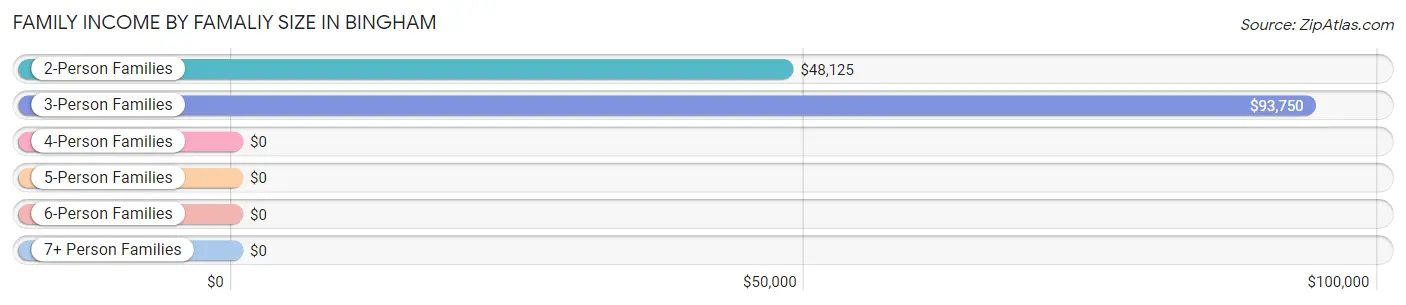
| Income Bracket | # Families | Median Income |
| 2-Person Families | 5 (20.8%) | $48,125 |
| 3-Person Families | 4 (16.7%) | $93,750 |
| 4-Person Families | 9 (37.5%) | $0 |
| 5-Person Families | 0 (0.0%) | $0 |
| 6-Person Families | 6 (25.0%) | $0 |
| 7+ Person Families | 0 (0.0%) | $0 |
| Total | 24 (100.0%) | $55,833 |
Family Income by Number of Earners in Bingham
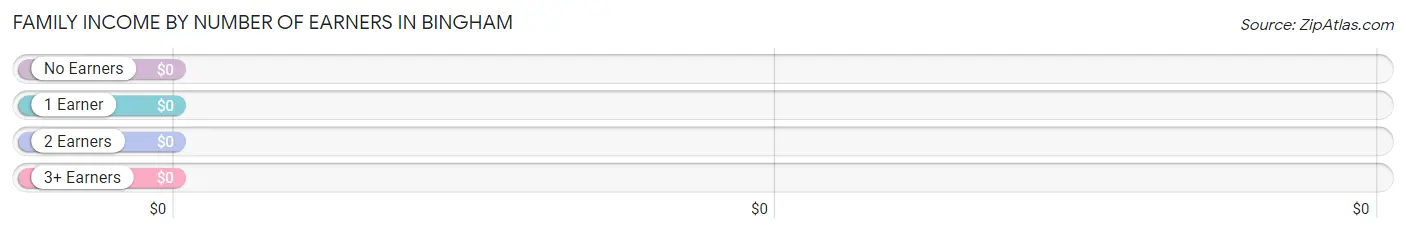
| Number of Earners | # Families | Median Income |
| No Earners | 0 (0.0%) | $0 |
| 1 Earner | 16 (66.7%) | $0 |
| 2 Earners | 5 (20.8%) | $0 |
| 3+ Earners | 3 (12.5%) | $0 |
| Total | 24 (100.0%) | $55,833 |
Household Income in Bingham
Household Income Brackets in Bingham
With 13 households falling in the category, the $50,000 to $74,999 income range is the most frequent in Bingham, accounting for 30.9% of all households.
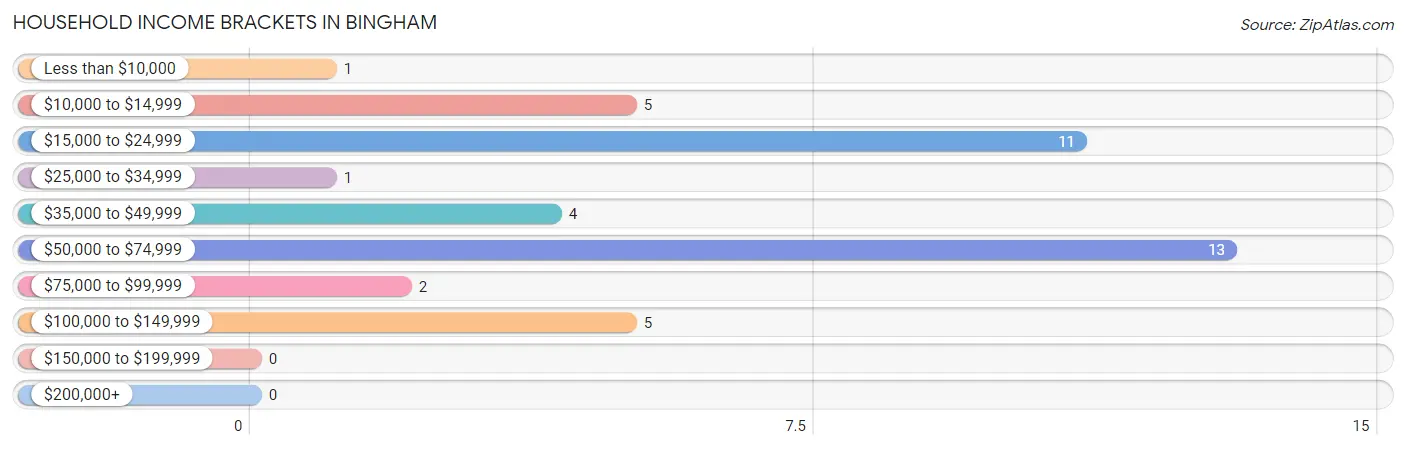
| Income Bracket | # Households | % Households |
| Less than $10,000 | 1 | 2.4% |
| $10,000 to $14,999 | 5 | 11.9% |
| $15,000 to $24,999 | 11 | 26.2% |
| $25,000 to $34,999 | 1 | 2.4% |
| $35,000 to $49,999 | 4 | 9.5% |
| $50,000 to $74,999 | 13 | 31.0% |
| $75,000 to $99,999 | 2 | 4.8% |
| $100,000 to $149,999 | 5 | 11.9% |
| $150,000 to $199,999 | 0 | 0.0% |
| $200,000+ | 0 | 0.0% |
Household Income by Householder Age in Bingham
The median household income in Bingham is $48,750, with the highest median household income of $56,250 found in the 45 to 64 years age bracket for the primary householder. A total of 7 households (16.7%) fall into this category.
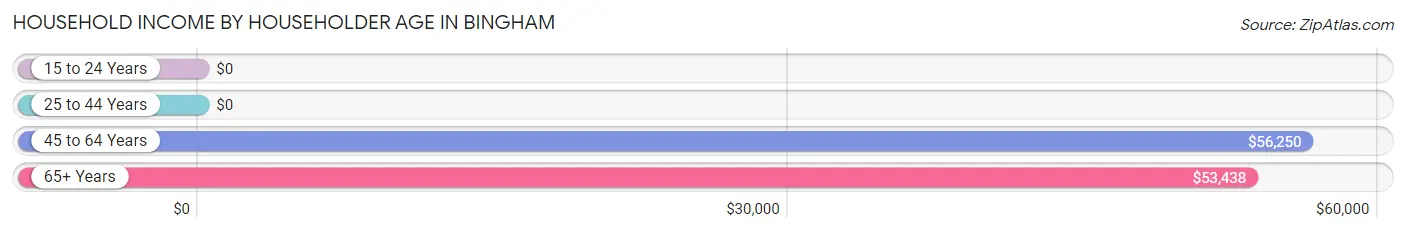
| Income Bracket | # Households | Median Income |
| 15 to 24 Years | 0 (0.0%) | $0 |
| 25 to 44 Years | 18 (42.9%) | $0 |
| 45 to 64 Years | 7 (16.7%) | $56,250 |
| 65+ Years | 17 (40.5%) | $53,438 |
| Total | 42 (100.0%) | $48,750 |
Poverty in Bingham
Income Below Poverty by Sex and Age in Bingham
With 26.3% poverty level for males and 49.2% for females among the residents of Bingham, 5 year old males and 6 to 11 year old females are the most vulnerable to poverty, with 5 males (100.0%) and 18 females (85.7%) in their respective age groups living below the poverty level.
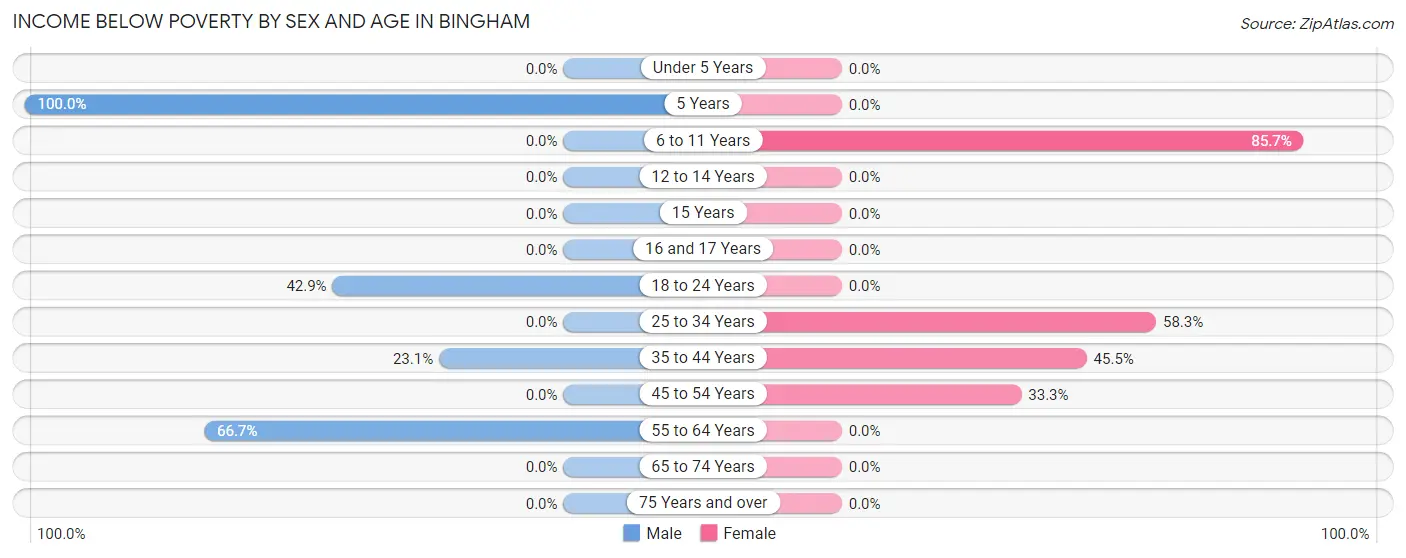
| Age Bracket | Male | Female |
| Under 5 Years | 0 (0.0%) | 0 (0.0%) |
| 5 Years | 5 (100.0%) | 0 (0.0%) |
| 6 to 11 Years | 0 (0.0%) | 18 (85.7%) |
| 12 to 14 Years | 0 (0.0%) | 0 (0.0%) |
| 15 Years | 0 (0.0%) | 0 (0.0%) |
| 16 and 17 Years | 0 (0.0%) | 0 (0.0%) |
| 18 to 24 Years | 3 (42.9%) | 0 (0.0%) |
| 25 to 34 Years | 0 (0.0%) | 7 (58.3%) |
| 35 to 44 Years | 6 (23.1%) | 5 (45.5%) |
| 45 to 54 Years | 0 (0.0%) | 2 (33.3%) |
| 55 to 64 Years | 6 (66.7%) | 0 (0.0%) |
| 65 to 74 Years | 0 (0.0%) | 0 (0.0%) |
| 75 Years and over | 0 (0.0%) | 0 (0.0%) |
| Total | 20 (26.3%) | 32 (49.2%) |
Income Above Poverty by Sex and Age in Bingham
According to the poverty statistics in Bingham, males aged 6 to 11 years and females aged 16 and 17 years are the age groups that are most secure financially, with 100.0% of males and 100.0% of females in these age groups living above the poverty line.
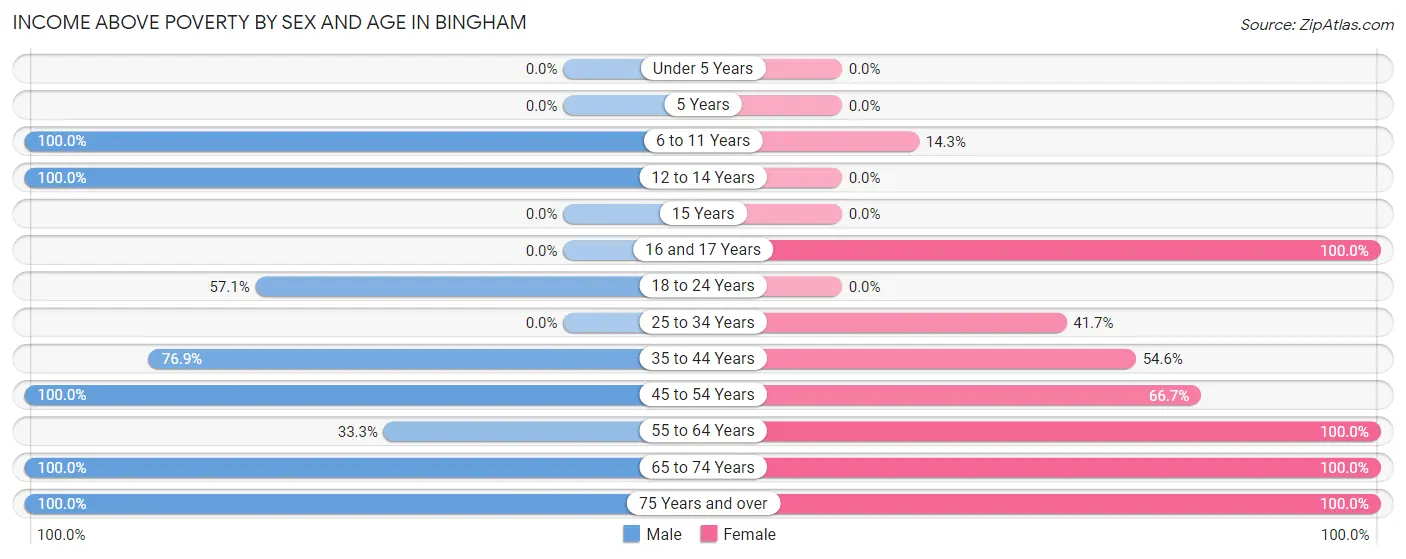
| Age Bracket | Male | Female |
| Under 5 Years | 0 (0.0%) | 0 (0.0%) |
| 5 Years | 0 (0.0%) | 0 (0.0%) |
| 6 to 11 Years | 6 (100.0%) | 3 (14.3%) |
| 12 to 14 Years | 9 (100.0%) | 0 (0.0%) |
| 15 Years | 0 (0.0%) | 0 (0.0%) |
| 16 and 17 Years | 0 (0.0%) | 1 (100.0%) |
| 18 to 24 Years | 4 (57.1%) | 0 (0.0%) |
| 25 to 34 Years | 0 (0.0%) | 5 (41.7%) |
| 35 to 44 Years | 20 (76.9%) | 6 (54.5%) |
| 45 to 54 Years | 7 (100.0%) | 4 (66.7%) |
| 55 to 64 Years | 3 (33.3%) | 4 (100.0%) |
| 65 to 74 Years | 4 (100.0%) | 9 (100.0%) |
| 75 Years and over | 3 (100.0%) | 1 (100.0%) |
| Total | 56 (73.7%) | 33 (50.8%) |
Income Below Poverty Among Married-Couple Families in Bingham
The poverty statistics for married-couple families in Bingham show that 37.5% or 6 of the total 16 families live below the poverty line. Families with 3 or 4 children have the highest poverty rate of 100.0%, comprising of 6 families. On the other hand, families with no children have the lowest poverty rate of 0.0%, which includes 0 families.
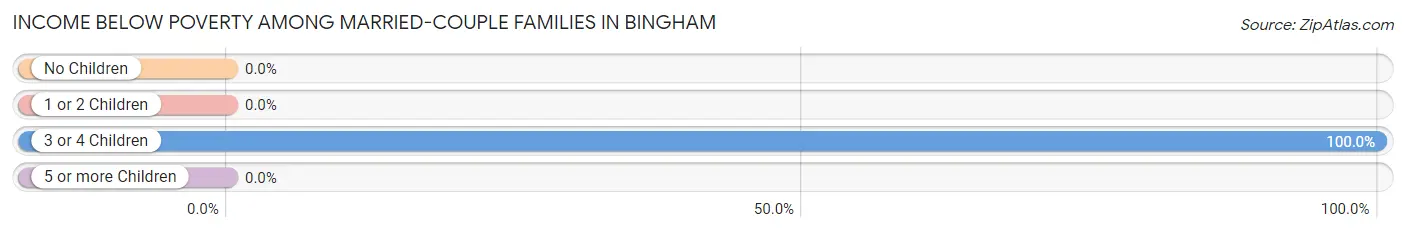
| Children | Above Poverty | Below Poverty |
| No Children | 6 (100.0%) | 0 (0.0%) |
| 1 or 2 Children | 4 (100.0%) | 0 (0.0%) |
| 3 or 4 Children | 0 (0.0%) | 6 (100.0%) |
| 5 or more Children | 0 (0.0%) | 0 (0.0%) |
| Total | 10 (62.5%) | 6 (37.5%) |
Income Below Poverty Among Single-Parent Households in Bingham
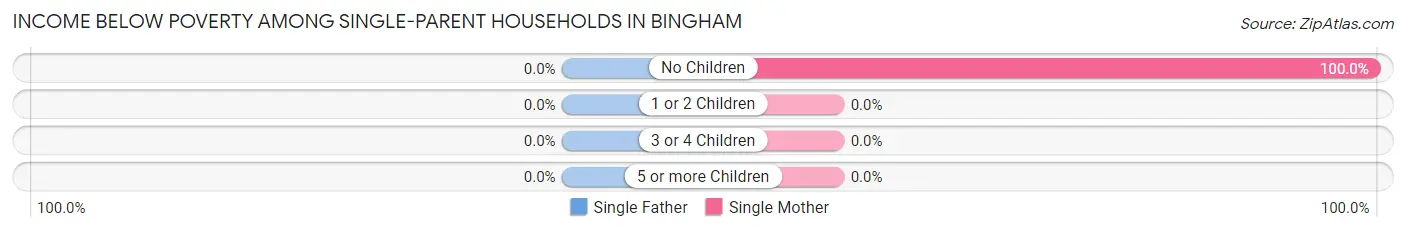
| Children | Single Father | Single Mother |
| No Children | 0 (0.0%) | 2 (100.0%) |
| 1 or 2 Children | 0 (0.0%) | 0 (0.0%) |
| 3 or 4 Children | 0 (0.0%) | 0 (0.0%) |
| 5 or more Children | 0 (0.0%) | 0 (0.0%) |
| Total | 0 (0.0%) | 2 (28.6%) |
Income Below Poverty Among Married-Couple vs Single-Parent Households in Bingham
The poverty data for Bingham shows that 6 of the married-couple family households (37.5%) and 2 of the single-parent households (25.0%) are living below the poverty level. Within the married-couple family households, those with 3 or 4 children have the highest poverty rate, with 6 households (100.0%) falling below the poverty line. Among the single-parent households, those with no children have the highest poverty rate, with 2 household (100.0%) living below poverty.
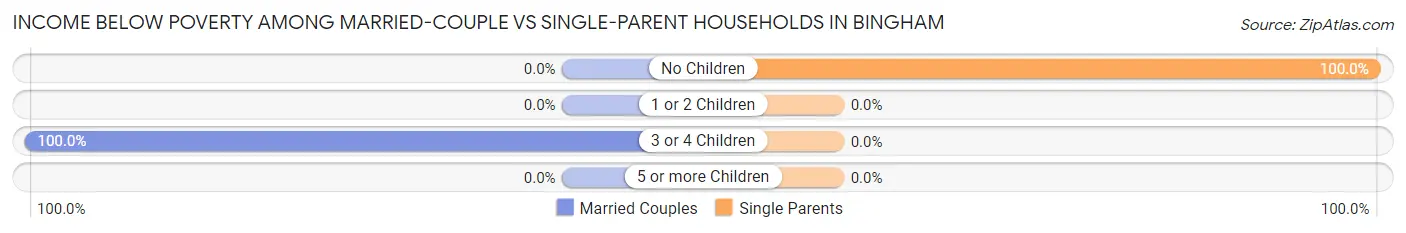
| Children | Married-Couple Families | Single-Parent Households |
| No Children | 0 (0.0%) | 2 (100.0%) |
| 1 or 2 Children | 0 (0.0%) | 0 (0.0%) |
| 3 or 4 Children | 6 (100.0%) | 0 (0.0%) |
| 5 or more Children | 0 (0.0%) | 0 (0.0%) |
| Total | 6 (37.5%) | 2 (25.0%) |
Race in Bingham
The most populous races in Bingham are White / Caucasian (137 | 97.2%), Hispanic or Latino (18 | 12.8%), and Two or more Races (4 | 2.8%).
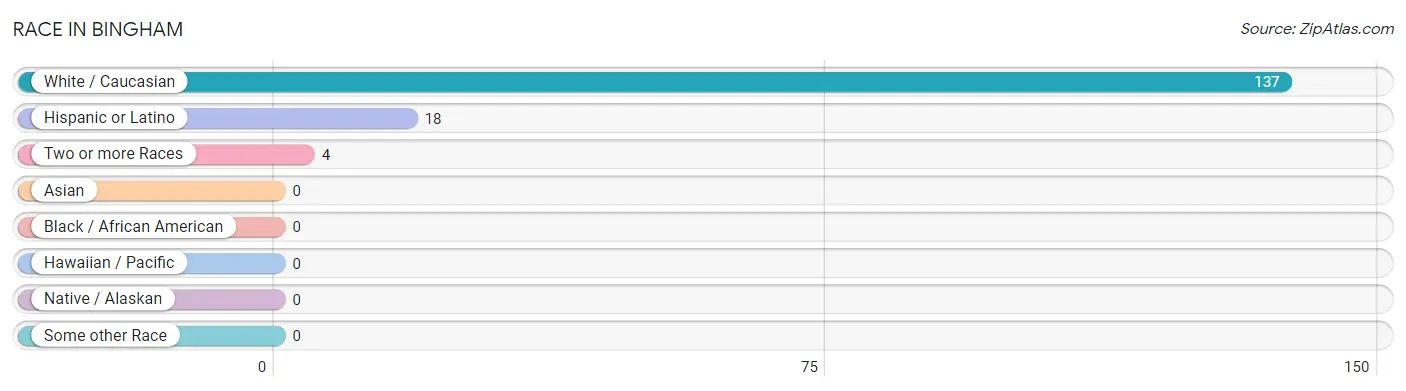
| Race | # Population | % Population |
| Asian | 0 | 0.0% |
| Black / African American | 0 | 0.0% |
| Hawaiian / Pacific | 0 | 0.0% |
| Hispanic or Latino | 18 | 12.8% |
| Native / Alaskan | 0 | 0.0% |
| White / Caucasian | 137 | 97.2% |
| Two or more Races | 4 | 2.8% |
| Some other Race | 0 | 0.0% |
| Total | 141 | 100.0% |
Ancestry in Bingham
The most populous ancestries reported in Bingham are German (49 | 34.7%), American (23 | 16.3%), Mexican (18 | 12.8%), Italian (8 | 5.7%), and Irish (5 | 3.5%), together accounting for 73.0% of all Bingham residents.
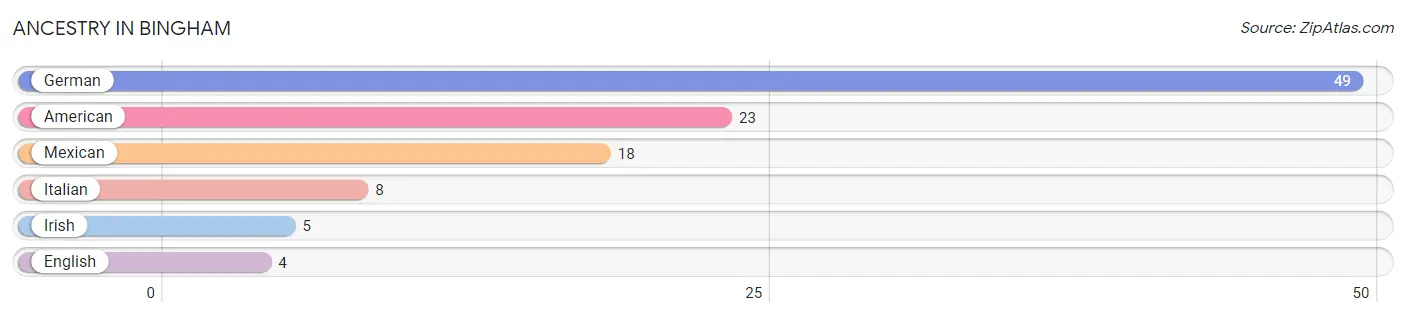
| Ancestry | # Population | % Population |
| American | 23 | 16.3% |
| English | 4 | 2.8% |
| German | 49 | 34.7% |
| Irish | 5 | 3.5% |
| Italian | 8 | 5.7% |
| Mexican | 18 | 12.8% | View All 6 Rows |
Immigrants in Bingham

| Immigration Origin | # Population | % Population | View All 0 Rows |
Sex and Age in Bingham
Sex and Age in Bingham
The most populous age groups in Bingham are 35 to 39 Years (22 | 28.9%) for men and 10 to 14 Years (15 | 23.1%) for women.
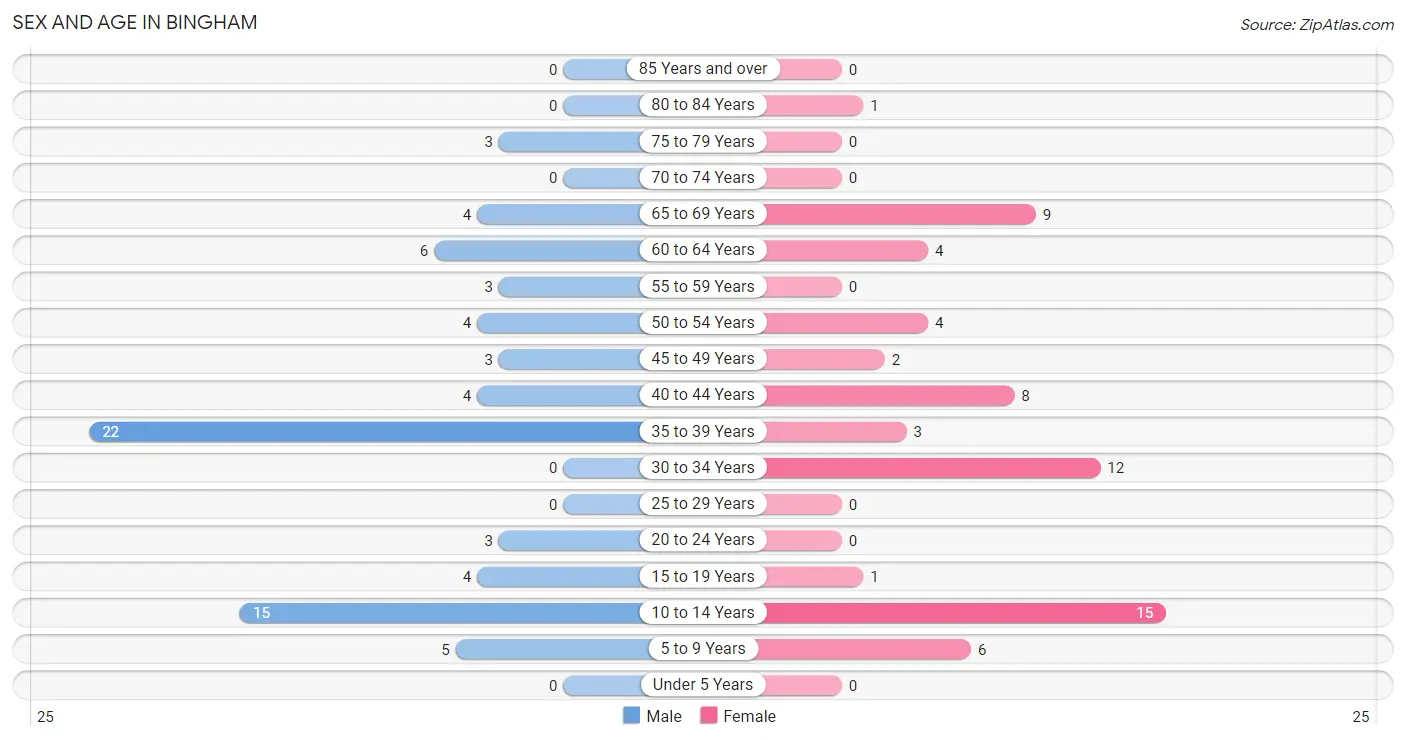
| Age Bracket | Male | Female |
| Under 5 Years | 0 (0.0%) | 0 (0.0%) |
| 5 to 9 Years | 5 (6.6%) | 6 (9.2%) |
| 10 to 14 Years | 15 (19.7%) | 15 (23.1%) |
| 15 to 19 Years | 4 (5.3%) | 1 (1.5%) |
| 20 to 24 Years | 3 (4.0%) | 0 (0.0%) |
| 25 to 29 Years | 0 (0.0%) | 0 (0.0%) |
| 30 to 34 Years | 0 (0.0%) | 12 (18.5%) |
| 35 to 39 Years | 22 (28.9%) | 3 (4.6%) |
| 40 to 44 Years | 4 (5.3%) | 8 (12.3%) |
| 45 to 49 Years | 3 (4.0%) | 2 (3.1%) |
| 50 to 54 Years | 4 (5.3%) | 4 (6.1%) |
| 55 to 59 Years | 3 (4.0%) | 0 (0.0%) |
| 60 to 64 Years | 6 (7.9%) | 4 (6.1%) |
| 65 to 69 Years | 4 (5.3%) | 9 (13.9%) |
| 70 to 74 Years | 0 (0.0%) | 0 (0.0%) |
| 75 to 79 Years | 3 (4.0%) | 0 (0.0%) |
| 80 to 84 Years | 0 (0.0%) | 1 (1.5%) |
| 85 Years and over | 0 (0.0%) | 0 (0.0%) |
| Total | 76 (100.0%) | 65 (100.0%) |
Families and Households in Bingham
Median Family Size in Bingham
The median family size in Bingham is 4.67 persons per family, with single male/father families (1 | 4.2%) accounting for the largest median family size of 6 persons per family. On the other hand, married-couple families (16 | 66.7%) represent the smallest median family size with 4.31 persons per family.
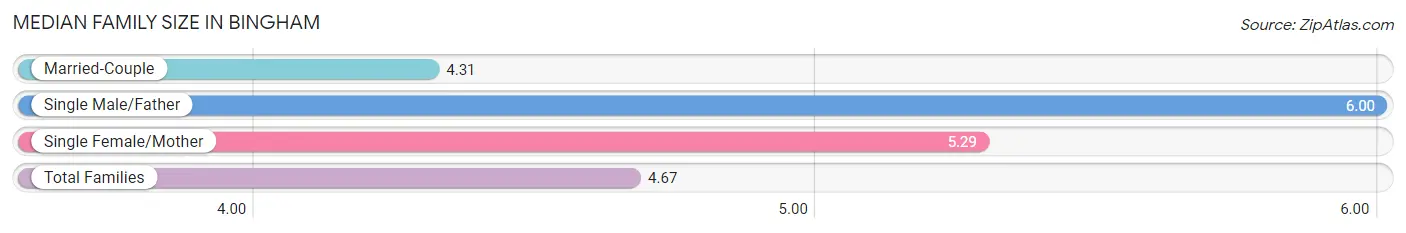
| Family Type | # Families | Family Size |
| Married-Couple | 16 (66.7%) | 4.31 |
| Single Male/Father | 1 (4.2%) | 6.00 |
| Single Female/Mother | 7 (29.2%) | 5.29 |
| Total Families | 24 (100.0%) | 4.67 |
Median Household Size in Bingham
The median household size in Bingham is 3.36 persons per household, with single male/father households (1 | 2.4%) accounting for the largest median household size of 6 persons per household. non-family households (18 | 42.9%) represent the smallest median household size with 1.44 persons per household.
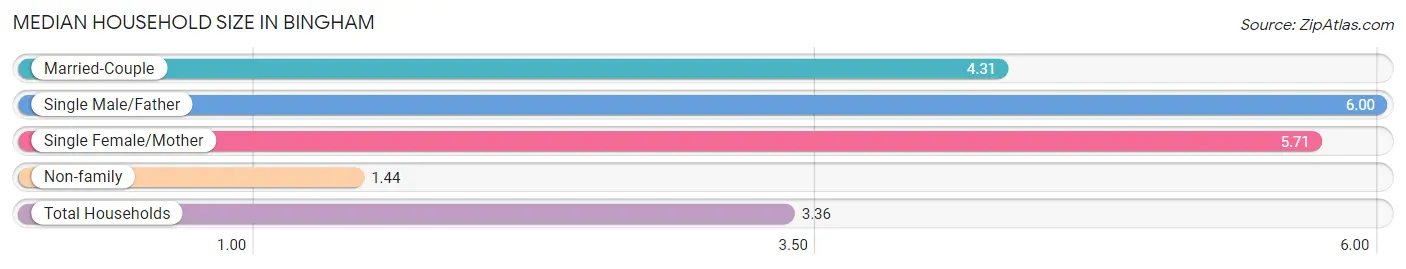
| Household Type | # Households | Household Size |
| Married-Couple | 16 (38.1%) | 4.31 |
| Single Male/Father | 1 (2.4%) | 6.00 |
| Single Female/Mother | 7 (16.7%) | 5.71 |
| Non-family | 18 (42.9%) | 1.44 |
| Total Households | 42 (100.0%) | 3.36 |
Household Size by Marriage Status in Bingham
Out of a total of 42 households in Bingham, 24 (57.1%) are family households, while 18 (42.9%) are nonfamily households. The most numerous type of family households are 4-person households, comprising 9, and the most common type of nonfamily households are 1-person households, comprising 17.
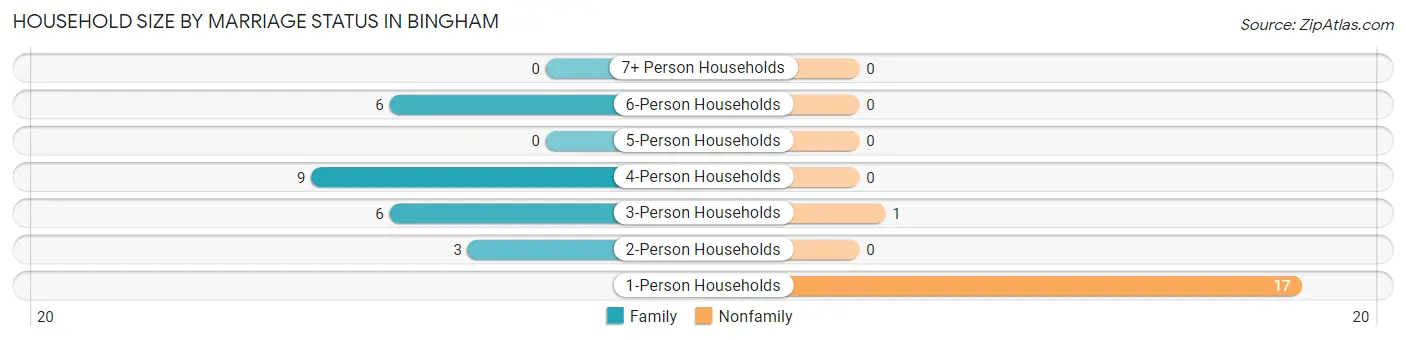
| Household Size | Family Households | Nonfamily Households |
| 1-Person Households | - | 17 (40.5%) |
| 2-Person Households | 3 (7.1%) | 0 (0.0%) |
| 3-Person Households | 6 (14.3%) | 1 (2.4%) |
| 4-Person Households | 9 (21.4%) | 0 (0.0%) |
| 5-Person Households | 0 (0.0%) | 0 (0.0%) |
| 6-Person Households | 6 (14.3%) | 0 (0.0%) |
| 7+ Person Households | 0 (0.0%) | 0 (0.0%) |
| Total | 24 (57.1%) | 18 (42.9%) |
Female Fertility in Bingham
Fertility by Age in Bingham
Average fertility rate in Bingham is 67.0 births per 1,000 women. Women in the age bracket of 35 to 50 years have the highest fertility rate with 118.0 births per 1,000 women. Women in the age bracket of 35 to 50 years acount for 100.0% of all women with births.
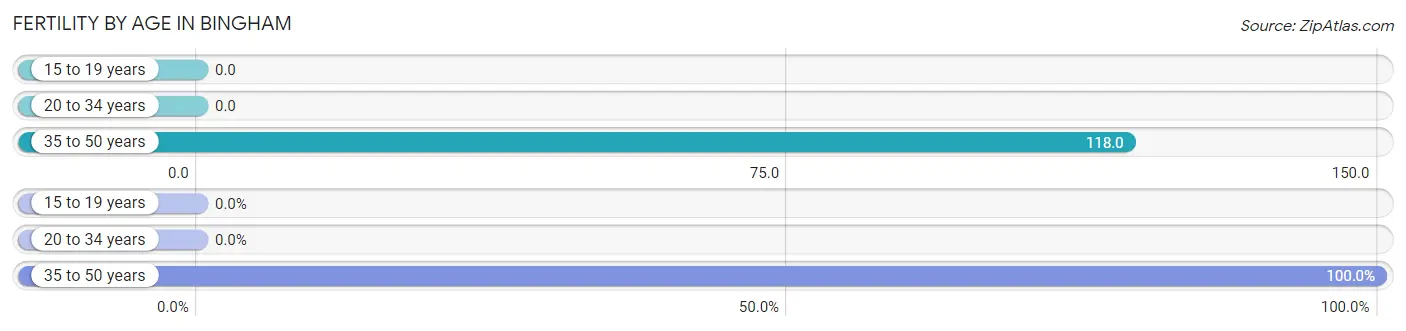
| Age Bracket | Women with Births | Births / 1,000 Women |
| 15 to 19 years | 0 (0.0%) | 0.0 |
| 20 to 34 years | 0 (0.0%) | 0.0 |
| 35 to 50 years | 2 (100.0%) | 118.0 |
| Total | 2 (100.0%) | 67.0 |
Fertility by Age by Marriage Status in Bingham
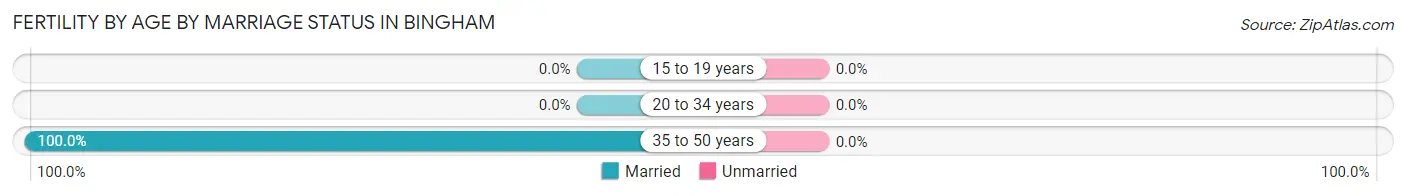
| Age Bracket | Married | Unmarried |
| 15 to 19 years | 0 (0.0%) | 0 (0.0%) |
| 20 to 34 years | 0 (0.0%) | 0 (0.0%) |
| 35 to 50 years | 2 (100.0%) | 0 (0.0%) |
| Total | 2 (100.0%) | 0 (0.0%) |
Fertility by Education in Bingham
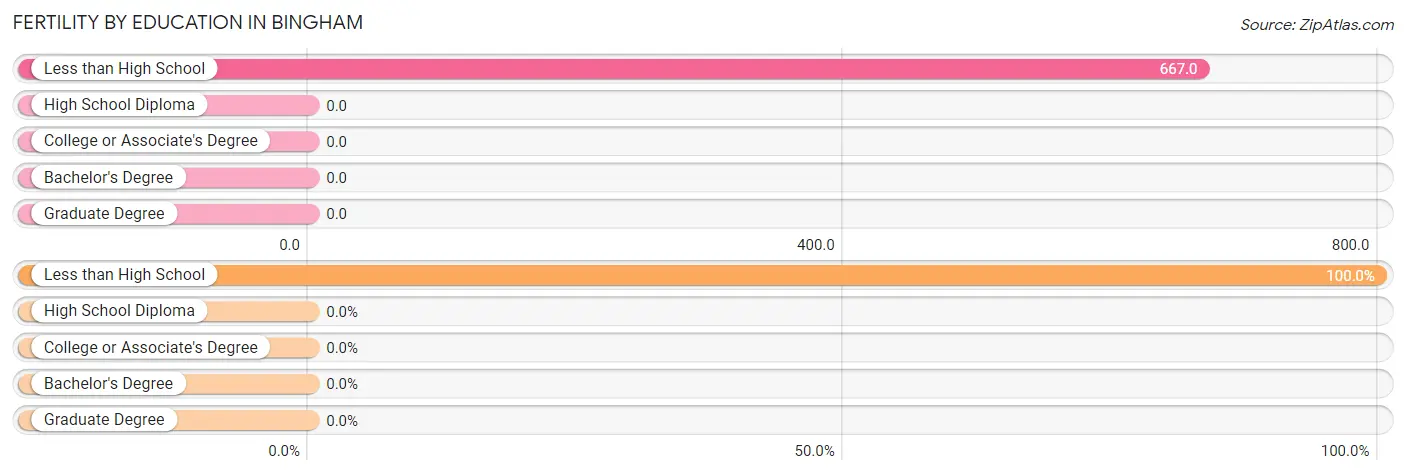
| Educational Attainment | Women with Births | Births / 1,000 Women |
| Less than High School | 2 (100.0%) | 667.0 |
| High School Diploma | 0 (0.0%) | 0.0 |
| College or Associate's Degree | 0 (0.0%) | 0.0 |
| Bachelor's Degree | 0 (0.0%) | 0.0 |
| Graduate Degree | 0 (0.0%) | 0.0 |
| Total | 2 (100.0%) | 67.0 |
Fertility by Education by Marriage Status in Bingham
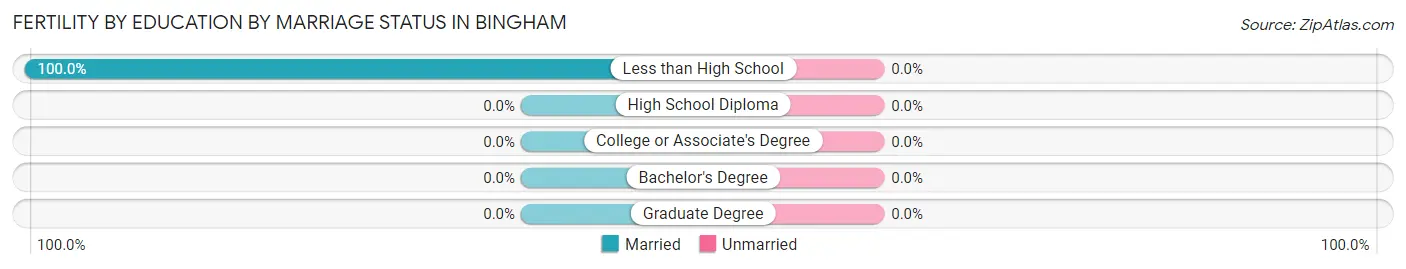
| Educational Attainment | Married | Unmarried |
| Less than High School | 2 (100.0%) | 0 (0.0%) |
| High School Diploma | 0 (0.0%) | 0 (0.0%) |
| College or Associate's Degree | 0 (0.0%) | 0 (0.0%) |
| Bachelor's Degree | 0 (0.0%) | 0 (0.0%) |
| Graduate Degree | 0 (0.0%) | 0 (0.0%) |
| Total | 2 (100.0%) | 0 (0.0%) |
Employment Characteristics in Bingham
Employment by Class of Employer in Bingham
Among the 57 employed individuals in Bingham, private company employees (50 | 87.7%), self-employed (not incorporated) (5 | 8.8%), and local government employees (2 | 3.5%) make up the most common classes of employment.
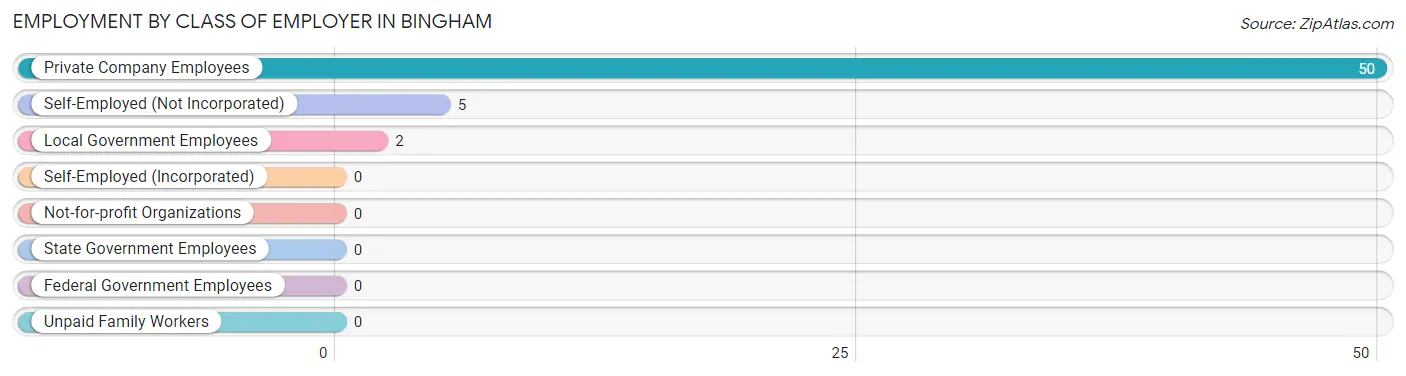
| Employer Class | # Employees | % Employees |
| Private Company Employees | 50 | 87.7% |
| Self-Employed (Incorporated) | 0 | 0.0% |
| Self-Employed (Not Incorporated) | 5 | 8.8% |
| Not-for-profit Organizations | 0 | 0.0% |
| Local Government Employees | 2 | 3.5% |
| State Government Employees | 0 | 0.0% |
| Federal Government Employees | 0 | 0.0% |
| Unpaid Family Workers | 0 | 0.0% |
| Total | 57 | 100.0% |
Employment Status by Age in Bingham
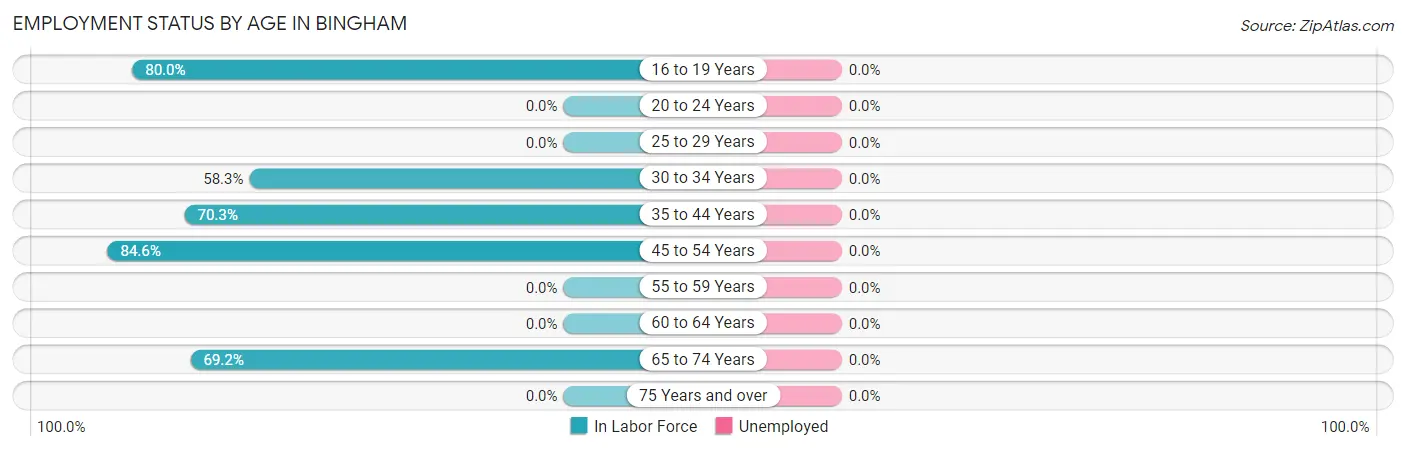
| Age Bracket | In Labor Force | Unemployed |
| 16 to 19 Years | 4 (80.0%) | 0 (0.0%) |
| 20 to 24 Years | 0 (0.0%) | 0 (0.0%) |
| 25 to 29 Years | 0 (0.0%) | 0 (0.0%) |
| 30 to 34 Years | 7 (58.3%) | 0 (0.0%) |
| 35 to 44 Years | 26 (70.3%) | 0 (0.0%) |
| 45 to 54 Years | 11 (84.6%) | 0 (0.0%) |
| 55 to 59 Years | 0 (0.0%) | 0 (0.0%) |
| 60 to 64 Years | 0 (0.0%) | 0 (0.0%) |
| 65 to 74 Years | 9 (69.2%) | 0 (0.0%) |
| 75 Years and over | 0 (0.0%) | 0 (0.0%) |
| Total | 57 (57.0%) | 0 (0.0%) |
Employment Status by Educational Attainment in Bingham
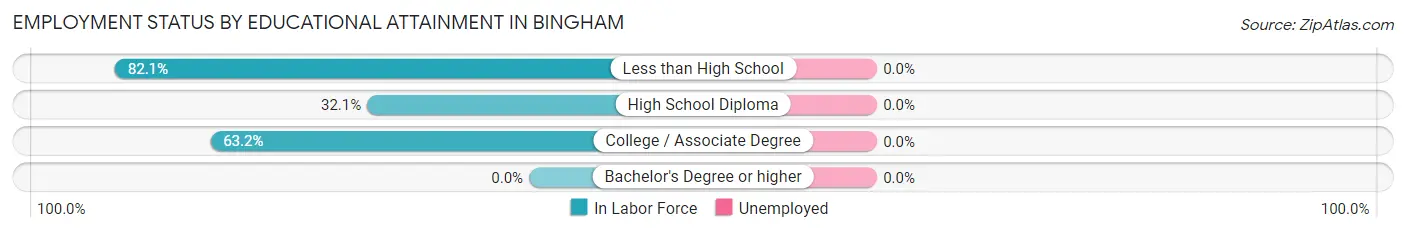
| Educational Attainment | In Labor Force | Unemployed |
| Less than High School | 23 (82.1%) | 0 (0.0%) |
| High School Diploma | 9 (32.1%) | 0 (0.0%) |
| College / Associate Degree | 12 (63.2%) | 0 (0.0%) |
| Bachelor's Degree or higher | 0 (0.0%) | 0 (0.0%) |
| Total | 44 (58.7%) | 0 (0.0%) |
Employment Occupations by Sex in Bingham
Management, Business, Science and Arts Occupations
The most common Management, Business, Science and Arts occupations in Bingham are Management (6 | 10.5%), Community & Social Service (4 | 7.0%), Education Instruction & Library (4 | 7.0%), and Health Diagnosing & Treating (1 | 1.8%).
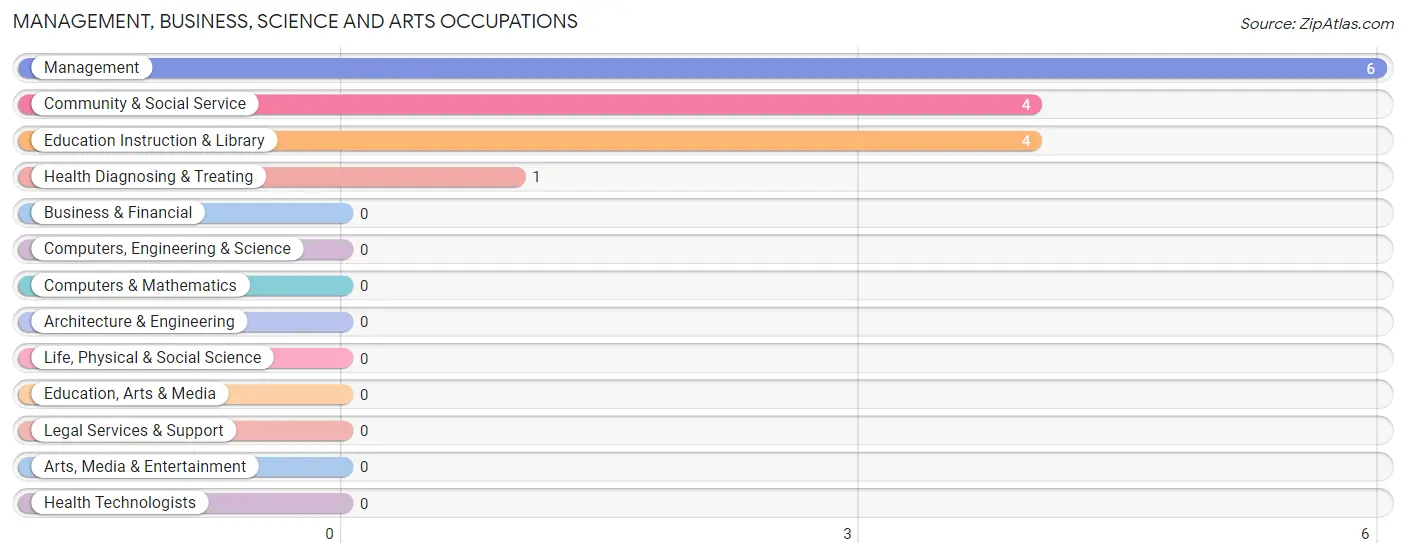
Management, Business, Science and Arts Occupations by Sex
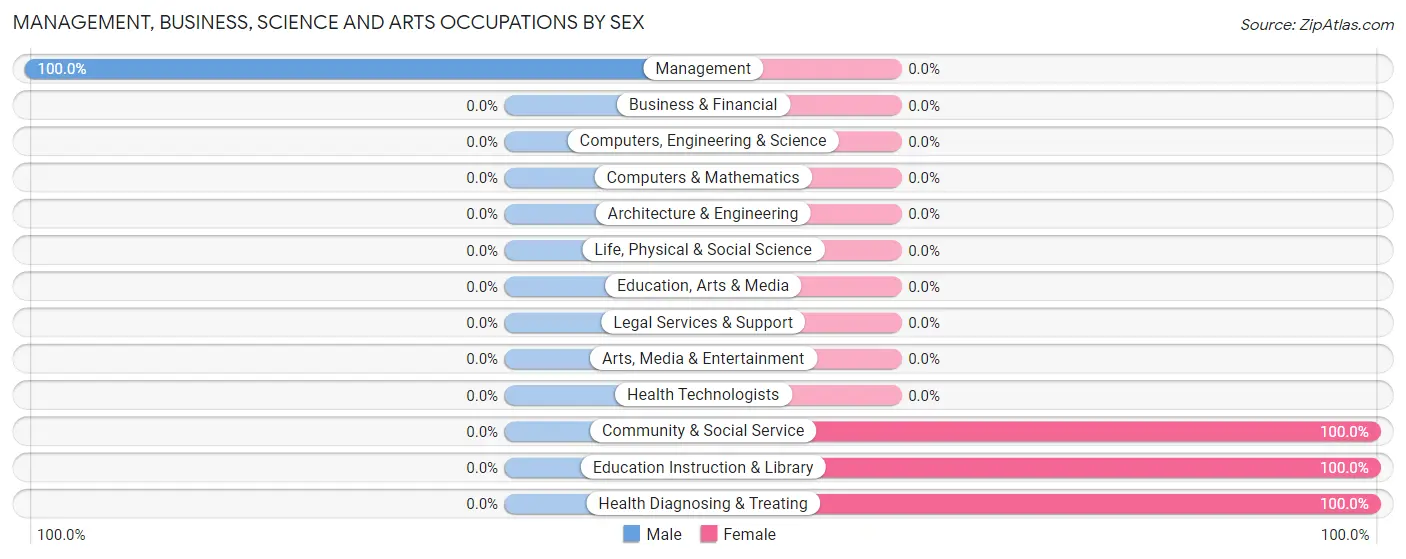
| Occupation | Male | Female |
| Management | 6 (100.0%) | 0 (0.0%) |
| Business & Financial | 0 (0.0%) | 0 (0.0%) |
| Computers, Engineering & Science | 0 (0.0%) | 0 (0.0%) |
| Computers & Mathematics | 0 (0.0%) | 0 (0.0%) |
| Architecture & Engineering | 0 (0.0%) | 0 (0.0%) |
| Life, Physical & Social Science | 0 (0.0%) | 0 (0.0%) |
| Community & Social Service | 0 (0.0%) | 4 (100.0%) |
| Education, Arts & Media | 0 (0.0%) | 0 (0.0%) |
| Legal Services & Support | 0 (0.0%) | 0 (0.0%) |
| Education Instruction & Library | 0 (0.0%) | 4 (100.0%) |
| Arts, Media & Entertainment | 0 (0.0%) | 0 (0.0%) |
| Health Diagnosing & Treating | 0 (0.0%) | 1 (100.0%) |
| Health Technologists | 0 (0.0%) | 0 (0.0%) |
| Total (Category) | 6 (54.5%) | 5 (45.5%) |
| Total (Overall) | 31 (54.4%) | 26 (45.6%) |
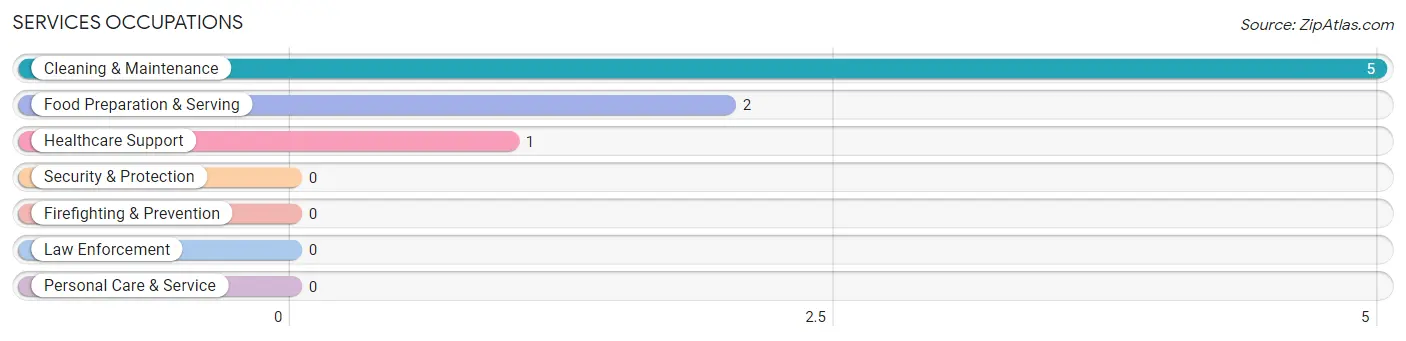
Services Occupations
The most common Services occupations in Bingham are Cleaning & Maintenance (5 | 8.8%), Food Preparation & Serving (2 | 3.5%), and Healthcare Support (1 | 1.8%).
Services Occupations by Sex
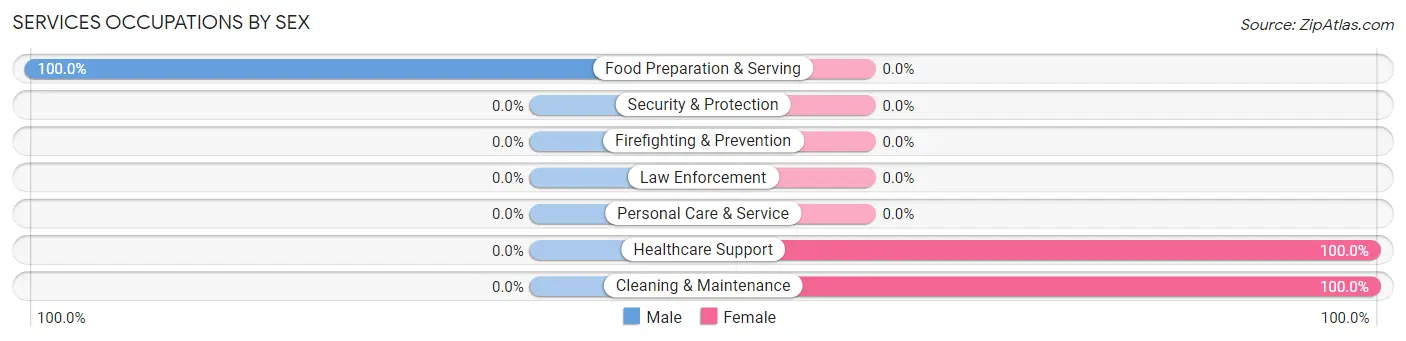
| Occupation | Male | Female |
| Healthcare Support | 0 (0.0%) | 1 (100.0%) |
| Security & Protection | 0 (0.0%) | 0 (0.0%) |
| Firefighting & Prevention | 0 (0.0%) | 0 (0.0%) |
| Law Enforcement | 0 (0.0%) | 0 (0.0%) |
| Food Preparation & Serving | 2 (100.0%) | 0 (0.0%) |
| Cleaning & Maintenance | 0 (0.0%) | 5 (100.0%) |
| Personal Care & Service | 0 (0.0%) | 0 (0.0%) |
| Total (Category) | 2 (25.0%) | 6 (75.0%) |
| Total (Overall) | 31 (54.4%) | 26 (45.6%) |
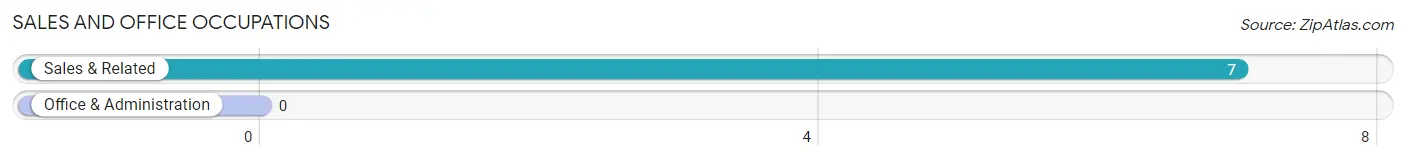
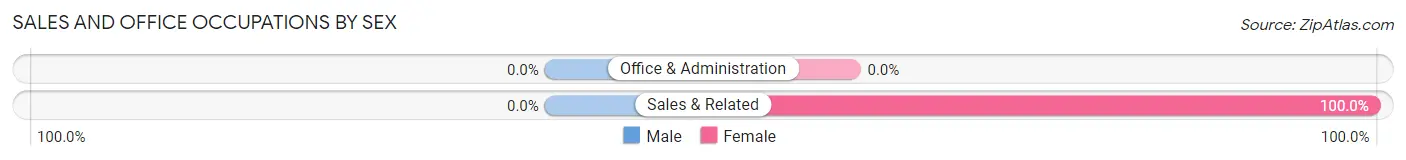
Sales and Office Occupations
The most common Sales and Office occupations in Bingham are , and Sales & Related (7 | 12.3%).
Sales and Office Occupations by Sex
| Occupation | Male | Female |
| Sales & Related | 0 (0.0%) | 7 (100.0%) |
| Office & Administration | 0 (0.0%) | 0 (0.0%) |
| Total (Category) | 0 (0.0%) | 7 (100.0%) |
| Total (Overall) | 31 (54.4%) | 26 (45.6%) |
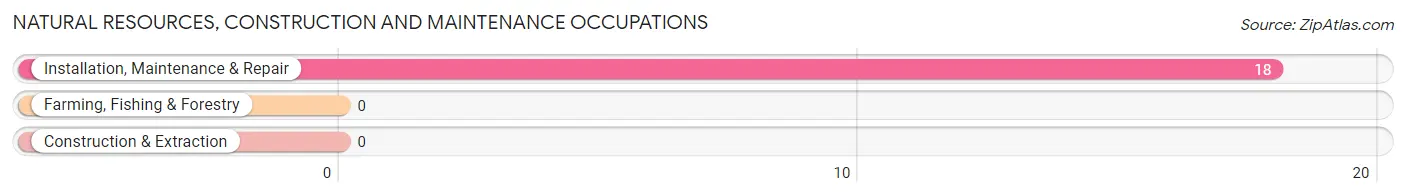
Natural Resources, Construction and Maintenance Occupations
The most common Natural Resources, Construction and Maintenance occupations in Bingham are , and Installation, Maintenance & Repair (18 | 31.6%).
Natural Resources, Construction and Maintenance Occupations by Sex
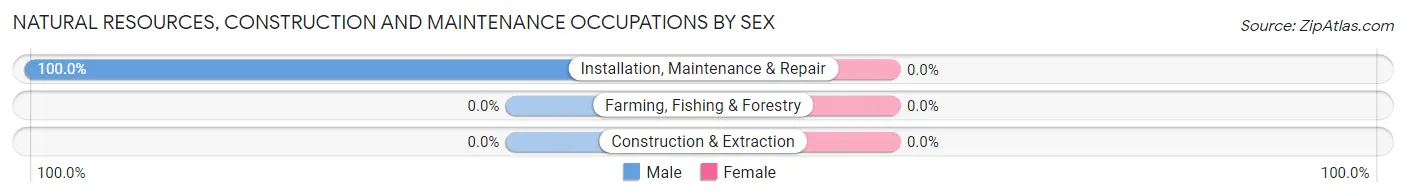
| Occupation | Male | Female |
| Farming, Fishing & Forestry | 0 (0.0%) | 0 (0.0%) |
| Construction & Extraction | 0 (0.0%) | 0 (0.0%) |
| Installation, Maintenance & Repair | 18 (100.0%) | 0 (0.0%) |
| Total (Category) | 18 (100.0%) | 0 (0.0%) |
| Total (Overall) | 31 (54.4%) | 26 (45.6%) |
Production, Transportation and Moving Occupations
The most common Production, Transportation and Moving occupations in Bingham are Production (8 | 14.0%), and Material Moving (5 | 8.8%).
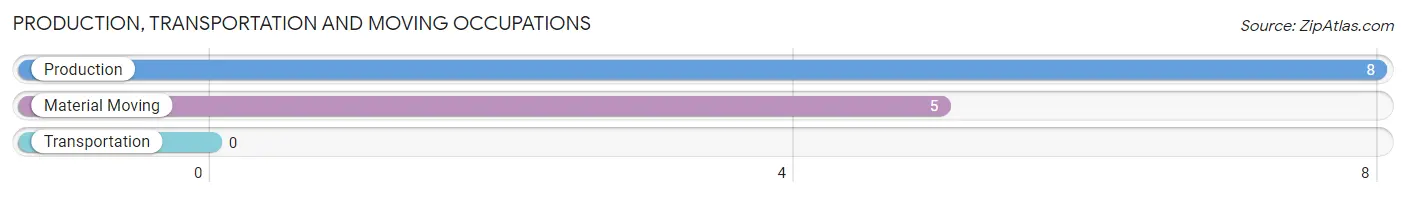
Production, Transportation and Moving Occupations by Sex
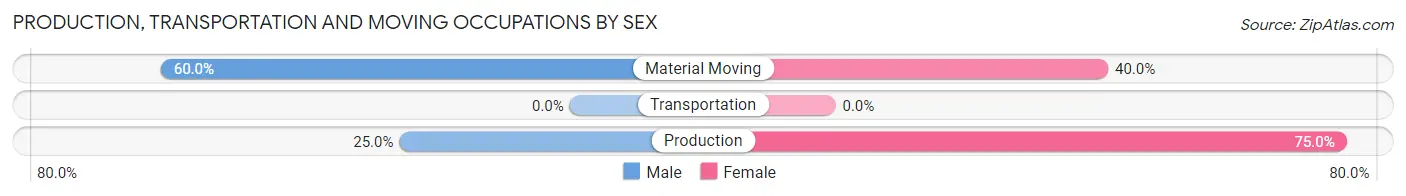
| Occupation | Male | Female |
| Production | 2 (25.0%) | 6 (75.0%) |
| Transportation | 0 (0.0%) | 0 (0.0%) |
| Material Moving | 3 (60.0%) | 2 (40.0%) |
| Total (Category) | 5 (38.5%) | 8 (61.5%) |
| Total (Overall) | 31 (54.4%) | 26 (45.6%) |
Employment Industries by Sex in Bingham
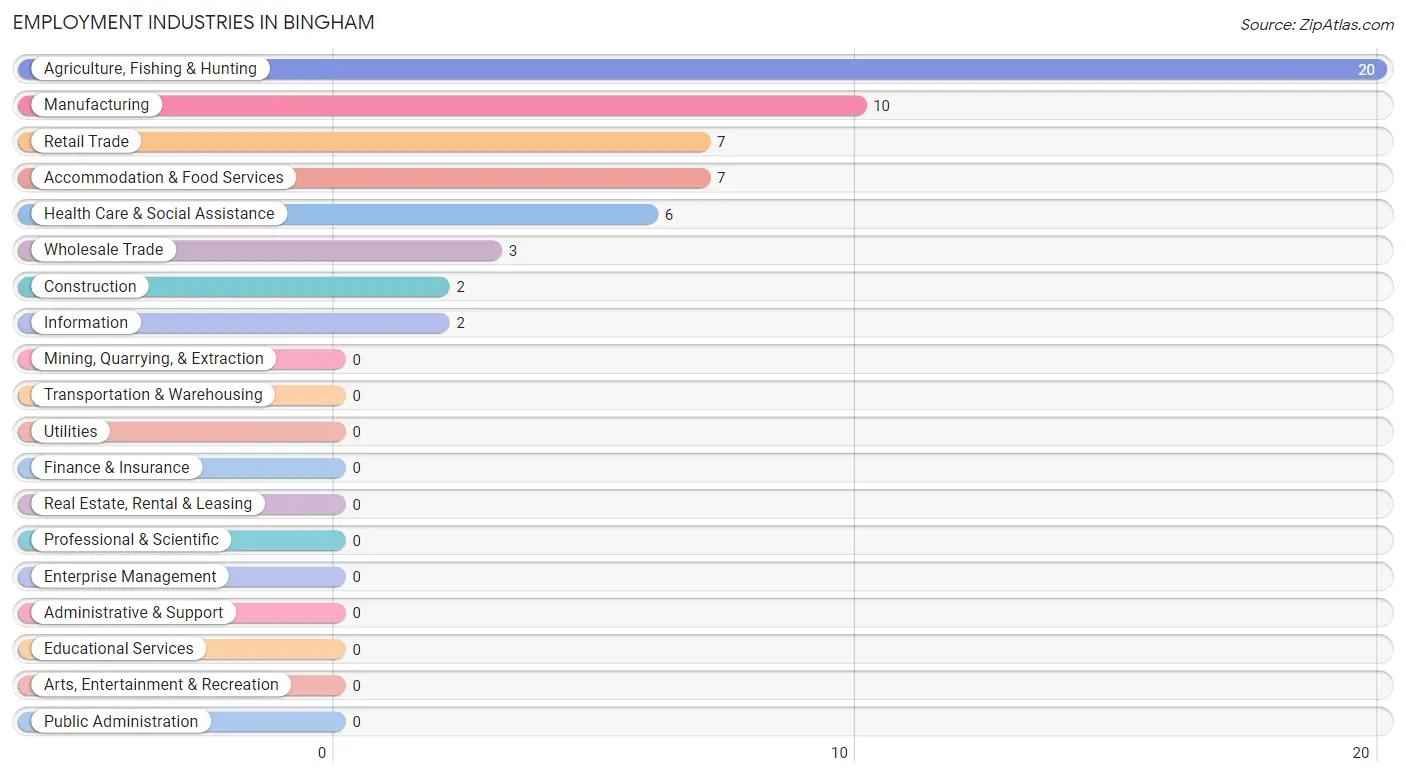
Employment Industries in Bingham
The major employment industries in Bingham include Agriculture, Fishing & Hunting (20 | 35.1%), Manufacturing (10 | 17.5%), Retail Trade (7 | 12.3%), Accommodation & Food Services (7 | 12.3%), and Health Care & Social Assistance (6 | 10.5%).
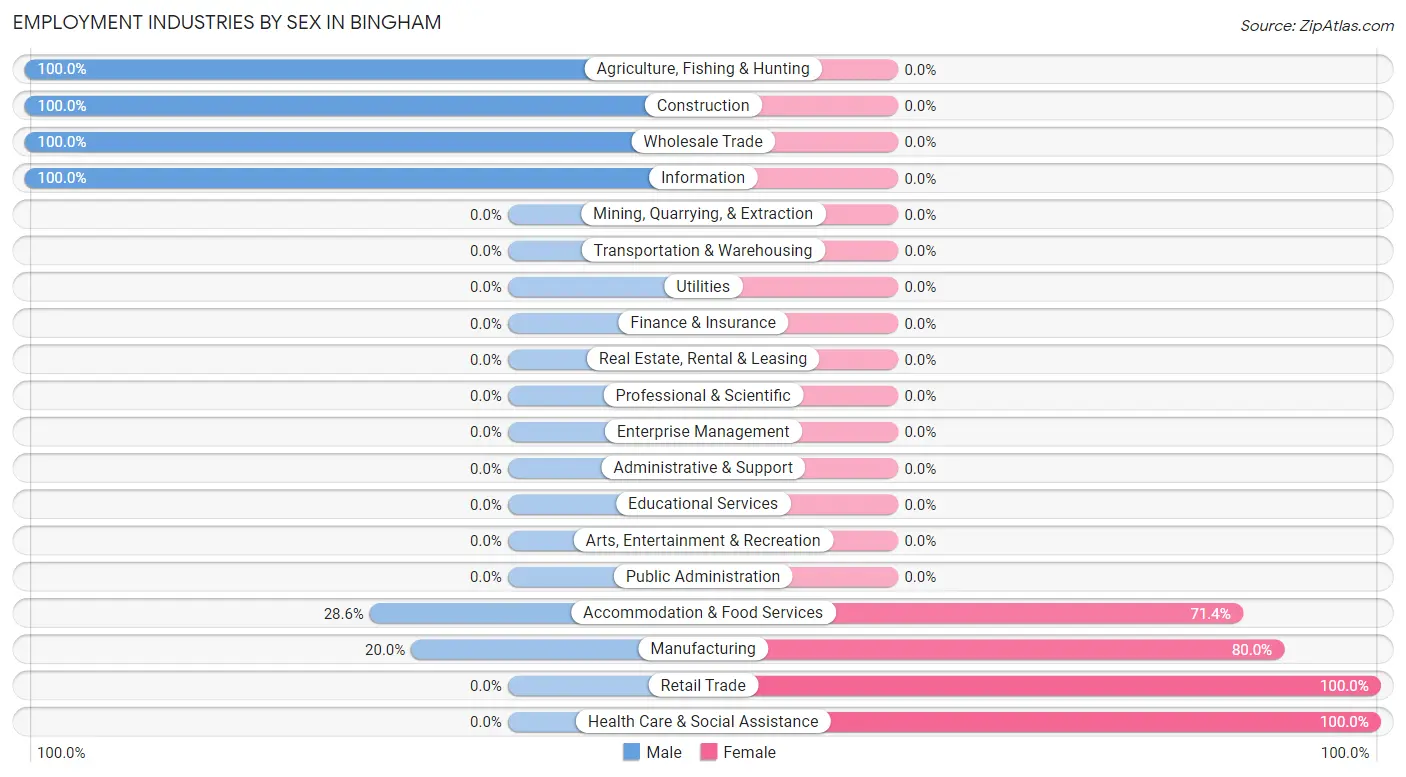
Employment Industries by Sex in Bingham
The Bingham industries that see more men than women are Agriculture, Fishing & Hunting (100.0%), Construction (100.0%), and Wholesale Trade (100.0%), whereas the industries that tend to have a higher number of women are Retail Trade (100.0%), Health Care & Social Assistance (100.0%), and Manufacturing (80.0%).
| Industry | Male | Female |
| Agriculture, Fishing & Hunting | 20 (100.0%) | 0 (0.0%) |
| Mining, Quarrying, & Extraction | 0 (0.0%) | 0 (0.0%) |
| Construction | 2 (100.0%) | 0 (0.0%) |
| Manufacturing | 2 (20.0%) | 8 (80.0%) |
| Wholesale Trade | 3 (100.0%) | 0 (0.0%) |
| Retail Trade | 0 (0.0%) | 7 (100.0%) |
| Transportation & Warehousing | 0 (0.0%) | 0 (0.0%) |
| Utilities | 0 (0.0%) | 0 (0.0%) |
| Information | 2 (100.0%) | 0 (0.0%) |
| Finance & Insurance | 0 (0.0%) | 0 (0.0%) |
| Real Estate, Rental & Leasing | 0 (0.0%) | 0 (0.0%) |
| Professional & Scientific | 0 (0.0%) | 0 (0.0%) |
| Enterprise Management | 0 (0.0%) | 0 (0.0%) |
| Administrative & Support | 0 (0.0%) | 0 (0.0%) |
| Educational Services | 0 (0.0%) | 0 (0.0%) |
| Health Care & Social Assistance | 0 (0.0%) | 6 (100.0%) |
| Arts, Entertainment & Recreation | 0 (0.0%) | 0 (0.0%) |
| Accommodation & Food Services | 2 (28.6%) | 5 (71.4%) |
| Public Administration | 0 (0.0%) | 0 (0.0%) |
| Total | 31 (54.4%) | 26 (45.6%) |
Education in Bingham
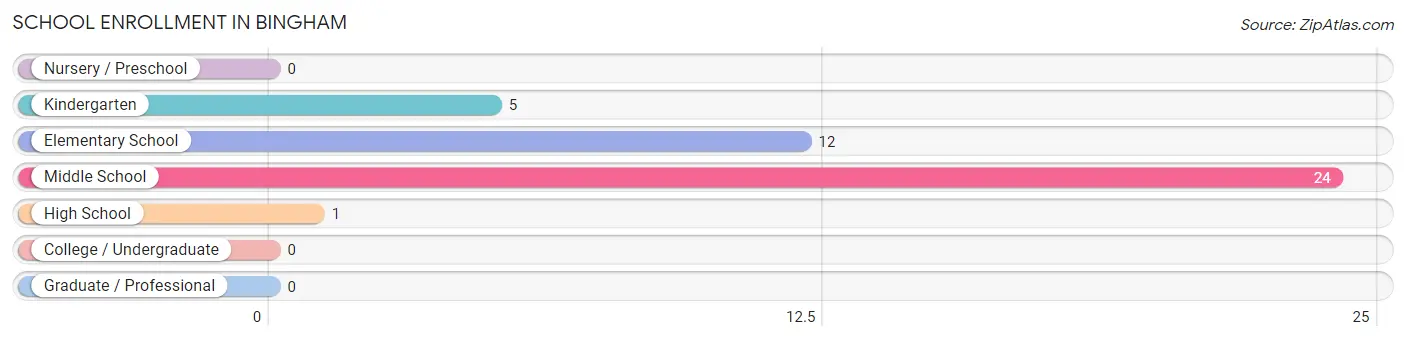
School Enrollment in Bingham
The most common levels of schooling among the 42 students in Bingham are middle school (24 | 57.1%), elementary school (12 | 28.6%), and kindergarten (5 | 11.9%).
| School Level | # Students | % Students |
| Nursery / Preschool | 0 | 0.0% |
| Kindergarten | 5 | 11.9% |
| Elementary School | 12 | 28.6% |
| Middle School | 24 | 57.1% |
| High School | 1 | 2.4% |
| College / Undergraduate | 0 | 0.0% |
| Graduate / Professional | 0 | 0.0% |
| Total | 42 | 100.0% |
School Enrollment by Age by Funding Source in Bingham
Out of a total of 42 students who are enrolled in schools in Bingham, 3 (7.1%) attend a private institution, while the remaining 39 (92.9%) are enrolled in public schools. The age group of 10 to 14 year olds has the highest likelihood of being enrolled in private schools, with 3 (10.0% in the age bracket) enrolled. Conversely, the age group of 5 to 9 year old has the lowest likelihood of being enrolled in a private school, with 11 (100.0% in the age bracket) attending a public institution.
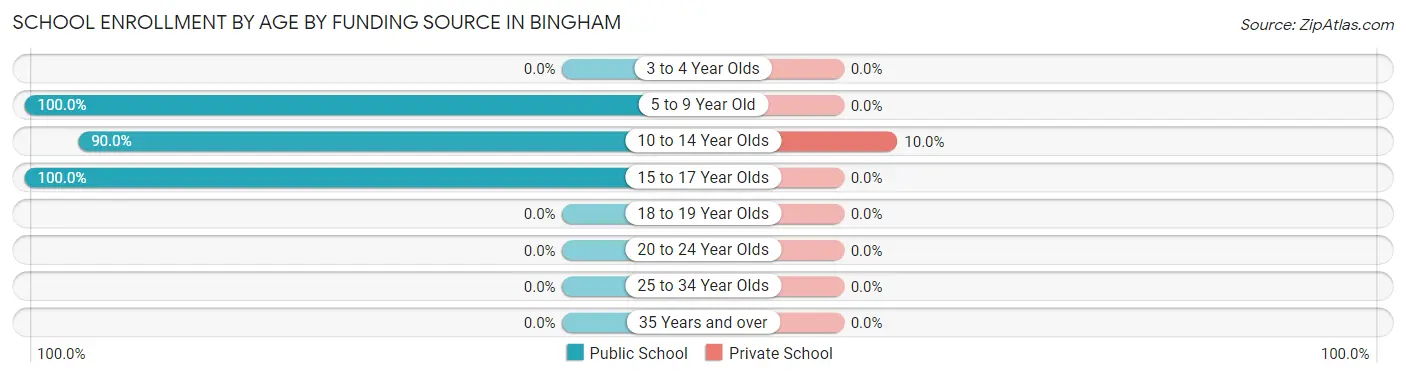
| Age Bracket | Public School | Private School |
| 3 to 4 Year Olds | 0 (0.0%) | 0 (0.0%) |
| 5 to 9 Year Old | 11 (100.0%) | 0 (0.0%) |
| 10 to 14 Year Olds | 27 (90.0%) | 3 (10.0%) |
| 15 to 17 Year Olds | 1 (100.0%) | 0 (0.0%) |
| 18 to 19 Year Olds | 0 (0.0%) | 0 (0.0%) |
| 20 to 24 Year Olds | 0 (0.0%) | 0 (0.0%) |
| 25 to 34 Year Olds | 0 (0.0%) | 0 (0.0%) |
| 35 Years and over | 0 (0.0%) | 0 (0.0%) |
| Total | 39 (92.9%) | 3 (7.1%) |
Educational Attainment by Field of Study in Bingham
| Field of Study | # Graduates | % Graduates |
| Computers & Mathematics | 0 | 0.0% |
| Bio, Nature & Agricultural | 0 | 0.0% |
| Physical & Health Sciences | 0 | 0.0% |
| Psychology | 0 | 0.0% |
| Social Sciences | 0 | 0.0% |
| Engineering | 0 | 0.0% |
| Multidisciplinary Studies | 0 | 0.0% |
| Science & Technology | 0 | 0.0% |
| Business | 0 | 0.0% |
| Education | 0 | 0.0% |
| Literature & Languages | 0 | 0.0% |
| Liberal Arts & History | 0 | 0.0% |
| Visual & Performing Arts | 0 | 0.0% |
| Communications | 0 | 0.0% |
| Arts & Humanities | 0 | 0.0% |
| Total | 0 | 0.0% |
Transportation & Commute in Bingham
Vehicle Availability by Sex in Bingham
The most prevalent vehicle ownership categories in Bingham are males with 2 vehicles (23, accounting for 74.2%) and females with 2 vehicles (11, making up 88.5%).
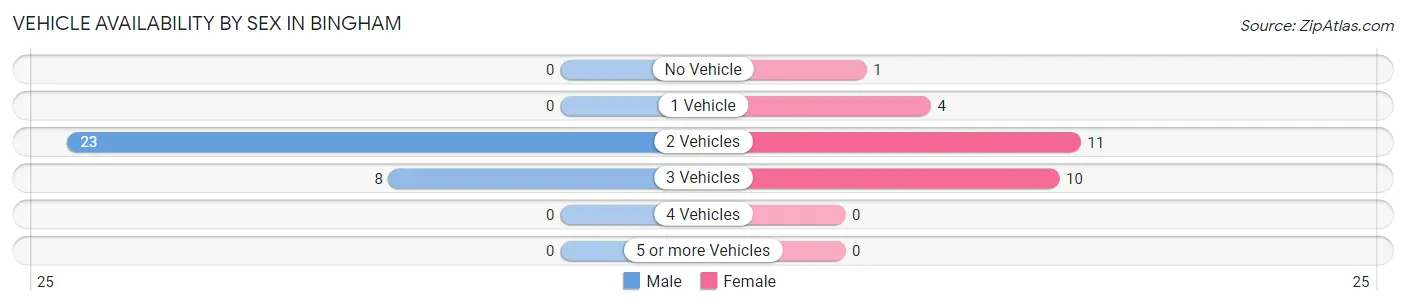
| Vehicles Available | Male | Female |
| No Vehicle | 0 (0.0%) | 1 (3.8%) |
| 1 Vehicle | 0 (0.0%) | 4 (15.4%) |
| 2 Vehicles | 23 (74.2%) | 11 (42.3%) |
| 3 Vehicles | 8 (25.8%) | 10 (38.5%) |
| 4 Vehicles | 0 (0.0%) | 0 (0.0%) |
| 5 or more Vehicles | 0 (0.0%) | 0 (0.0%) |
| Total | 31 (100.0%) | 26 (100.0%) |
Commute Time in Bingham
The most frequently occuring commute durations in Bingham are 20 to 24 minutes (18 commuters, 31.6%), 45 to 59 minutes (9 commuters, 15.8%), and 10 to 14 minutes (7 commuters, 12.3%).
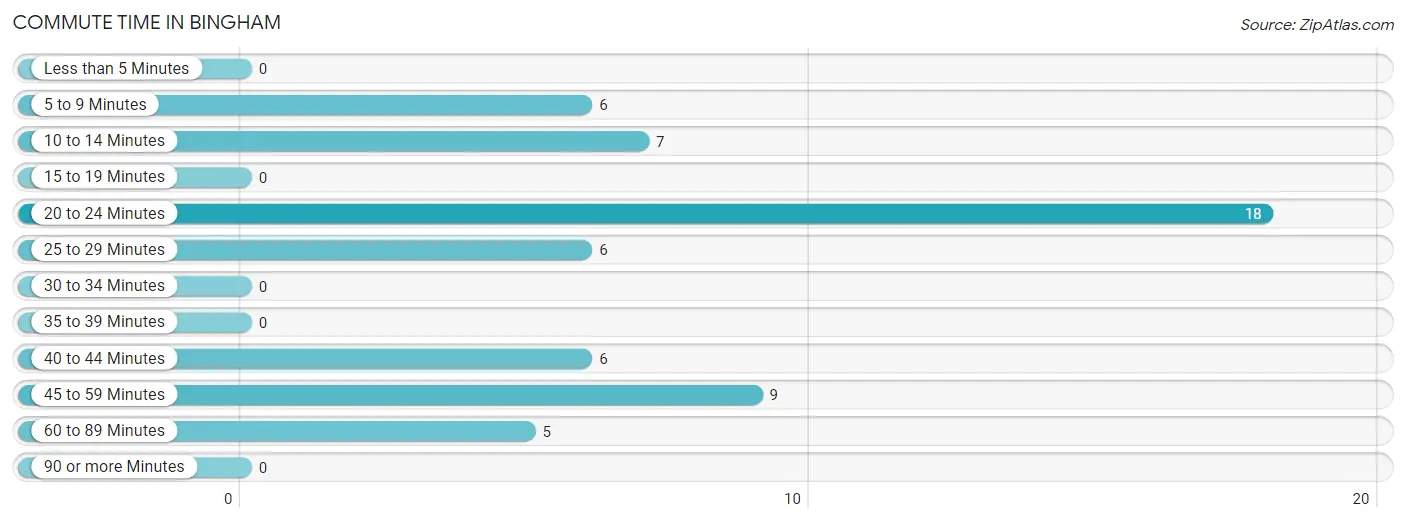
| Commute Time | # Commuters | % Commuters |
| Less than 5 Minutes | 0 | 0.0% |
| 5 to 9 Minutes | 6 | 10.5% |
| 10 to 14 Minutes | 7 | 12.3% |
| 15 to 19 Minutes | 0 | 0.0% |
| 20 to 24 Minutes | 18 | 31.6% |
| 25 to 29 Minutes | 6 | 10.5% |
| 30 to 34 Minutes | 0 | 0.0% |
| 35 to 39 Minutes | 0 | 0.0% |
| 40 to 44 Minutes | 6 | 10.5% |
| 45 to 59 Minutes | 9 | 15.8% |
| 60 to 89 Minutes | 5 | 8.8% |
| 90 or more Minutes | 0 | 0.0% |
Commute Time by Sex in Bingham
The most common commute times in Bingham are 20 to 24 minutes (18 commuters, 58.1%) for males and 10 to 14 minutes (7 commuters, 26.9%) for females.
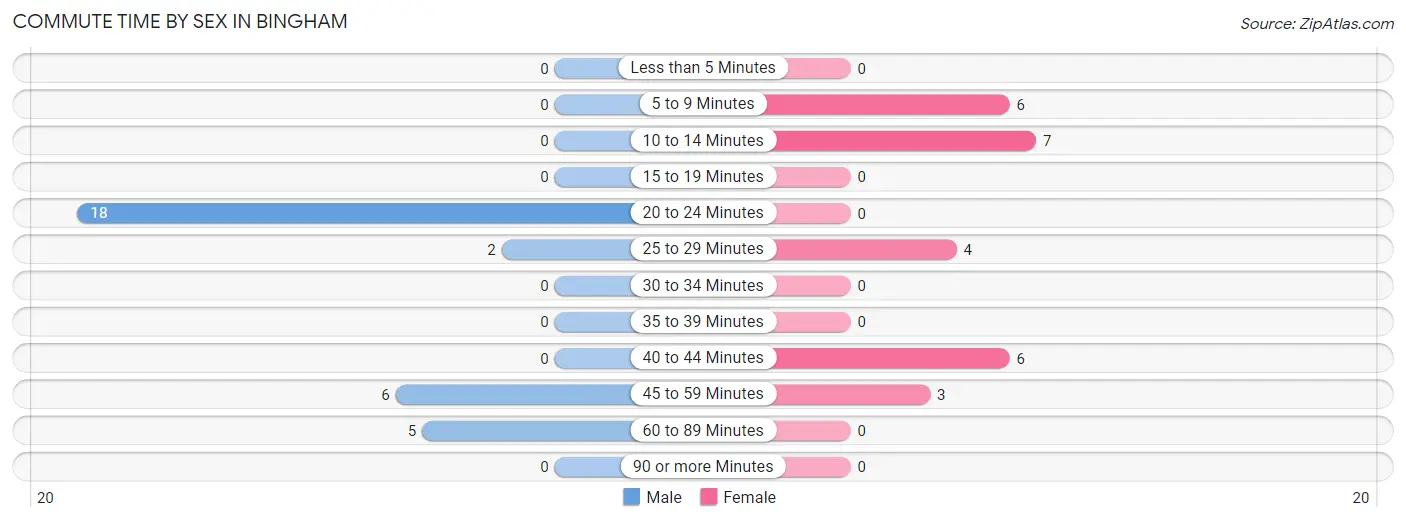
| Commute Time | Male | Female |
| Less than 5 Minutes | 0 (0.0%) | 0 (0.0%) |
| 5 to 9 Minutes | 0 (0.0%) | 6 (23.1%) |
| 10 to 14 Minutes | 0 (0.0%) | 7 (26.9%) |
| 15 to 19 Minutes | 0 (0.0%) | 0 (0.0%) |
| 20 to 24 Minutes | 18 (58.1%) | 0 (0.0%) |
| 25 to 29 Minutes | 2 (6.5%) | 4 (15.4%) |
| 30 to 34 Minutes | 0 (0.0%) | 0 (0.0%) |
| 35 to 39 Minutes | 0 (0.0%) | 0 (0.0%) |
| 40 to 44 Minutes | 0 (0.0%) | 6 (23.1%) |
| 45 to 59 Minutes | 6 (19.4%) | 3 (11.5%) |
| 60 to 89 Minutes | 5 (16.1%) | 0 (0.0%) |
| 90 or more Minutes | 0 (0.0%) | 0 (0.0%) |
Time of Departure to Work by Sex in Bingham
The most frequent times of departure to work in Bingham are 7:00 AM to 7:29 AM (16, 51.6%) for males and 7:30 AM to 7:59 AM (13, 50.0%) for females.
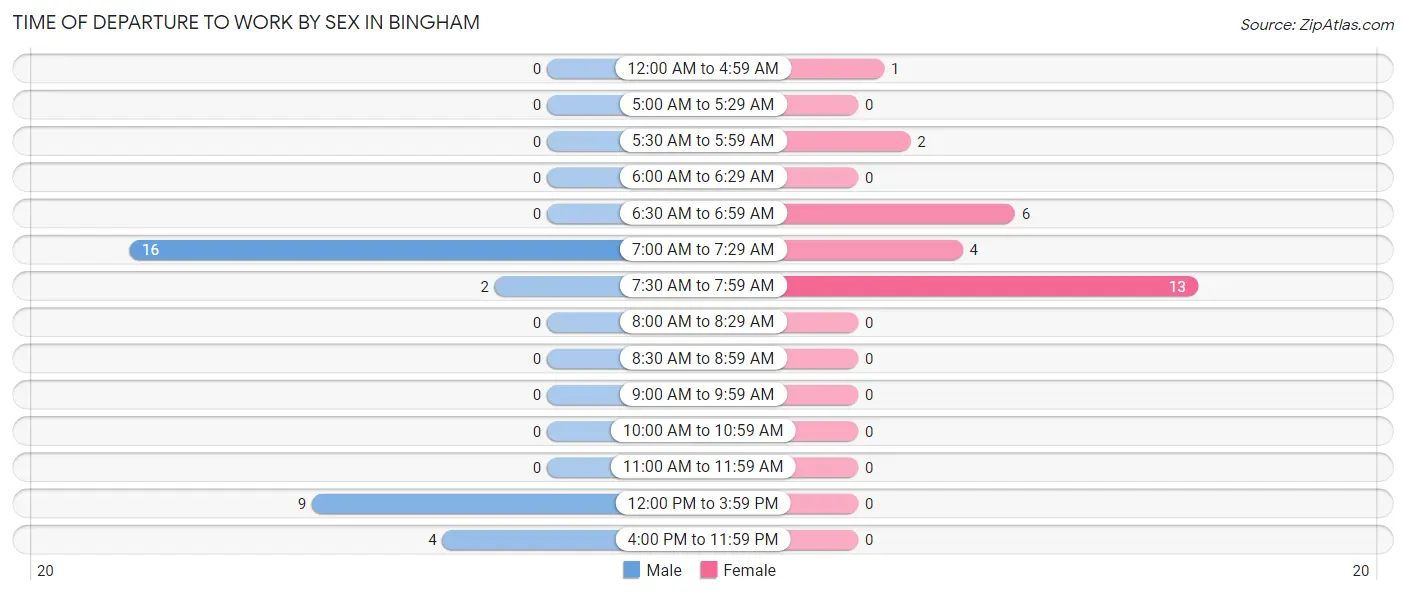
| Time of Departure | Male | Female |
| 12:00 AM to 4:59 AM | 0 (0.0%) | 1 (3.8%) |
| 5:00 AM to 5:29 AM | 0 (0.0%) | 0 (0.0%) |
| 5:30 AM to 5:59 AM | 0 (0.0%) | 2 (7.7%) |
| 6:00 AM to 6:29 AM | 0 (0.0%) | 0 (0.0%) |
| 6:30 AM to 6:59 AM | 0 (0.0%) | 6 (23.1%) |
| 7:00 AM to 7:29 AM | 16 (51.6%) | 4 (15.4%) |
| 7:30 AM to 7:59 AM | 2 (6.5%) | 13 (50.0%) |
| 8:00 AM to 8:29 AM | 0 (0.0%) | 0 (0.0%) |
| 8:30 AM to 8:59 AM | 0 (0.0%) | 0 (0.0%) |
| 9:00 AM to 9:59 AM | 0 (0.0%) | 0 (0.0%) |
| 10:00 AM to 10:59 AM | 0 (0.0%) | 0 (0.0%) |
| 11:00 AM to 11:59 AM | 0 (0.0%) | 0 (0.0%) |
| 12:00 PM to 3:59 PM | 9 (29.0%) | 0 (0.0%) |
| 4:00 PM to 11:59 PM | 4 (12.9%) | 0 (0.0%) |
| Total | 31 (100.0%) | 26 (100.0%) |
Housing Occupancy in Bingham
Occupancy by Ownership in Bingham
Of the total 42 dwellings in Bingham, owner-occupied units account for 42 (100.0%), while renter-occupied units make up 0 (0.0%).
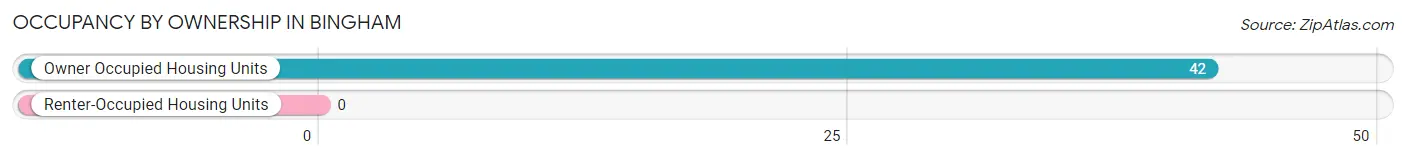
| Occupancy | # Housing Units | % Housing Units |
| Owner Occupied Housing Units | 42 | 100.0% |
| Renter-Occupied Housing Units | 0 | 0.0% |
| Total Occupied Housing Units | 42 | 100.0% |
Occupancy by Household Size in Bingham
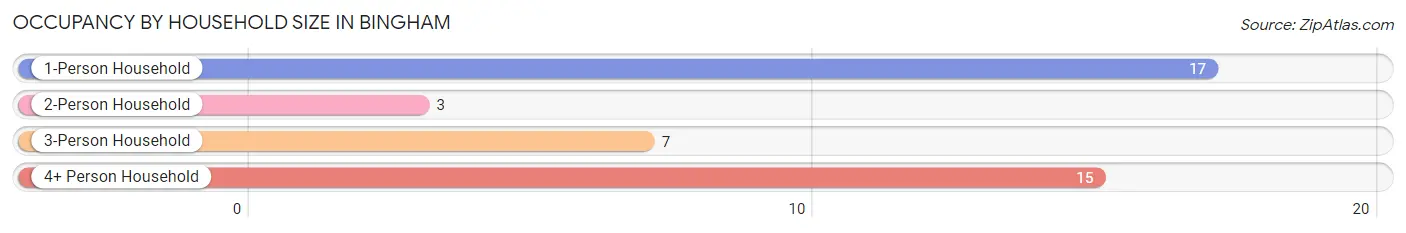
| Household Size | # Housing Units | % Housing Units |
| 1-Person Household | 17 | 40.5% |
| 2-Person Household | 3 | 7.1% |
| 3-Person Household | 7 | 16.7% |
| 4+ Person Household | 15 | 35.7% |
| Total Housing Units | 42 | 100.0% |
Occupancy by Ownership by Household Size in Bingham
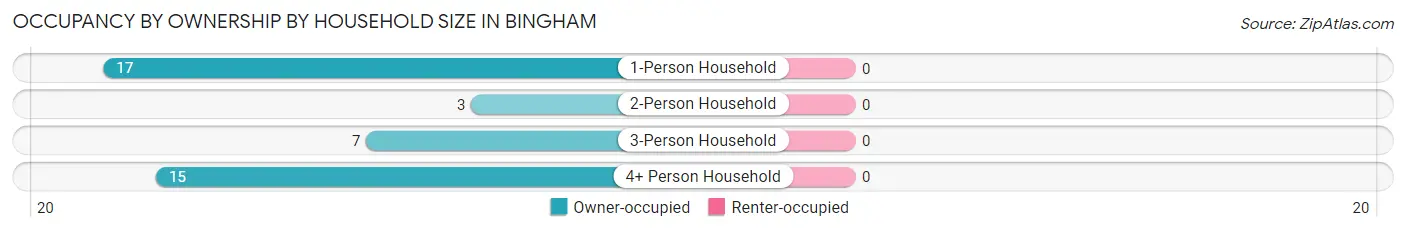
| Household Size | Owner-occupied | Renter-occupied |
| 1-Person Household | 17 (100.0%) | 0 (0.0%) |
| 2-Person Household | 3 (100.0%) | 0 (0.0%) |
| 3-Person Household | 7 (100.0%) | 0 (0.0%) |
| 4+ Person Household | 15 (100.0%) | 0 (0.0%) |
| Total Housing Units | 42 (100.0%) | 0 (0.0%) |
Occupancy by Educational Attainment in Bingham
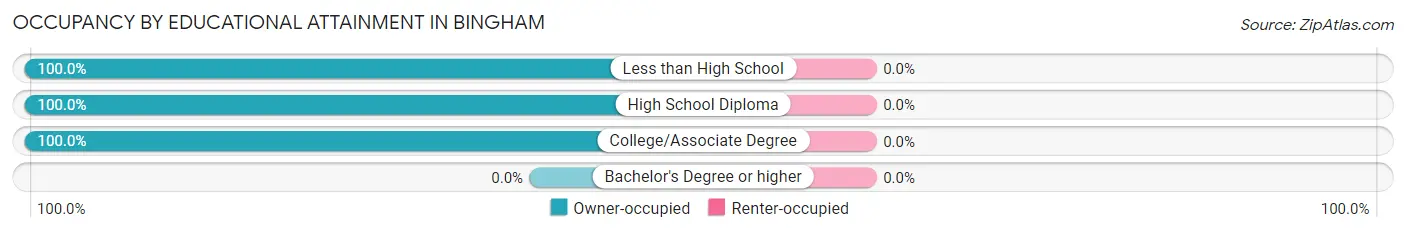
| Household Size | Owner-occupied | Renter-occupied |
| Less than High School | 4 (100.0%) | 0 (0.0%) |
| High School Diploma | 32 (100.0%) | 0 (0.0%) |
| College/Associate Degree | 6 (100.0%) | 0 (0.0%) |
| Bachelor's Degree or higher | 0 (0.0%) | 0 (0.0%) |
Occupancy by Age of Householder in Bingham
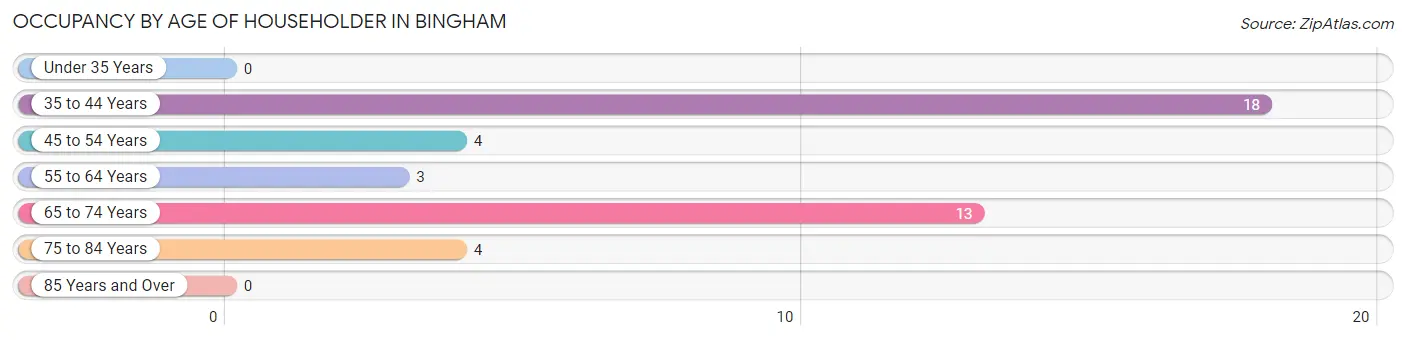
| Age Bracket | # Households | % Households |
| Under 35 Years | 0 | 0.0% |
| 35 to 44 Years | 18 | 42.9% |
| 45 to 54 Years | 4 | 9.5% |
| 55 to 64 Years | 3 | 7.1% |
| 65 to 74 Years | 13 | 30.9% |
| 75 to 84 Years | 4 | 9.5% |
| 85 Years and Over | 0 | 0.0% |
| Total | 42 | 100.0% |
Housing Finances in Bingham
Median Income by Occupancy in Bingham
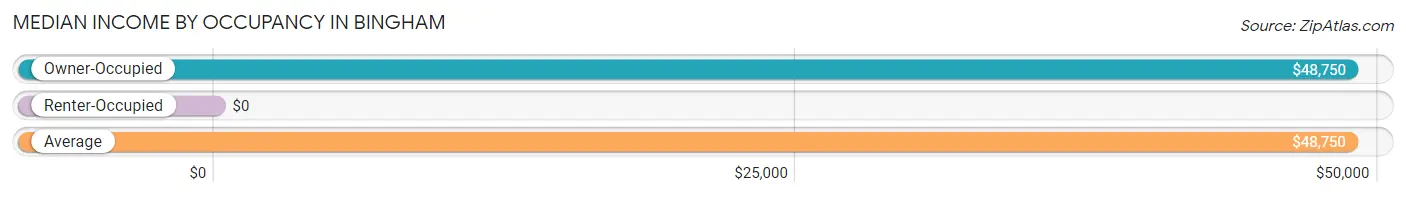
| Occupancy Type | # Households | Median Income |
| Owner-Occupied | 42 (100.0%) | $48,750 |
| Renter-Occupied | 0 (0.0%) | $0 |
| Average | 42 (100.0%) | $48,750 |
Occupancy by Householder Income Bracket in Bingham
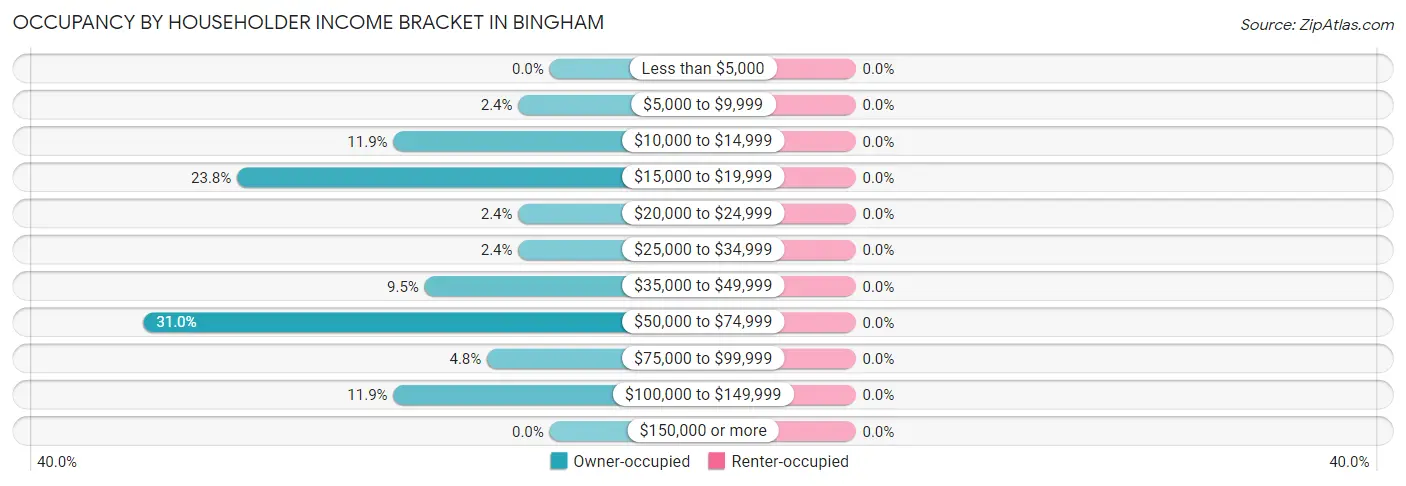
| Income Bracket | Owner-occupied | Renter-occupied |
| Less than $5,000 | 0 (0.0%) | 0 (0.0%) |
| $5,000 to $9,999 | 1 (2.4%) | 0 (0.0%) |
| $10,000 to $14,999 | 5 (11.9%) | 0 (0.0%) |
| $15,000 to $19,999 | 10 (23.8%) | 0 (0.0%) |
| $20,000 to $24,999 | 1 (2.4%) | 0 (0.0%) |
| $25,000 to $34,999 | 1 (2.4%) | 0 (0.0%) |
| $35,000 to $49,999 | 4 (9.5%) | 0 (0.0%) |
| $50,000 to $74,999 | 13 (30.9%) | 0 (0.0%) |
| $75,000 to $99,999 | 2 (4.8%) | 0 (0.0%) |
| $100,000 to $149,999 | 5 (11.9%) | 0 (0.0%) |
| $150,000 or more | 0 (0.0%) | 0 (0.0%) |
| Total | 42 (100.0%) | 0 (0.0%) |
Monthly Housing Cost Tiers in Bingham
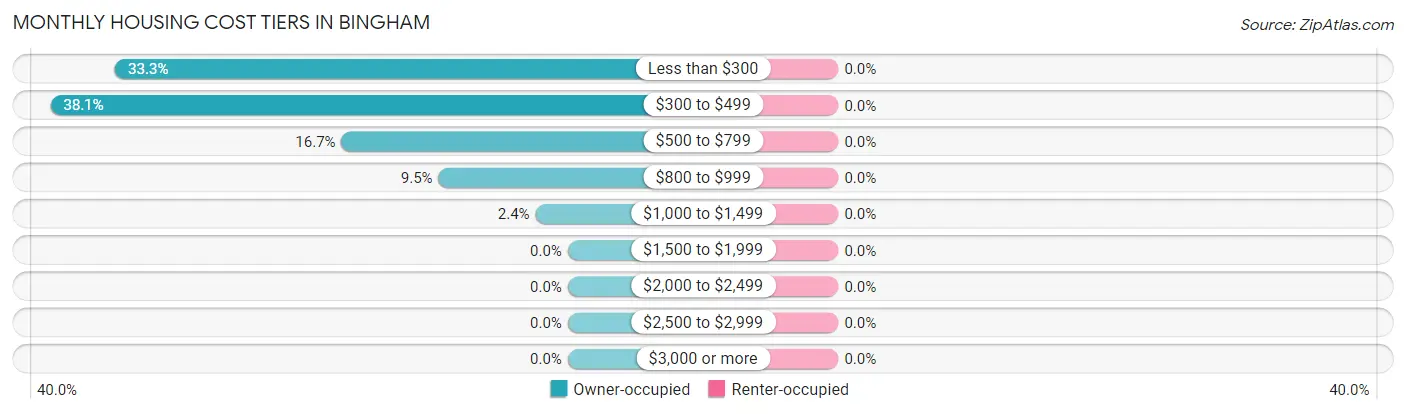
| Monthly Cost | Owner-occupied | Renter-occupied |
| Less than $300 | 14 (33.3%) | 0 (0.0%) |
| $300 to $499 | 16 (38.1%) | 0 (0.0%) |
| $500 to $799 | 7 (16.7%) | 0 (0.0%) |
| $800 to $999 | 4 (9.5%) | 0 (0.0%) |
| $1,000 to $1,499 | 1 (2.4%) | 0 (0.0%) |
| $1,500 to $1,999 | 0 (0.0%) | 0 (0.0%) |
| $2,000 to $2,499 | 0 (0.0%) | 0 (0.0%) |
| $2,500 to $2,999 | 0 (0.0%) | 0 (0.0%) |
| $3,000 or more | 0 (0.0%) | 0 (0.0%) |
| Total | 42 (100.0%) | 0 (0.0%) |
Physical Housing Characteristics in Bingham
Housing Structures in Bingham
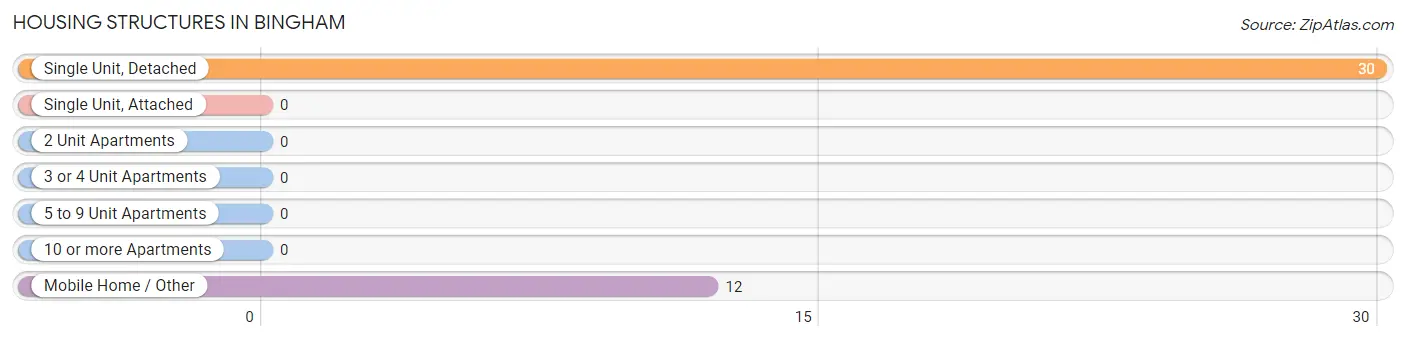
| Structure Type | # Housing Units | % Housing Units |
| Single Unit, Detached | 30 | 71.4% |
| Single Unit, Attached | 0 | 0.0% |
| 2 Unit Apartments | 0 | 0.0% |
| 3 or 4 Unit Apartments | 0 | 0.0% |
| 5 to 9 Unit Apartments | 0 | 0.0% |
| 10 or more Apartments | 0 | 0.0% |
| Mobile Home / Other | 12 | 28.6% |
| Total | 42 | 100.0% |
Housing Structures by Occupancy in Bingham
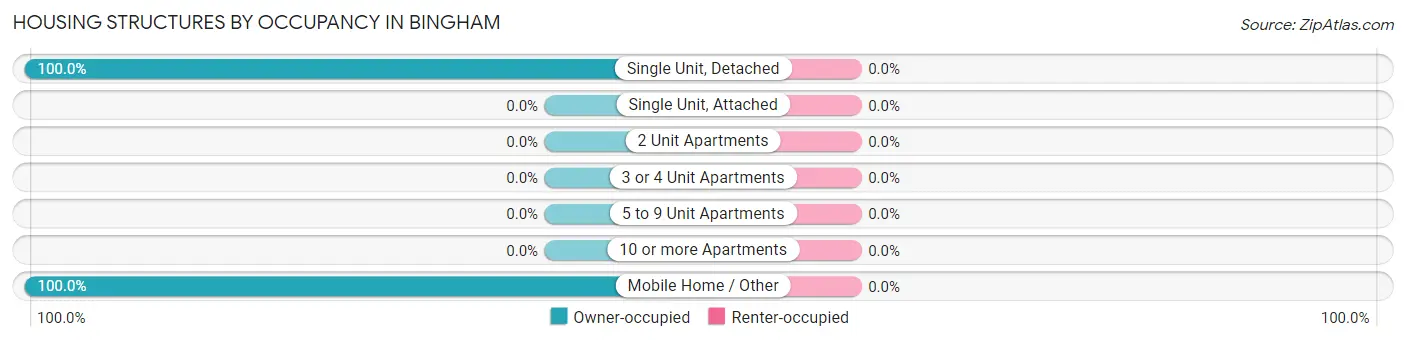
| Structure Type | Owner-occupied | Renter-occupied |
| Single Unit, Detached | 30 (100.0%) | 0 (0.0%) |
| Single Unit, Attached | 0 (0.0%) | 0 (0.0%) |
| 2 Unit Apartments | 0 (0.0%) | 0 (0.0%) |
| 3 or 4 Unit Apartments | 0 (0.0%) | 0 (0.0%) |
| 5 to 9 Unit Apartments | 0 (0.0%) | 0 (0.0%) |
| 10 or more Apartments | 0 (0.0%) | 0 (0.0%) |
| Mobile Home / Other | 12 (100.0%) | 0 (0.0%) |
| Total | 42 (100.0%) | 0 (0.0%) |
Housing Structures by Number of Rooms in Bingham
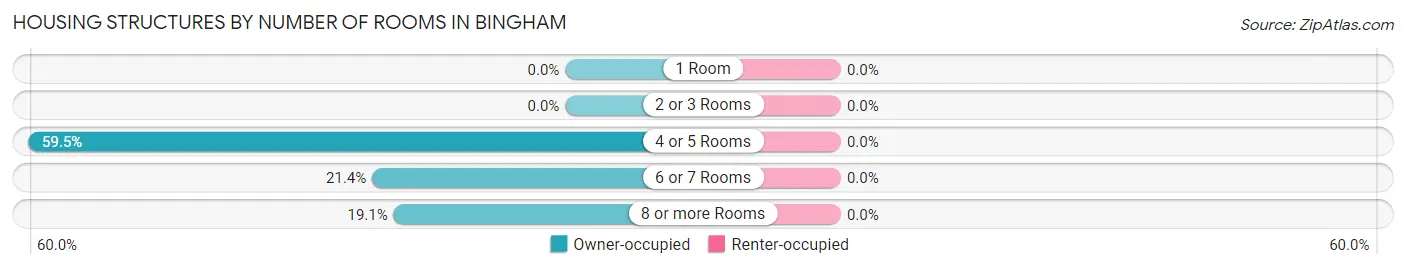
| Number of Rooms | Owner-occupied | Renter-occupied |
| 1 Room | 0 (0.0%) | 0 (0.0%) |
| 2 or 3 Rooms | 0 (0.0%) | 0 (0.0%) |
| 4 or 5 Rooms | 25 (59.5%) | 0 (0.0%) |
| 6 or 7 Rooms | 9 (21.4%) | 0 (0.0%) |
| 8 or more Rooms | 8 (19.1%) | 0 (0.0%) |
| Total | 42 (100.0%) | 0 (0.0%) |
Housing Structure by Heating Type in Bingham
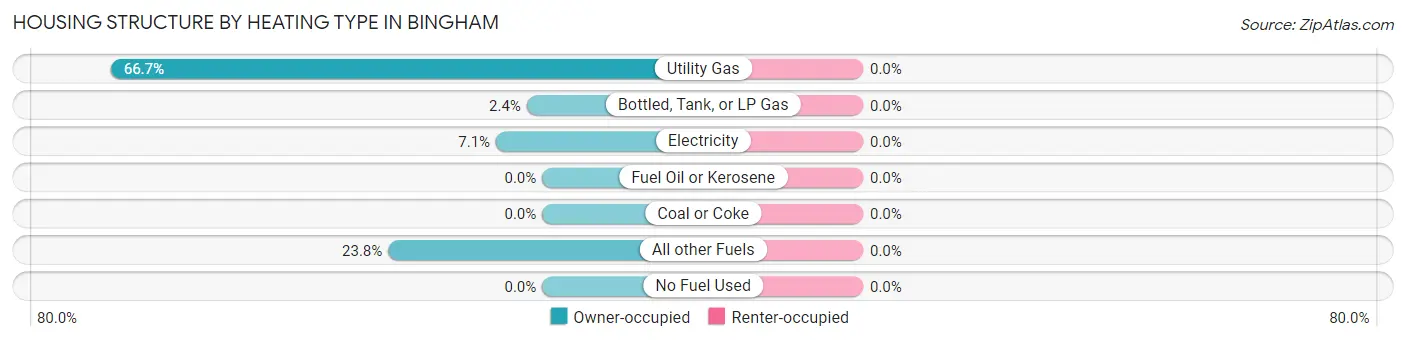
| Heating Type | Owner-occupied | Renter-occupied |
| Utility Gas | 28 (66.7%) | 0 (0.0%) |
| Bottled, Tank, or LP Gas | 1 (2.4%) | 0 (0.0%) |
| Electricity | 3 (7.1%) | 0 (0.0%) |
| Fuel Oil or Kerosene | 0 (0.0%) | 0 (0.0%) |
| Coal or Coke | 0 (0.0%) | 0 (0.0%) |
| All other Fuels | 10 (23.8%) | 0 (0.0%) |
| No Fuel Used | 0 (0.0%) | 0 (0.0%) |
| Total | 42 (100.0%) | 0 (0.0%) |
Household Vehicle Usage in Bingham
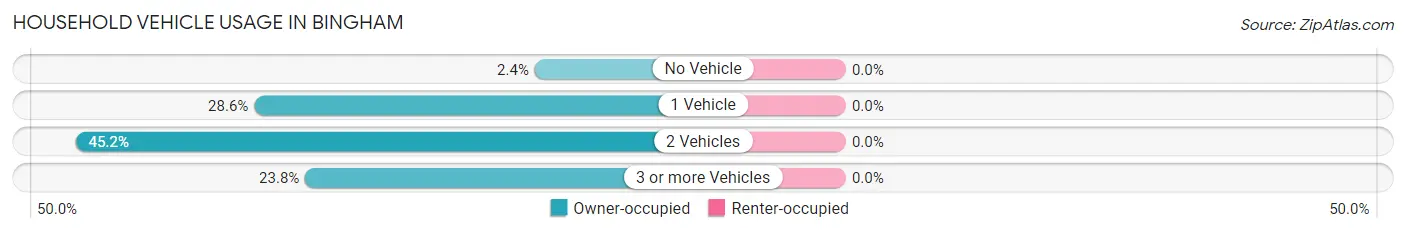
| Vehicles per Household | Owner-occupied | Renter-occupied |
| No Vehicle | 1 (2.4%) | 0 (0.0%) |
| 1 Vehicle | 12 (28.6%) | 0 (0.0%) |
| 2 Vehicles | 19 (45.2%) | 0 (0.0%) |
| 3 or more Vehicles | 10 (23.8%) | 0 (0.0%) |
| Total | 42 (100.0%) | 0 (0.0%) |
Real Estate & Mortgages in Bingham
Real Estate and Mortgage Overview in Bingham
| Characteristic | Without Mortgage | With Mortgage |
| Housing Units | 41 | 1 |
| Median Property Value | $10,400 | $0 |
| Median Household Income | - | - |
| Monthly Housing Costs | $323 | $0 |
| Real Estate Taxes | - | - |
Property Value by Mortgage Status in Bingham
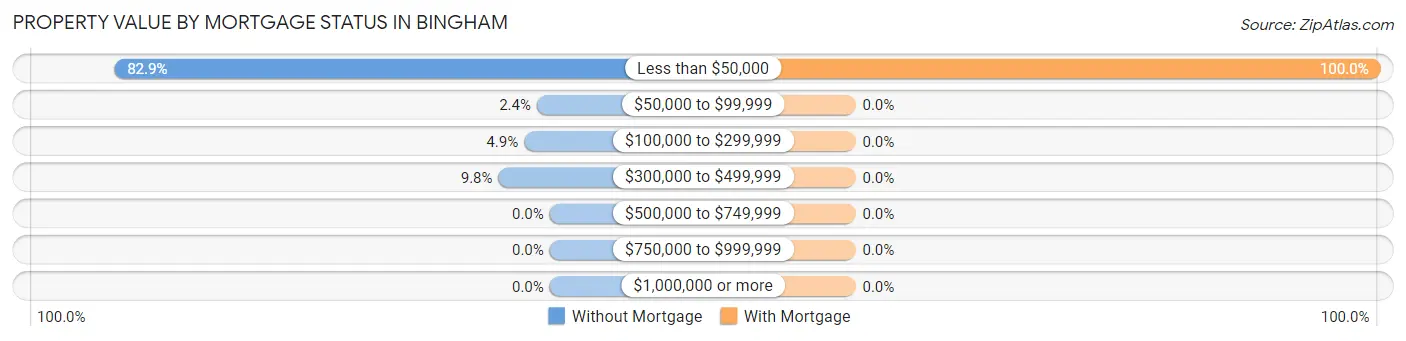
| Property Value | Without Mortgage | With Mortgage |
| Less than $50,000 | 34 (82.9%) | 1 (100.0%) |
| $50,000 to $99,999 | 1 (2.4%) | 0 (0.0%) |
| $100,000 to $299,999 | 2 (4.9%) | 0 (0.0%) |
| $300,000 to $499,999 | 4 (9.8%) | 0 (0.0%) |
| $500,000 to $749,999 | 0 (0.0%) | 0 (0.0%) |
| $750,000 to $999,999 | 0 (0.0%) | 0 (0.0%) |
| $1,000,000 or more | 0 (0.0%) | 0 (0.0%) |
| Total | 41 (100.0%) | 1 (100.0%) |
Household Income by Mortgage Status in Bingham
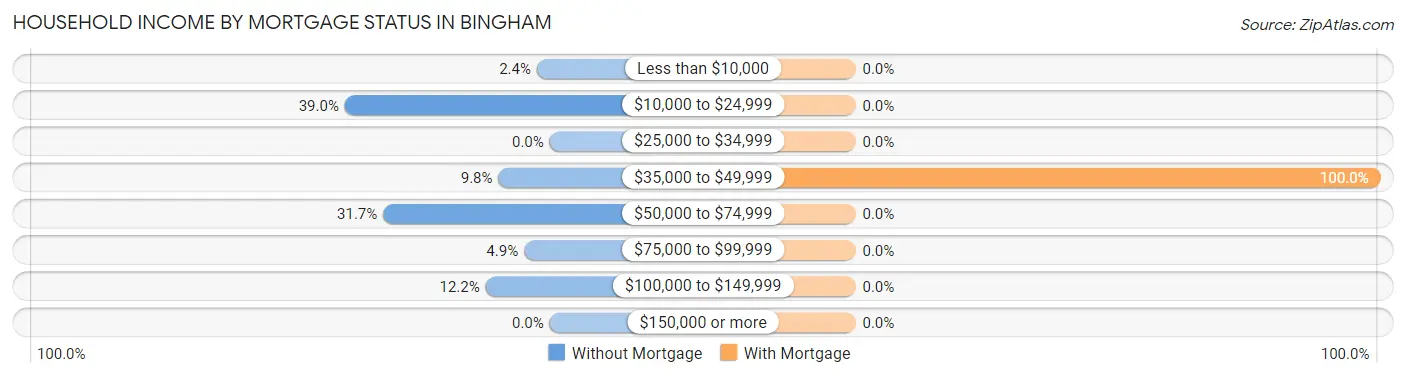
| Household Income | Without Mortgage | With Mortgage |
| Less than $10,000 | 1 (2.4%) | 0 (0.0%) |
| $10,000 to $24,999 | 16 (39.0%) | 0 (0.0%) |
| $25,000 to $34,999 | 0 (0.0%) | 0 (0.0%) |
| $35,000 to $49,999 | 4 (9.8%) | 1 (100.0%) |
| $50,000 to $74,999 | 13 (31.7%) | 0 (0.0%) |
| $75,000 to $99,999 | 2 (4.9%) | 0 (0.0%) |
| $100,000 to $149,999 | 5 (12.2%) | 0 (0.0%) |
| $150,000 or more | 0 (0.0%) | 0 (0.0%) |
| Total | 41 (100.0%) | 1 (100.0%) |
Property Value to Household Income Ratio in Bingham
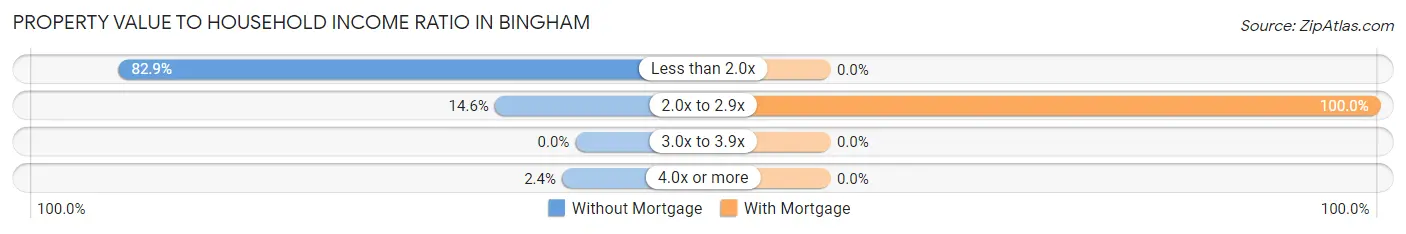
| Value-to-Income Ratio | Without Mortgage | With Mortgage |
| Less than 2.0x | 34 (82.9%) | 0 (0.0%) |
| 2.0x to 2.9x | 6 (14.6%) | 1 (100.0%) |
| 3.0x to 3.9x | 0 (0.0%) | 0 (0.0%) |
| 4.0x or more | 1 (2.4%) | 0 (0.0%) |
| Total | 41 (100.0%) | 1 (100.0%) |
Real Estate Taxes by Mortgage Status in Bingham
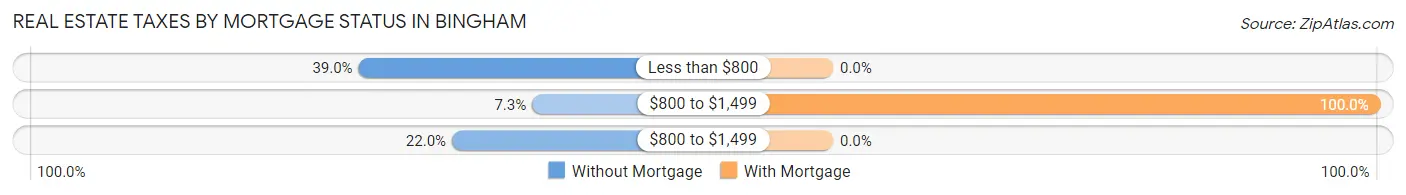
| Property Taxes | Without Mortgage | With Mortgage |
| Less than $800 | 16 (39.0%) | 0 (0.0%) |
| $800 to $1,499 | 3 (7.3%) | 1 (100.0%) |
| $800 to $1,499 | 9 (22.0%) | 0 (0.0%) |
| Total | 41 (100.0%) | 1 (100.0%) |
Health & Disability in Bingham
Health Insurance Coverage by Age in Bingham
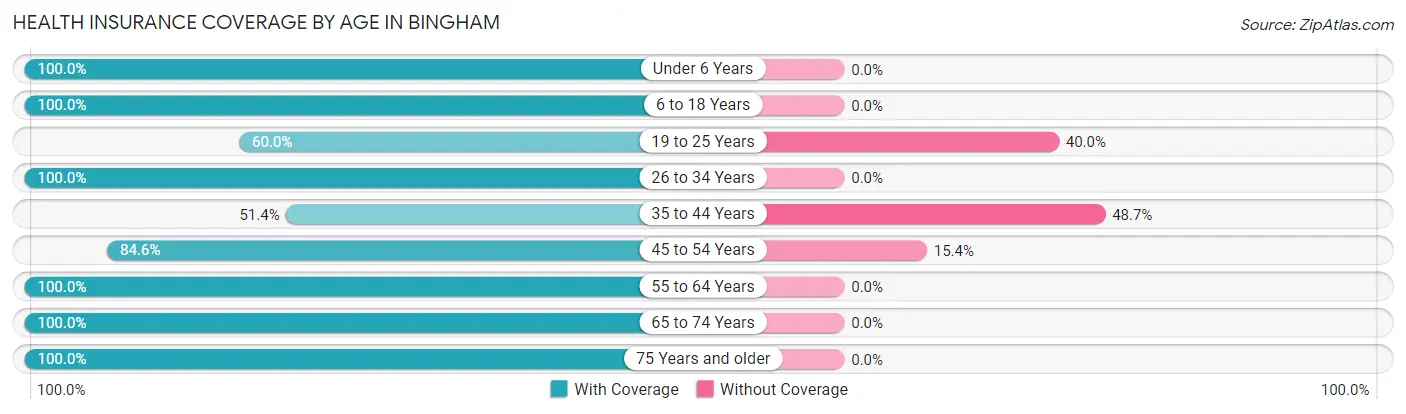
| Age Bracket | With Coverage | Without Coverage |
| Under 6 Years | 5 (100.0%) | 0 (0.0%) |
| 6 to 18 Years | 39 (100.0%) | 0 (0.0%) |
| 19 to 25 Years | 3 (60.0%) | 2 (40.0%) |
| 26 to 34 Years | 12 (100.0%) | 0 (0.0%) |
| 35 to 44 Years | 19 (51.3%) | 18 (48.6%) |
| 45 to 54 Years | 11 (84.6%) | 2 (15.4%) |
| 55 to 64 Years | 13 (100.0%) | 0 (0.0%) |
| 65 to 74 Years | 13 (100.0%) | 0 (0.0%) |
| 75 Years and older | 4 (100.0%) | 0 (0.0%) |
| Total | 119 (84.4%) | 22 (15.6%) |
Health Insurance Coverage by Citizenship Status in Bingham
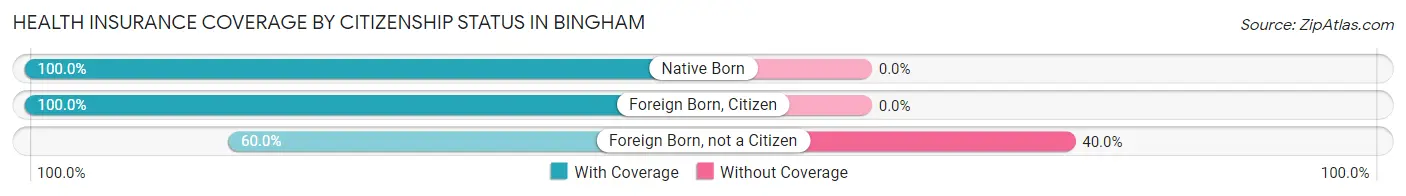
| Citizenship Status | With Coverage | Without Coverage |
| Native Born | 5 (100.0%) | 0 (0.0%) |
| Foreign Born, Citizen | 39 (100.0%) | 0 (0.0%) |
| Foreign Born, not a Citizen | 3 (60.0%) | 2 (40.0%) |
Health Insurance Coverage by Household Income in Bingham
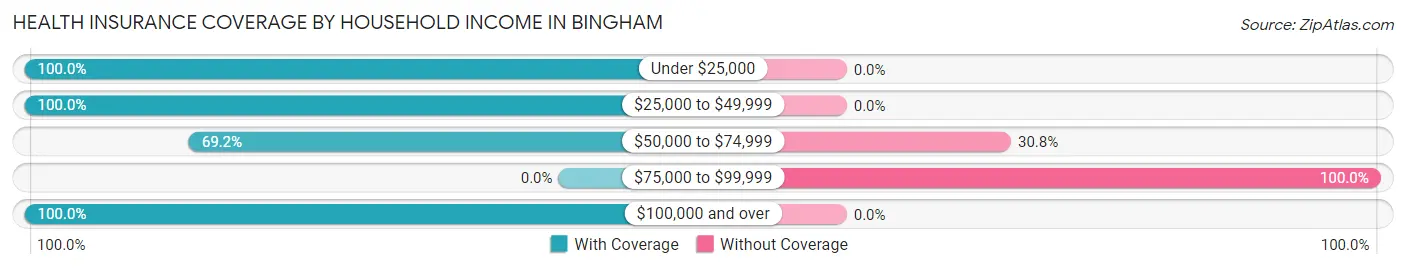
| Household Income | With Coverage | Without Coverage |
| Under $25,000 | 47 (100.0%) | 0 (0.0%) |
| $25,000 to $49,999 | 15 (100.0%) | 0 (0.0%) |
| $50,000 to $74,999 | 36 (69.2%) | 16 (30.8%) |
| $75,000 to $99,999 | 0 (0.0%) | 6 (100.0%) |
| $100,000 and over | 21 (100.0%) | 0 (0.0%) |
Public vs Private Health Insurance Coverage by Age in Bingham
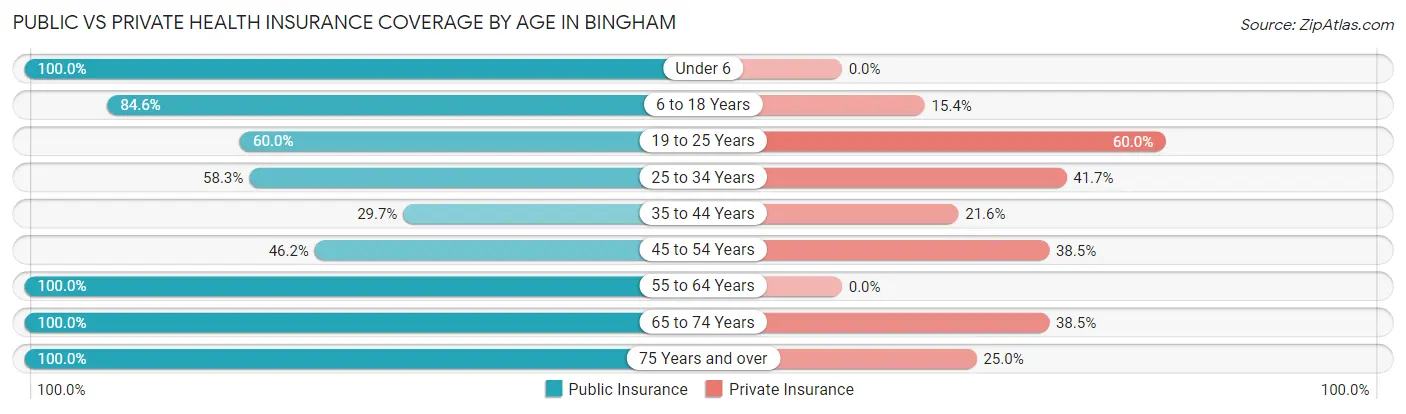
| Age Bracket | Public Insurance | Private Insurance |
| Under 6 | 5 (100.0%) | 0 (0.0%) |
| 6 to 18 Years | 33 (84.6%) | 6 (15.4%) |
| 19 to 25 Years | 3 (60.0%) | 3 (60.0%) |
| 25 to 34 Years | 7 (58.3%) | 5 (41.7%) |
| 35 to 44 Years | 11 (29.7%) | 8 (21.6%) |
| 45 to 54 Years | 6 (46.2%) | 5 (38.5%) |
| 55 to 64 Years | 13 (100.0%) | 0 (0.0%) |
| 65 to 74 Years | 13 (100.0%) | 5 (38.5%) |
| 75 Years and over | 4 (100.0%) | 1 (25.0%) |
| Total | 95 (67.4%) | 33 (23.4%) |
Disability Status by Sex by Age in Bingham
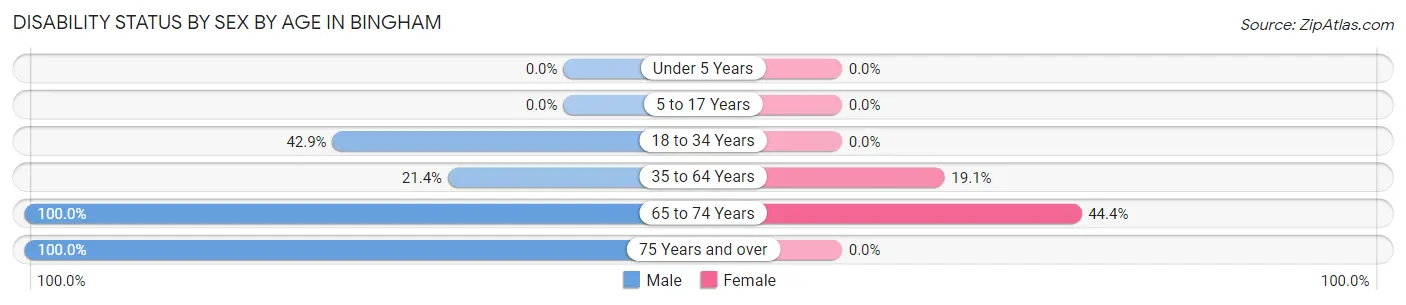
| Age Bracket | Male | Female |
| Under 5 Years | 0 (0.0%) | 0 (0.0%) |
| 5 to 17 Years | 0 (0.0%) | 0 (0.0%) |
| 18 to 34 Years | 3 (42.9%) | 0 (0.0%) |
| 35 to 64 Years | 9 (21.4%) | 4 (19.1%) |
| 65 to 74 Years | 4 (100.0%) | 4 (44.4%) |
| 75 Years and over | 3 (100.0%) | 0 (0.0%) |
Disability Class by Sex by Age in Bingham
Disability Class: Hearing Difficulty
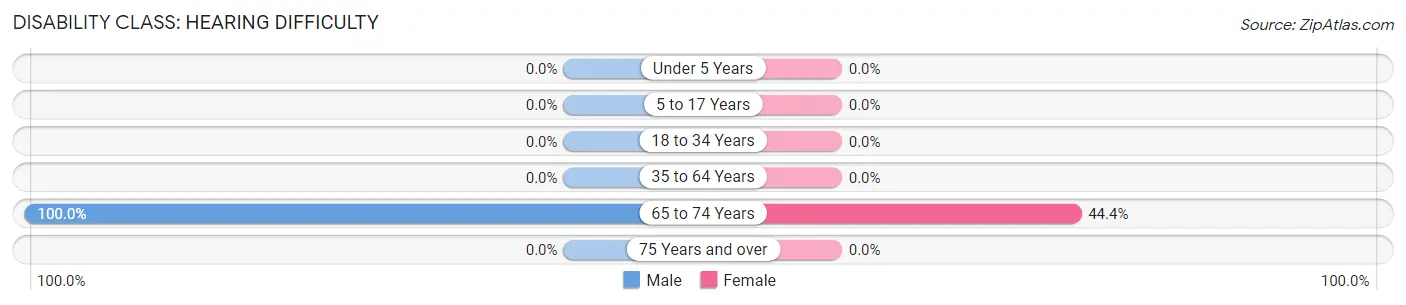
| Age Bracket | Male | Female |
| Under 5 Years | 0 (0.0%) | 0 (0.0%) |
| 5 to 17 Years | 0 (0.0%) | 0 (0.0%) |
| 18 to 34 Years | 0 (0.0%) | 0 (0.0%) |
| 35 to 64 Years | 0 (0.0%) | 0 (0.0%) |
| 65 to 74 Years | 4 (100.0%) | 4 (44.4%) |
| 75 Years and over | 0 (0.0%) | 0 (0.0%) |
Disability Class: Vision Difficulty
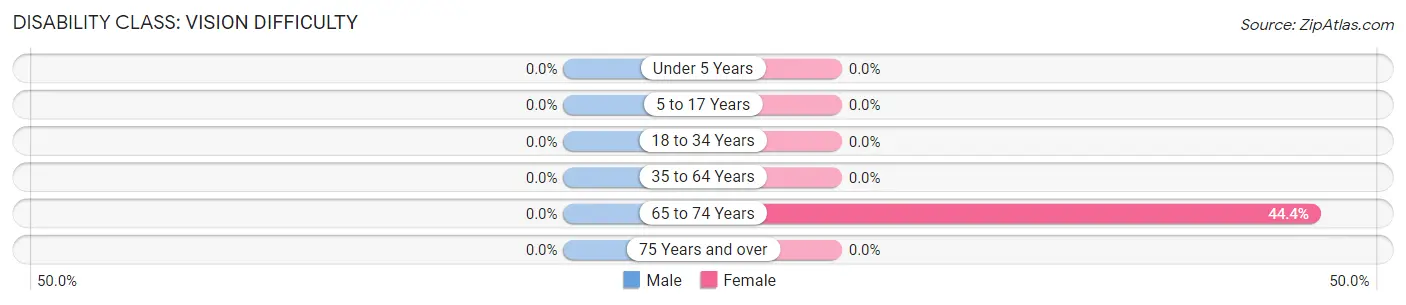
| Age Bracket | Male | Female |
| Under 5 Years | 0 (0.0%) | 0 (0.0%) |
| 5 to 17 Years | 0 (0.0%) | 0 (0.0%) |
| 18 to 34 Years | 0 (0.0%) | 0 (0.0%) |
| 35 to 64 Years | 0 (0.0%) | 0 (0.0%) |
| 65 to 74 Years | 0 (0.0%) | 4 (44.4%) |
| 75 Years and over | 0 (0.0%) | 0 (0.0%) |
Disability Class: Cognitive Difficulty
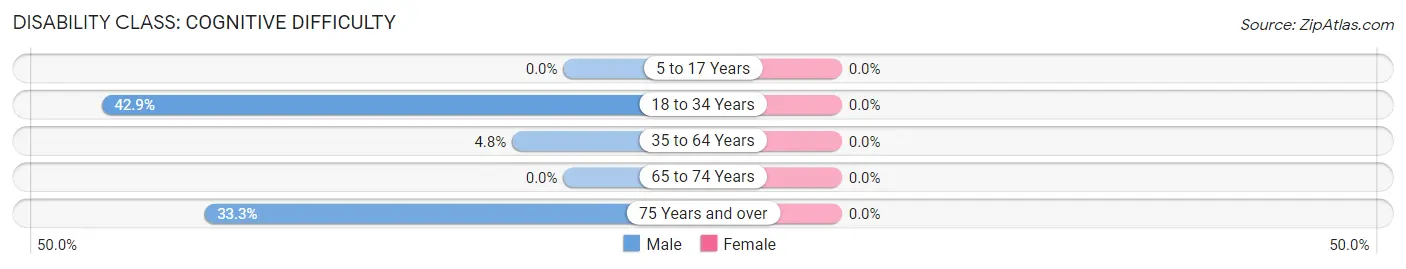
| Age Bracket | Male | Female |
| 5 to 17 Years | 0 (0.0%) | 0 (0.0%) |
| 18 to 34 Years | 3 (42.9%) | 0 (0.0%) |
| 35 to 64 Years | 2 (4.8%) | 0 (0.0%) |
| 65 to 74 Years | 0 (0.0%) | 0 (0.0%) |
| 75 Years and over | 1 (33.3%) | 0 (0.0%) |
Disability Class: Ambulatory Difficulty
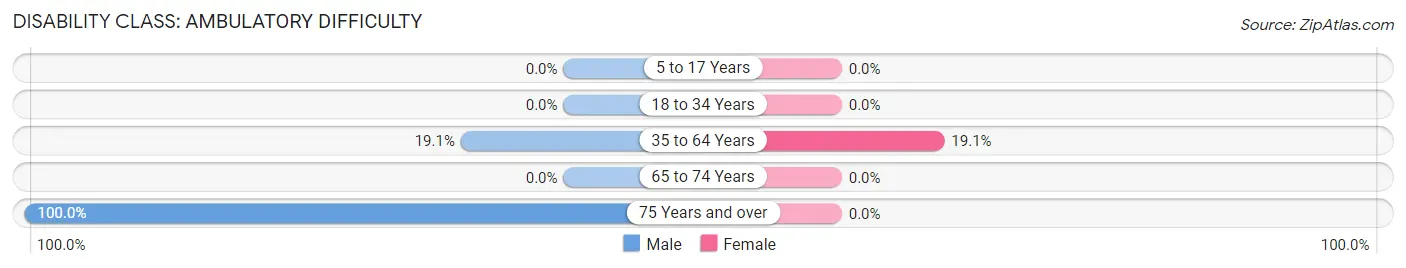
| Age Bracket | Male | Female |
| 5 to 17 Years | 0 (0.0%) | 0 (0.0%) |
| 18 to 34 Years | 0 (0.0%) | 0 (0.0%) |
| 35 to 64 Years | 8 (19.1%) | 4 (19.1%) |
| 65 to 74 Years | 0 (0.0%) | 0 (0.0%) |
| 75 Years and over | 3 (100.0%) | 0 (0.0%) |
Disability Class: Self-Care Difficulty
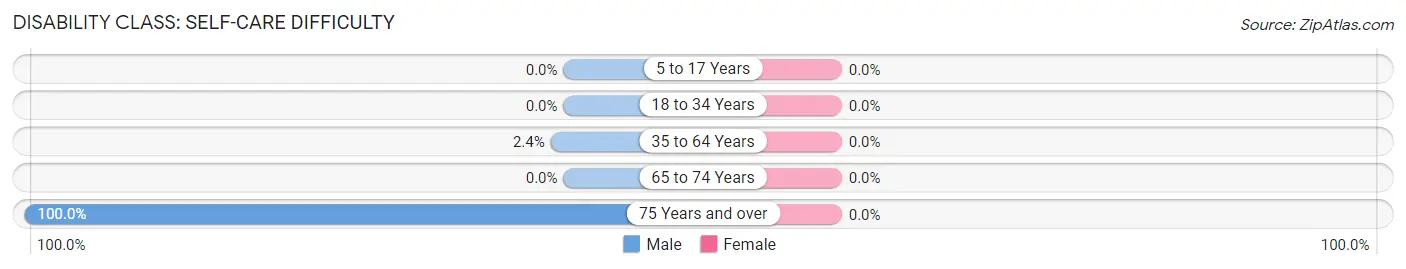
| Age Bracket | Male | Female |
| 5 to 17 Years | 0 (0.0%) | 0 (0.0%) |
| 18 to 34 Years | 0 (0.0%) | 0 (0.0%) |
| 35 to 64 Years | 1 (2.4%) | 0 (0.0%) |
| 65 to 74 Years | 0 (0.0%) | 0 (0.0%) |
| 75 Years and over | 3 (100.0%) | 0 (0.0%) |
Technology Access in Bingham
Computing Device Access in Bingham
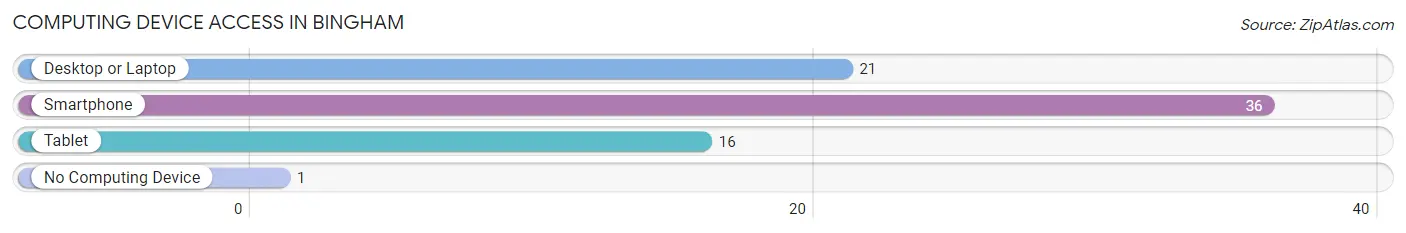
| Device Type | # Households | % Households |
| Desktop or Laptop | 21 | 50.0% |
| Smartphone | 36 | 85.7% |
| Tablet | 16 | 38.1% |
| No Computing Device | 1 | 2.4% |
| Total | 42 | 100.0% |
Internet Access in Bingham
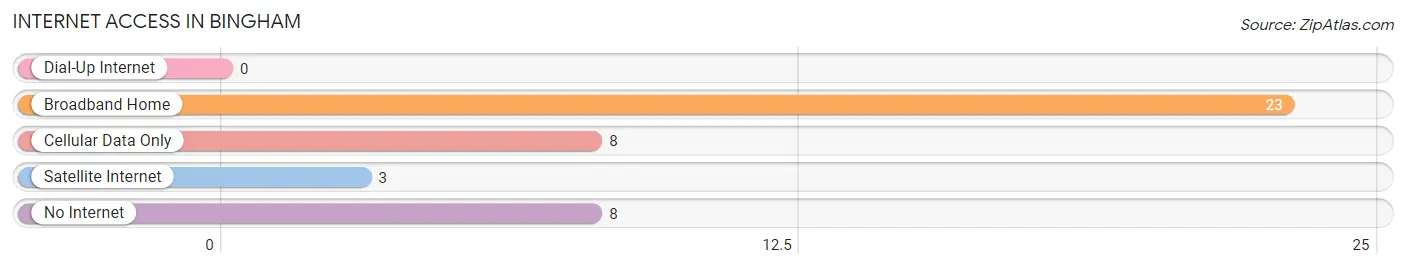
| Internet Type | # Households | % Households |
| Dial-Up Internet | 0 | 0.0% |
| Broadband Home | 23 | 54.8% |
| Cellular Data Only | 8 | 19.1% |
| Satellite Internet | 3 | 7.1% |
| No Internet | 8 | 19.1% |
| Total | 42 | 100.0% |
Bingham Summary
Bingham, Illinois is a small village located in McLean County, Illinois. It is situated in the heart of the Midwest, approximately 25 miles north of Bloomington and 30 miles south of Normal. The village has a population of approximately 1,000 people and is part of the Bloomington-Normal Metropolitan Statistical Area.
History
Bingham was founded in 1854 by William Bingham, a farmer from Ohio. He purchased the land from the government and began to develop the area. The village was originally known as Bingham’s Grove, but the name was changed to Bingham in 1858. The village was incorporated in 1872.
In the late 19th century, Bingham was a thriving agricultural community. The village was home to several grain elevators, a flour mill, a creamery, and a cheese factory. The village also had a blacksmith shop, a general store, and a post office.
In the early 20th century, Bingham began to experience a decline in population as many of its residents moved away to larger cities. The village was also affected by the Great Depression, which caused many businesses to close.
Geography
Bingham is located in the central part of McLean County, Illinois. It is situated in the heart of the Midwest, approximately 25 miles north of Bloomington and 30 miles south of Normal. The village is located on the banks of the Sangamon River, which flows through the village.
The village is surrounded by farmland and is home to several small lakes. The village is also home to a number of parks, including Bingham Park, which features a playground, picnic areas, and a walking trail.
Economy
The economy of Bingham is largely based on agriculture. The village is home to several grain elevators, a flour mill, a creamery, and a cheese factory. The village also has a number of small businesses, including a grocery store, a hardware store, and a restaurant.
The village is also home to a number of manufacturing companies, including a plastics manufacturer and a metal fabrication company. The village is also home to a number of service-based businesses, including a veterinary clinic and a car repair shop.
Demographics
As of the 2010 census, the population of Bingham was 1,000 people. The racial makeup of the village was 97.2% White, 0.7% African American, 0.3% Native American, 0.3% Asian, 0.1% Pacific Islander, and 1.4% from other races. The median household income was $45,000 and the median family income was $50,000.
The village is home to a number of churches, including the First Baptist Church, the United Methodist Church, and the Church of the Nazarene. The village is also home to a number of schools, including Bingham Elementary School, Bingham Middle School, and Bingham High School.
Conclusion
Bingham, Illinois is a small village located in McLean County, Illinois. It is situated in the heart of the Midwest, approximately 25 miles north of Bloomington and 30 miles south of Normal. The village has a population of approximately 1,000 people and is part of the Bloomington-Normal Metropolitan Statistical Area. The economy of Bingham is largely based on agriculture, with a number of small businesses and manufacturing companies located in the village. The racial makeup of the village is predominantly White, with a small percentage of African American, Native American, Asian, and Pacific Islander residents. The village is home to a number of churches and schools, and is a popular destination for outdoor recreation.
Common Questions
What is Per Capita Income in Bingham?
Per Capita income in Bingham is $16,518.
What is the Median Family Income in Bingham?
Median Family Income in Bingham is $55,833.
What is the Median Household income in Bingham?
Median Household Income in Bingham is $48,750.
What is Inequality or Gini Index in Bingham?
Inequality or Gini Index in Bingham is 0.40.
What is the Total Population of Bingham?
Total Population of Bingham is 141.
What is the Total Male Population of Bingham?
Total Male Population of Bingham is 76.
What is the Total Female Population of Bingham?
Total Female Population of Bingham is 65.
What is the Ratio of Males per 100 Females in Bingham?
There are 116.92 Males per 100 Females in Bingham.
What is the Ratio of Females per 100 Males in Bingham?
There are 85.53 Females per 100 Males in Bingham.
What is the Median Population Age in Bingham?
Median Population Age in Bingham is 36.4 Years.
What is the Average Family Size in Bingham
Average Family Size in Bingham is 4.7 People.
What is the Average Household Size in Bingham
Average Household Size in Bingham is 3.4 People.
How Large is the Labor Force in Bingham?
There are 57 People in the Labor Forcein in Bingham.
What is the Percentage of People in the Labor Force in Bingham?
57.0% of People are in the Labor Force in Bingham.