Benton, IL Map & Demographics
Benton Map
Benton Overview
$29,242
PER CAPITA INCOME
$57,539
AVG FAMILY INCOME
$48,784
AVG HOUSEHOLD INCOME
5.7%
WAGE / INCOME GAP [ % ]
94.3¢/ $1
WAGE / INCOME GAP [ $ ]
0.50
INEQUALITY / GINI INDEX
6,999
TOTAL POPULATION
3,389
MALE POPULATION
3,610
FEMALE POPULATION
93.88
MALES / 100 FEMALES
106.52
FEMALES / 100 MALES
40.8
MEDIAN AGE
3.0
AVG FAMILY SIZE
2.3
AVG HOUSEHOLD SIZE
3,007
LABOR FORCE [ PEOPLE ]
53.4%
PERCENT IN LABOR FORCE
5.1%
UNEMPLOYMENT RATE
Benton Zip Codes
Benton Area Codes
Income in Benton
Income Overview in Benton
Per Capita Income in Benton is $29,242, while median incomes of families and households are $57,539 and $48,784 respectively.
| Characteristic | Number | Measure |
| Per Capita Income | 6,999 | $29,242 |
| Median Family Income | 1,743 | $57,539 |
| Mean Family Income | 1,743 | $86,995 |
| Median Household Income | 2,923 | $48,784 |
| Mean Household Income | 2,923 | $70,582 |
| Income Deficit | 1,743 | $0 |
| Wage / Income Gap (%) | 6,999 | 5.70% |
| Wage / Income Gap ($) | 6,999 | 94.30¢ per $1 |
| Gini / Inequality Index | 6,999 | 0.50 |
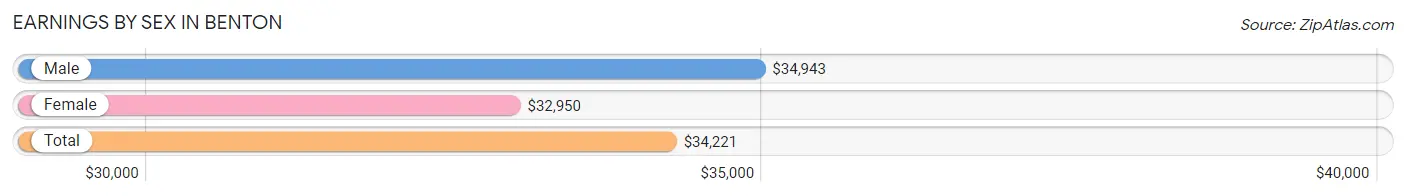
Earnings by Sex in Benton
Average Earnings in Benton are $34,221, $34,943 for men and $32,950 for women, a difference of 5.7%.
| Sex | Number | Average Earnings |
| Male | 1,680 (52.2%) | $34,943 |
| Female | 1,540 (47.8%) | $32,950 |
| Total | 3,220 (100.0%) | $34,221 |
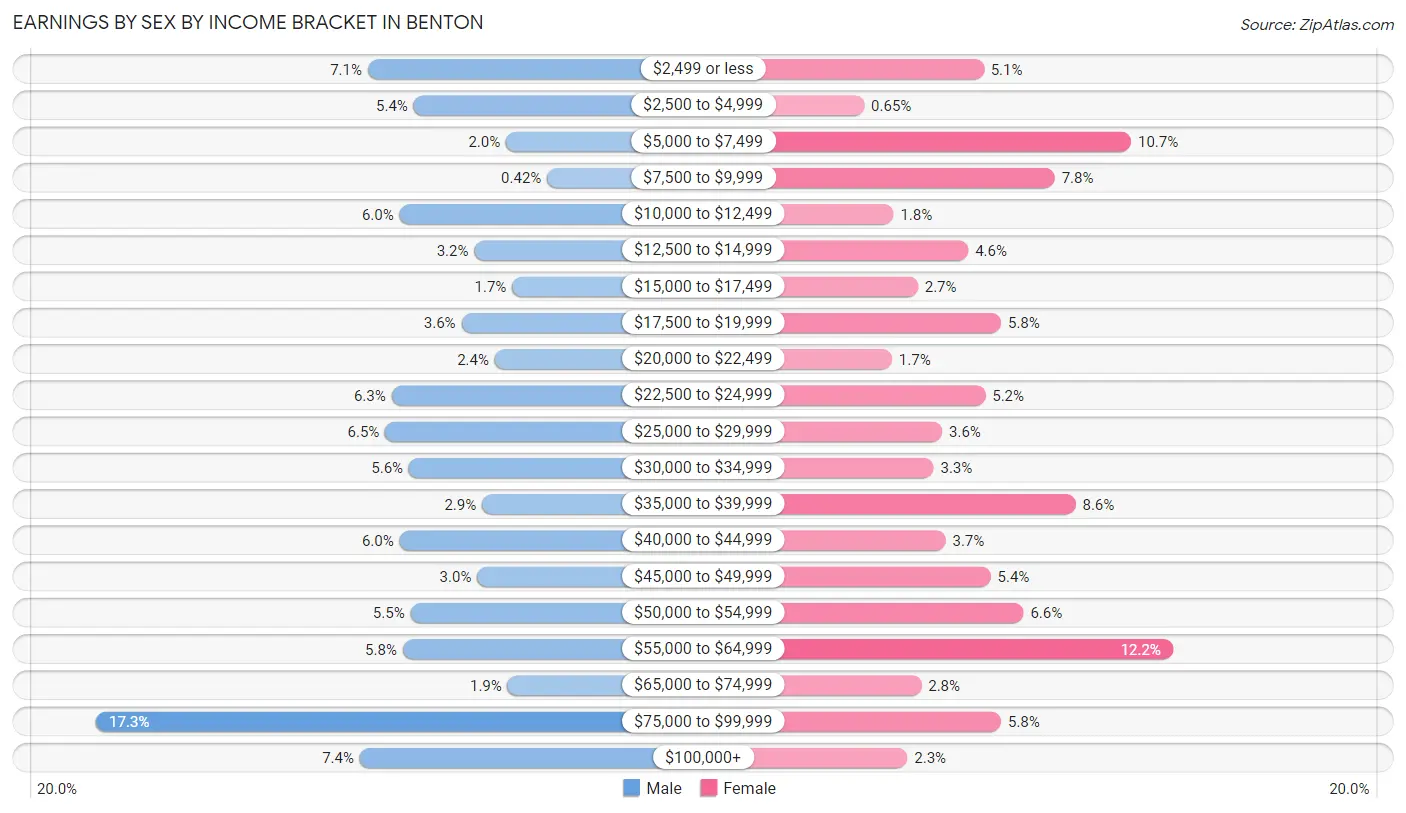
Earnings by Sex by Income Bracket in Benton
The most common earnings brackets in Benton are $75,000 to $99,999 for men (291 | 17.3%) and $55,000 to $64,999 for women (188 | 12.2%).
| Income | Male | Female |
| $2,499 or less | 120 (7.1%) | 79 (5.1%) |
| $2,500 to $4,999 | 91 (5.4%) | 10 (0.6%) |
| $5,000 to $7,499 | 33 (2.0%) | 164 (10.6%) |
| $7,500 to $9,999 | 7 (0.4%) | 120 (7.8%) |
| $10,000 to $12,499 | 100 (5.9%) | 27 (1.8%) |
| $12,500 to $14,999 | 53 (3.2%) | 70 (4.5%) |
| $15,000 to $17,499 | 29 (1.7%) | 41 (2.7%) |
| $17,500 to $19,999 | 61 (3.6%) | 89 (5.8%) |
| $20,000 to $22,499 | 40 (2.4%) | 26 (1.7%) |
| $22,500 to $24,999 | 105 (6.2%) | 80 (5.2%) |
| $25,000 to $29,999 | 109 (6.5%) | 55 (3.6%) |
| $30,000 to $34,999 | 94 (5.6%) | 50 (3.3%) |
| $35,000 to $39,999 | 48 (2.9%) | 132 (8.6%) |
| $40,000 to $44,999 | 100 (5.9%) | 57 (3.7%) |
| $45,000 to $49,999 | 51 (3.0%) | 83 (5.4%) |
| $50,000 to $54,999 | 93 (5.5%) | 102 (6.6%) |
| $55,000 to $64,999 | 98 (5.8%) | 188 (12.2%) |
| $65,000 to $74,999 | 32 (1.9%) | 43 (2.8%) |
| $75,000 to $99,999 | 291 (17.3%) | 89 (5.8%) |
| $100,000+ | 125 (7.4%) | 35 (2.3%) |
| Total | 1,680 (100.0%) | 1,540 (100.0%) |
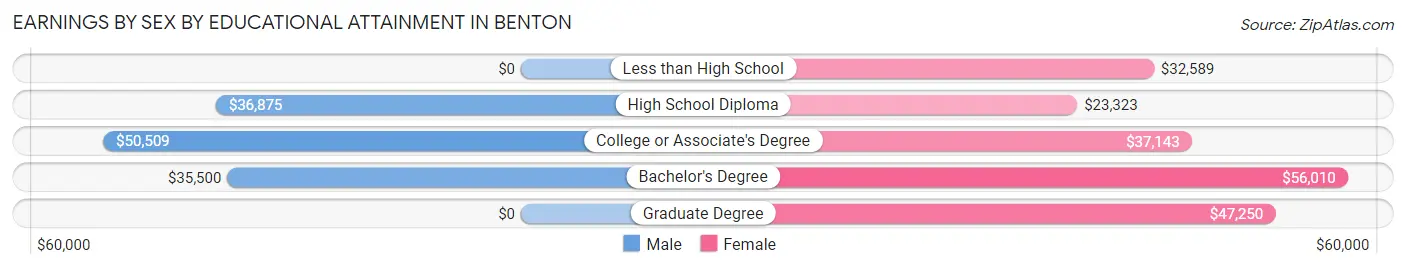
Earnings by Sex by Educational Attainment in Benton
Average earnings in Benton are $42,256 for men and $37,468 for women, a difference of 11.3%. Men with an educational attainment of college or associate's degree enjoy the highest average annual earnings of $50,509, while those with bachelor's degree education earn the least with $35,500. Women with an educational attainment of bachelor's degree earn the most with the average annual earnings of $56,010, while those with high school diploma education have the smallest earnings of $23,323.
| Educational Attainment | Male Income | Female Income |
| Less than High School | - | - |
| High School Diploma | $36,875 | $23,323 |
| College or Associate's Degree | $50,509 | $37,143 |
| Bachelor's Degree | $35,500 | $56,010 |
| Graduate Degree | - | - |
| Total | $42,256 | $37,468 |
Family Income in Benton
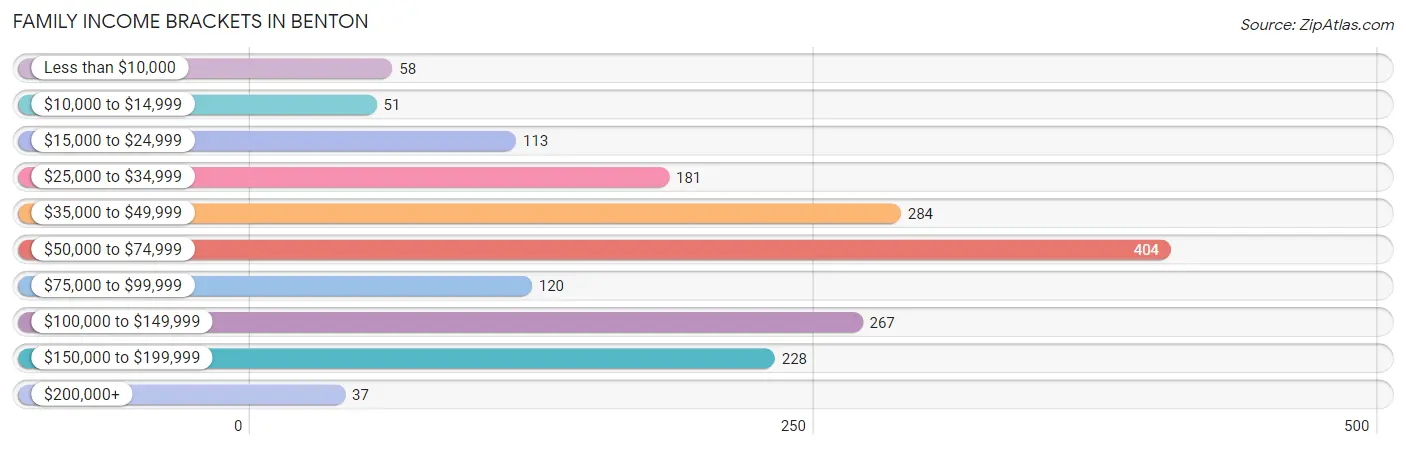
Family Income Brackets in Benton
According to the Benton family income data, there are 404 families falling into the $50,000 to $74,999 income range, which is the most common income bracket and makes up 23.2% of all families. Conversely, the $200,000+ income bracket is the least frequent group with only 37 families (2.1%) belonging to this category.
| Income Bracket | # Families | % Families |
| Less than $10,000 | 58 | 3.3% |
| $10,000 to $14,999 | 51 | 2.9% |
| $15,000 to $24,999 | 113 | 6.5% |
| $25,000 to $34,999 | 181 | 10.4% |
| $35,000 to $49,999 | 284 | 16.3% |
| $50,000 to $74,999 | 404 | 23.2% |
| $75,000 to $99,999 | 120 | 6.9% |
| $100,000 to $149,999 | 267 | 15.3% |
| $150,000 to $199,999 | 228 | 13.1% |
| $200,000+ | 37 | 2.1% |
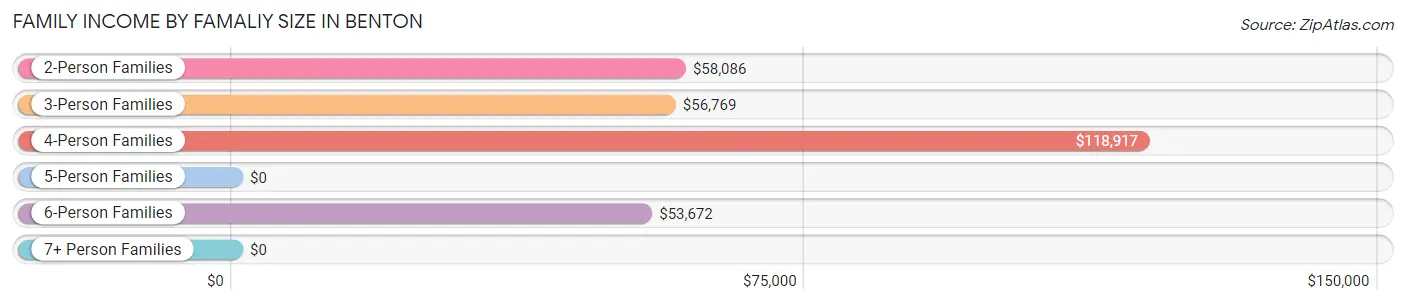
Family Income by Famaliy Size in Benton
4-person families (175 | 10.0%) account for the highest median family income in Benton with $118,917 per family, while 4-person families (175 | 10.0%) have the highest median income of $29,729 per family member.
| Income Bracket | # Families | Median Income |
| 2-Person Families | 811 (46.5%) | $58,086 |
| 3-Person Families | 499 (28.6%) | $56,769 |
| 4-Person Families | 175 (10.0%) | $118,917 |
| 5-Person Families | 74 (4.3%) | $0 |
| 6-Person Families | 173 (9.9%) | $53,672 |
| 7+ Person Families | 11 (0.6%) | $0 |
| Total | 1,743 (100.0%) | $57,539 |
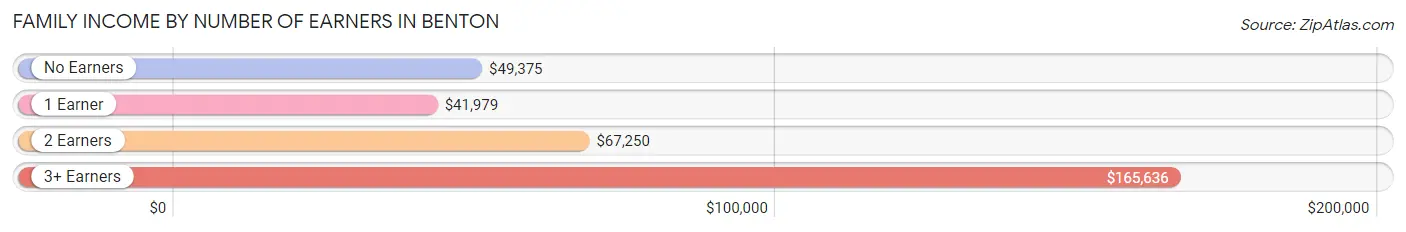
Family Income by Number of Earners in Benton
The median family income in Benton is $57,539, with families comprising 3+ earners (238) having the highest median family income of $165,636, while families with 1 earner (631) have the lowest median family income of $41,979, accounting for 13.7% and 36.2% of families, respectively.
| Number of Earners | # Families | Median Income |
| No Earners | 306 (17.6%) | $49,375 |
| 1 Earner | 631 (36.2%) | $41,979 |
| 2 Earners | 568 (32.6%) | $67,250 |
| 3+ Earners | 238 (13.7%) | $165,636 |
| Total | 1,743 (100.0%) | $57,539 |
Household Income in Benton
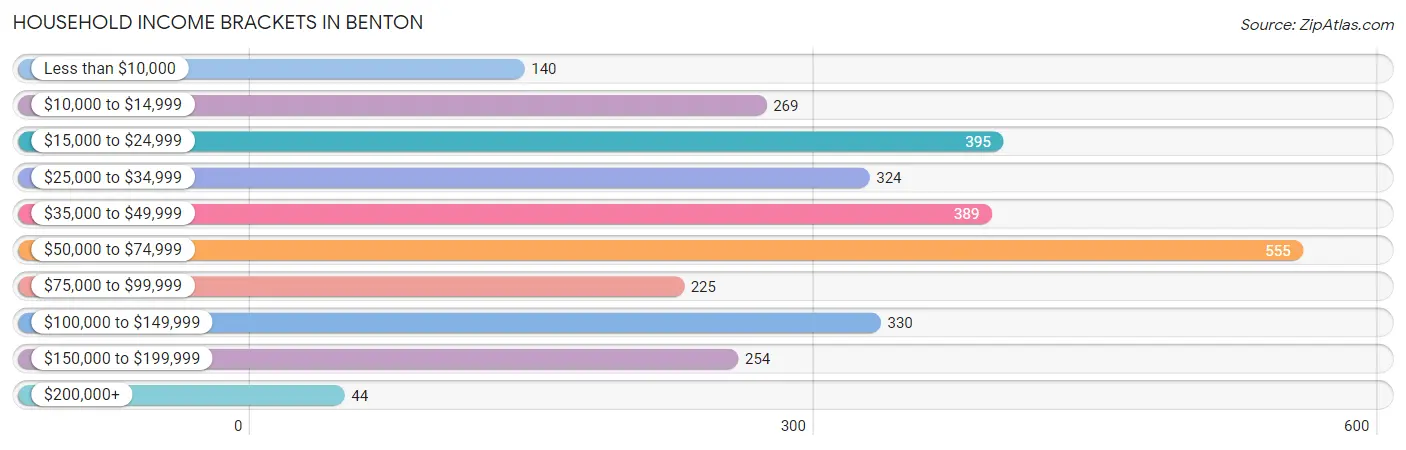
Household Income Brackets in Benton
With 555 households falling in the category, the $50,000 to $74,999 income range is the most frequent in Benton, accounting for 19.0% of all households. In contrast, only 44 households (1.5%) fall into the $200,000+ income bracket, making it the least populous group.
| Income Bracket | # Households | % Households |
| Less than $10,000 | 140 | 4.8% |
| $10,000 to $14,999 | 269 | 9.2% |
| $15,000 to $24,999 | 395 | 13.5% |
| $25,000 to $34,999 | 324 | 11.1% |
| $35,000 to $49,999 | 389 | 13.3% |
| $50,000 to $74,999 | 555 | 19.0% |
| $75,000 to $99,999 | 225 | 7.7% |
| $100,000 to $149,999 | 330 | 11.3% |
| $150,000 to $199,999 | 254 | 8.7% |
| $200,000+ | 44 | 1.5% |
Household Income by Householder Age in Benton
The median household income in Benton is $48,784, with the highest median household income of $62,000 found in the 25 to 44 years age bracket for the primary householder. A total of 786 households (26.9%) fall into this category. Meanwhile, the 15 to 24 years age bracket for the primary householder has the lowest median household income of $0, with 105 households (3.6%) in this group.
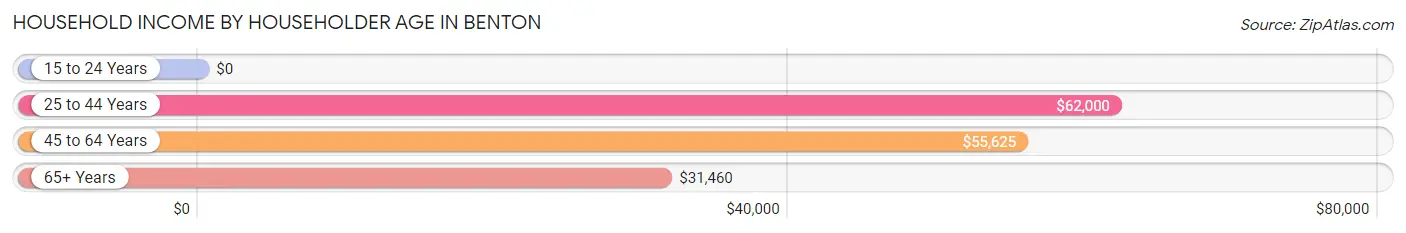
| Income Bracket | # Households | Median Income |
| 15 to 24 Years | 105 (3.6%) | $0 |
| 25 to 44 Years | 786 (26.9%) | $62,000 |
| 45 to 64 Years | 1,001 (34.3%) | $55,625 |
| 65+ Years | 1,031 (35.3%) | $31,460 |
| Total | 2,923 (100.0%) | $48,784 |
Poverty in Benton
Income Below Poverty by Sex and Age in Benton
With 14.1% poverty level for males and 18.3% for females among the residents of Benton, 45 to 54 year old males and 16 and 17 year old females are the most vulnerable to poverty, with 130 males (32.7%) and 62 females (70.5%) in their respective age groups living below the poverty level.
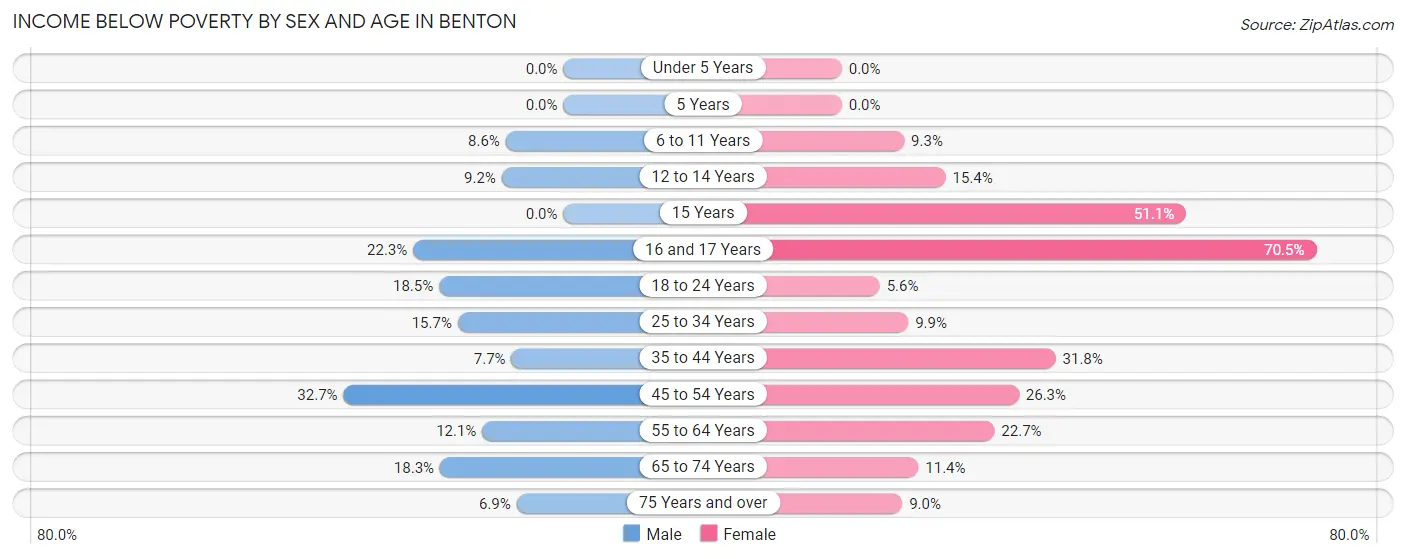
| Age Bracket | Male | Female |
| Under 5 Years | 0 (0.0%) | 0 (0.0%) |
| 5 Years | 0 (0.0%) | 0 (0.0%) |
| 6 to 11 Years | 25 (8.6%) | 15 (9.3%) |
| 12 to 14 Years | 12 (9.2%) | 37 (15.4%) |
| 15 Years | 0 (0.0%) | 46 (51.1%) |
| 16 and 17 Years | 27 (22.3%) | 62 (70.5%) |
| 18 to 24 Years | 48 (18.5%) | 12 (5.6%) |
| 25 to 34 Years | 69 (15.7%) | 41 (9.9%) |
| 35 to 44 Years | 33 (7.7%) | 114 (31.8%) |
| 45 to 54 Years | 130 (32.7%) | 102 (26.3%) |
| 55 to 64 Years | 40 (12.0%) | 121 (22.7%) |
| 65 to 74 Years | 55 (18.3%) | 53 (11.4%) |
| 75 Years and over | 15 (6.9%) | 34 (9.0%) |
| Total | 454 (14.1%) | 637 (18.3%) |
Income Above Poverty by Sex and Age in Benton
According to the poverty statistics in Benton, males aged under 5 years and females aged under 5 years are the age groups that are most secure financially, with 100.0% of males and 100.0% of females in these age groups living above the poverty line.
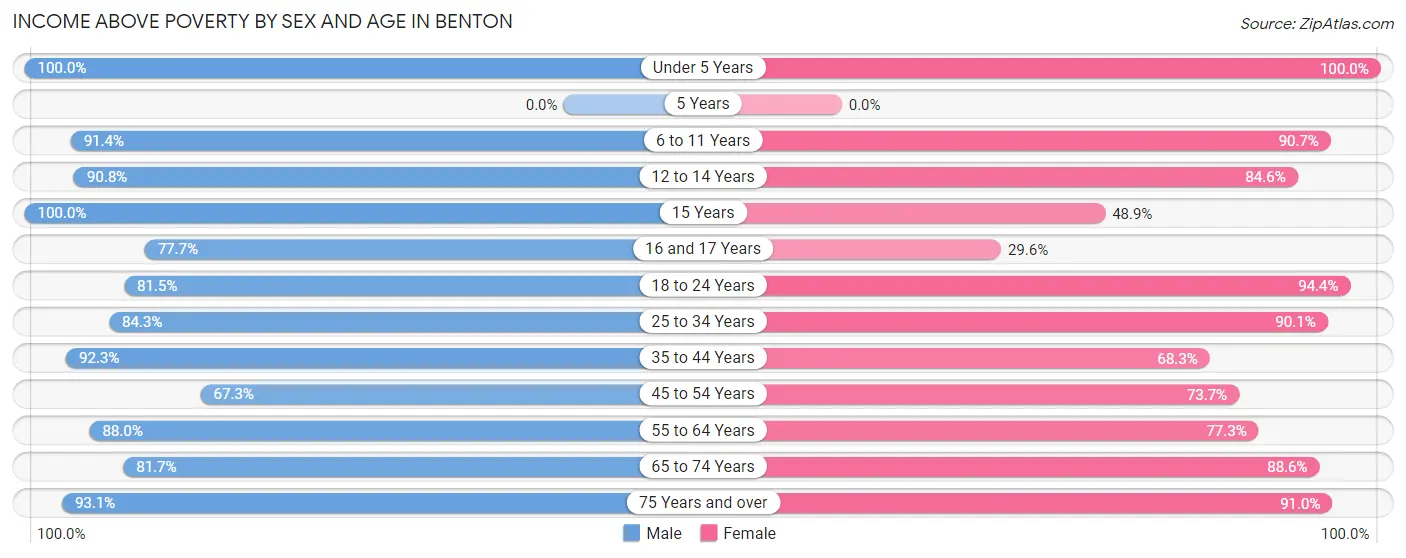
| Age Bracket | Male | Female |
| Under 5 Years | 217 (100.0%) | 146 (100.0%) |
| 5 Years | 0 (0.0%) | 0 (0.0%) |
| 6 to 11 Years | 267 (91.4%) | 147 (90.7%) |
| 12 to 14 Years | 119 (90.8%) | 203 (84.6%) |
| 15 Years | 77 (100.0%) | 44 (48.9%) |
| 16 and 17 Years | 94 (77.7%) | 26 (29.5%) |
| 18 to 24 Years | 212 (81.5%) | 201 (94.4%) |
| 25 to 34 Years | 371 (84.3%) | 375 (90.1%) |
| 35 to 44 Years | 395 (92.3%) | 245 (68.2%) |
| 45 to 54 Years | 268 (67.3%) | 286 (73.7%) |
| 55 to 64 Years | 292 (87.9%) | 413 (77.3%) |
| 65 to 74 Years | 245 (81.7%) | 413 (88.6%) |
| 75 Years and over | 201 (93.1%) | 345 (91.0%) |
| Total | 2,758 (85.9%) | 2,844 (81.7%) |
Income Below Poverty Among Married-Couple Families in Benton
The poverty statistics for married-couple families in Benton show that 4.7% or 58 of the total 1,228 families live below the poverty line. Families with no children have the highest poverty rate of 6.0%, comprising of 44 families. On the other hand, families with 3 or 4 children have the lowest poverty rate of 0.0%, which includes 0 families.
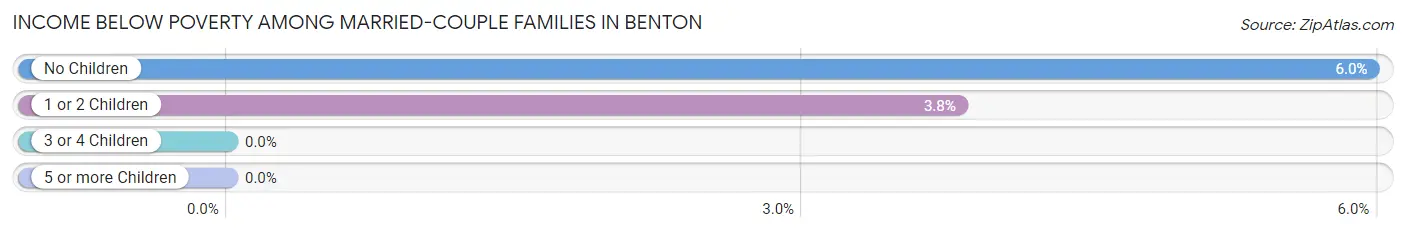
| Children | Above Poverty | Below Poverty |
| No Children | 694 (94.0%) | 44 (6.0%) |
| 1 or 2 Children | 353 (96.2%) | 14 (3.8%) |
| 3 or 4 Children | 123 (100.0%) | 0 (0.0%) |
| 5 or more Children | 0 (0.0%) | 0 (0.0%) |
| Total | 1,170 (95.3%) | 58 (4.7%) |
Income Below Poverty Among Single-Parent Households in Benton
According to the poverty data in Benton, 41.5% or 34 single-father households and 34.6% or 150 single-mother households are living below the poverty line. Among single-father households, those with 1 or 2 children have the highest poverty rate, with 34 households (60.7%) experiencing poverty. Likewise, among single-mother households, those with 3 or 4 children have the highest poverty rate, with 41 households (62.1%) falling below the poverty line.
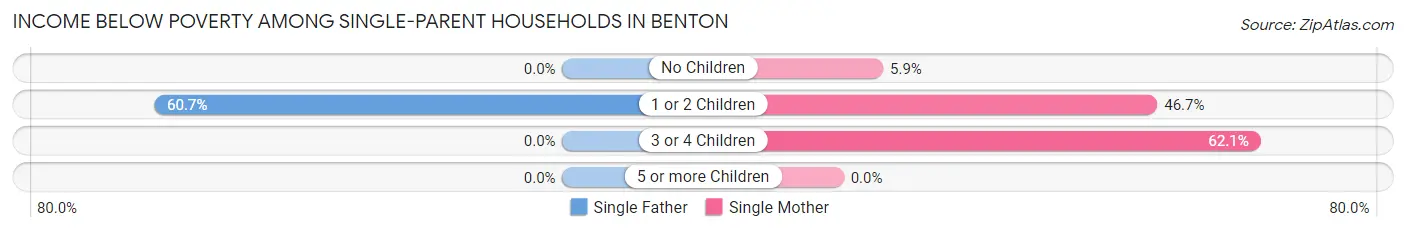
| Children | Single Father | Single Mother |
| No Children | 0 (0.0%) | 9 (5.9%) |
| 1 or 2 Children | 34 (60.7%) | 100 (46.7%) |
| 3 or 4 Children | 0 (0.0%) | 41 (62.1%) |
| 5 or more Children | 0 (0.0%) | 0 (0.0%) |
| Total | 34 (41.5%) | 150 (34.6%) |
Income Below Poverty Among Married-Couple vs Single-Parent Households in Benton
The poverty data for Benton shows that 58 of the married-couple family households (4.7%) and 184 of the single-parent households (35.7%) are living below the poverty level. Within the married-couple family households, those with no children have the highest poverty rate, with 44 households (6.0%) falling below the poverty line. Among the single-parent households, those with 3 or 4 children have the highest poverty rate, with 41 household (56.2%) living below poverty.
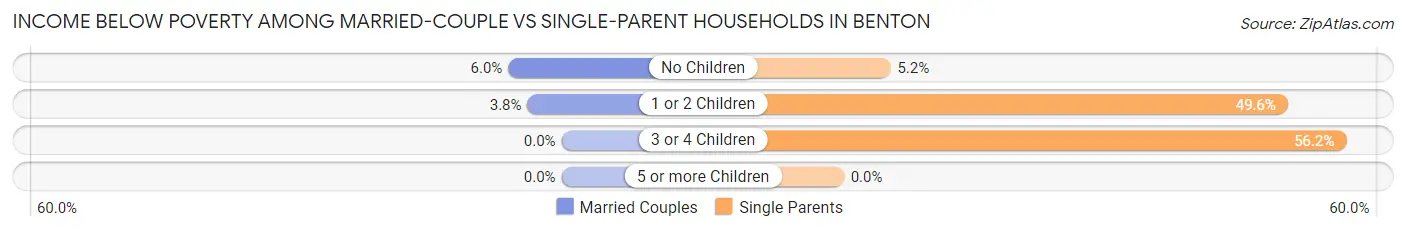
| Children | Married-Couple Families | Single-Parent Households |
| No Children | 44 (6.0%) | 9 (5.2%) |
| 1 or 2 Children | 14 (3.8%) | 134 (49.6%) |
| 3 or 4 Children | 0 (0.0%) | 41 (56.2%) |
| 5 or more Children | 0 (0.0%) | 0 (0.0%) |
| Total | 58 (4.7%) | 184 (35.7%) |
Race in Benton
The most populous races in Benton are White / Caucasian (6,467 | 92.4%), Two or more Races (468 | 6.7%), and Hispanic or Latino (281 | 4.0%).
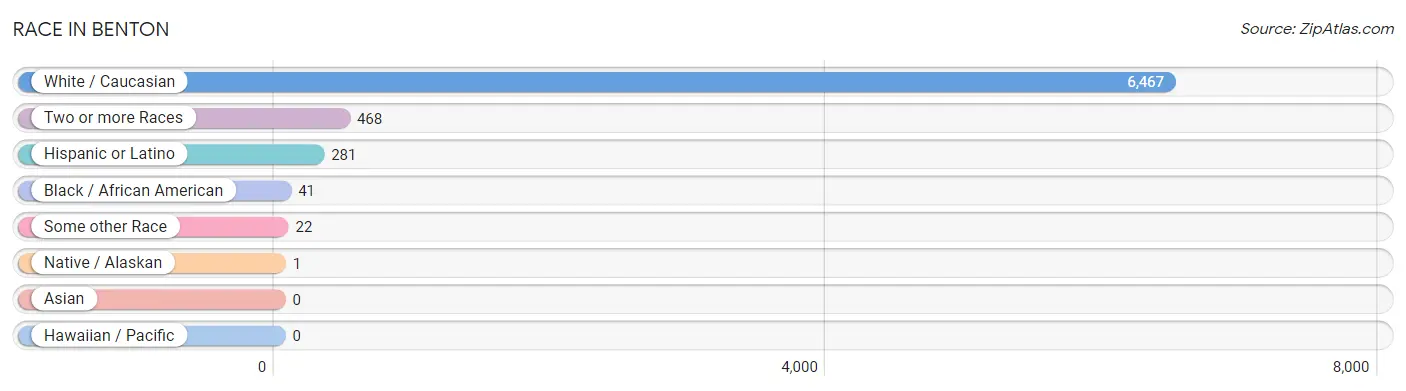
| Race | # Population | % Population |
| Asian | 0 | 0.0% |
| Black / African American | 41 | 0.6% |
| Hawaiian / Pacific | 0 | 0.0% |
| Hispanic or Latino | 281 | 4.0% |
| Native / Alaskan | 1 | 0.0% |
| White / Caucasian | 6,467 | 92.4% |
| Two or more Races | 468 | 6.7% |
| Some other Race | 22 | 0.3% |
| Total | 6,999 | 100.0% |
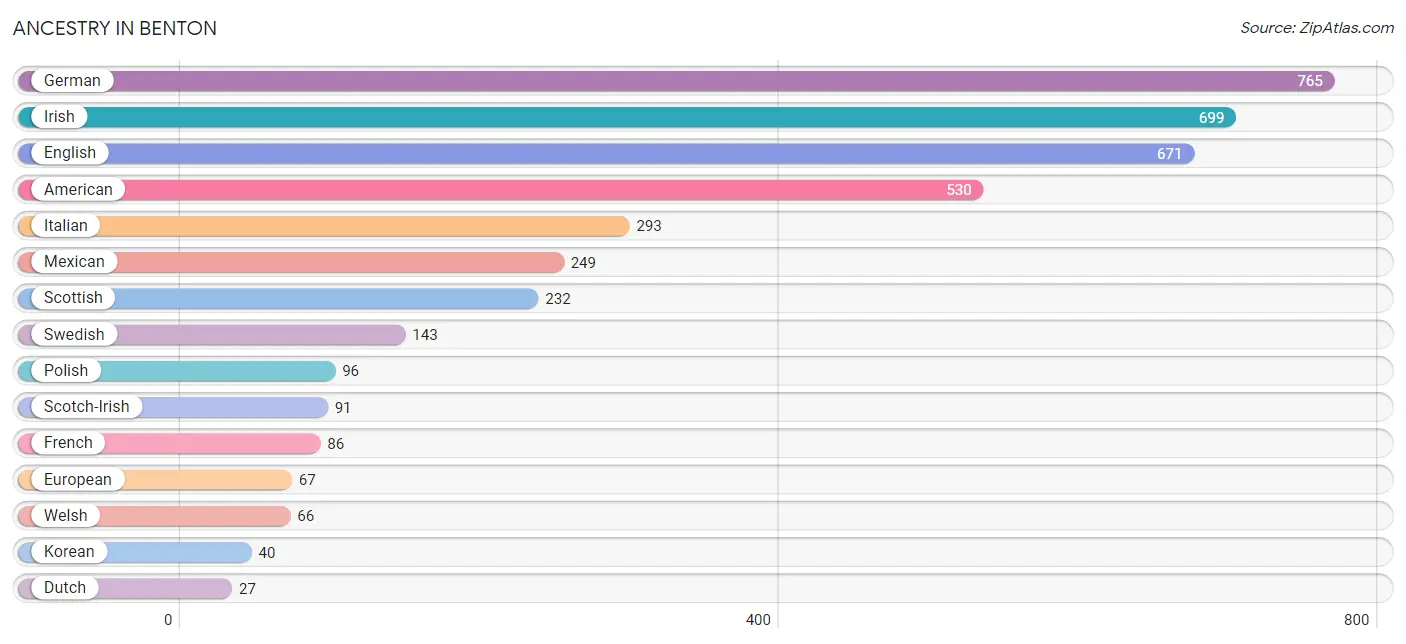
Ancestry in Benton
The most populous ancestries reported in Benton are German (765 | 10.9%), Irish (699 | 10.0%), English (671 | 9.6%), American (530 | 7.6%), and Italian (293 | 4.2%), together accounting for 42.3% of all Benton residents.
| Ancestry | # Population | % Population |
| African | 2 | 0.0% |
| American | 530 | 7.6% |
| Austrian | 9 | 0.1% |
| Blackfeet | 1 | 0.0% |
| British | 7 | 0.1% |
| Czech | 20 | 0.3% |
| Dutch | 27 | 0.4% |
| Eastern European | 26 | 0.4% |
| English | 671 | 9.6% |
| European | 67 | 1.0% |
| Finnish | 14 | 0.2% |
| French | 86 | 1.2% |
| German | 765 | 10.9% |
| Greek | 10 | 0.1% |
| Hungarian | 15 | 0.2% |
| Irish | 699 | 10.0% |
| Italian | 293 | 4.2% |
| Jamaican | 1 | 0.0% |
| Korean | 40 | 0.6% |
| Lithuanian | 7 | 0.1% |
| Mexican | 249 | 3.6% |
| Northern European | 9 | 0.1% |
| Norwegian | 16 | 0.2% |
| Polish | 96 | 1.4% |
| Puerto Rican | 10 | 0.1% |
| Russian | 13 | 0.2% |
| Scandinavian | 3 | 0.0% |
| Scotch-Irish | 91 | 1.3% |
| Scottish | 232 | 3.3% |
| South African | 13 | 0.2% |
| Spanish | 19 | 0.3% |
| Subsaharan African | 15 | 0.2% |
| Swedish | 143 | 2.0% |
| Welsh | 66 | 0.9% | View All 34 Rows |
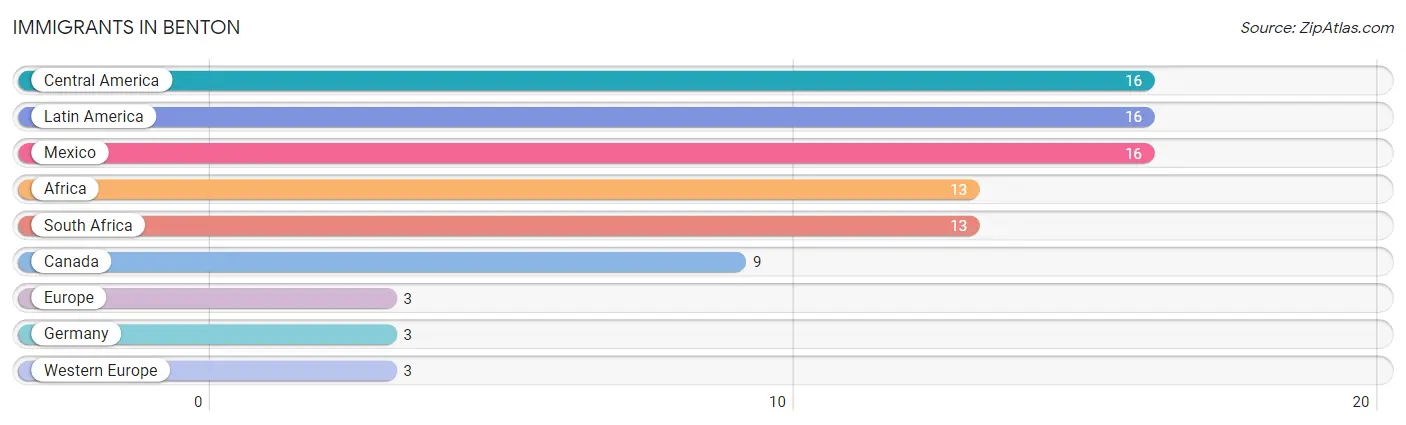
Immigrants in Benton
The most numerous immigrant groups reported in Benton came from Central America (16 | 0.2%), Latin America (16 | 0.2%), Mexico (16 | 0.2%), Africa (13 | 0.2%), and South Africa (13 | 0.2%), together accounting for 1.1% of all Benton residents.
| Immigration Origin | # Population | % Population |
| Africa | 13 | 0.2% |
| Canada | 9 | 0.1% |
| Central America | 16 | 0.2% |
| Europe | 3 | 0.0% |
| Germany | 3 | 0.0% |
| Latin America | 16 | 0.2% |
| Mexico | 16 | 0.2% |
| South Africa | 13 | 0.2% |
| Western Europe | 3 | 0.0% | View All 9 Rows |
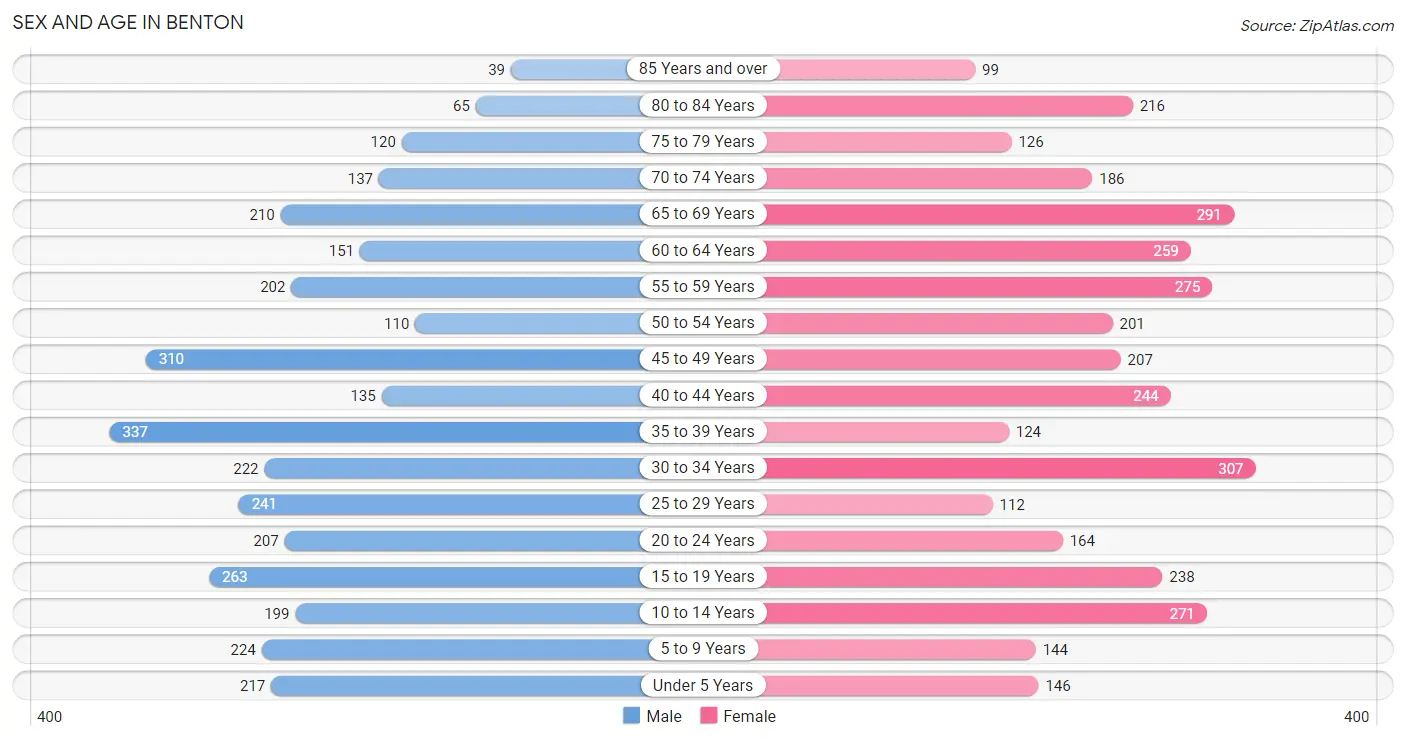
Sex and Age in Benton
Sex and Age in Benton
The most populous age groups in Benton are 35 to 39 Years (337 | 9.9%) for men and 30 to 34 Years (307 | 8.5%) for women.
| Age Bracket | Male | Female |
| Under 5 Years | 217 (6.4%) | 146 (4.0%) |
| 5 to 9 Years | 224 (6.6%) | 144 (4.0%) |
| 10 to 14 Years | 199 (5.9%) | 271 (7.5%) |
| 15 to 19 Years | 263 (7.8%) | 238 (6.6%) |
| 20 to 24 Years | 207 (6.1%) | 164 (4.5%) |
| 25 to 29 Years | 241 (7.1%) | 112 (3.1%) |
| 30 to 34 Years | 222 (6.6%) | 307 (8.5%) |
| 35 to 39 Years | 337 (9.9%) | 124 (3.4%) |
| 40 to 44 Years | 135 (4.0%) | 244 (6.8%) |
| 45 to 49 Years | 310 (9.1%) | 207 (5.7%) |
| 50 to 54 Years | 110 (3.3%) | 201 (5.6%) |
| 55 to 59 Years | 202 (6.0%) | 275 (7.6%) |
| 60 to 64 Years | 151 (4.5%) | 259 (7.2%) |
| 65 to 69 Years | 210 (6.2%) | 291 (8.1%) |
| 70 to 74 Years | 137 (4.0%) | 186 (5.1%) |
| 75 to 79 Years | 120 (3.5%) | 126 (3.5%) |
| 80 to 84 Years | 65 (1.9%) | 216 (6.0%) |
| 85 Years and over | 39 (1.1%) | 99 (2.7%) |
| Total | 3,389 (100.0%) | 3,610 (100.0%) |
Families and Households in Benton
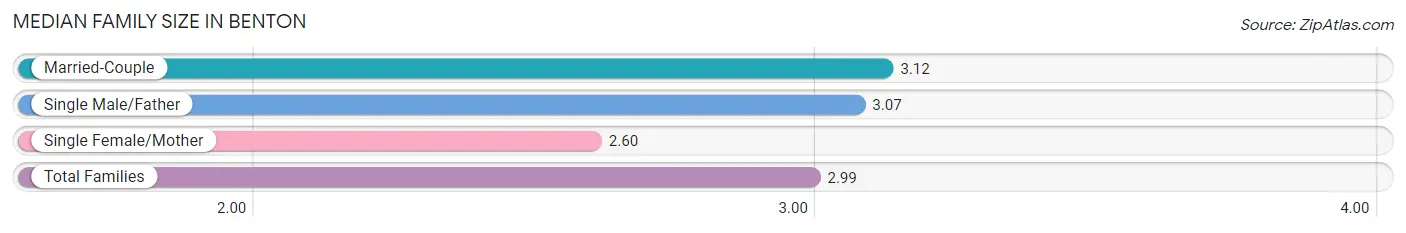
Median Family Size in Benton
The median family size in Benton is 2.99 persons per family, with married-couple families (1,228 | 70.5%) accounting for the largest median family size of 3.12 persons per family. On the other hand, single female/mother families (433 | 24.8%) represent the smallest median family size with 2.60 persons per family.
| Family Type | # Families | Family Size |
| Married-Couple | 1,228 (70.5%) | 3.12 |
| Single Male/Father | 82 (4.7%) | 3.07 |
| Single Female/Mother | 433 (24.8%) | 2.60 |
| Total Families | 1,743 (100.0%) | 2.99 |
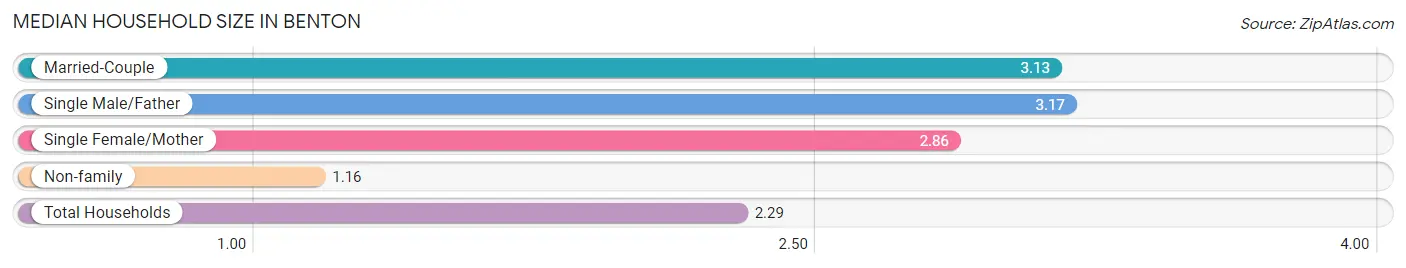
Median Household Size in Benton
The median household size in Benton is 2.29 persons per household, with single male/father households (82 | 2.8%) accounting for the largest median household size of 3.17 persons per household. non-family households (1,180 | 40.4%) represent the smallest median household size with 1.16 persons per household.
| Household Type | # Households | Household Size |
| Married-Couple | 1,228 (42.0%) | 3.13 |
| Single Male/Father | 82 (2.8%) | 3.17 |
| Single Female/Mother | 433 (14.8%) | 2.86 |
| Non-family | 1,180 (40.4%) | 1.16 |
| Total Households | 2,923 (100.0%) | 2.29 |
Household Size by Marriage Status in Benton
Out of a total of 2,923 households in Benton, 1,743 (59.6%) are family households, while 1,180 (40.4%) are nonfamily households. The most numerous type of family households are 2-person households, comprising 763, and the most common type of nonfamily households are 1-person households, comprising 1,037.
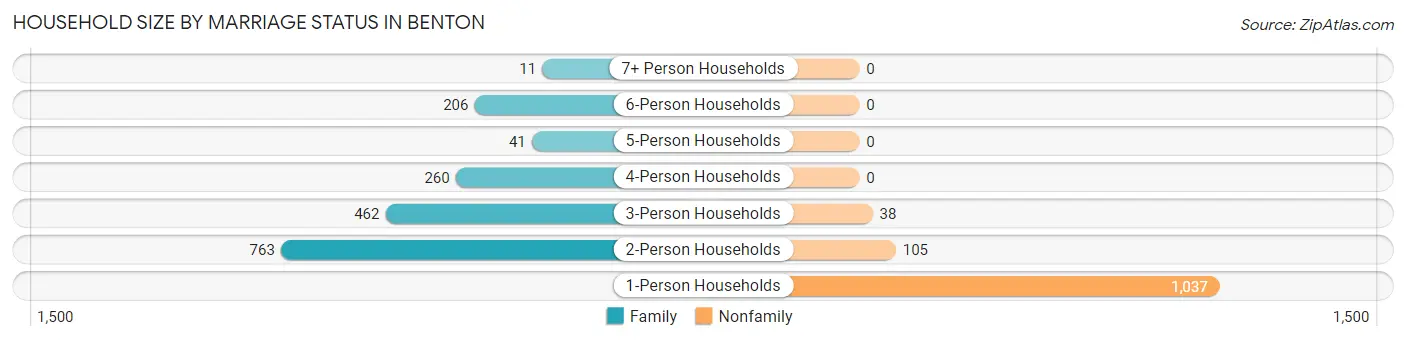
| Household Size | Family Households | Nonfamily Households |
| 1-Person Households | - | 1,037 (35.5%) |
| 2-Person Households | 763 (26.1%) | 105 (3.6%) |
| 3-Person Households | 462 (15.8%) | 38 (1.3%) |
| 4-Person Households | 260 (8.9%) | 0 (0.0%) |
| 5-Person Households | 41 (1.4%) | 0 (0.0%) |
| 6-Person Households | 206 (7.0%) | 0 (0.0%) |
| 7+ Person Households | 11 (0.4%) | 0 (0.0%) |
| Total | 1,743 (59.6%) | 1,180 (40.4%) |
Female Fertility in Benton
Fertility by Age in Benton
Average fertility rate in Benton is 89.0 births per 1,000 women. Women in the age bracket of 20 to 34 years have the highest fertility rate with 223.0 births per 1,000 women. Women in the age bracket of 20 to 34 years acount for 100.0% of all women with births.
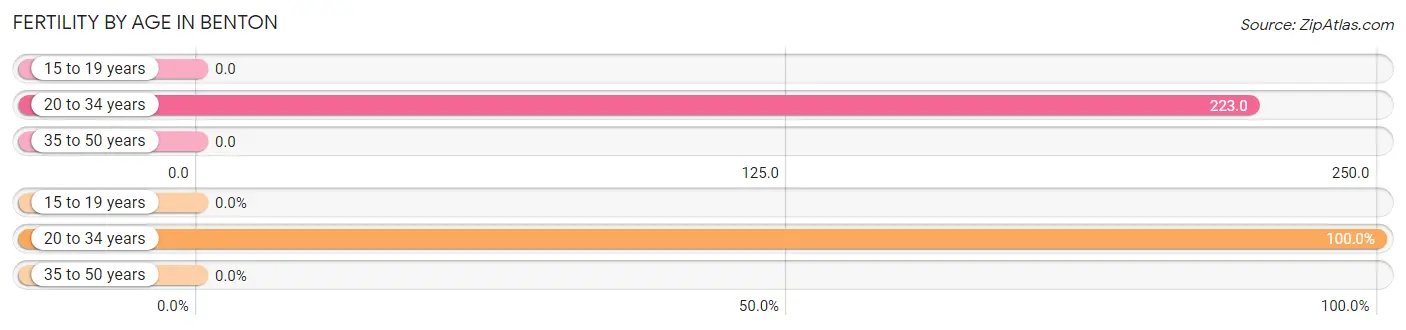
| Age Bracket | Women with Births | Births / 1,000 Women |
| 15 to 19 years | 0 (0.0%) | 0.0 |
| 20 to 34 years | 130 (100.0%) | 223.0 |
| 35 to 50 years | 0 (0.0%) | 0.0 |
| Total | 130 (100.0%) | 89.0 |
Fertility by Age by Marriage Status in Benton
93.1% of women with births (130) in Benton are married. The highest percentage of unmarried women with births falls into 20 to 34 years age bracket with 6.9% of them unmarried at the time of birth, while the lowest percentage of unmarried women with births belong to 20 to 34 years age bracket with 6.9% of them unmarried.
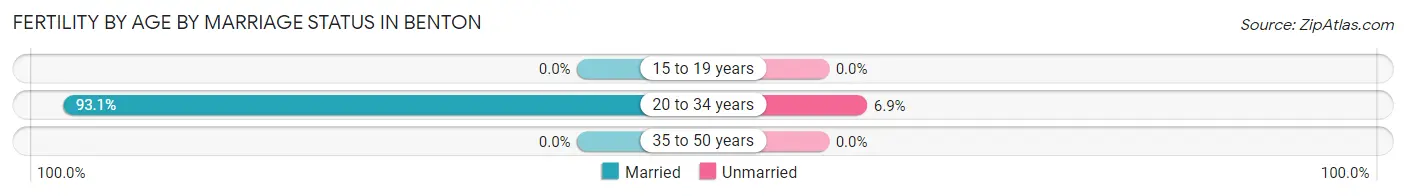
| Age Bracket | Married | Unmarried |
| 15 to 19 years | 0 (0.0%) | 0 (0.0%) |
| 20 to 34 years | 121 (93.1%) | 9 (6.9%) |
| 35 to 50 years | 0 (0.0%) | 0 (0.0%) |
| Total | 121 (93.1%) | 9 (6.9%) |
Fertility by Education in Benton
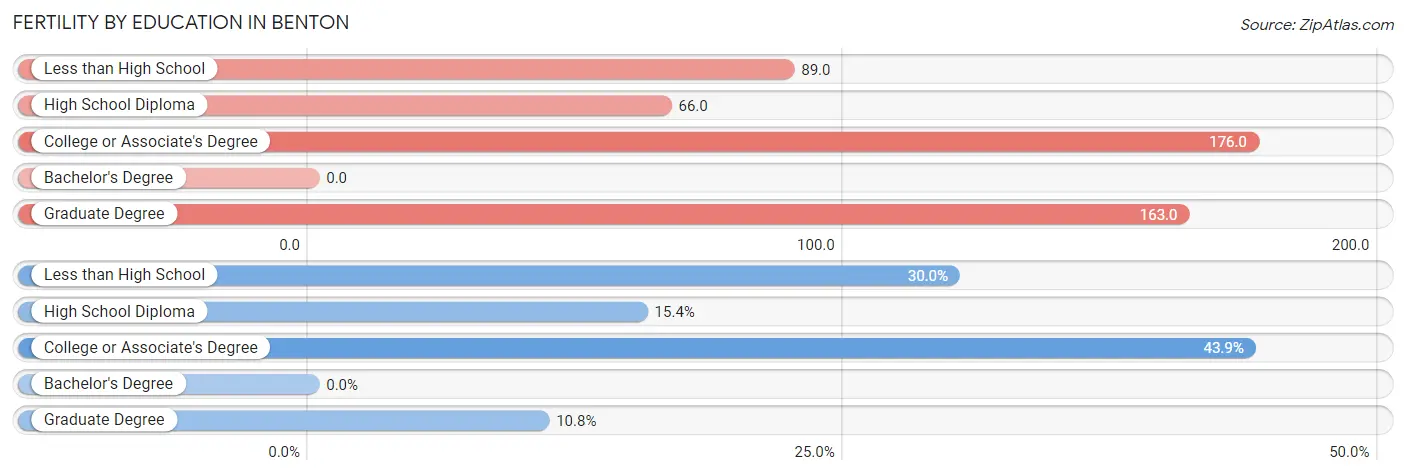
| Educational Attainment | Women with Births | Births / 1,000 Women |
| Less than High School | 39 (30.0%) | 89.0 |
| High School Diploma | 20 (15.4%) | 66.0 |
| College or Associate's Degree | 57 (43.9%) | 176.0 |
| Bachelor's Degree | 0 (0.0%) | 0.0 |
| Graduate Degree | 14 (10.8%) | 163.0 |
| Total | 130 (100.0%) | 89.0 |
Fertility by Education by Marriage Status in Benton
6.9% of women with births in Benton are unmarried. Women with the educational attainment of less than high school are most likely to be married with 100.0% of them married at childbirth, while women with the educational attainment of high school diploma are least likely to be married with 45.0% of them unmarried at childbirth.
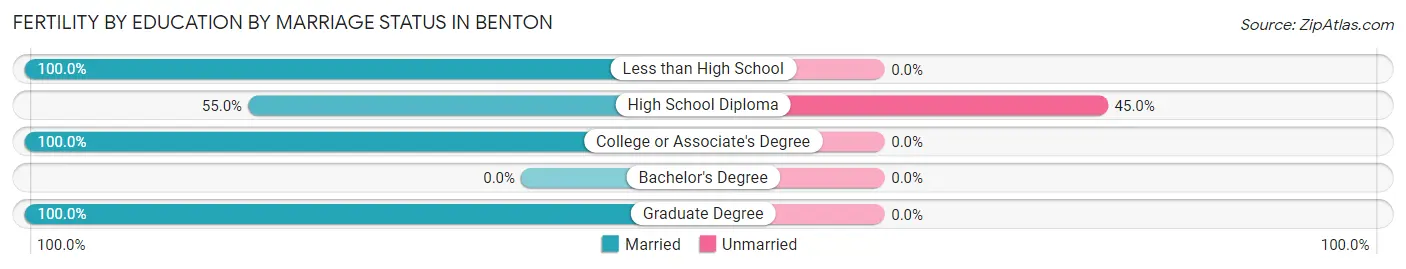
| Educational Attainment | Married | Unmarried |
| Less than High School | 39 (100.0%) | 0 (0.0%) |
| High School Diploma | 11 (55.0%) | 9 (45.0%) |
| College or Associate's Degree | 57 (100.0%) | 0 (0.0%) |
| Bachelor's Degree | 0 (0.0%) | 0 (0.0%) |
| Graduate Degree | 14 (100.0%) | 0 (0.0%) |
| Total | 121 (93.1%) | 9 (6.9%) |
Employment Characteristics in Benton
Employment by Class of Employer in Benton
Among the 2,782 employed individuals in Benton, private company employees (2,102 | 75.6%), not-for-profit organizations (337 | 12.1%), and local government employees (106 | 3.8%) make up the most common classes of employment.
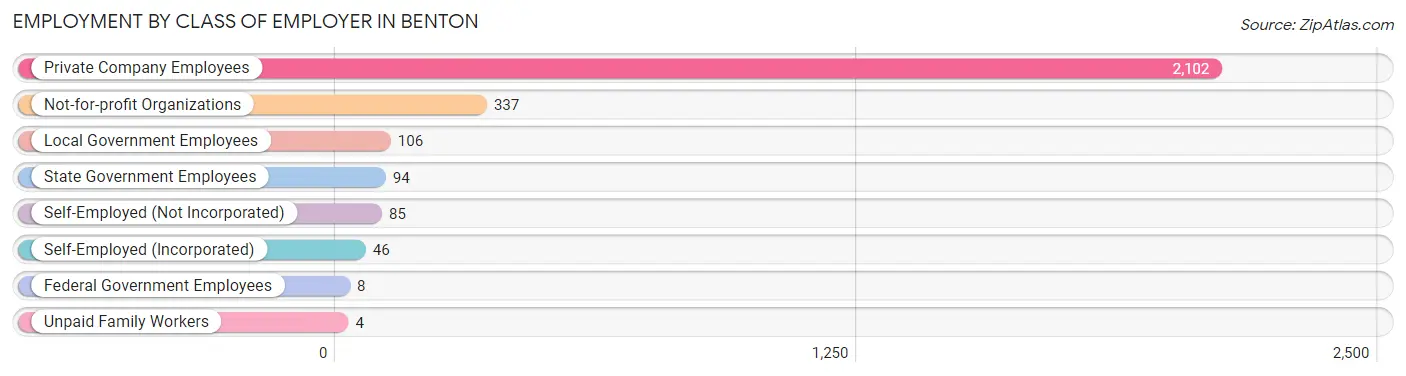
| Employer Class | # Employees | % Employees |
| Private Company Employees | 2,102 | 75.6% |
| Self-Employed (Incorporated) | 46 | 1.7% |
| Self-Employed (Not Incorporated) | 85 | 3.1% |
| Not-for-profit Organizations | 337 | 12.1% |
| Local Government Employees | 106 | 3.8% |
| State Government Employees | 94 | 3.4% |
| Federal Government Employees | 8 | 0.3% |
| Unpaid Family Workers | 4 | 0.1% |
| Total | 2,782 | 100.0% |
Employment Status by Age in Benton
According to the labor force statistics for Benton, out of the total population over 16 years of age (5,631), 53.4% or 3,007 individuals are in the labor force, with 5.1% or 153 of them unemployed. The age group with the highest labor force participation rate is 25 to 29 years, with 93.5% or 330 individuals in the labor force. Within the labor force, the 16 to 19 years age range has the highest percentage of unemployed individuals, with 30.8% or 60 of them being unemployed.
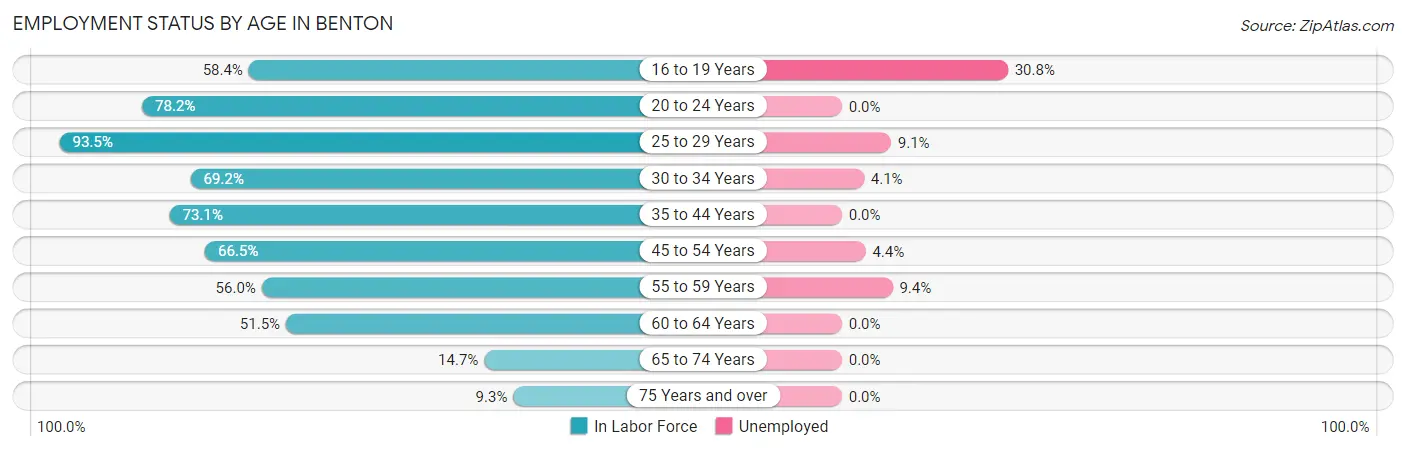
| Age Bracket | In Labor Force | Unemployed |
| 16 to 19 Years | 195 (58.4%) | 60 (30.8%) |
| 20 to 24 Years | 290 (78.2%) | 0 (0.0%) |
| 25 to 29 Years | 330 (93.5%) | 30 (9.1%) |
| 30 to 34 Years | 366 (69.2%) | 15 (4.1%) |
| 35 to 44 Years | 614 (73.1%) | 0 (0.0%) |
| 45 to 54 Years | 551 (66.5%) | 24 (4.4%) |
| 55 to 59 Years | 267 (56.0%) | 25 (9.4%) |
| 60 to 64 Years | 211 (51.5%) | 0 (0.0%) |
| 65 to 74 Years | 121 (14.7%) | 0 (0.0%) |
| 75 Years and over | 62 (9.3%) | 0 (0.0%) |
| Total | 3,007 (53.4%) | 153 (5.1%) |
Employment Status by Educational Attainment in Benton
According to labor force statistics for Benton, 68.1% of individuals (2,341) out of the total population between 25 and 64 years of age (3,437) are in the labor force, with 4.0% or 94 of them being unemployed. The group with the highest labor force participation rate are those with the educational attainment of bachelor's degree or higher, with 93.2% or 668 individuals in the labor force. Within the labor force, individuals with less than high school education have the highest percentage of unemployment, with 17.3% or 19 of them being unemployed.
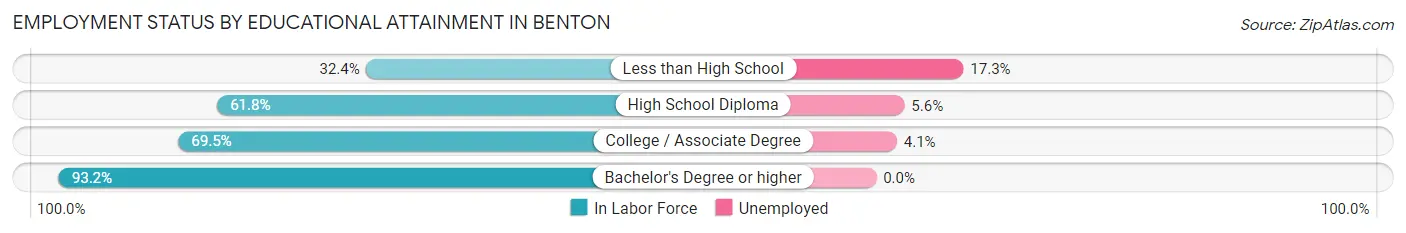
| Educational Attainment | In Labor Force | Unemployed |
| Less than High School | 110 (32.4%) | 59 (17.3%) |
| High School Diploma | 756 (61.8%) | 68 (5.6%) |
| College / Associate Degree | 805 (69.5%) | 47 (4.1%) |
| Bachelor's Degree or higher | 668 (93.2%) | 0 (0.0%) |
| Total | 2,341 (68.1%) | 137 (4.0%) |
Employment Occupations by Sex in Benton
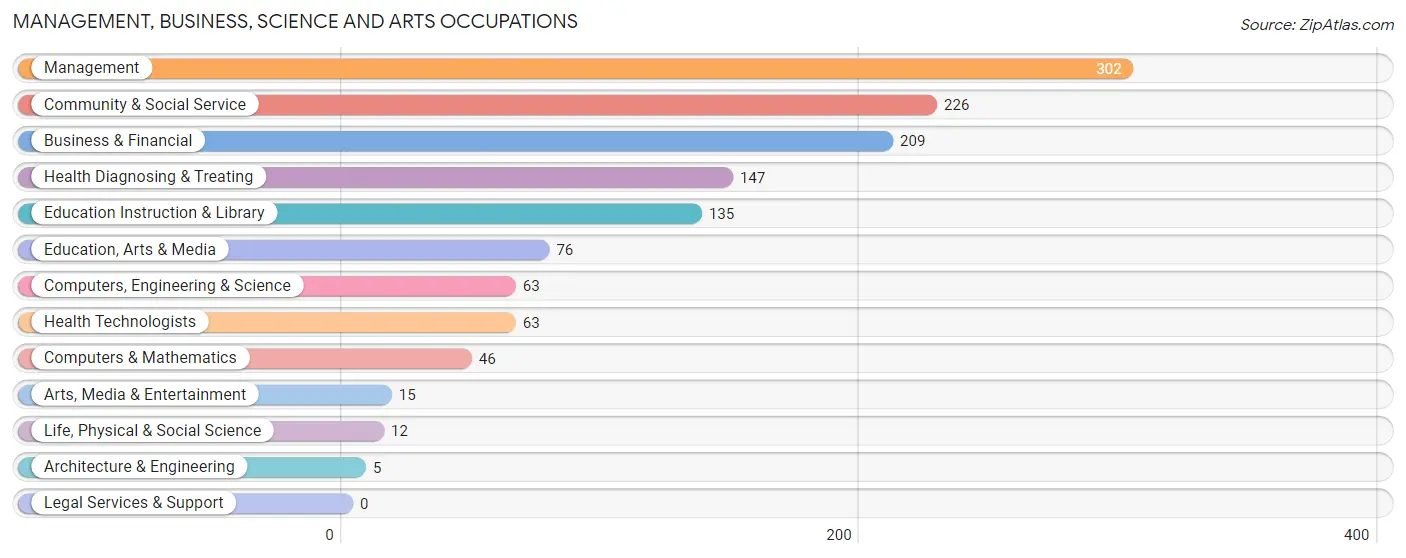
Management, Business, Science and Arts Occupations
The most common Management, Business, Science and Arts occupations in Benton are Management (302 | 10.6%), Community & Social Service (226 | 7.9%), Business & Financial (209 | 7.3%), Health Diagnosing & Treating (147 | 5.1%), and Education Instruction & Library (135 | 4.7%).
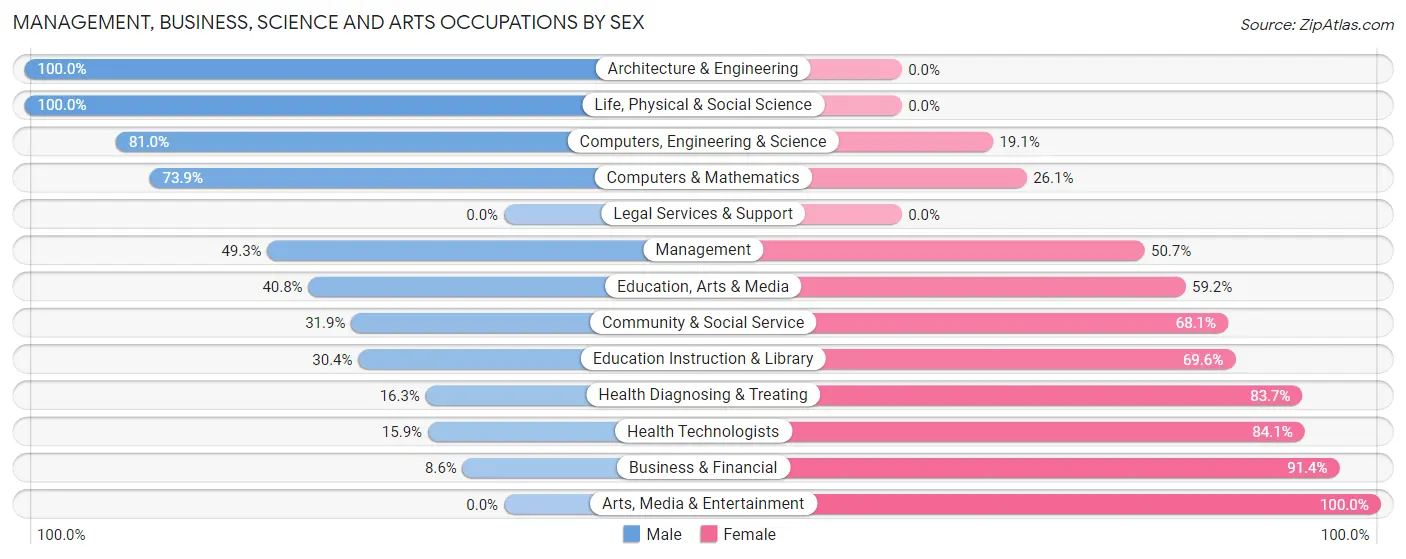
Management, Business, Science and Arts Occupations by Sex
Within the Management, Business, Science and Arts occupations in Benton, the most male-oriented occupations are Architecture & Engineering (100.0%), Life, Physical & Social Science (100.0%), and Computers, Engineering & Science (80.9%), while the most female-oriented occupations are Arts, Media & Entertainment (100.0%), Business & Financial (91.4%), and Health Technologists (84.1%).
| Occupation | Male | Female |
| Management | 149 (49.3%) | 153 (50.7%) |
| Business & Financial | 18 (8.6%) | 191 (91.4%) |
| Computers, Engineering & Science | 51 (80.9%) | 12 (19.1%) |
| Computers & Mathematics | 34 (73.9%) | 12 (26.1%) |
| Architecture & Engineering | 5 (100.0%) | 0 (0.0%) |
| Life, Physical & Social Science | 12 (100.0%) | 0 (0.0%) |
| Community & Social Service | 72 (31.9%) | 154 (68.1%) |
| Education, Arts & Media | 31 (40.8%) | 45 (59.2%) |
| Legal Services & Support | 0 (0.0%) | 0 (0.0%) |
| Education Instruction & Library | 41 (30.4%) | 94 (69.6%) |
| Arts, Media & Entertainment | 0 (0.0%) | 15 (100.0%) |
| Health Diagnosing & Treating | 24 (16.3%) | 123 (83.7%) |
| Health Technologists | 10 (15.9%) | 53 (84.1%) |
| Total (Category) | 314 (33.2%) | 633 (66.8%) |
| Total (Overall) | 1,432 (50.2%) | 1,421 (49.8%) |
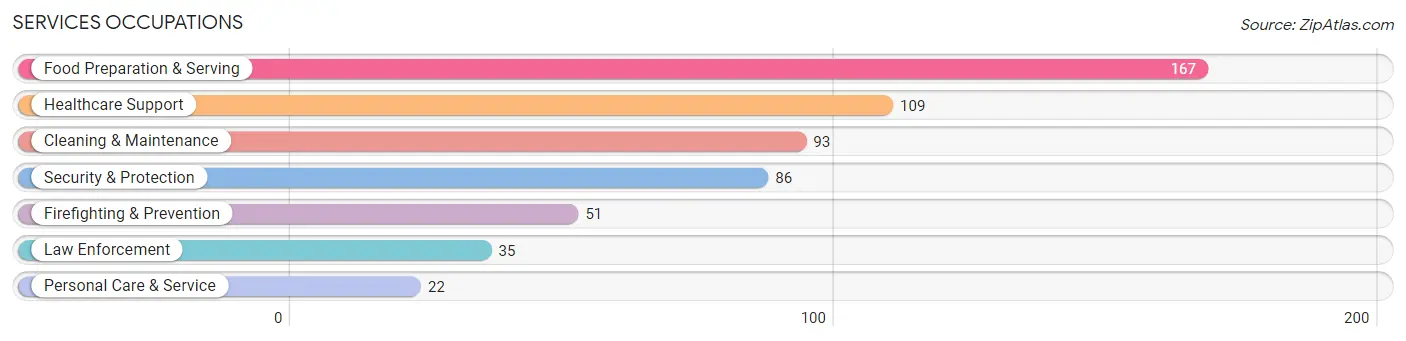
Services Occupations
The most common Services occupations in Benton are Food Preparation & Serving (167 | 5.9%), Healthcare Support (109 | 3.8%), Cleaning & Maintenance (93 | 3.3%), Security & Protection (86 | 3.0%), and Firefighting & Prevention (51 | 1.8%).
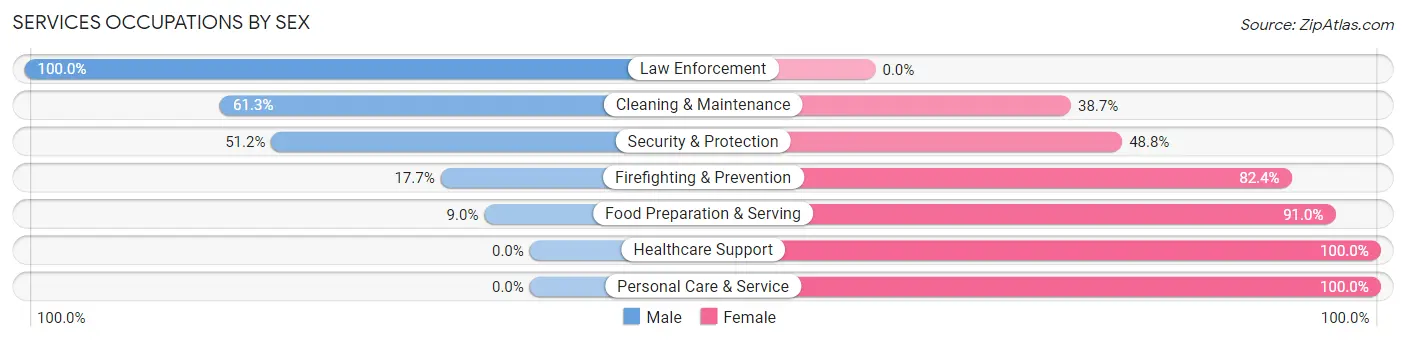
Services Occupations by Sex
Within the Services occupations in Benton, the most male-oriented occupations are Law Enforcement (100.0%), Cleaning & Maintenance (61.3%), and Security & Protection (51.2%), while the most female-oriented occupations are Healthcare Support (100.0%), Personal Care & Service (100.0%), and Food Preparation & Serving (91.0%).
| Occupation | Male | Female |
| Healthcare Support | 0 (0.0%) | 109 (100.0%) |
| Security & Protection | 44 (51.2%) | 42 (48.8%) |
| Firefighting & Prevention | 9 (17.6%) | 42 (82.4%) |
| Law Enforcement | 35 (100.0%) | 0 (0.0%) |
| Food Preparation & Serving | 15 (9.0%) | 152 (91.0%) |
| Cleaning & Maintenance | 57 (61.3%) | 36 (38.7%) |
| Personal Care & Service | 0 (0.0%) | 22 (100.0%) |
| Total (Category) | 116 (24.3%) | 361 (75.7%) |
| Total (Overall) | 1,432 (50.2%) | 1,421 (49.8%) |
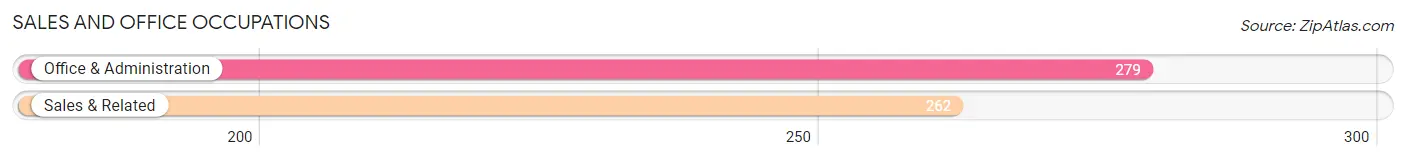
Sales and Office Occupations
The most common Sales and Office occupations in Benton are Office & Administration (279 | 9.8%), and Sales & Related (262 | 9.2%).
Sales and Office Occupations by Sex
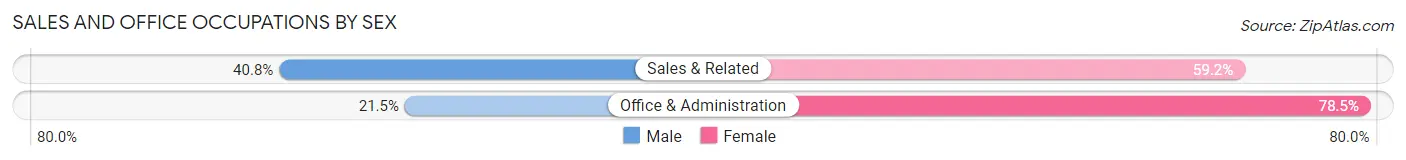
| Occupation | Male | Female |
| Sales & Related | 107 (40.8%) | 155 (59.2%) |
| Office & Administration | 60 (21.5%) | 219 (78.5%) |
| Total (Category) | 167 (30.9%) | 374 (69.1%) |
| Total (Overall) | 1,432 (50.2%) | 1,421 (49.8%) |
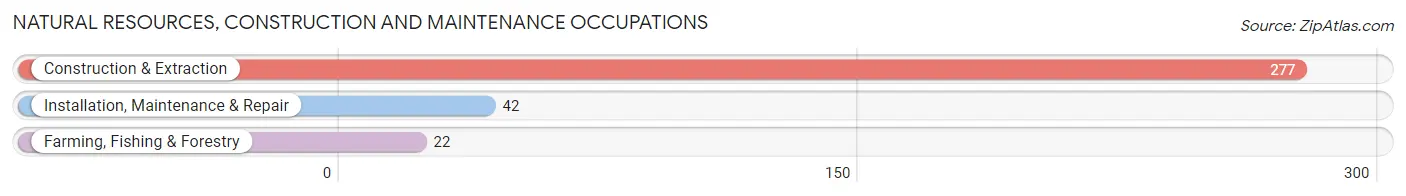
Natural Resources, Construction and Maintenance Occupations
The most common Natural Resources, Construction and Maintenance occupations in Benton are Construction & Extraction (277 | 9.7%), Installation, Maintenance & Repair (42 | 1.5%), and Farming, Fishing & Forestry (22 | 0.8%).
Natural Resources, Construction and Maintenance Occupations by Sex
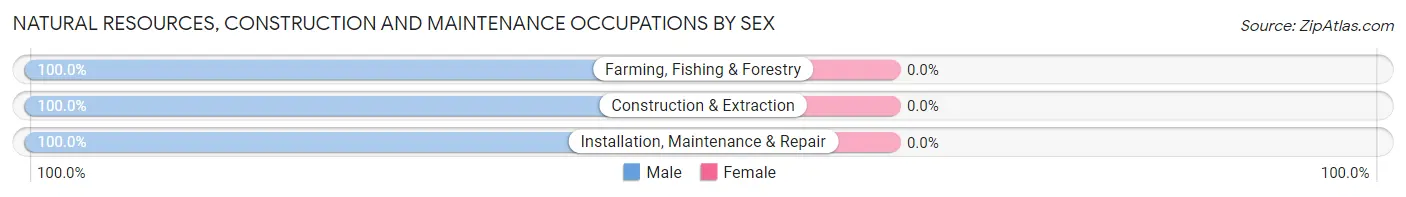
| Occupation | Male | Female |
| Farming, Fishing & Forestry | 22 (100.0%) | 0 (0.0%) |
| Construction & Extraction | 277 (100.0%) | 0 (0.0%) |
| Installation, Maintenance & Repair | 42 (100.0%) | 0 (0.0%) |
| Total (Category) | 341 (100.0%) | 0 (0.0%) |
| Total (Overall) | 1,432 (50.2%) | 1,421 (49.8%) |
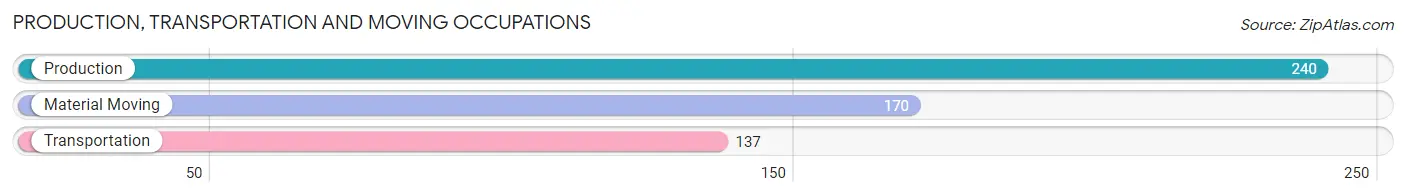
Production, Transportation and Moving Occupations
The most common Production, Transportation and Moving occupations in Benton are Production (240 | 8.4%), Material Moving (170 | 6.0%), and Transportation (137 | 4.8%).
Production, Transportation and Moving Occupations by Sex
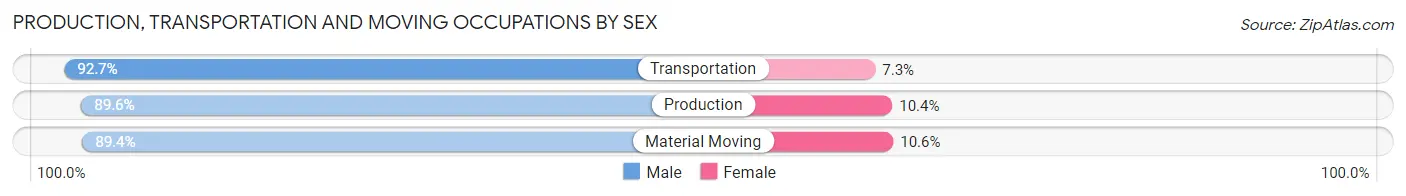
| Occupation | Male | Female |
| Production | 215 (89.6%) | 25 (10.4%) |
| Transportation | 127 (92.7%) | 10 (7.3%) |
| Material Moving | 152 (89.4%) | 18 (10.6%) |
| Total (Category) | 494 (90.3%) | 53 (9.7%) |
| Total (Overall) | 1,432 (50.2%) | 1,421 (49.8%) |
Employment Industries by Sex in Benton
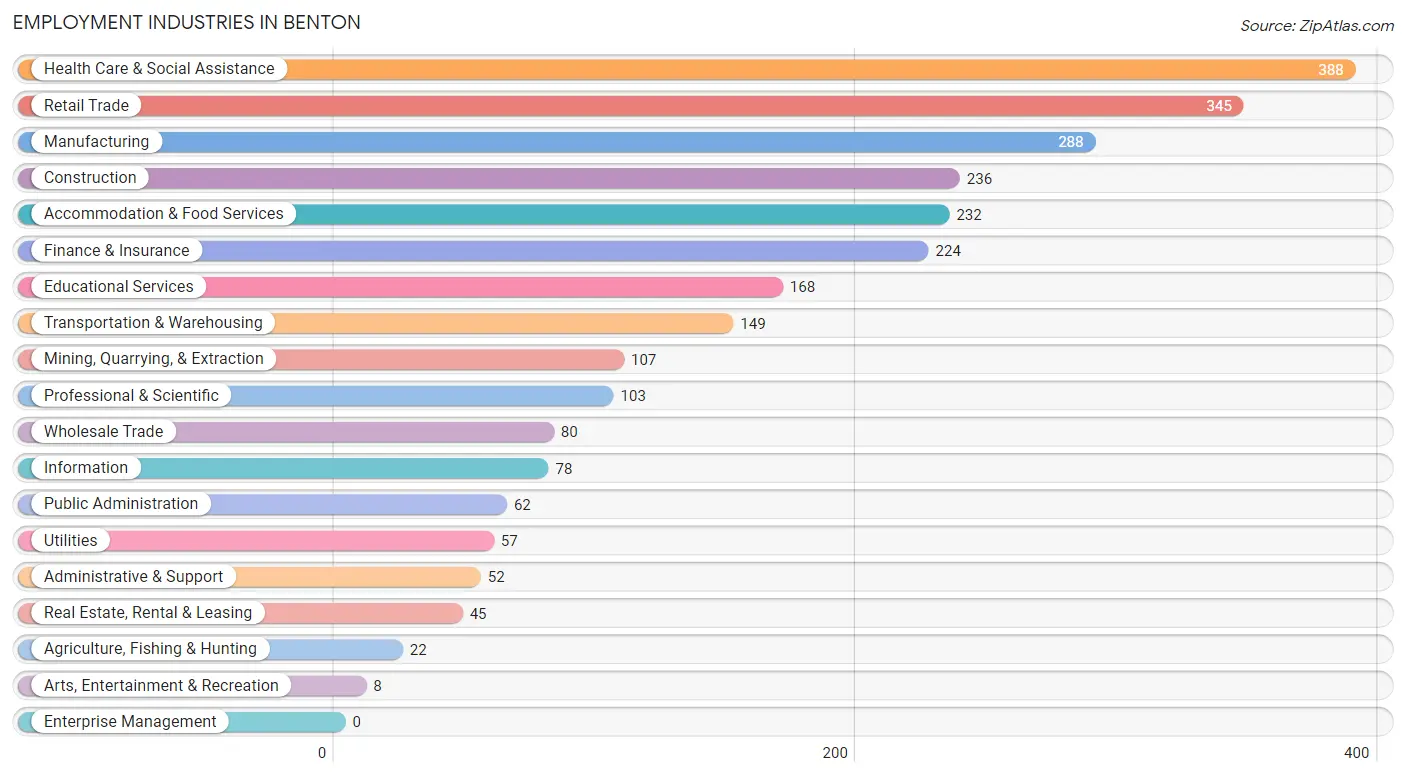
Employment Industries in Benton
The major employment industries in Benton include Health Care & Social Assistance (388 | 13.6%), Retail Trade (345 | 12.1%), Manufacturing (288 | 10.1%), Construction (236 | 8.3%), and Accommodation & Food Services (232 | 8.1%).
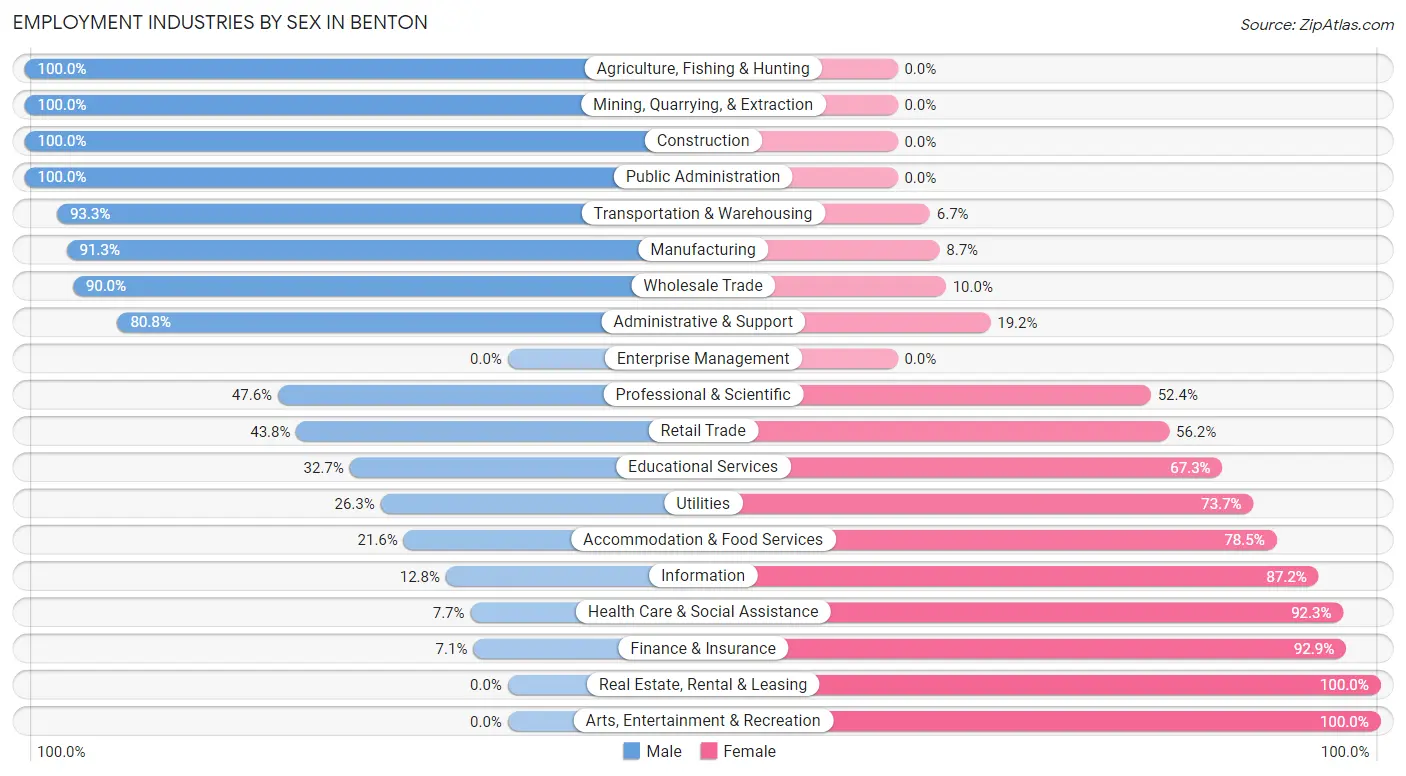
Employment Industries by Sex in Benton
The Benton industries that see more men than women are Agriculture, Fishing & Hunting (100.0%), Mining, Quarrying, & Extraction (100.0%), and Construction (100.0%), whereas the industries that tend to have a higher number of women are Real Estate, Rental & Leasing (100.0%), Arts, Entertainment & Recreation (100.0%), and Finance & Insurance (92.9%).
| Industry | Male | Female |
| Agriculture, Fishing & Hunting | 22 (100.0%) | 0 (0.0%) |
| Mining, Quarrying, & Extraction | 107 (100.0%) | 0 (0.0%) |
| Construction | 236 (100.0%) | 0 (0.0%) |
| Manufacturing | 263 (91.3%) | 25 (8.7%) |
| Wholesale Trade | 72 (90.0%) | 8 (10.0%) |
| Retail Trade | 151 (43.8%) | 194 (56.2%) |
| Transportation & Warehousing | 139 (93.3%) | 10 (6.7%) |
| Utilities | 15 (26.3%) | 42 (73.7%) |
| Information | 10 (12.8%) | 68 (87.2%) |
| Finance & Insurance | 16 (7.1%) | 208 (92.9%) |
| Real Estate, Rental & Leasing | 0 (0.0%) | 45 (100.0%) |
| Professional & Scientific | 49 (47.6%) | 54 (52.4%) |
| Enterprise Management | 0 (0.0%) | 0 (0.0%) |
| Administrative & Support | 42 (80.8%) | 10 (19.2%) |
| Educational Services | 55 (32.7%) | 113 (67.3%) |
| Health Care & Social Assistance | 30 (7.7%) | 358 (92.3%) |
| Arts, Entertainment & Recreation | 0 (0.0%) | 8 (100.0%) |
| Accommodation & Food Services | 50 (21.5%) | 182 (78.4%) |
| Public Administration | 62 (100.0%) | 0 (0.0%) |
| Total | 1,432 (50.2%) | 1,421 (49.8%) |
Education in Benton
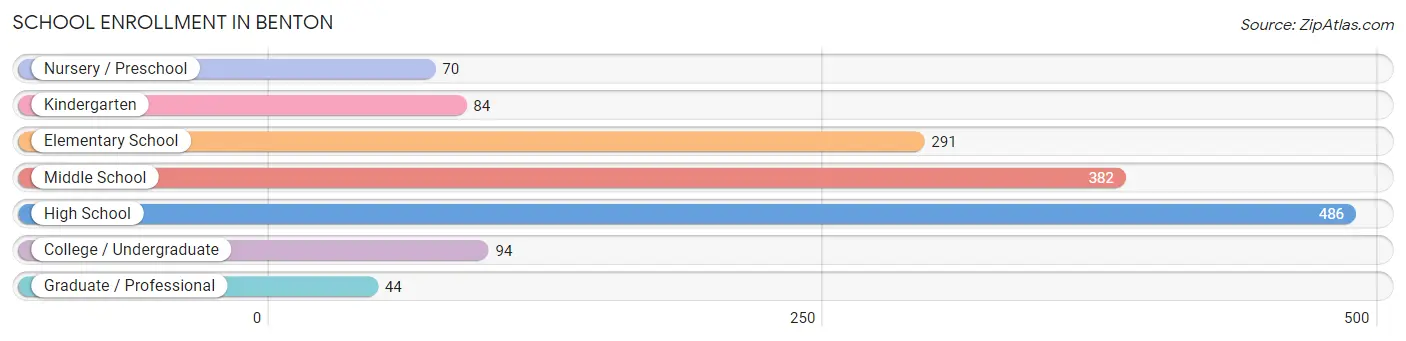
School Enrollment in Benton
The most common levels of schooling among the 1,451 students in Benton are high school (486 | 33.5%), middle school (382 | 26.3%), and elementary school (291 | 20.1%).
| School Level | # Students | % Students |
| Nursery / Preschool | 70 | 4.8% |
| Kindergarten | 84 | 5.8% |
| Elementary School | 291 | 20.1% |
| Middle School | 382 | 26.3% |
| High School | 486 | 33.5% |
| College / Undergraduate | 94 | 6.5% |
| Graduate / Professional | 44 | 3.0% |
| Total | 1,451 | 100.0% |
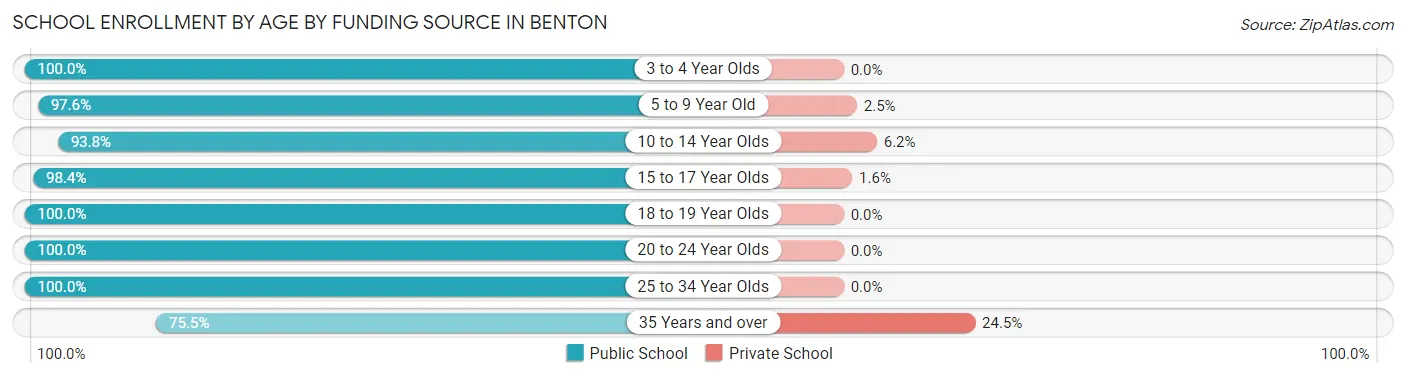
School Enrollment by Age by Funding Source in Benton
Out of a total of 1,451 students who are enrolled in schools in Benton, 55 (3.8%) attend a private institution, while the remaining 1,396 (96.2%) are enrolled in public schools. The age group of 35 years and over has the highest likelihood of being enrolled in private schools, with 12 (24.5% in the age bracket) enrolled. Conversely, the age group of 3 to 4 year olds has the lowest likelihood of being enrolled in a private school, with 70 (100.0% in the age bracket) attending a public institution.
| Age Bracket | Public School | Private School |
| 3 to 4 Year Olds | 70 (100.0%) | 0 (0.0%) |
| 5 to 9 Year Old | 359 (97.6%) | 9 (2.5%) |
| 10 to 14 Year Olds | 441 (93.8%) | 29 (6.2%) |
| 15 to 17 Year Olds | 312 (98.4%) | 5 (1.6%) |
| 18 to 19 Year Olds | 110 (100.0%) | 0 (0.0%) |
| 20 to 24 Year Olds | 53 (100.0%) | 0 (0.0%) |
| 25 to 34 Year Olds | 14 (100.0%) | 0 (0.0%) |
| 35 Years and over | 37 (75.5%) | 12 (24.5%) |
| Total | 1,396 (96.2%) | 55 (3.8%) |
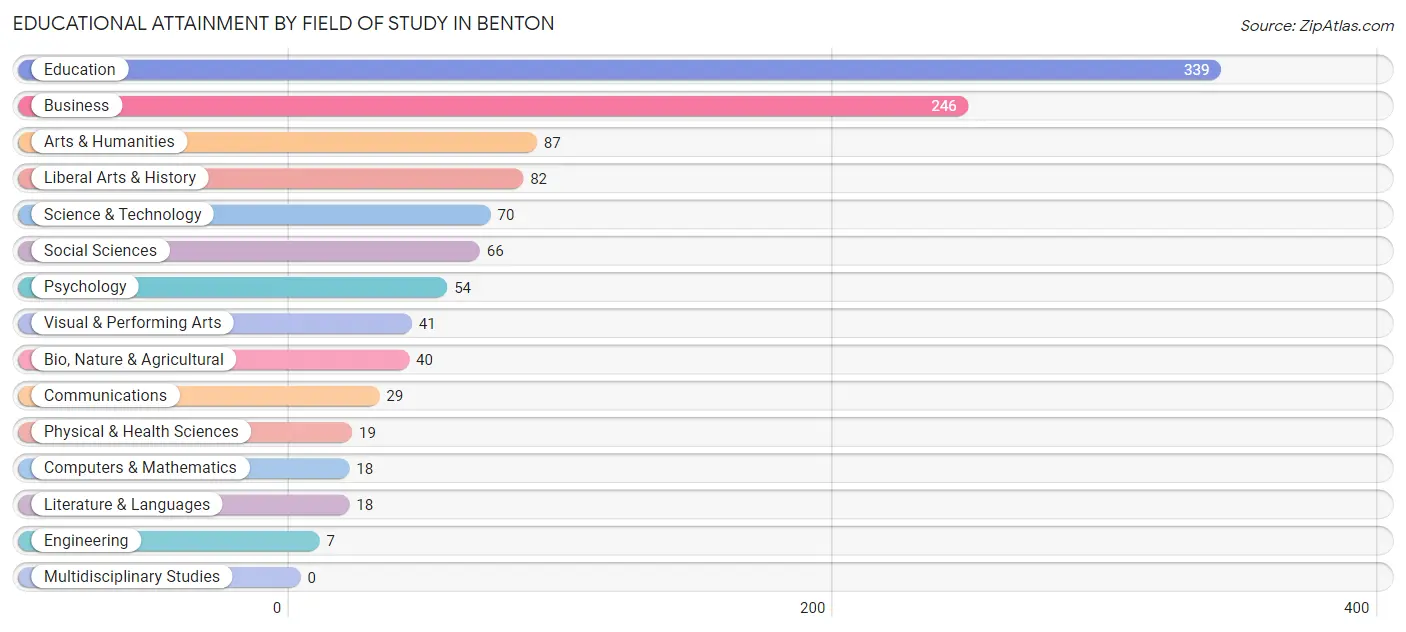
Educational Attainment by Field of Study in Benton
Education (339 | 30.4%), business (246 | 22.0%), arts & humanities (87 | 7.8%), liberal arts & history (82 | 7.3%), and science & technology (70 | 6.3%) are the most common fields of study among 1,116 individuals in Benton who have obtained a bachelor's degree or higher.
| Field of Study | # Graduates | % Graduates |
| Computers & Mathematics | 18 | 1.6% |
| Bio, Nature & Agricultural | 40 | 3.6% |
| Physical & Health Sciences | 19 | 1.7% |
| Psychology | 54 | 4.8% |
| Social Sciences | 66 | 5.9% |
| Engineering | 7 | 0.6% |
| Multidisciplinary Studies | 0 | 0.0% |
| Science & Technology | 70 | 6.3% |
| Business | 246 | 22.0% |
| Education | 339 | 30.4% |
| Literature & Languages | 18 | 1.6% |
| Liberal Arts & History | 82 | 7.3% |
| Visual & Performing Arts | 41 | 3.7% |
| Communications | 29 | 2.6% |
| Arts & Humanities | 87 | 7.8% |
| Total | 1,116 | 100.0% |
Transportation & Commute in Benton
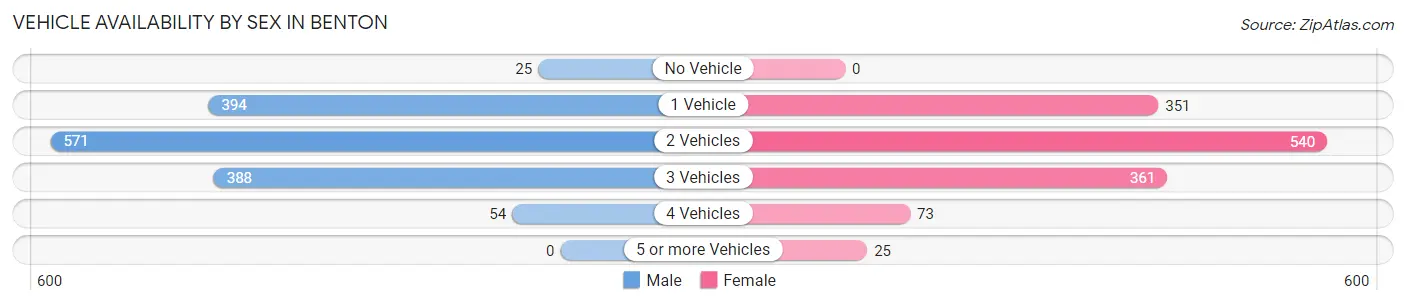
Vehicle Availability by Sex in Benton
The most prevalent vehicle ownership categories in Benton are males with 2 vehicles (571, accounting for 39.9%) and females with 2 vehicles (540, making up 42.3%).
| Vehicles Available | Male | Female |
| No Vehicle | 25 (1.8%) | 0 (0.0%) |
| 1 Vehicle | 394 (27.5%) | 351 (26.0%) |
| 2 Vehicles | 571 (39.9%) | 540 (40.0%) |
| 3 Vehicles | 388 (27.1%) | 361 (26.7%) |
| 4 Vehicles | 54 (3.8%) | 73 (5.4%) |
| 5 or more Vehicles | 0 (0.0%) | 25 (1.8%) |
| Total | 1,432 (100.0%) | 1,350 (100.0%) |
Commute Time in Benton
The most frequently occuring commute durations in Benton are 30 to 34 minutes (496 commuters, 19.0%), 5 to 9 minutes (476 commuters, 18.2%), and 15 to 19 minutes (281 commuters, 10.8%).
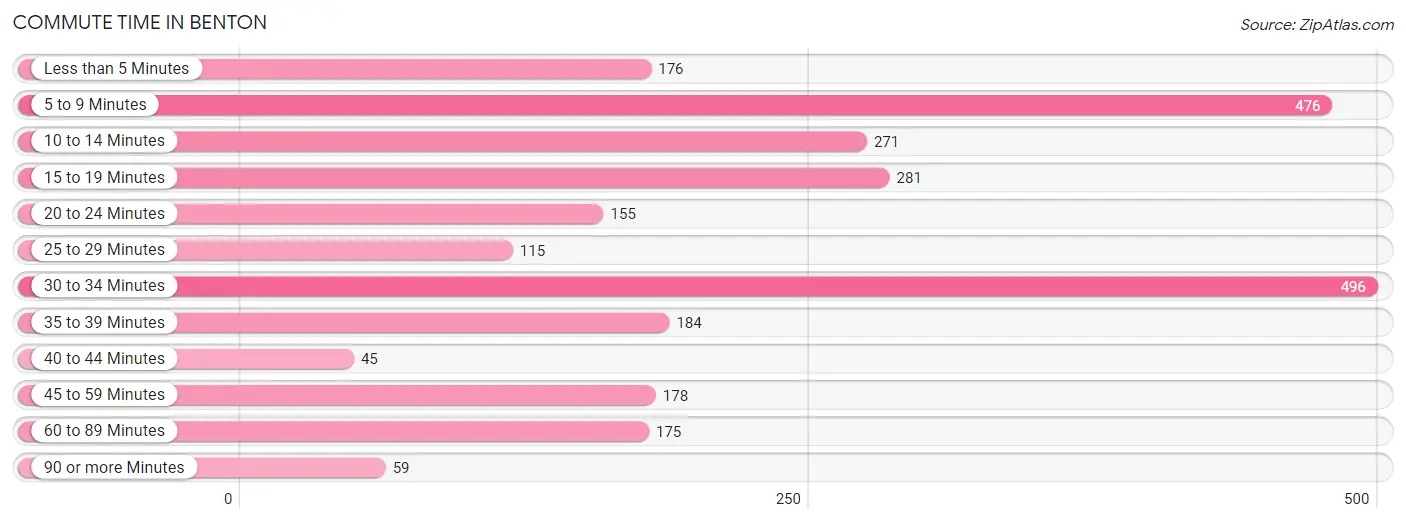
| Commute Time | # Commuters | % Commuters |
| Less than 5 Minutes | 176 | 6.7% |
| 5 to 9 Minutes | 476 | 18.2% |
| 10 to 14 Minutes | 271 | 10.4% |
| 15 to 19 Minutes | 281 | 10.8% |
| 20 to 24 Minutes | 155 | 5.9% |
| 25 to 29 Minutes | 115 | 4.4% |
| 30 to 34 Minutes | 496 | 19.0% |
| 35 to 39 Minutes | 184 | 7.0% |
| 40 to 44 Minutes | 45 | 1.7% |
| 45 to 59 Minutes | 178 | 6.8% |
| 60 to 89 Minutes | 175 | 6.7% |
| 90 or more Minutes | 59 | 2.3% |
Commute Time by Sex in Benton
The most common commute times in Benton are 30 to 34 minutes (275 commuters, 19.3%) for males and 5 to 9 minutes (343 commuters, 28.9%) for females.
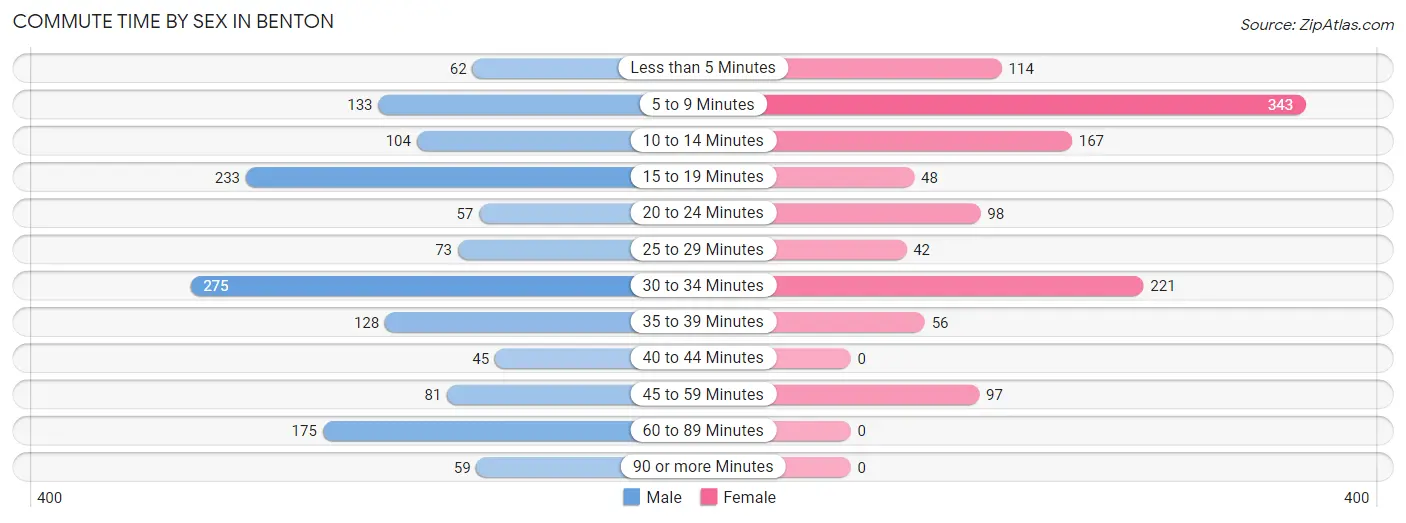
| Commute Time | Male | Female |
| Less than 5 Minutes | 62 (4.3%) | 114 (9.6%) |
| 5 to 9 Minutes | 133 (9.3%) | 343 (28.9%) |
| 10 to 14 Minutes | 104 (7.3%) | 167 (14.1%) |
| 15 to 19 Minutes | 233 (16.4%) | 48 (4.1%) |
| 20 to 24 Minutes | 57 (4.0%) | 98 (8.3%) |
| 25 to 29 Minutes | 73 (5.1%) | 42 (3.5%) |
| 30 to 34 Minutes | 275 (19.3%) | 221 (18.6%) |
| 35 to 39 Minutes | 128 (9.0%) | 56 (4.7%) |
| 40 to 44 Minutes | 45 (3.2%) | 0 (0.0%) |
| 45 to 59 Minutes | 81 (5.7%) | 97 (8.2%) |
| 60 to 89 Minutes | 175 (12.3%) | 0 (0.0%) |
| 90 or more Minutes | 59 (4.1%) | 0 (0.0%) |
Time of Departure to Work by Sex in Benton
The most frequent times of departure to work in Benton are 8:00 AM to 8:29 AM (200, 14.0%) for males and 7:00 AM to 7:29 AM (269, 22.7%) for females.
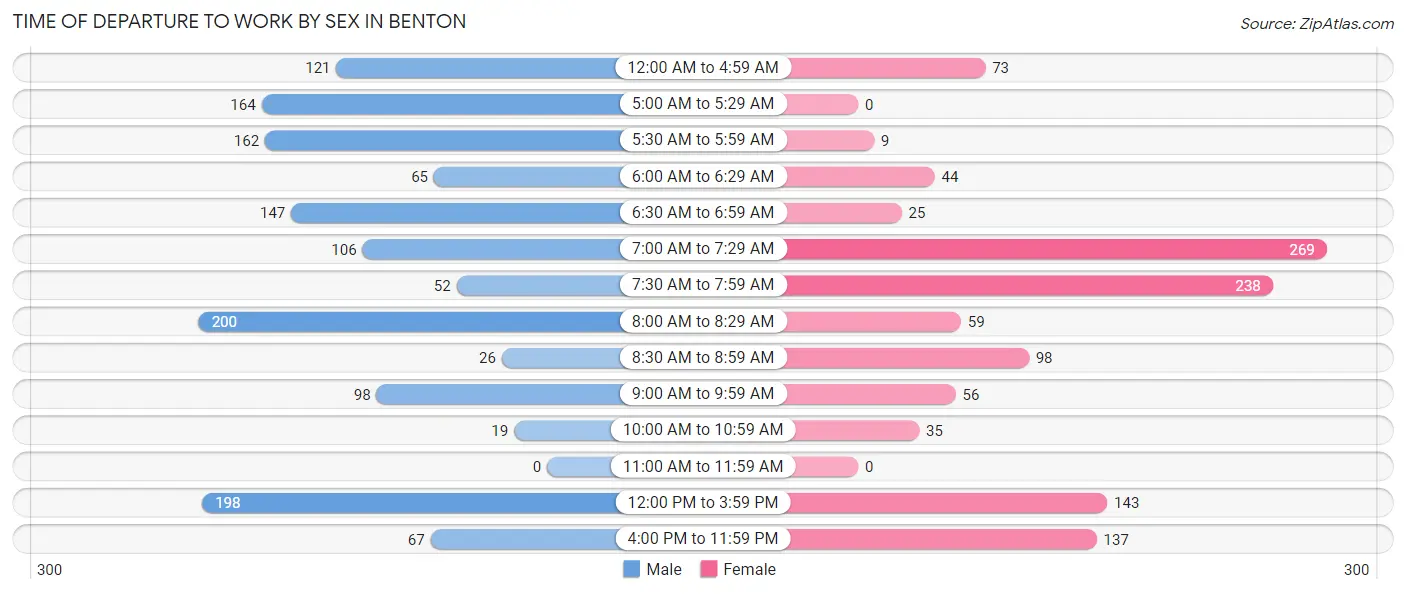
| Time of Departure | Male | Female |
| 12:00 AM to 4:59 AM | 121 (8.5%) | 73 (6.2%) |
| 5:00 AM to 5:29 AM | 164 (11.5%) | 0 (0.0%) |
| 5:30 AM to 5:59 AM | 162 (11.4%) | 9 (0.8%) |
| 6:00 AM to 6:29 AM | 65 (4.6%) | 44 (3.7%) |
| 6:30 AM to 6:59 AM | 147 (10.3%) | 25 (2.1%) |
| 7:00 AM to 7:29 AM | 106 (7.4%) | 269 (22.7%) |
| 7:30 AM to 7:59 AM | 52 (3.6%) | 238 (20.1%) |
| 8:00 AM to 8:29 AM | 200 (14.0%) | 59 (5.0%) |
| 8:30 AM to 8:59 AM | 26 (1.8%) | 98 (8.3%) |
| 9:00 AM to 9:59 AM | 98 (6.9%) | 56 (4.7%) |
| 10:00 AM to 10:59 AM | 19 (1.3%) | 35 (2.9%) |
| 11:00 AM to 11:59 AM | 0 (0.0%) | 0 (0.0%) |
| 12:00 PM to 3:59 PM | 198 (13.9%) | 143 (12.1%) |
| 4:00 PM to 11:59 PM | 67 (4.7%) | 137 (11.6%) |
| Total | 1,425 (100.0%) | 1,186 (100.0%) |
Housing Occupancy in Benton
Occupancy by Ownership in Benton
Of the total 2,923 dwellings in Benton, owner-occupied units account for 1,893 (64.8%), while renter-occupied units make up 1,030 (35.2%).
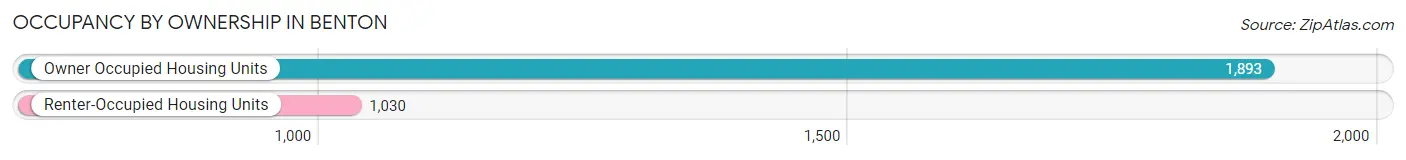
| Occupancy | # Housing Units | % Housing Units |
| Owner Occupied Housing Units | 1,893 | 64.8% |
| Renter-Occupied Housing Units | 1,030 | 35.2% |
| Total Occupied Housing Units | 2,923 | 100.0% |
Occupancy by Household Size in Benton
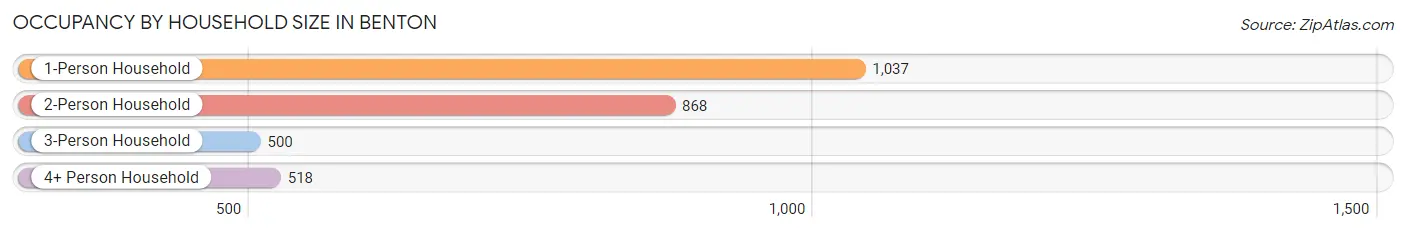
| Household Size | # Housing Units | % Housing Units |
| 1-Person Household | 1,037 | 35.5% |
| 2-Person Household | 868 | 29.7% |
| 3-Person Household | 500 | 17.1% |
| 4+ Person Household | 518 | 17.7% |
| Total Housing Units | 2,923 | 100.0% |
Occupancy by Ownership by Household Size in Benton
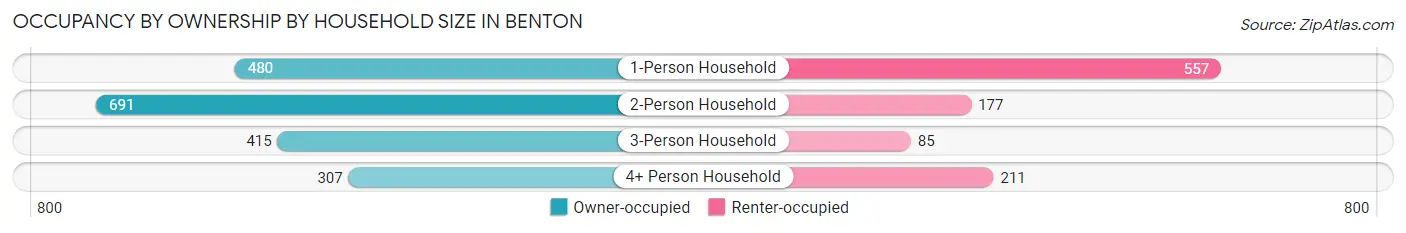
| Household Size | Owner-occupied | Renter-occupied |
| 1-Person Household | 480 (46.3%) | 557 (53.7%) |
| 2-Person Household | 691 (79.6%) | 177 (20.4%) |
| 3-Person Household | 415 (83.0%) | 85 (17.0%) |
| 4+ Person Household | 307 (59.3%) | 211 (40.7%) |
| Total Housing Units | 1,893 (64.8%) | 1,030 (35.2%) |
Occupancy by Educational Attainment in Benton
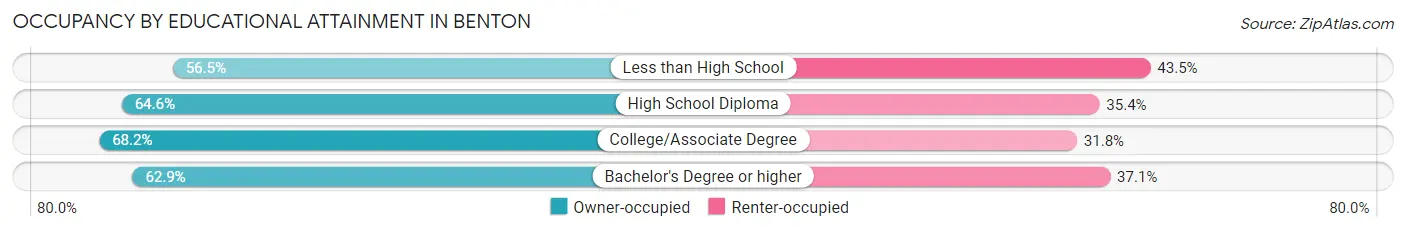
| Household Size | Owner-occupied | Renter-occupied |
| Less than High School | 126 (56.5%) | 97 (43.5%) |
| High School Diploma | 569 (64.6%) | 312 (35.4%) |
| College/Associate Degree | 698 (68.2%) | 326 (31.8%) |
| Bachelor's Degree or higher | 500 (62.9%) | 295 (37.1%) |
Occupancy by Age of Householder in Benton
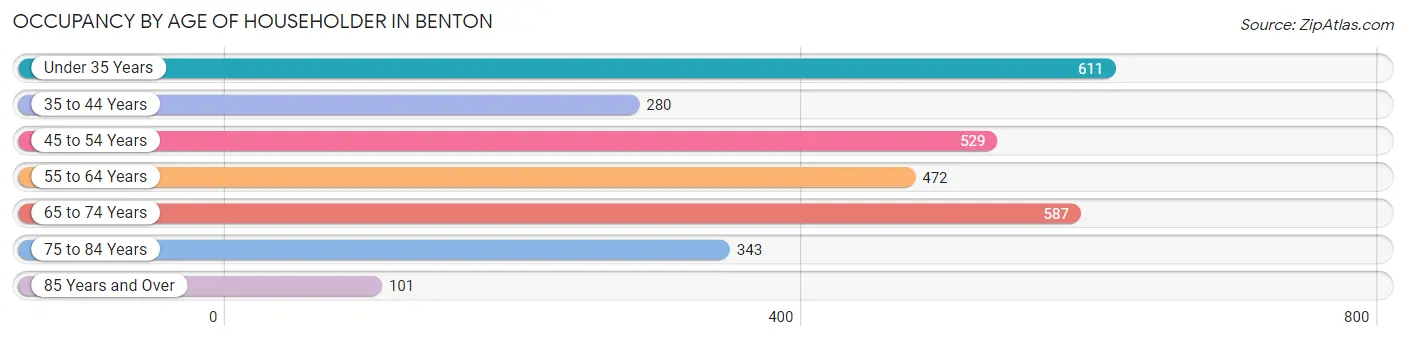
| Age Bracket | # Households | % Households |
| Under 35 Years | 611 | 20.9% |
| 35 to 44 Years | 280 | 9.6% |
| 45 to 54 Years | 529 | 18.1% |
| 55 to 64 Years | 472 | 16.2% |
| 65 to 74 Years | 587 | 20.1% |
| 75 to 84 Years | 343 | 11.7% |
| 85 Years and Over | 101 | 3.5% |
| Total | 2,923 | 100.0% |
Housing Finances in Benton
Median Income by Occupancy in Benton
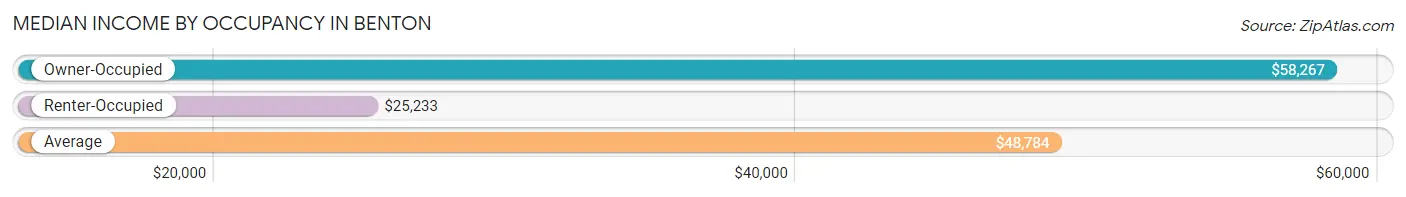
| Occupancy Type | # Households | Median Income |
| Owner-Occupied | 1,893 (64.8%) | $58,267 |
| Renter-Occupied | 1,030 (35.2%) | $25,233 |
| Average | 2,923 (100.0%) | $48,784 |
Occupancy by Householder Income Bracket in Benton
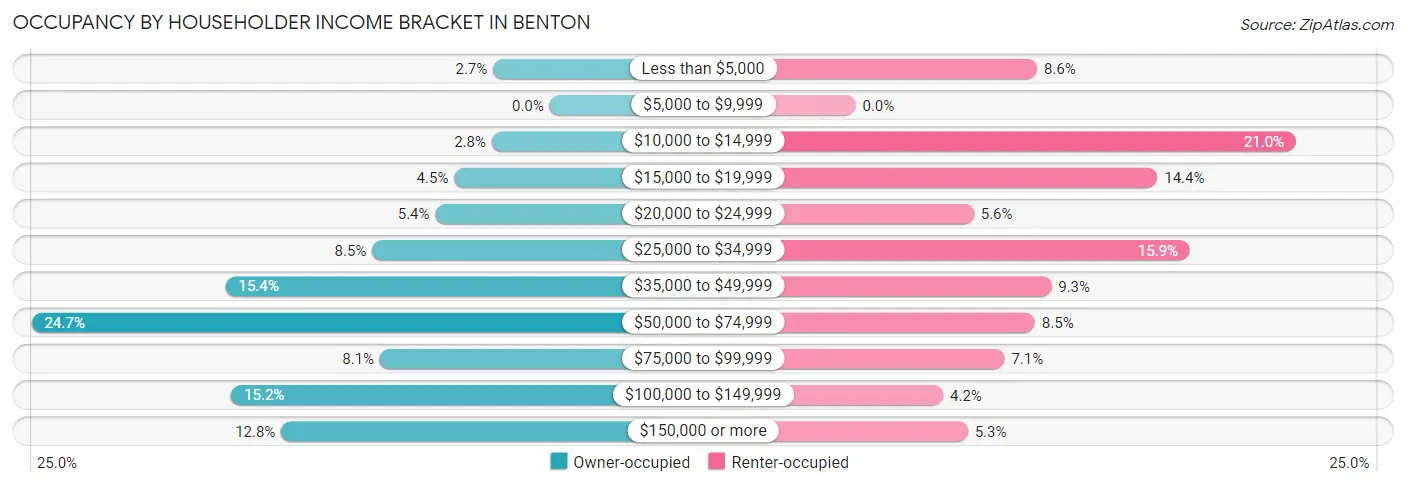
| Income Bracket | Owner-occupied | Renter-occupied |
| Less than $5,000 | 51 (2.7%) | 89 (8.6%) |
| $5,000 to $9,999 | 0 (0.0%) | 0 (0.0%) |
| $10,000 to $14,999 | 52 (2.8%) | 216 (21.0%) |
| $15,000 to $19,999 | 86 (4.5%) | 148 (14.4%) |
| $20,000 to $24,999 | 103 (5.4%) | 58 (5.6%) |
| $25,000 to $34,999 | 160 (8.5%) | 164 (15.9%) |
| $35,000 to $49,999 | 292 (15.4%) | 96 (9.3%) |
| $50,000 to $74,999 | 467 (24.7%) | 88 (8.5%) |
| $75,000 to $99,999 | 153 (8.1%) | 73 (7.1%) |
| $100,000 to $149,999 | 287 (15.2%) | 43 (4.2%) |
| $150,000 or more | 242 (12.8%) | 55 (5.3%) |
| Total | 1,893 (100.0%) | 1,030 (100.0%) |
Monthly Housing Cost Tiers in Benton

| Monthly Cost | Owner-occupied | Renter-occupied |
| Less than $300 | 223 (11.8%) | 91 (8.8%) |
| $300 to $499 | 443 (23.4%) | 107 (10.4%) |
| $500 to $799 | 637 (33.7%) | 378 (36.7%) |
| $800 to $999 | 204 (10.8%) | 168 (16.3%) |
| $1,000 to $1,499 | 287 (15.2%) | 200 (19.4%) |
| $1,500 to $1,999 | 64 (3.4%) | 9 (0.9%) |
| $2,000 to $2,499 | 12 (0.6%) | 0 (0.0%) |
| $2,500 to $2,999 | 0 (0.0%) | 0 (0.0%) |
| $3,000 or more | 23 (1.2%) | 0 (0.0%) |
| Total | 1,893 (100.0%) | 1,030 (100.0%) |
Physical Housing Characteristics in Benton
Housing Structures in Benton
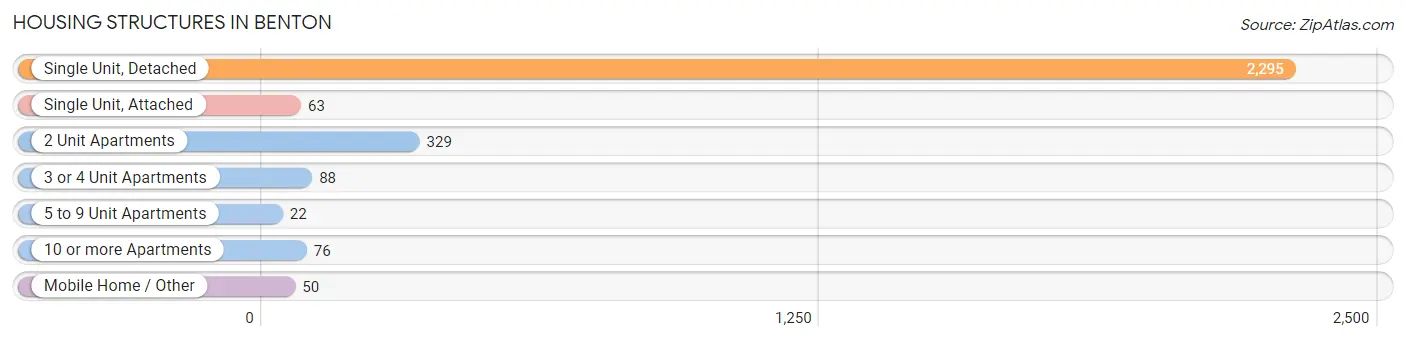
| Structure Type | # Housing Units | % Housing Units |
| Single Unit, Detached | 2,295 | 78.5% |
| Single Unit, Attached | 63 | 2.2% |
| 2 Unit Apartments | 329 | 11.3% |
| 3 or 4 Unit Apartments | 88 | 3.0% |
| 5 to 9 Unit Apartments | 22 | 0.7% |
| 10 or more Apartments | 76 | 2.6% |
| Mobile Home / Other | 50 | 1.7% |
| Total | 2,923 | 100.0% |
Housing Structures by Occupancy in Benton
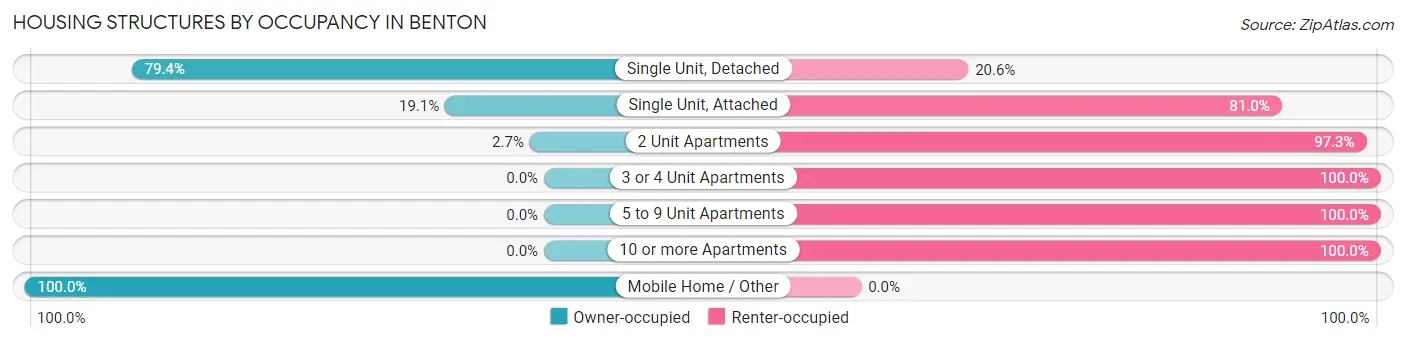
| Structure Type | Owner-occupied | Renter-occupied |
| Single Unit, Detached | 1,822 (79.4%) | 473 (20.6%) |
| Single Unit, Attached | 12 (19.1%) | 51 (80.9%) |
| 2 Unit Apartments | 9 (2.7%) | 320 (97.3%) |
| 3 or 4 Unit Apartments | 0 (0.0%) | 88 (100.0%) |
| 5 to 9 Unit Apartments | 0 (0.0%) | 22 (100.0%) |
| 10 or more Apartments | 0 (0.0%) | 76 (100.0%) |
| Mobile Home / Other | 50 (100.0%) | 0 (0.0%) |
| Total | 1,893 (64.8%) | 1,030 (35.2%) |
Housing Structures by Number of Rooms in Benton
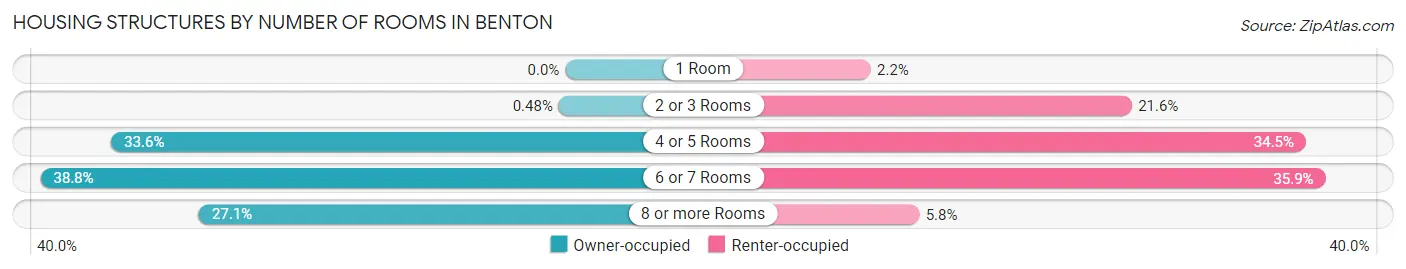
| Number of Rooms | Owner-occupied | Renter-occupied |
| 1 Room | 0 (0.0%) | 23 (2.2%) |
| 2 or 3 Rooms | 9 (0.5%) | 222 (21.5%) |
| 4 or 5 Rooms | 636 (33.6%) | 355 (34.5%) |
| 6 or 7 Rooms | 735 (38.8%) | 370 (35.9%) |
| 8 or more Rooms | 513 (27.1%) | 60 (5.8%) |
| Total | 1,893 (100.0%) | 1,030 (100.0%) |
Housing Structure by Heating Type in Benton
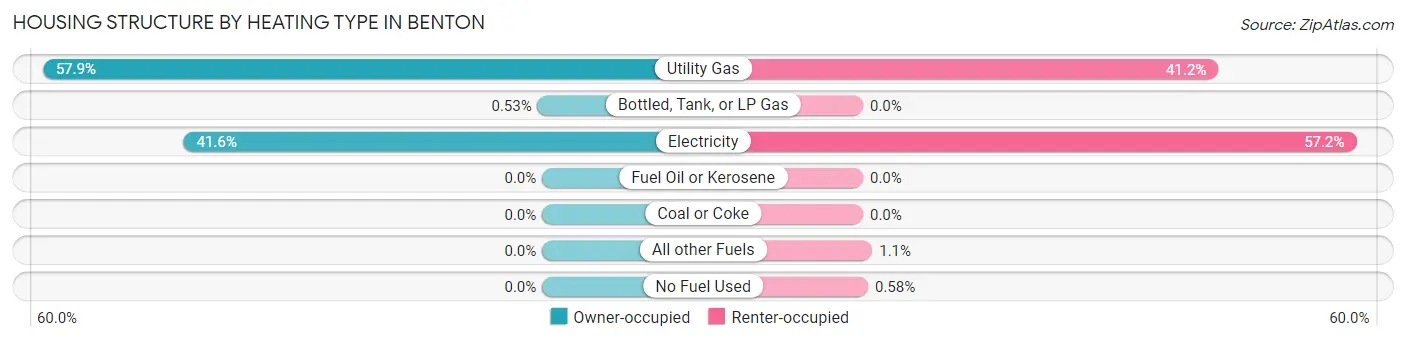
| Heating Type | Owner-occupied | Renter-occupied |
| Utility Gas | 1,096 (57.9%) | 424 (41.2%) |
| Bottled, Tank, or LP Gas | 10 (0.5%) | 0 (0.0%) |
| Electricity | 787 (41.6%) | 589 (57.2%) |
| Fuel Oil or Kerosene | 0 (0.0%) | 0 (0.0%) |
| Coal or Coke | 0 (0.0%) | 0 (0.0%) |
| All other Fuels | 0 (0.0%) | 11 (1.1%) |
| No Fuel Used | 0 (0.0%) | 6 (0.6%) |
| Total | 1,893 (100.0%) | 1,030 (100.0%) |
Household Vehicle Usage in Benton
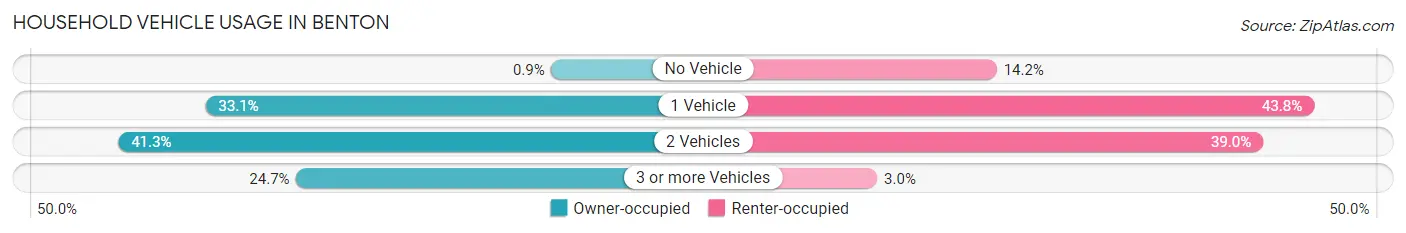
| Vehicles per Household | Owner-occupied | Renter-occupied |
| No Vehicle | 17 (0.9%) | 146 (14.2%) |
| 1 Vehicle | 627 (33.1%) | 451 (43.8%) |
| 2 Vehicles | 781 (41.3%) | 402 (39.0%) |
| 3 or more Vehicles | 468 (24.7%) | 31 (3.0%) |
| Total | 1,893 (100.0%) | 1,030 (100.0%) |
Real Estate & Mortgages in Benton
Real Estate and Mortgage Overview in Benton
| Characteristic | Without Mortgage | With Mortgage |
| Housing Units | 1,048 | 845 |
| Median Property Value | $80,200 | $81,800 |
| Median Household Income | $57,000 | $66 |
| Monthly Housing Costs | $463 | $23 |
| Real Estate Taxes | $1,373 | $34 |
Property Value by Mortgage Status in Benton
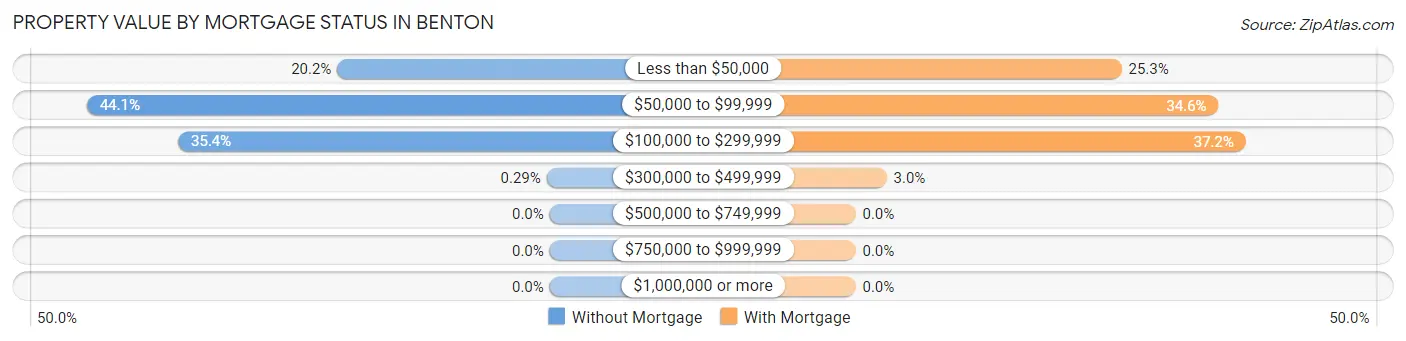
| Property Value | Without Mortgage | With Mortgage |
| Less than $50,000 | 212 (20.2%) | 214 (25.3%) |
| $50,000 to $99,999 | 462 (44.1%) | 292 (34.6%) |
| $100,000 to $299,999 | 371 (35.4%) | 314 (37.2%) |
| $300,000 to $499,999 | 3 (0.3%) | 25 (3.0%) |
| $500,000 to $749,999 | 0 (0.0%) | 0 (0.0%) |
| $750,000 to $999,999 | 0 (0.0%) | 0 (0.0%) |
| $1,000,000 or more | 0 (0.0%) | 0 (0.0%) |
| Total | 1,048 (100.0%) | 845 (100.0%) |
Household Income by Mortgage Status in Benton
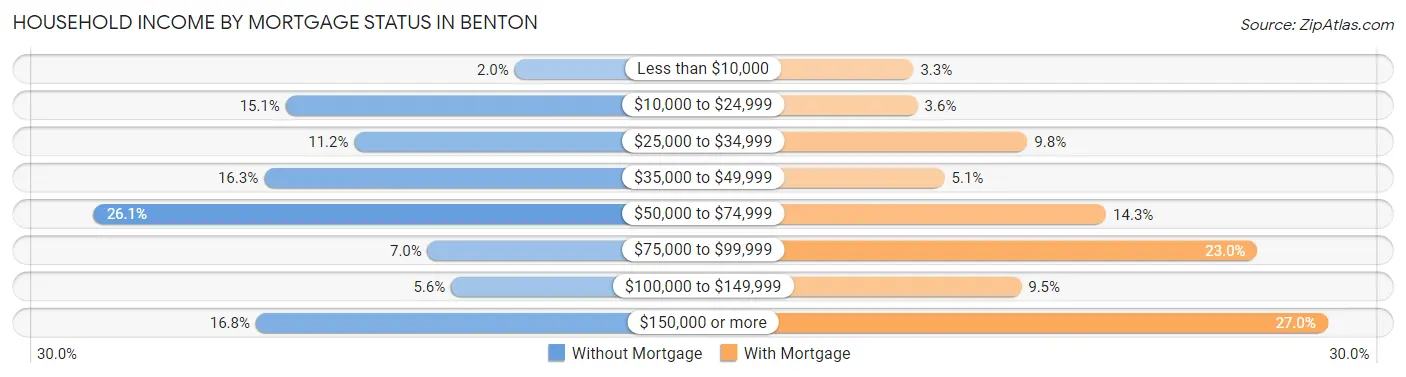
| Household Income | Without Mortgage | With Mortgage |
| Less than $10,000 | 21 (2.0%) | 28 (3.3%) |
| $10,000 to $24,999 | 158 (15.1%) | 30 (3.5%) |
| $25,000 to $34,999 | 117 (11.2%) | 83 (9.8%) |
| $35,000 to $49,999 | 171 (16.3%) | 43 (5.1%) |
| $50,000 to $74,999 | 273 (26.1%) | 121 (14.3%) |
| $75,000 to $99,999 | 73 (7.0%) | 194 (23.0%) |
| $100,000 to $149,999 | 59 (5.6%) | 80 (9.5%) |
| $150,000 or more | 176 (16.8%) | 228 (27.0%) |
| Total | 1,048 (100.0%) | 845 (100.0%) |
Property Value to Household Income Ratio in Benton
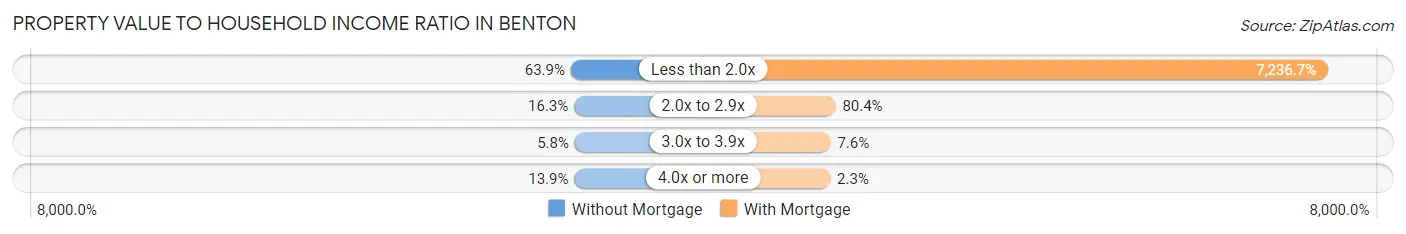
| Value-to-Income Ratio | Without Mortgage | With Mortgage |
| Less than 2.0x | 670 (63.9%) | 61,150 (7,236.7%) |
| 2.0x to 2.9x | 171 (16.3%) | 679 (80.4%) |
| 3.0x to 3.9x | 61 (5.8%) | 64 (7.6%) |
| 4.0x or more | 146 (13.9%) | 19 (2.2%) |
| Total | 1,048 (100.0%) | 845 (100.0%) |
Real Estate Taxes by Mortgage Status in Benton
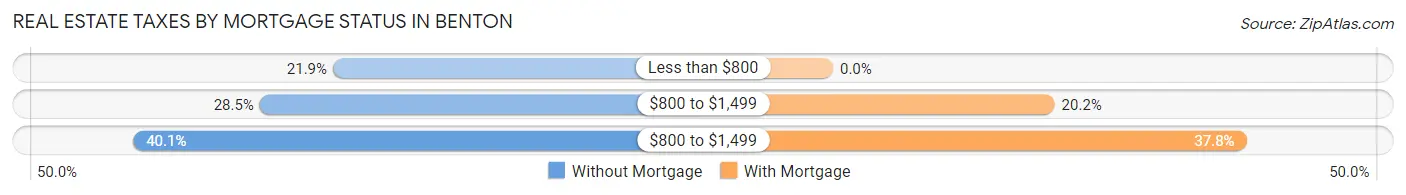
| Property Taxes | Without Mortgage | With Mortgage |
| Less than $800 | 229 (21.8%) | 0 (0.0%) |
| $800 to $1,499 | 299 (28.5%) | 171 (20.2%) |
| $800 to $1,499 | 420 (40.1%) | 319 (37.8%) |
| Total | 1,048 (100.0%) | 845 (100.0%) |
Health & Disability in Benton
Health Insurance Coverage by Age in Benton
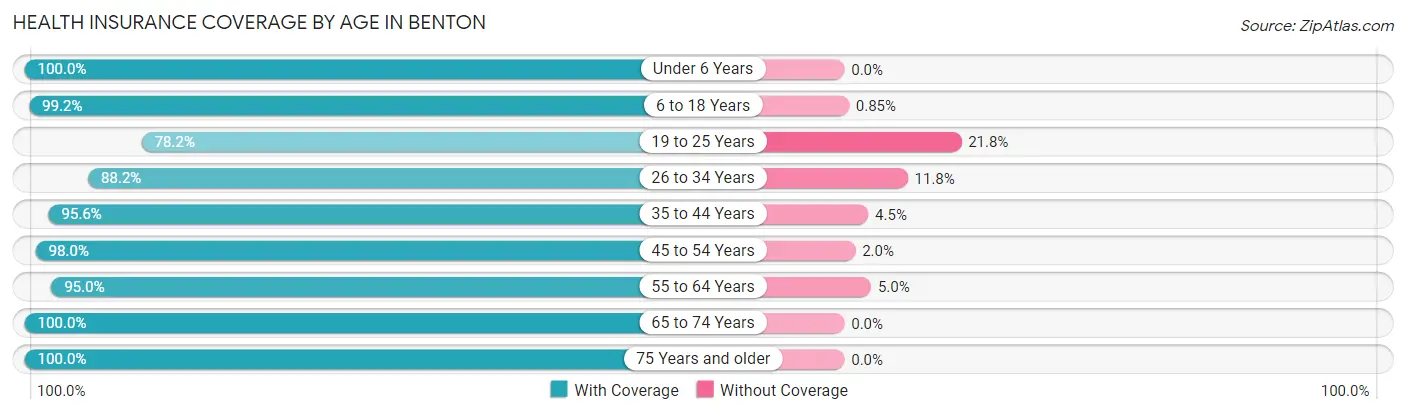
| Age Bracket | With Coverage | Without Coverage |
| Under 6 Years | 363 (100.0%) | 0 (0.0%) |
| 6 to 18 Years | 1,289 (99.2%) | 11 (0.9%) |
| 19 to 25 Years | 330 (78.2%) | 92 (21.8%) |
| 26 to 34 Years | 724 (88.2%) | 97 (11.8%) |
| 35 to 44 Years | 752 (95.6%) | 35 (4.4%) |
| 45 to 54 Years | 770 (98.0%) | 16 (2.0%) |
| 55 to 64 Years | 823 (95.0%) | 43 (5.0%) |
| 65 to 74 Years | 766 (100.0%) | 0 (0.0%) |
| 75 Years and older | 595 (100.0%) | 0 (0.0%) |
| Total | 6,412 (95.6%) | 294 (4.4%) |
Health Insurance Coverage by Citizenship Status in Benton
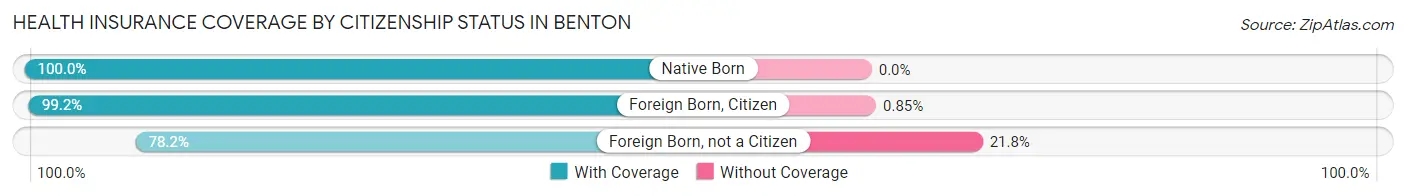
| Citizenship Status | With Coverage | Without Coverage |
| Native Born | 363 (100.0%) | 0 (0.0%) |
| Foreign Born, Citizen | 1,289 (99.2%) | 11 (0.9%) |
| Foreign Born, not a Citizen | 330 (78.2%) | 92 (21.8%) |
Health Insurance Coverage by Household Income in Benton
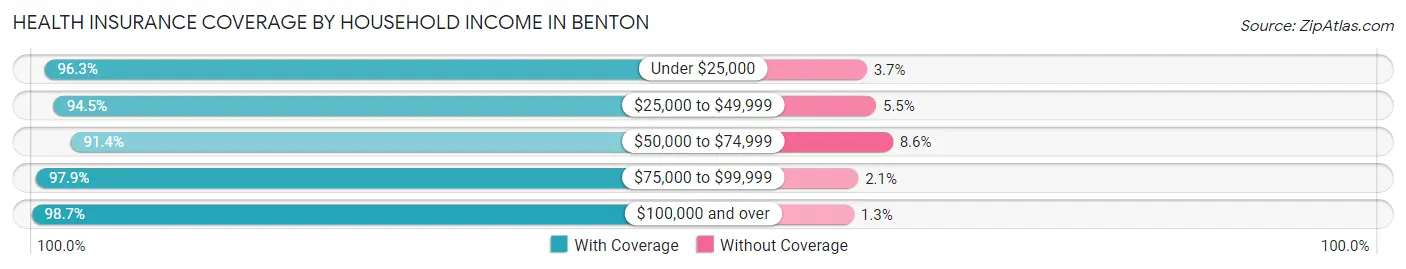
| Household Income | With Coverage | Without Coverage |
| Under $25,000 | 1,109 (96.3%) | 43 (3.7%) |
| $25,000 to $49,999 | 1,535 (94.5%) | 89 (5.5%) |
| $50,000 to $74,999 | 1,317 (91.4%) | 124 (8.6%) |
| $75,000 to $99,999 | 595 (97.9%) | 13 (2.1%) |
| $100,000 and over | 1,855 (98.7%) | 25 (1.3%) |
Public vs Private Health Insurance Coverage by Age in Benton
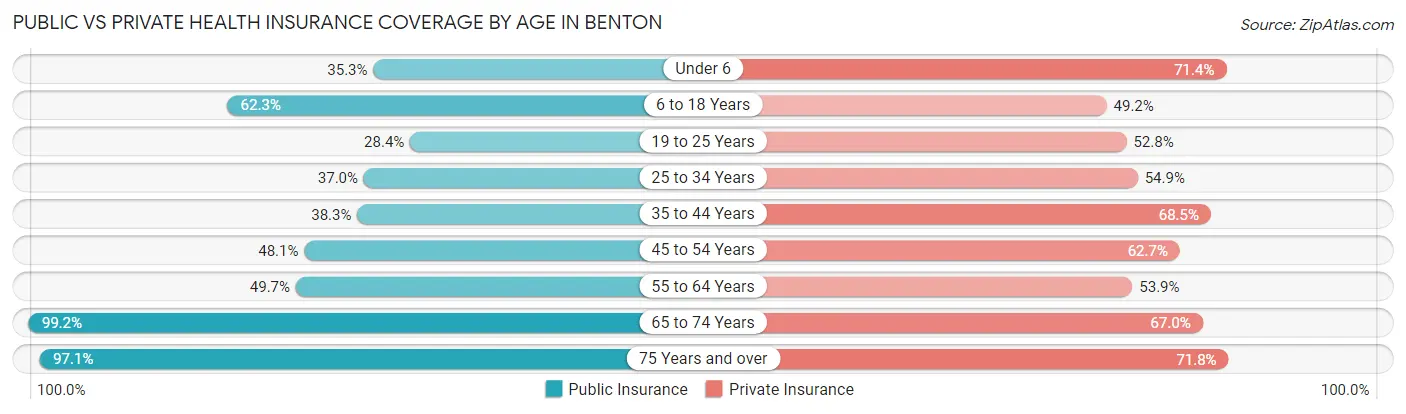
| Age Bracket | Public Insurance | Private Insurance |
| Under 6 | 128 (35.3%) | 259 (71.4%) |
| 6 to 18 Years | 810 (62.3%) | 639 (49.1%) |
| 19 to 25 Years | 120 (28.4%) | 223 (52.8%) |
| 25 to 34 Years | 304 (37.0%) | 451 (54.9%) |
| 35 to 44 Years | 301 (38.3%) | 539 (68.5%) |
| 45 to 54 Years | 378 (48.1%) | 493 (62.7%) |
| 55 to 64 Years | 430 (49.6%) | 467 (53.9%) |
| 65 to 74 Years | 760 (99.2%) | 513 (67.0%) |
| 75 Years and over | 578 (97.1%) | 427 (71.8%) |
| Total | 3,809 (56.8%) | 4,011 (59.8%) |
Disability Status by Sex by Age in Benton
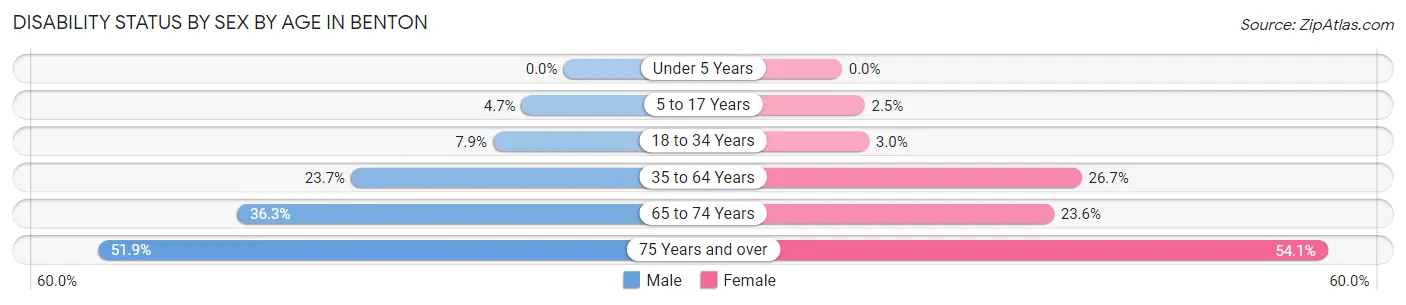
| Age Bracket | Male | Female |
| Under 5 Years | 0 (0.0%) | 0 (0.0%) |
| 5 to 17 Years | 29 (4.7%) | 15 (2.5%) |
| 18 to 34 Years | 55 (7.9%) | 19 (3.0%) |
| 35 to 64 Years | 274 (23.7%) | 342 (26.7%) |
| 65 to 74 Years | 109 (36.3%) | 110 (23.6%) |
| 75 Years and over | 112 (51.8%) | 205 (54.1%) |
Disability Class by Sex by Age in Benton
Disability Class: Hearing Difficulty
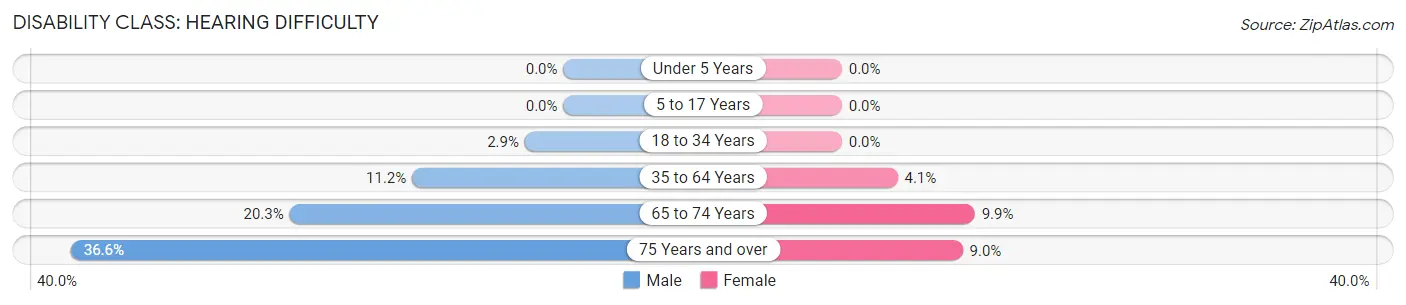
| Age Bracket | Male | Female |
| Under 5 Years | 0 (0.0%) | 0 (0.0%) |
| 5 to 17 Years | 0 (0.0%) | 0 (0.0%) |
| 18 to 34 Years | 20 (2.9%) | 0 (0.0%) |
| 35 to 64 Years | 130 (11.2%) | 53 (4.1%) |
| 65 to 74 Years | 61 (20.3%) | 46 (9.9%) |
| 75 Years and over | 79 (36.6%) | 34 (9.0%) |
Disability Class: Vision Difficulty
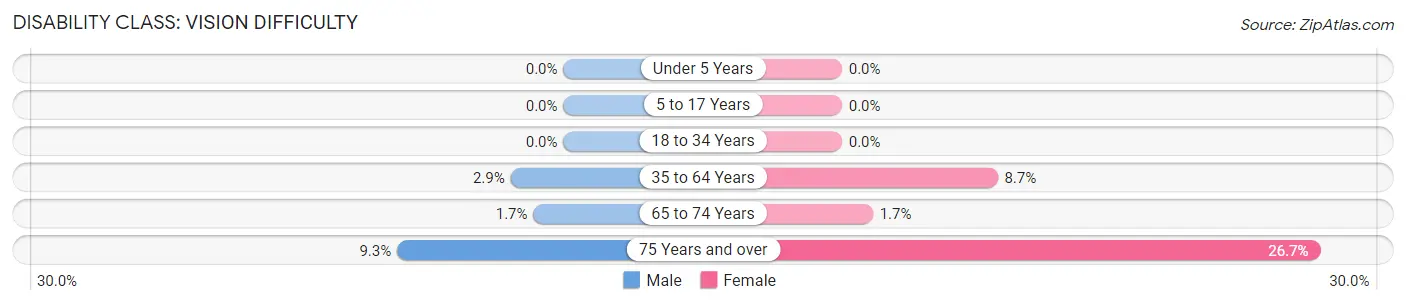
| Age Bracket | Male | Female |
| Under 5 Years | 0 (0.0%) | 0 (0.0%) |
| 5 to 17 Years | 0 (0.0%) | 0 (0.0%) |
| 18 to 34 Years | 0 (0.0%) | 0 (0.0%) |
| 35 to 64 Years | 34 (2.9%) | 111 (8.7%) |
| 65 to 74 Years | 5 (1.7%) | 8 (1.7%) |
| 75 Years and over | 20 (9.3%) | 101 (26.7%) |
Disability Class: Cognitive Difficulty
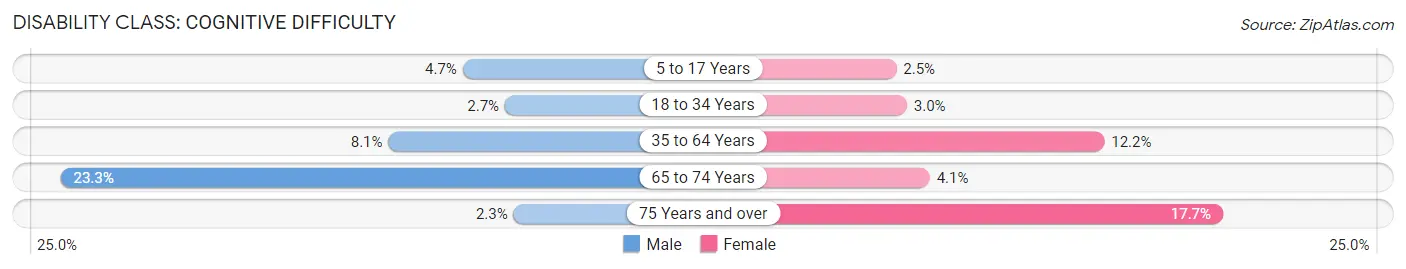
| Age Bracket | Male | Female |
| 5 to 17 Years | 29 (4.7%) | 15 (2.5%) |
| 18 to 34 Years | 19 (2.7%) | 19 (3.0%) |
| 35 to 64 Years | 94 (8.1%) | 156 (12.2%) |
| 65 to 74 Years | 70 (23.3%) | 19 (4.1%) |
| 75 Years and over | 5 (2.3%) | 67 (17.7%) |
Disability Class: Ambulatory Difficulty
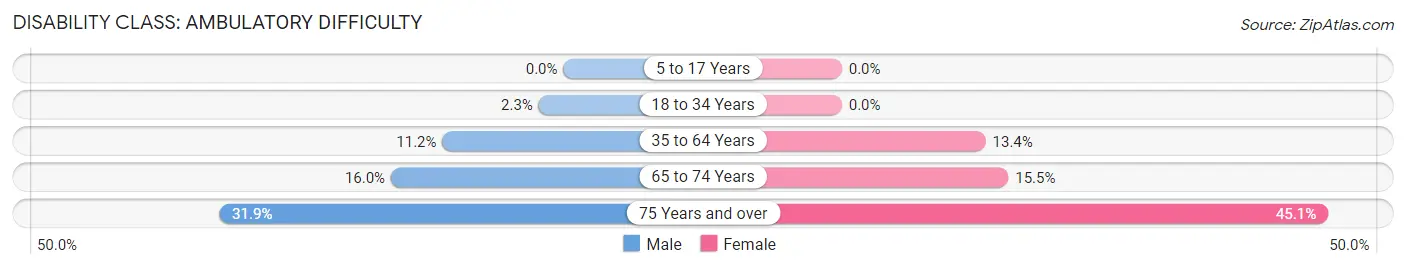
| Age Bracket | Male | Female |
| 5 to 17 Years | 0 (0.0%) | 0 (0.0%) |
| 18 to 34 Years | 16 (2.3%) | 0 (0.0%) |
| 35 to 64 Years | 130 (11.2%) | 171 (13.4%) |
| 65 to 74 Years | 48 (16.0%) | 72 (15.4%) |
| 75 Years and over | 69 (31.9%) | 171 (45.1%) |
Disability Class: Self-Care Difficulty
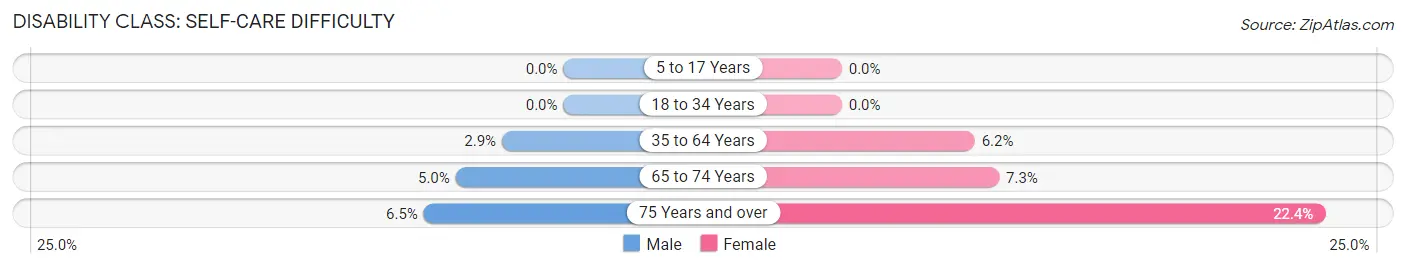
| Age Bracket | Male | Female |
| 5 to 17 Years | 0 (0.0%) | 0 (0.0%) |
| 18 to 34 Years | 0 (0.0%) | 0 (0.0%) |
| 35 to 64 Years | 33 (2.9%) | 79 (6.2%) |
| 65 to 74 Years | 15 (5.0%) | 34 (7.3%) |
| 75 Years and over | 14 (6.5%) | 85 (22.4%) |
Technology Access in Benton
Computing Device Access in Benton
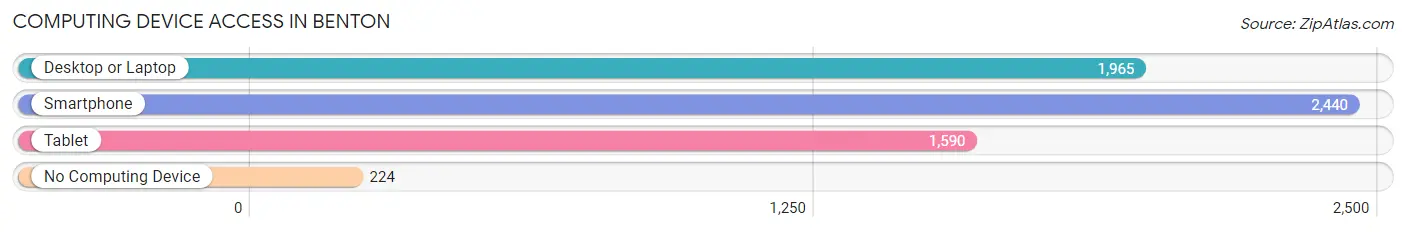
| Device Type | # Households | % Households |
| Desktop or Laptop | 1,965 | 67.2% |
| Smartphone | 2,440 | 83.5% |
| Tablet | 1,590 | 54.4% |
| No Computing Device | 224 | 7.7% |
| Total | 2,923 | 100.0% |
Internet Access in Benton
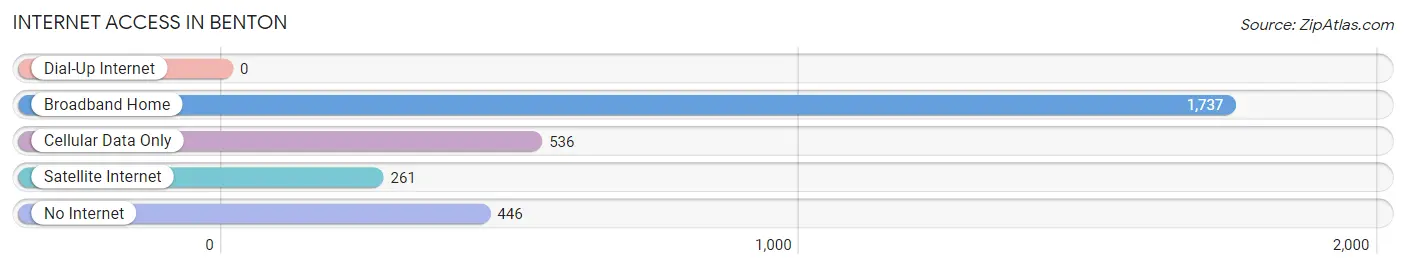
| Internet Type | # Households | % Households |
| Dial-Up Internet | 0 | 0.0% |
| Broadband Home | 1,737 | 59.4% |
| Cellular Data Only | 536 | 18.3% |
| Satellite Internet | 261 | 8.9% |
| No Internet | 446 | 15.3% |
| Total | 2,923 | 100.0% |
Benton Summary
Benton, Illinois is a small city located in Franklin County, in the southern part of the state. It is situated on the banks of the Big Muddy River, and is the county seat of Franklin County. The city has a population of 8,000 people, and is the largest city in the county.
History
Benton was founded in 1817 by William Benton, a settler from Kentucky. He purchased the land from the federal government, and named the town after himself. The town was incorporated in 1837, and the first post office was established in 1838.
In the early years, Benton was a small farming community, and the main industry was agriculture. The town was also known for its coal mining, and the coal industry was a major employer in the area.
In the late 19th century, Benton began to experience a period of growth and development. The railroad arrived in 1871, and the town became a major shipping center for the region. The population grew rapidly, and by the turn of the century, Benton had become a thriving industrial center.
Geography
Benton is located in the southern part of Illinois, in Franklin County. It is situated on the banks of the Big Muddy River, and is the county seat of Franklin County. The city has a total area of 4.2 square miles, and is the largest city in the county.
The city is located in a hilly region, and the terrain is mostly flat. The climate is humid continental, with hot summers and cold winters. The average annual temperature is around 50 degrees Fahrenheit.
Economy
Benton’s economy is largely based on agriculture and manufacturing. The city is home to several large manufacturing plants, including a steel mill, a paper mill, and a chemical plant. The city also has a large retail sector, with several shopping centers and stores.
The city is also home to several educational institutions, including a community college, a technical college, and a vocational school.
Demographics
As of the 2010 census, the population of Benton was 8,000 people. The racial makeup of the city was 95.3% White, 1.2% African American, 0.3% Native American, 0.7% Asian, 0.1% Pacific Islander, and 2.4% from other races. The median household income was $37,000, and the median family income was $45,000.
The city has a large number of churches, and the religious makeup of the city is predominantly Christian. The largest denominations are Baptist, Methodist, and Catholic.
Conclusion
Benton, Illinois is a small city located in Franklin County, in the southern part of the state. It is situated on the banks of the Big Muddy River, and is the county seat of Franklin County. The city has a population of 8,000 people, and is the largest city in the county. The economy of the city is largely based on agriculture and manufacturing, and the city is home to several educational institutions. The racial makeup of the city is predominantly White, and the religious makeup is predominantly Christian.
Common Questions
What is Per Capita Income in Benton?
Per Capita income in Benton is $29,242.
What is the Median Family Income in Benton?
Median Family Income in Benton is $57,539.
What is the Median Household income in Benton?
Median Household Income in Benton is $48,784.
What is Income or Wage Gap in Benton?
Income or Wage Gap in Benton is 5.7%.
Women in Benton earn 94.3 cents for every dollar earned by a man.
What is Inequality or Gini Index in Benton?
Inequality or Gini Index in Benton is 0.50.
What is the Total Population of Benton?
Total Population of Benton is 6,999.
What is the Total Male Population of Benton?
Total Male Population of Benton is 3,389.
What is the Total Female Population of Benton?
Total Female Population of Benton is 3,610.
What is the Ratio of Males per 100 Females in Benton?
There are 93.88 Males per 100 Females in Benton.
What is the Ratio of Females per 100 Males in Benton?
There are 106.52 Females per 100 Males in Benton.
What is the Median Population Age in Benton?
Median Population Age in Benton is 40.8 Years.
What is the Average Family Size in Benton
Average Family Size in Benton is 3.0 People.
What is the Average Household Size in Benton
Average Household Size in Benton is 2.3 People.
How Large is the Labor Force in Benton?
There are 3,007 People in the Labor Forcein in Benton.
What is the Percentage of People in the Labor Force in Benton?
53.4% of People are in the Labor Force in Benton.
What is the Unemployment Rate in Benton?
Unemployment Rate in Benton is 5.1%.