Bellflower, IL Map & Demographics
Bellflower Map
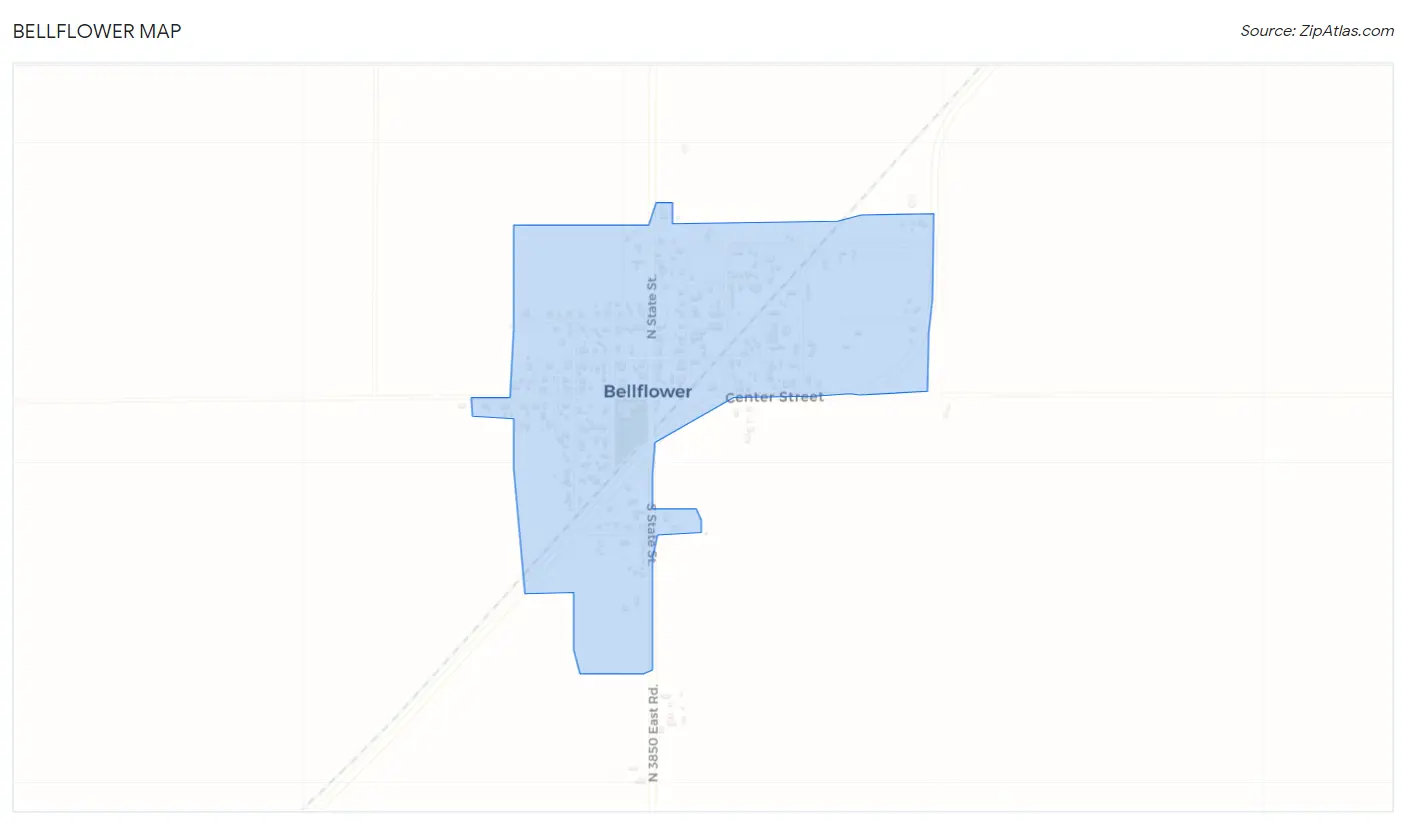
Bellflower Overview
$31,724
PER CAPITA INCOME
$83,750
AVG FAMILY INCOME
$76,875
AVG HOUSEHOLD INCOME
19.8%
WAGE / INCOME GAP [ % ]
80.2¢/ $1
WAGE / INCOME GAP [ $ ]
0.35
INEQUALITY / GINI INDEX
379
TOTAL POPULATION
192
MALE POPULATION
187
FEMALE POPULATION
102.67
MALES / 100 FEMALES
97.40
FEMALES / 100 MALES
40.1
MEDIAN AGE
3.1
AVG FAMILY SIZE
2.7
AVG HOUSEHOLD SIZE
181
LABOR FORCE [ PEOPLE ]
63.1%
PERCENT IN LABOR FORCE
5.0%
UNEMPLOYMENT RATE
Bellflower Zip Codes
Bellflower Area Codes
Income in Bellflower
Income Overview in Bellflower
Per Capita Income in Bellflower is $31,724, while median incomes of families and households are $83,750 and $76,875 respectively.
| Characteristic | Number | Measure |
| Per Capita Income | 379 | $31,724 |
| Median Family Income | 106 | $83,750 |
| Mean Family Income | 106 | $92,000 |
| Median Household Income | 141 | $76,875 |
| Mean Household Income | 141 | $83,052 |
| Income Deficit | 106 | $0 |
| Wage / Income Gap (%) | 379 | 19.78% |
| Wage / Income Gap ($) | 379 | 80.22¢ per $1 |
| Gini / Inequality Index | 379 | 0.35 |
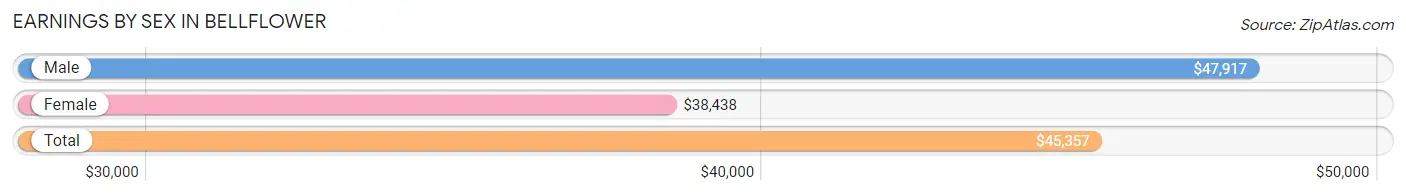
Earnings by Sex in Bellflower
Average Earnings in Bellflower are $45,357, $47,917 for men and $38,438 for women, a difference of 19.8%.
| Sex | Number | Average Earnings |
| Male | 93 (48.9%) | $47,917 |
| Female | 97 (51.0%) | $38,438 |
| Total | 190 (100.0%) | $45,357 |
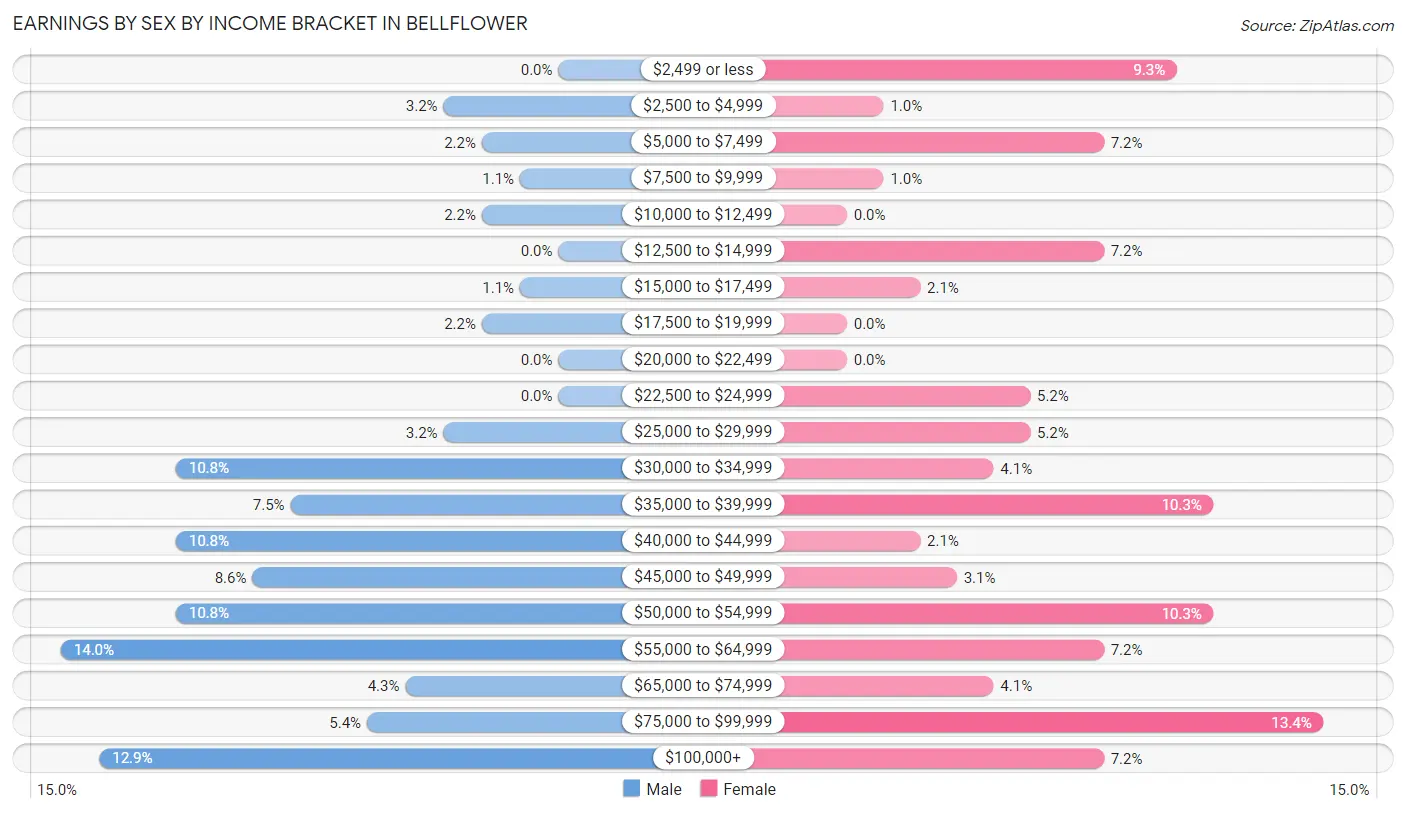
Earnings by Sex by Income Bracket in Bellflower
The most common earnings brackets in Bellflower are $55,000 to $64,999 for men (13 | 14.0%) and $75,000 to $99,999 for women (13 | 13.4%).
| Income | Male | Female |
| $2,499 or less | 0 (0.0%) | 9 (9.3%) |
| $2,500 to $4,999 | 3 (3.2%) | 1 (1.0%) |
| $5,000 to $7,499 | 2 (2.1%) | 7 (7.2%) |
| $7,500 to $9,999 | 1 (1.1%) | 1 (1.0%) |
| $10,000 to $12,499 | 2 (2.1%) | 0 (0.0%) |
| $12,500 to $14,999 | 0 (0.0%) | 7 (7.2%) |
| $15,000 to $17,499 | 1 (1.1%) | 2 (2.1%) |
| $17,500 to $19,999 | 2 (2.1%) | 0 (0.0%) |
| $20,000 to $22,499 | 0 (0.0%) | 0 (0.0%) |
| $22,500 to $24,999 | 0 (0.0%) | 5 (5.1%) |
| $25,000 to $29,999 | 3 (3.2%) | 5 (5.1%) |
| $30,000 to $34,999 | 10 (10.7%) | 4 (4.1%) |
| $35,000 to $39,999 | 7 (7.5%) | 10 (10.3%) |
| $40,000 to $44,999 | 10 (10.7%) | 2 (2.1%) |
| $45,000 to $49,999 | 8 (8.6%) | 3 (3.1%) |
| $50,000 to $54,999 | 10 (10.7%) | 10 (10.3%) |
| $55,000 to $64,999 | 13 (14.0%) | 7 (7.2%) |
| $65,000 to $74,999 | 4 (4.3%) | 4 (4.1%) |
| $75,000 to $99,999 | 5 (5.4%) | 13 (13.4%) |
| $100,000+ | 12 (12.9%) | 7 (7.2%) |
| Total | 93 (100.0%) | 97 (100.0%) |
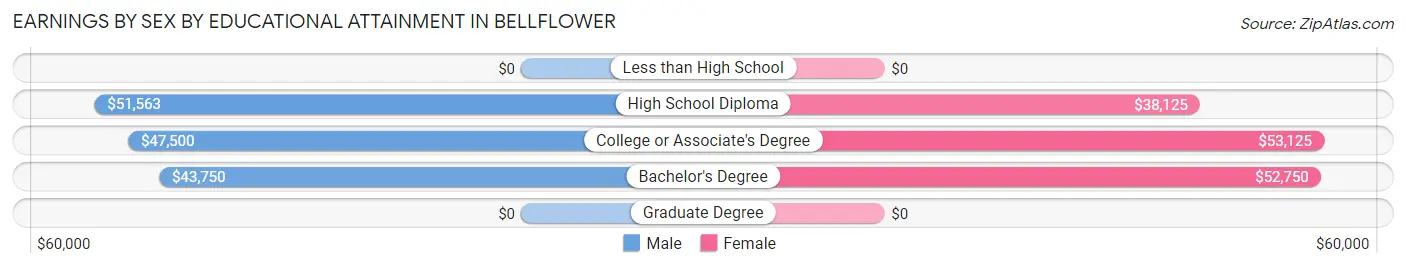
Earnings by Sex by Educational Attainment in Bellflower
Average earnings in Bellflower are $49,583 for men and $51,250 for women, a difference of 3.3%. Men with an educational attainment of high school diploma enjoy the highest average annual earnings of $51,563, while those with bachelor's degree education earn the least with $43,750. Women with an educational attainment of college or associate's degree earn the most with the average annual earnings of $53,125, while those with high school diploma education have the smallest earnings of $38,125.
| Educational Attainment | Male Income | Female Income |
| Less than High School | - | - |
| High School Diploma | $51,563 | $38,125 |
| College or Associate's Degree | $47,500 | $53,125 |
| Bachelor's Degree | $43,750 | $52,750 |
| Graduate Degree | - | - |
| Total | $49,583 | $51,250 |
Family Income in Bellflower
Family Income Brackets in Bellflower
According to the Bellflower family income data, there are 24 families falling into the $75,000 to $99,999 income range, which is the most common income bracket and makes up 22.6% of all families.
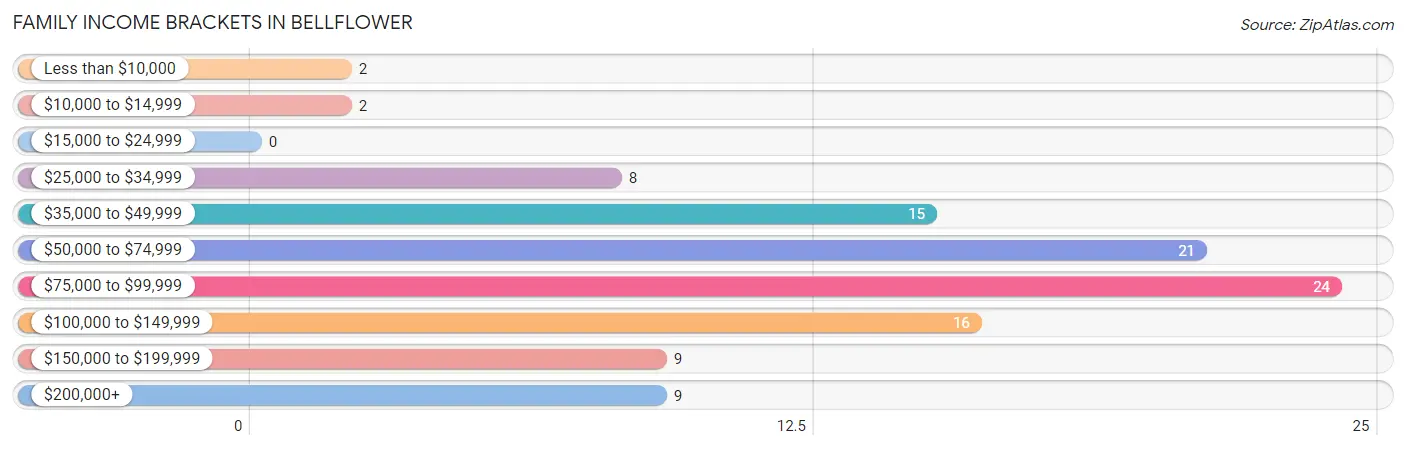
| Income Bracket | # Families | % Families |
| Less than $10,000 | 2 | 1.9% |
| $10,000 to $14,999 | 2 | 1.9% |
| $15,000 to $24,999 | 0 | 0.0% |
| $25,000 to $34,999 | 8 | 7.5% |
| $35,000 to $49,999 | 15 | 14.2% |
| $50,000 to $74,999 | 21 | 19.8% |
| $75,000 to $99,999 | 24 | 22.6% |
| $100,000 to $149,999 | 16 | 15.1% |
| $150,000 to $199,999 | 9 | 8.5% |
| $200,000+ | 9 | 8.5% |
Family Income by Famaliy Size in Bellflower
4-person families (17 | 16.0%) account for the highest median family income in Bellflower with $125,625 per family, while 2-person families (58 | 54.7%) have the highest median income of $31,875 per family member.
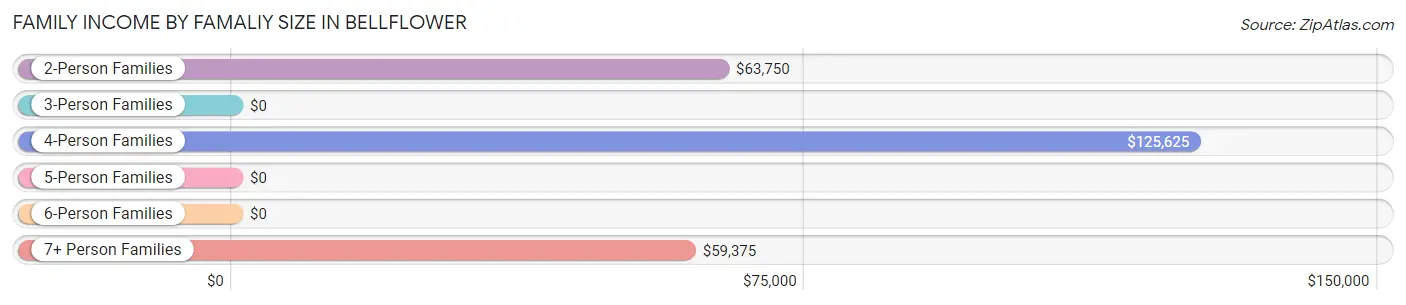
| Income Bracket | # Families | Median Income |
| 2-Person Families | 58 (54.7%) | $63,750 |
| 3-Person Families | 14 (13.2%) | $0 |
| 4-Person Families | 17 (16.0%) | $125,625 |
| 5-Person Families | 6 (5.7%) | $0 |
| 6-Person Families | 4 (3.8%) | $0 |
| 7+ Person Families | 7 (6.6%) | $59,375 |
| Total | 106 (100.0%) | $83,750 |
Family Income by Number of Earners in Bellflower
The median family income in Bellflower is $83,750, with families comprising 2 earners (39) having the highest median family income of $122,917, while families with 1 earner (46) have the lowest median family income of $55,625, accounting for 36.8% and 43.4% of families, respectively.
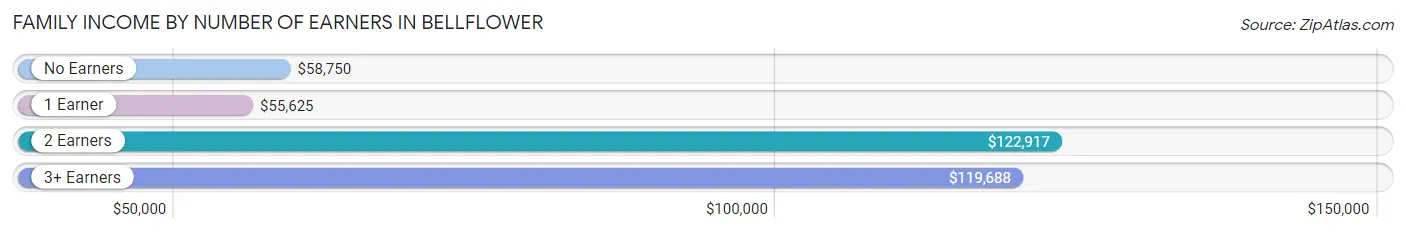
| Number of Earners | # Families | Median Income |
| No Earners | 10 (9.4%) | $58,750 |
| 1 Earner | 46 (43.4%) | $55,625 |
| 2 Earners | 39 (36.8%) | $122,917 |
| 3+ Earners | 11 (10.4%) | $119,688 |
| Total | 106 (100.0%) | $83,750 |
Household Income in Bellflower
Household Income Brackets in Bellflower
With 37 households falling in the category, the $75,000 to $99,999 income range is the most frequent in Bellflower, accounting for 26.2% of all households. In contrast, only 2 households (1.4%) fall into the $15,000 to $24,999 income bracket, making it the least populous group.
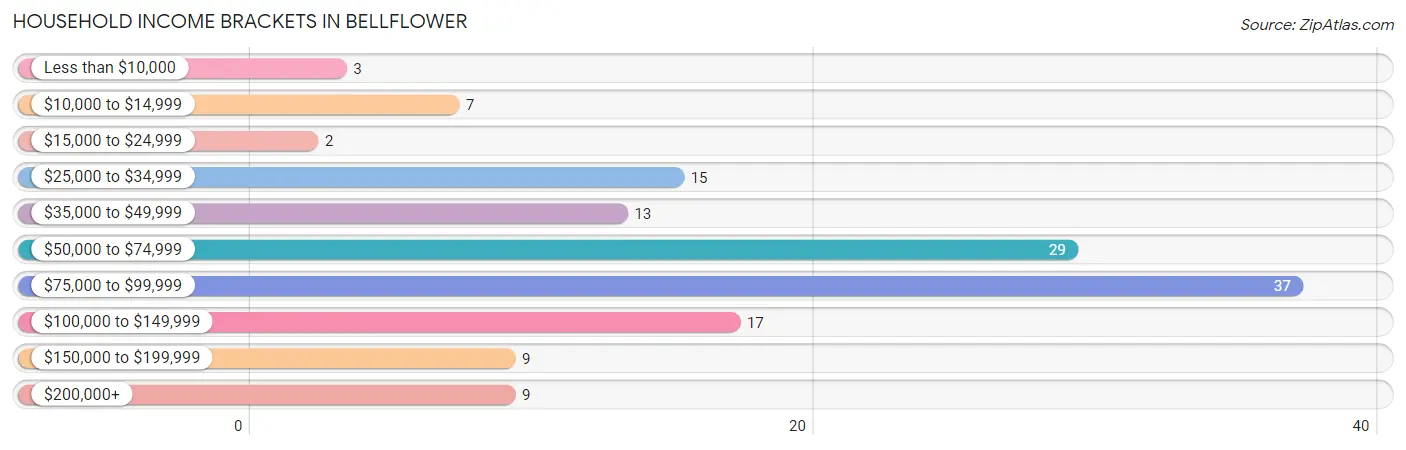
| Income Bracket | # Households | % Households |
| Less than $10,000 | 3 | 2.1% |
| $10,000 to $14,999 | 7 | 5.0% |
| $15,000 to $24,999 | 2 | 1.4% |
| $25,000 to $34,999 | 15 | 10.6% |
| $35,000 to $49,999 | 13 | 9.2% |
| $50,000 to $74,999 | 29 | 20.6% |
| $75,000 to $99,999 | 37 | 26.2% |
| $100,000 to $149,999 | 17 | 12.1% |
| $150,000 to $199,999 | 9 | 6.4% |
| $200,000+ | 9 | 6.4% |
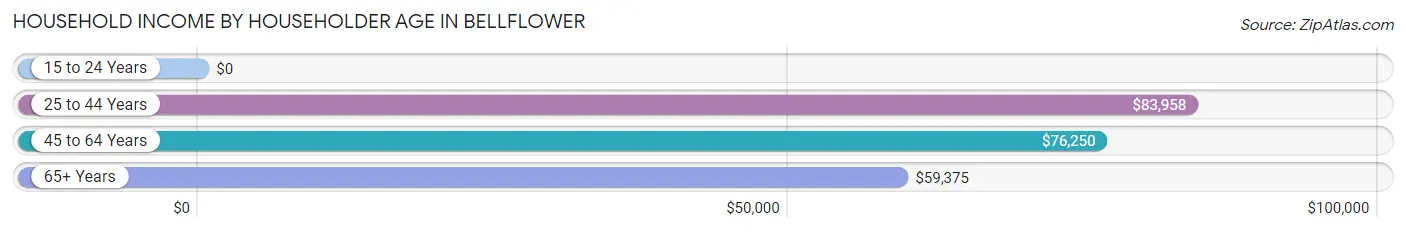
Household Income by Householder Age in Bellflower
The median household income in Bellflower is $76,875, with the highest median household income of $83,958 found in the 25 to 44 years age bracket for the primary householder. A total of 47 households (33.3%) fall into this category. Meanwhile, the 15 to 24 years age bracket for the primary householder has the lowest median household income of $0, with 2 households (1.4%) in this group.
| Income Bracket | # Households | Median Income |
| 15 to 24 Years | 2 (1.4%) | $0 |
| 25 to 44 Years | 47 (33.3%) | $83,958 |
| 45 to 64 Years | 51 (36.2%) | $76,250 |
| 65+ Years | 41 (29.1%) | $59,375 |
| Total | 141 (100.0%) | $76,875 |
Poverty in Bellflower
Income Below Poverty by Sex and Age in Bellflower
With 4.7% poverty level for males and 3.7% for females among the residents of Bellflower, 75 year old and over males and 75 year old and over females are the most vulnerable to poverty, with 2 males (15.4%) and 4 females (33.3%) in their respective age groups living below the poverty level.
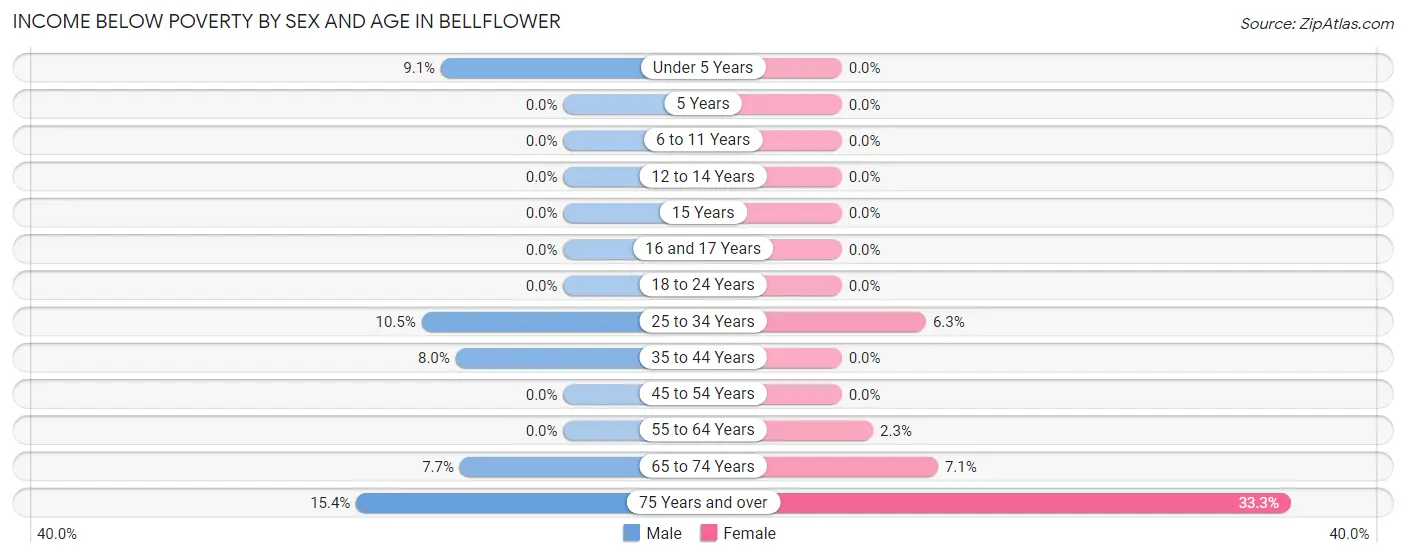
| Age Bracket | Male | Female |
| Under 5 Years | 1 (9.1%) | 0 (0.0%) |
| 5 Years | 0 (0.0%) | 0 (0.0%) |
| 6 to 11 Years | 0 (0.0%) | 0 (0.0%) |
| 12 to 14 Years | 0 (0.0%) | 0 (0.0%) |
| 15 Years | 0 (0.0%) | 0 (0.0%) |
| 16 and 17 Years | 0 (0.0%) | 0 (0.0%) |
| 18 to 24 Years | 0 (0.0%) | 0 (0.0%) |
| 25 to 34 Years | 2 (10.5%) | 1 (6.2%) |
| 35 to 44 Years | 2 (8.0%) | 0 (0.0%) |
| 45 to 54 Years | 0 (0.0%) | 0 (0.0%) |
| 55 to 64 Years | 0 (0.0%) | 1 (2.3%) |
| 65 to 74 Years | 2 (7.7%) | 1 (7.1%) |
| 75 Years and over | 2 (15.4%) | 4 (33.3%) |
| Total | 9 (4.7%) | 7 (3.7%) |
Income Above Poverty by Sex and Age in Bellflower
According to the poverty statistics in Bellflower, males aged 5 years and females aged under 5 years are the age groups that are most secure financially, with 100.0% of males and 100.0% of females in these age groups living above the poverty line.
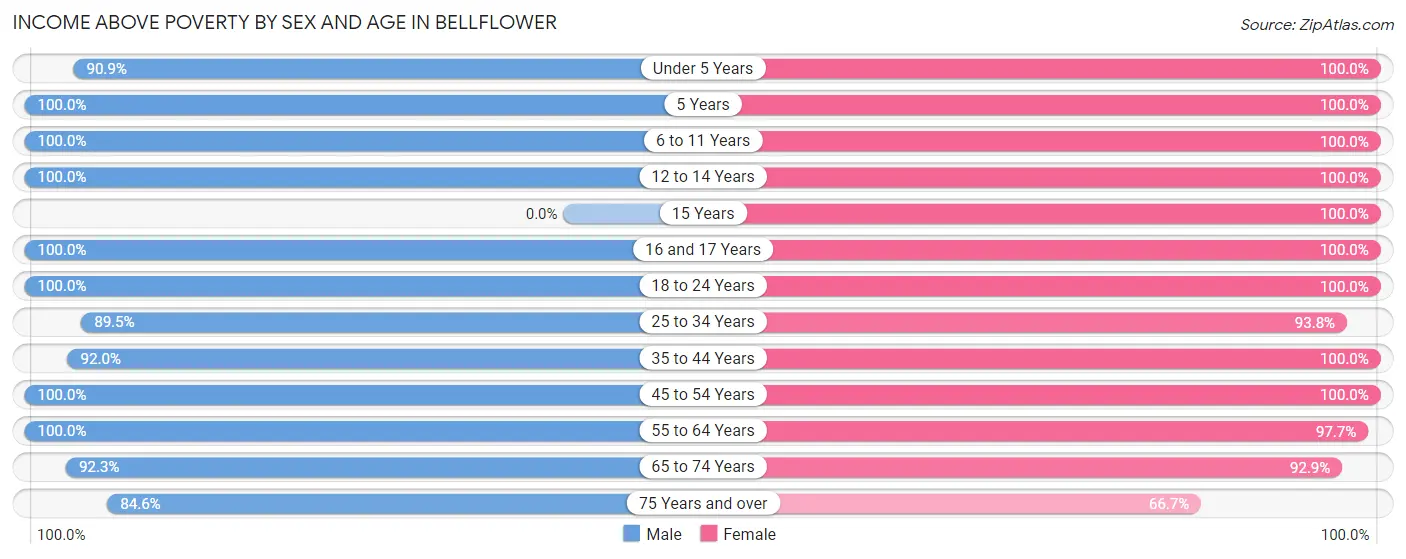
| Age Bracket | Male | Female |
| Under 5 Years | 10 (90.9%) | 4 (100.0%) |
| 5 Years | 5 (100.0%) | 3 (100.0%) |
| 6 to 11 Years | 21 (100.0%) | 18 (100.0%) |
| 12 to 14 Years | 9 (100.0%) | 15 (100.0%) |
| 15 Years | 0 (0.0%) | 6 (100.0%) |
| 16 and 17 Years | 2 (100.0%) | 6 (100.0%) |
| 18 to 24 Years | 14 (100.0%) | 18 (100.0%) |
| 25 to 34 Years | 17 (89.5%) | 15 (93.8%) |
| 35 to 44 Years | 23 (92.0%) | 25 (100.0%) |
| 45 to 54 Years | 21 (100.0%) | 7 (100.0%) |
| 55 to 64 Years | 26 (100.0%) | 42 (97.7%) |
| 65 to 74 Years | 24 (92.3%) | 13 (92.9%) |
| 75 Years and over | 11 (84.6%) | 8 (66.7%) |
| Total | 183 (95.3%) | 180 (96.3%) |
Income Below Poverty Among Married-Couple Families in Bellflower
The poverty statistics for married-couple families in Bellflower show that 4.8% or 4 of the total 83 families live below the poverty line. Families with 1 or 2 children have the highest poverty rate of 7.4%, comprising of 2 families. On the other hand, families with 3 or 4 children have the lowest poverty rate of 0.0%, which includes 0 families.
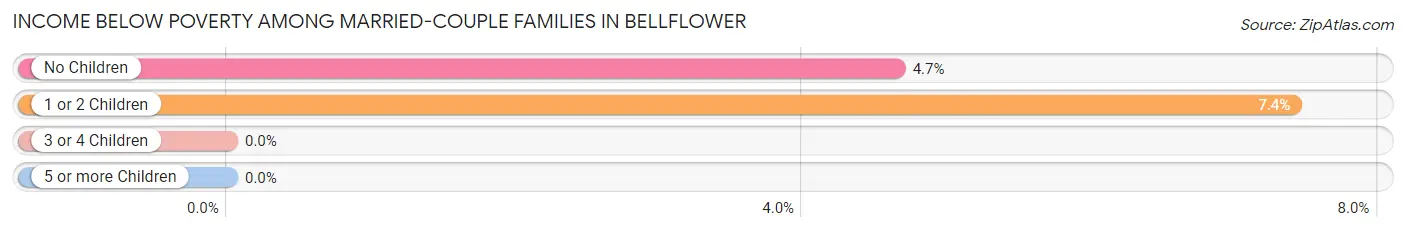
| Children | Above Poverty | Below Poverty |
| No Children | 41 (95.4%) | 2 (4.6%) |
| 1 or 2 Children | 25 (92.6%) | 2 (7.4%) |
| 3 or 4 Children | 10 (100.0%) | 0 (0.0%) |
| 5 or more Children | 3 (100.0%) | 0 (0.0%) |
| Total | 79 (95.2%) | 4 (4.8%) |
Income Below Poverty Among Single-Parent Households in Bellflower
| Children | Single Father | Single Mother |
| No Children | 0 (0.0%) | 0 (0.0%) |
| 1 or 2 Children | 0 (0.0%) | 0 (0.0%) |
| 3 or 4 Children | 0 (0.0%) | 0 (0.0%) |
| 5 or more Children | 0 (0.0%) | 0 (0.0%) |
| Total | 0 (0.0%) | 0 (0.0%) |
Income Below Poverty Among Married-Couple vs Single-Parent Households in Bellflower
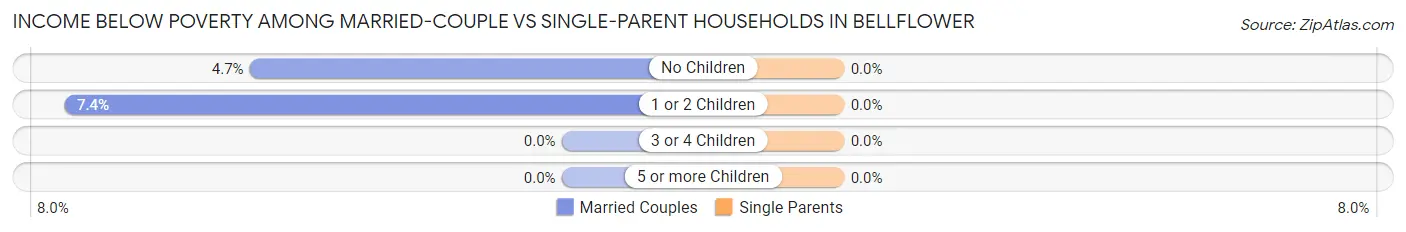
| Children | Married-Couple Families | Single-Parent Households |
| No Children | 2 (4.6%) | 0 (0.0%) |
| 1 or 2 Children | 2 (7.4%) | 0 (0.0%) |
| 3 or 4 Children | 0 (0.0%) | 0 (0.0%) |
| 5 or more Children | 0 (0.0%) | 0 (0.0%) |
| Total | 4 (4.8%) | 0 (0.0%) |
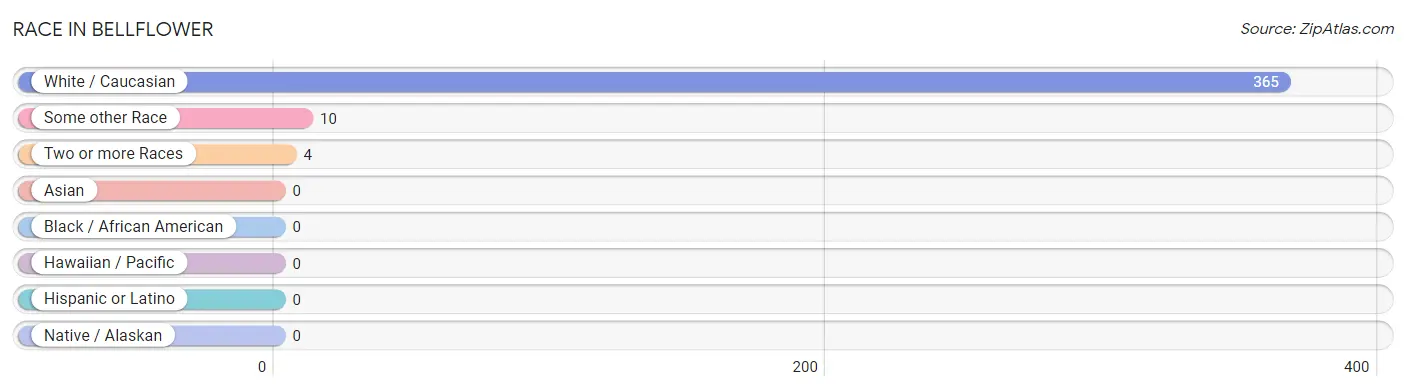
Race in Bellflower
The most populous races in Bellflower are White / Caucasian (365 | 96.3%), Some other Race (10 | 2.6%), and Two or more Races (4 | 1.1%).
| Race | # Population | % Population |
| Asian | 0 | 0.0% |
| Black / African American | 0 | 0.0% |
| Hawaiian / Pacific | 0 | 0.0% |
| Hispanic or Latino | 0 | 0.0% |
| Native / Alaskan | 0 | 0.0% |
| White / Caucasian | 365 | 96.3% |
| Two or more Races | 4 | 1.1% |
| Some other Race | 10 | 2.6% |
| Total | 379 | 100.0% |
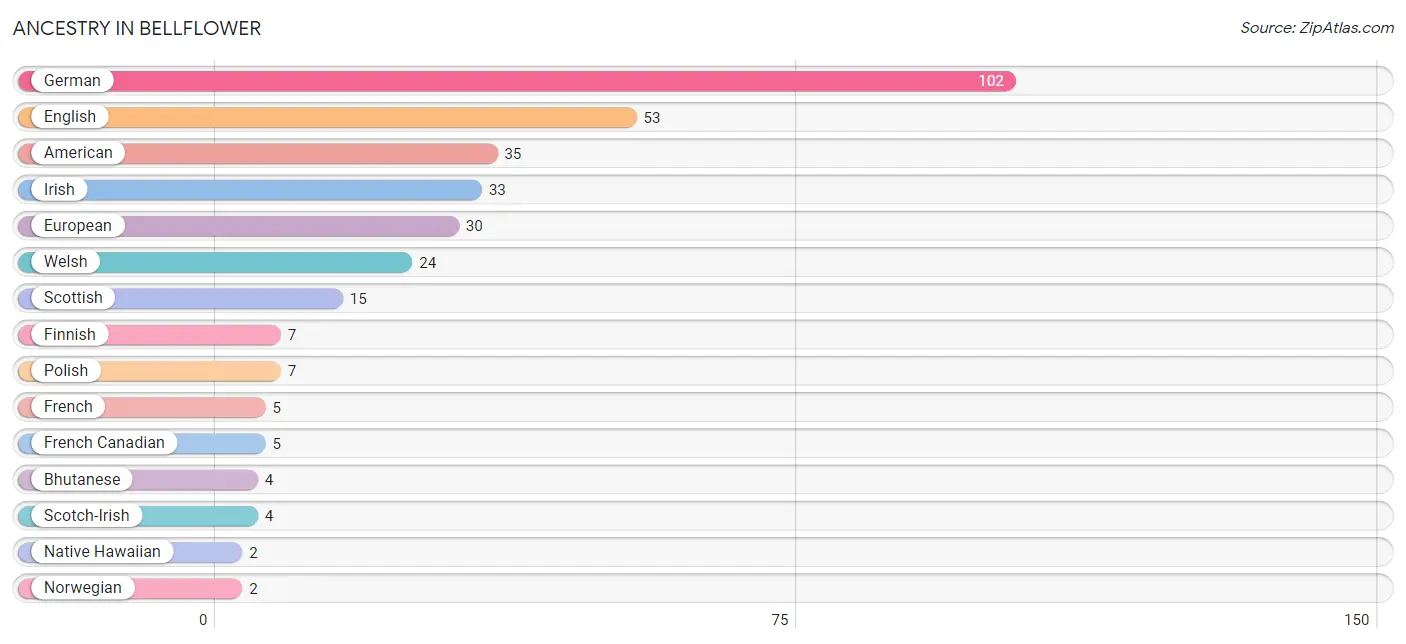
Ancestry in Bellflower
The most populous ancestries reported in Bellflower are German (102 | 26.9%), English (53 | 14.0%), American (35 | 9.2%), Irish (33 | 8.7%), and European (30 | 7.9%), together accounting for 66.8% of all Bellflower residents.
| Ancestry | # Population | % Population |
| American | 35 | 9.2% |
| Bhutanese | 4 | 1.1% |
| Canadian | 1 | 0.3% |
| English | 53 | 14.0% |
| European | 30 | 7.9% |
| Finnish | 7 | 1.8% |
| French | 5 | 1.3% |
| French Canadian | 5 | 1.3% |
| German | 102 | 26.9% |
| Irish | 33 | 8.7% |
| Lithuanian | 1 | 0.3% |
| Native Hawaiian | 2 | 0.5% |
| Northern European | 1 | 0.3% |
| Norwegian | 2 | 0.5% |
| Polish | 7 | 1.8% |
| Scotch-Irish | 4 | 1.1% |
| Scottish | 15 | 4.0% |
| Swedish | 2 | 0.5% |
| Welsh | 24 | 6.3% | View All 19 Rows |
Immigrants in Bellflower
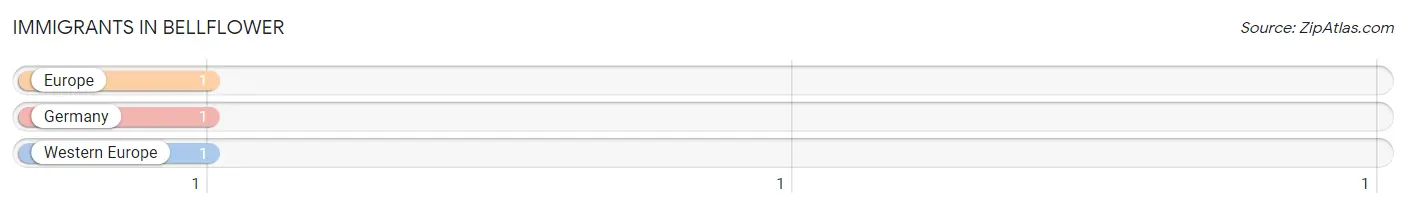
The most numerous immigrant groups reported in Bellflower came from Europe (1 | 0.3%), Germany (1 | 0.3%), and Western Europe (1 | 0.3%), together accounting for 0.8% of all Bellflower residents.
| Immigration Origin | # Population | % Population |
| Europe | 1 | 0.3% |
| Germany | 1 | 0.3% |
| Western Europe | 1 | 0.3% | View All 3 Rows |
Sex and Age in Bellflower
Sex and Age in Bellflower
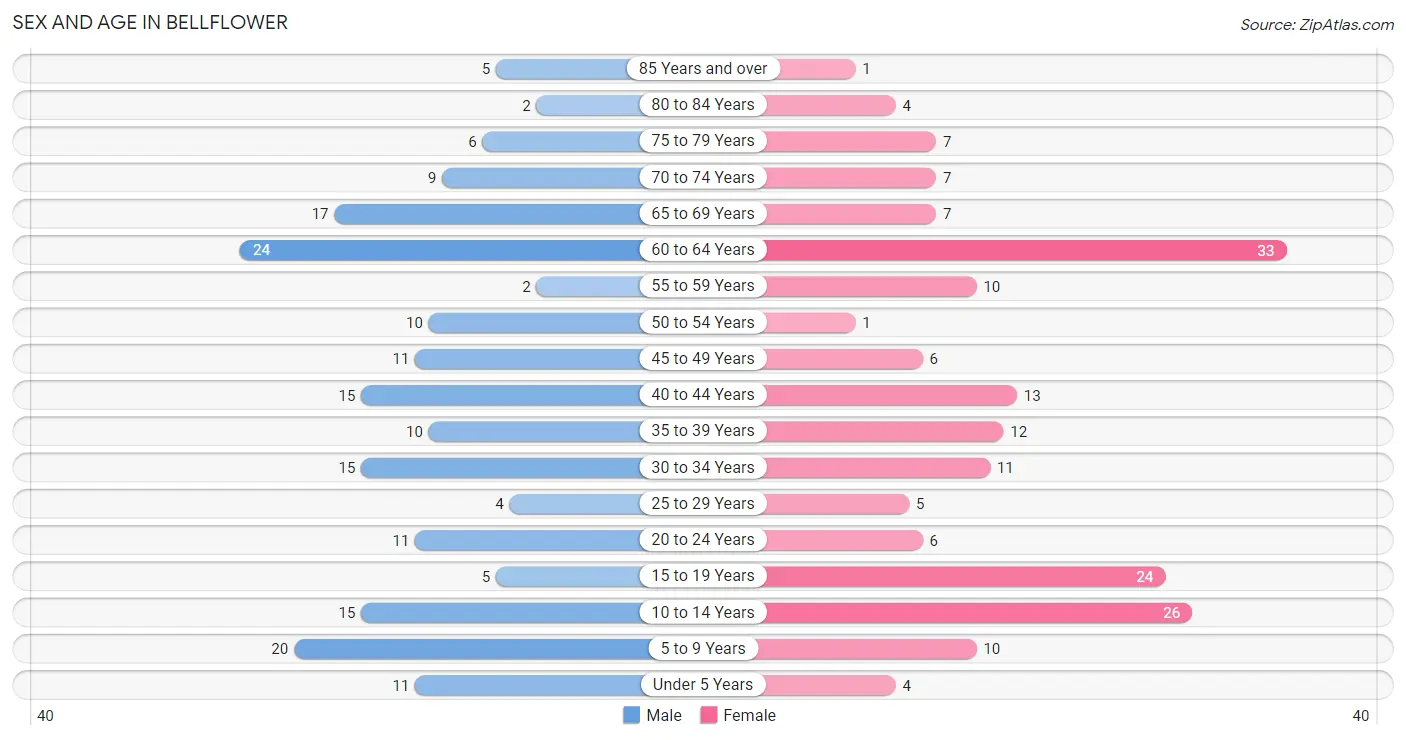
The most populous age groups in Bellflower are 60 to 64 Years (24 | 12.5%) for men and 60 to 64 Years (33 | 17.6%) for women.
| Age Bracket | Male | Female |
| Under 5 Years | 11 (5.7%) | 4 (2.1%) |
| 5 to 9 Years | 20 (10.4%) | 10 (5.3%) |
| 10 to 14 Years | 15 (7.8%) | 26 (13.9%) |
| 15 to 19 Years | 5 (2.6%) | 24 (12.8%) |
| 20 to 24 Years | 11 (5.7%) | 6 (3.2%) |
| 25 to 29 Years | 4 (2.1%) | 5 (2.7%) |
| 30 to 34 Years | 15 (7.8%) | 11 (5.9%) |
| 35 to 39 Years | 10 (5.2%) | 12 (6.4%) |
| 40 to 44 Years | 15 (7.8%) | 13 (7.0%) |
| 45 to 49 Years | 11 (5.7%) | 6 (3.2%) |
| 50 to 54 Years | 10 (5.2%) | 1 (0.5%) |
| 55 to 59 Years | 2 (1.0%) | 10 (5.3%) |
| 60 to 64 Years | 24 (12.5%) | 33 (17.6%) |
| 65 to 69 Years | 17 (8.8%) | 7 (3.7%) |
| 70 to 74 Years | 9 (4.7%) | 7 (3.7%) |
| 75 to 79 Years | 6 (3.1%) | 7 (3.7%) |
| 80 to 84 Years | 2 (1.0%) | 4 (2.1%) |
| 85 Years and over | 5 (2.6%) | 1 (0.5%) |
| Total | 192 (100.0%) | 187 (100.0%) |
Families and Households in Bellflower
Median Family Size in Bellflower
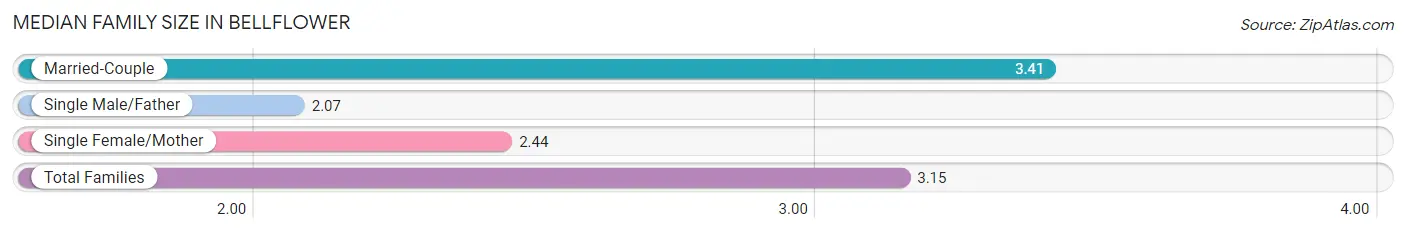
The median family size in Bellflower is 3.15 persons per family, with married-couple families (83 | 78.3%) accounting for the largest median family size of 3.41 persons per family. On the other hand, single male/father families (14 | 13.2%) represent the smallest median family size with 2.07 persons per family.
| Family Type | # Families | Family Size |
| Married-Couple | 83 (78.3%) | 3.41 |
| Single Male/Father | 14 (13.2%) | 2.07 |
| Single Female/Mother | 9 (8.5%) | 2.44 |
| Total Families | 106 (100.0%) | 3.15 |
Median Household Size in Bellflower
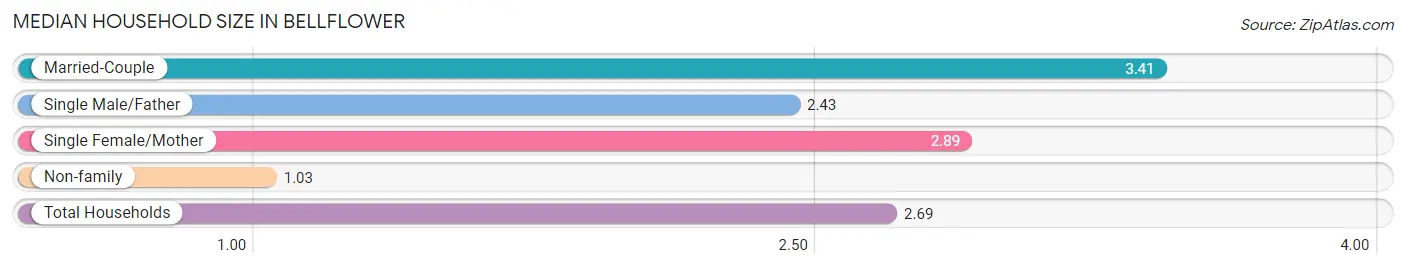
The median household size in Bellflower is 2.69 persons per household, with married-couple households (83 | 58.9%) accounting for the largest median household size of 3.41 persons per household. non-family households (35 | 24.8%) represent the smallest median household size with 1.03 persons per household.
| Household Type | # Households | Household Size |
| Married-Couple | 83 (58.9%) | 3.41 |
| Single Male/Father | 14 (9.9%) | 2.43 |
| Single Female/Mother | 9 (6.4%) | 2.89 |
| Non-family | 35 (24.8%) | 1.03 |
| Total Households | 141 (100.0%) | 2.69 |
Household Size by Marriage Status in Bellflower
Out of a total of 141 households in Bellflower, 106 (75.2%) are family households, while 35 (24.8%) are nonfamily households. The most numerous type of family households are 2-person households, comprising 51, and the most common type of nonfamily households are 1-person households, comprising 34.
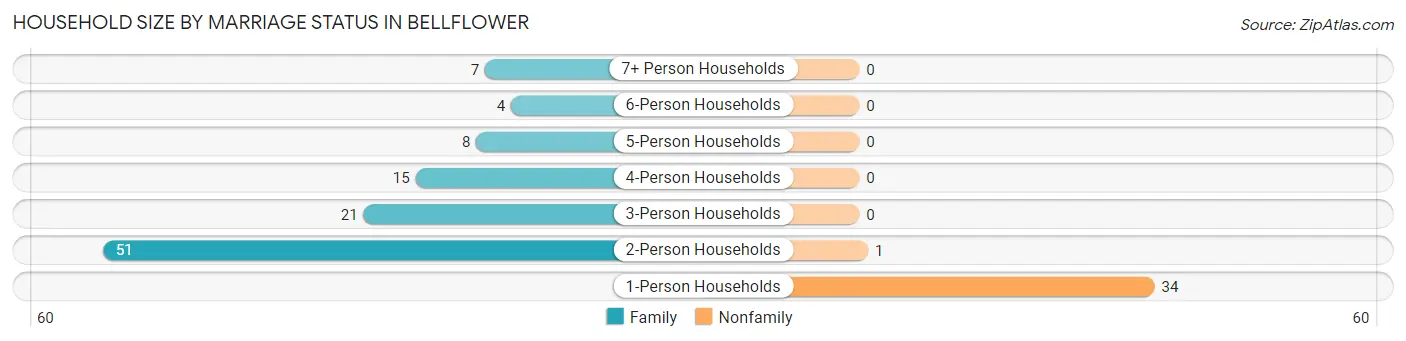
| Household Size | Family Households | Nonfamily Households |
| 1-Person Households | - | 34 (24.1%) |
| 2-Person Households | 51 (36.2%) | 1 (0.7%) |
| 3-Person Households | 21 (14.9%) | 0 (0.0%) |
| 4-Person Households | 15 (10.6%) | 0 (0.0%) |
| 5-Person Households | 8 (5.7%) | 0 (0.0%) |
| 6-Person Households | 4 (2.8%) | 0 (0.0%) |
| 7+ Person Households | 7 (5.0%) | 0 (0.0%) |
| Total | 106 (75.2%) | 35 (24.8%) |
Female Fertility in Bellflower
Fertility by Age in Bellflower
Average fertility rate in Bellflower is 91.0 births per 1,000 women. Women in the age bracket of 20 to 34 years have the highest fertility rate with 318.0 births per 1,000 women. Women in the age bracket of 20 to 34 years acount for 100.0% of all women with births.
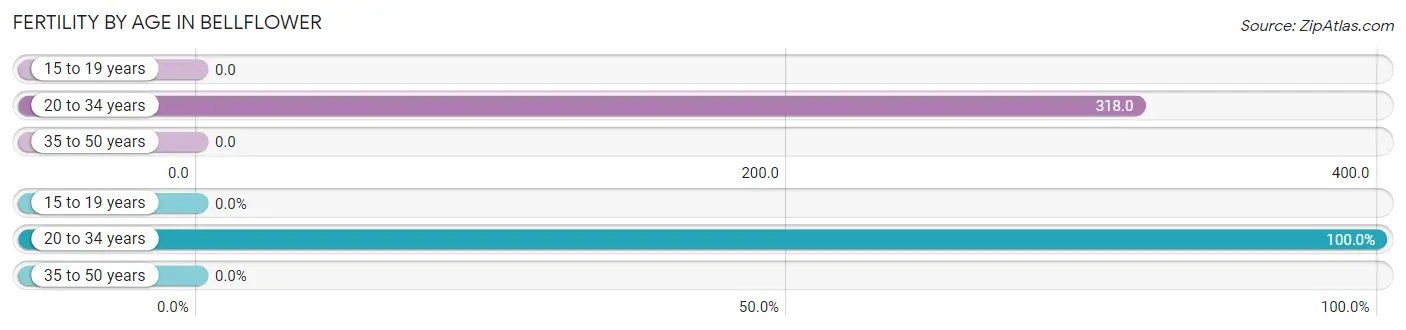
| Age Bracket | Women with Births | Births / 1,000 Women |
| 15 to 19 years | 0 (0.0%) | 0.0 |
| 20 to 34 years | 7 (100.0%) | 318.0 |
| 35 to 50 years | 0 (0.0%) | 0.0 |
| Total | 7 (100.0%) | 91.0 |
Fertility by Age by Marriage Status in Bellflower
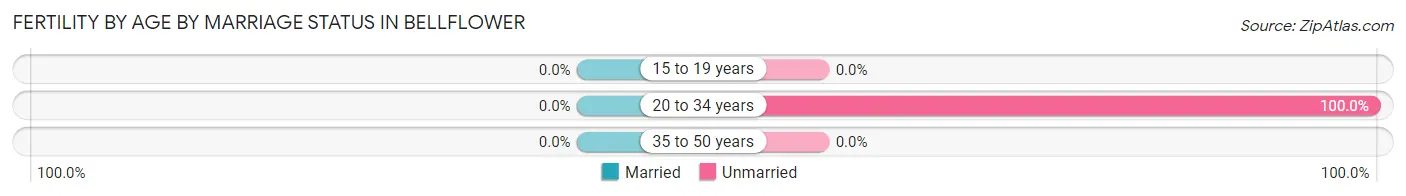
| Age Bracket | Married | Unmarried |
| 15 to 19 years | 0 (0.0%) | 0 (0.0%) |
| 20 to 34 years | 0 (0.0%) | 7 (100.0%) |
| 35 to 50 years | 0 (0.0%) | 0 (0.0%) |
| Total | 0 (0.0%) | 7 (100.0%) |
Fertility by Education in Bellflower
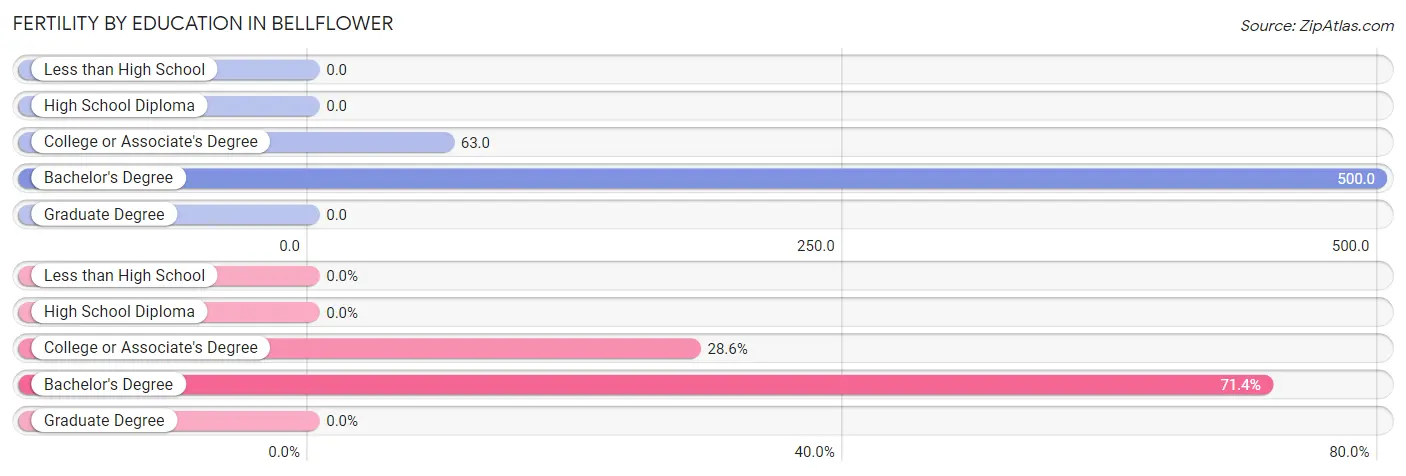
| Educational Attainment | Women with Births | Births / 1,000 Women |
| Less than High School | 0 (0.0%) | 0.0 |
| High School Diploma | 0 (0.0%) | 0.0 |
| College or Associate's Degree | 2 (28.6%) | 63.0 |
| Bachelor's Degree | 5 (71.4%) | 500.0 |
| Graduate Degree | 0 (0.0%) | 0.0 |
| Total | 7 (100.0%) | 91.0 |
Fertility by Education by Marriage Status in Bellflower
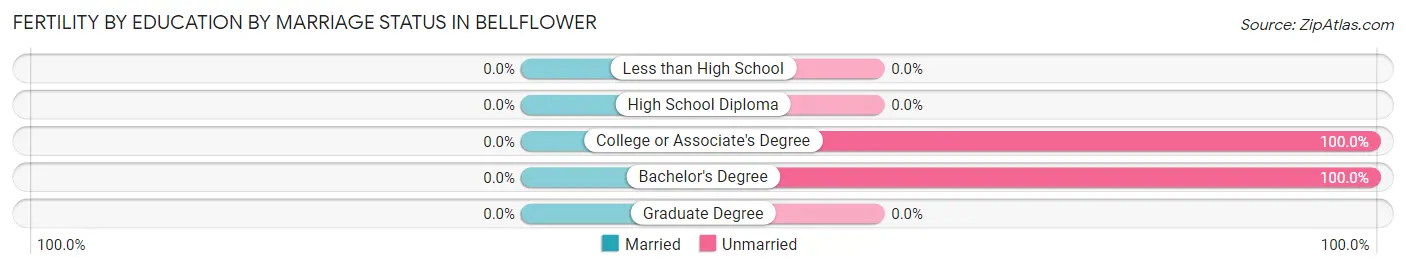
| Educational Attainment | Married | Unmarried |
| Less than High School | 0 (0.0%) | 0 (0.0%) |
| High School Diploma | 0 (0.0%) | 0 (0.0%) |
| College or Associate's Degree | 0 (0.0%) | 2 (100.0%) |
| Bachelor's Degree | 0 (0.0%) | 5 (100.0%) |
| Graduate Degree | 0 (0.0%) | 0 (0.0%) |
| Total | 0 (0.0%) | 7 (100.0%) |
Employment Characteristics in Bellflower
Employment by Class of Employer in Bellflower
Among the 166 employed individuals in Bellflower, private company employees (108 | 65.1%), not-for-profit organizations (19 | 11.5%), and self-employed (not incorporated) (16 | 9.6%) make up the most common classes of employment.
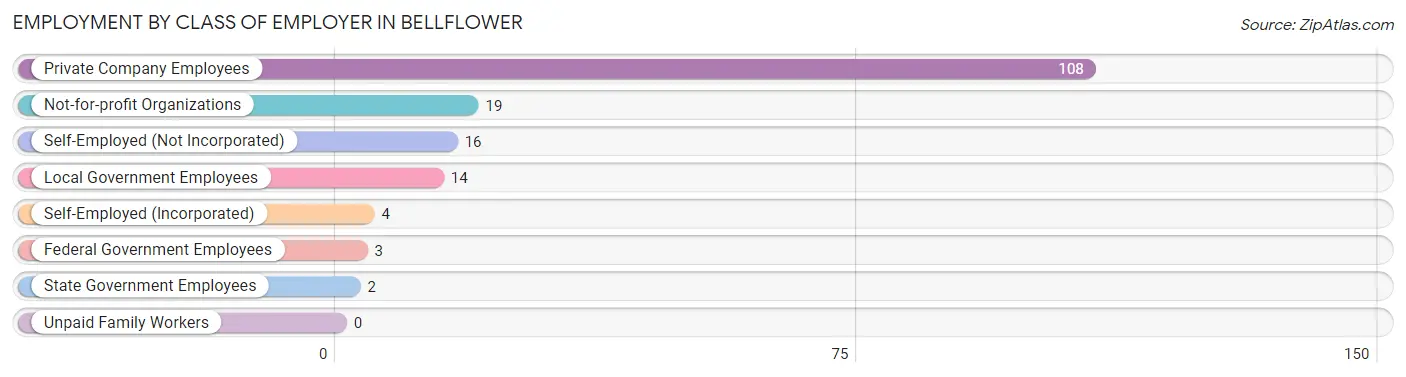
| Employer Class | # Employees | % Employees |
| Private Company Employees | 108 | 65.1% |
| Self-Employed (Incorporated) | 4 | 2.4% |
| Self-Employed (Not Incorporated) | 16 | 9.6% |
| Not-for-profit Organizations | 19 | 11.5% |
| Local Government Employees | 14 | 8.4% |
| State Government Employees | 2 | 1.2% |
| Federal Government Employees | 3 | 1.8% |
| Unpaid Family Workers | 0 | 0.0% |
| Total | 166 | 100.0% |
Employment Status by Age in Bellflower
According to the labor force statistics for Bellflower, out of the total population over 16 years of age (287), 63.1% or 181 individuals are in the labor force, with 5.0% or 9 of them unemployed. The age group with the highest labor force participation rate is 30 to 34 years, with 96.2% or 25 individuals in the labor force. Within the labor force, the 30 to 34 years age range has the highest percentage of unemployed individuals, with 24.0% or 6 of them being unemployed.
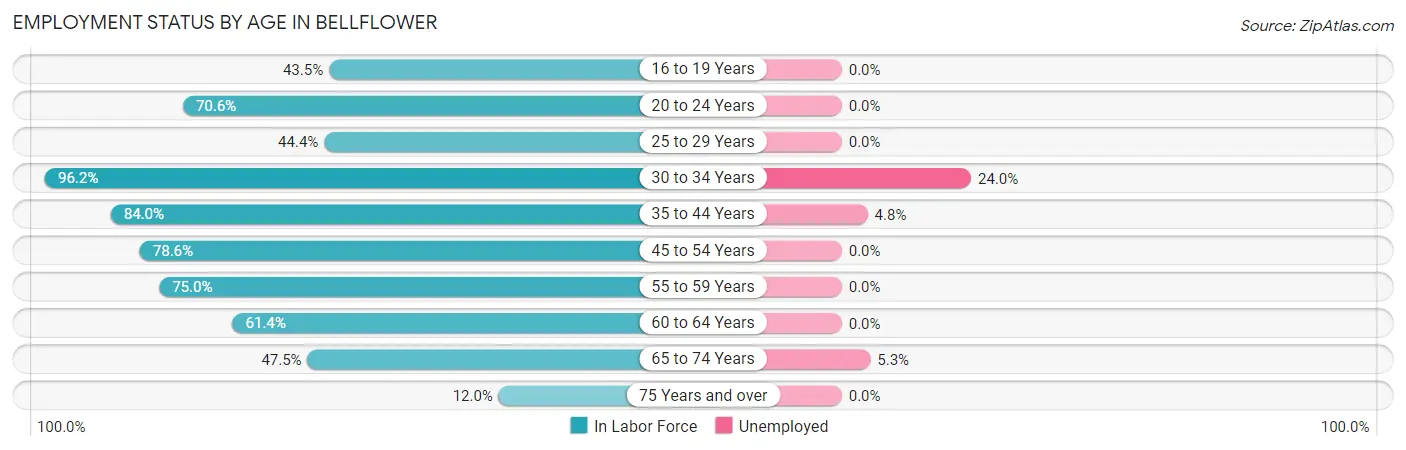
| Age Bracket | In Labor Force | Unemployed |
| 16 to 19 Years | 10 (43.5%) | 0 (0.0%) |
| 20 to 24 Years | 12 (70.6%) | 0 (0.0%) |
| 25 to 29 Years | 4 (44.4%) | 0 (0.0%) |
| 30 to 34 Years | 25 (96.2%) | 6 (24.0%) |
| 35 to 44 Years | 42 (84.0%) | 2 (4.8%) |
| 45 to 54 Years | 22 (78.6%) | 0 (0.0%) |
| 55 to 59 Years | 9 (75.0%) | 0 (0.0%) |
| 60 to 64 Years | 35 (61.4%) | 0 (0.0%) |
| 65 to 74 Years | 19 (47.5%) | 1 (5.3%) |
| 75 Years and over | 3 (12.0%) | 0 (0.0%) |
| Total | 181 (63.1%) | 9 (5.0%) |
Employment Status by Educational Attainment in Bellflower
According to labor force statistics for Bellflower, 75.3% of individuals (137) out of the total population between 25 and 64 years of age (182) are in the labor force, with 5.8% or 8 of them being unemployed. The group with the highest labor force participation rate are those with the educational attainment of college / associate degree, with 88.0% or 66 individuals in the labor force. Within the labor force, individuals with college / associate degree education have the highest percentage of unemployment, with 9.1% or 6 of them being unemployed.
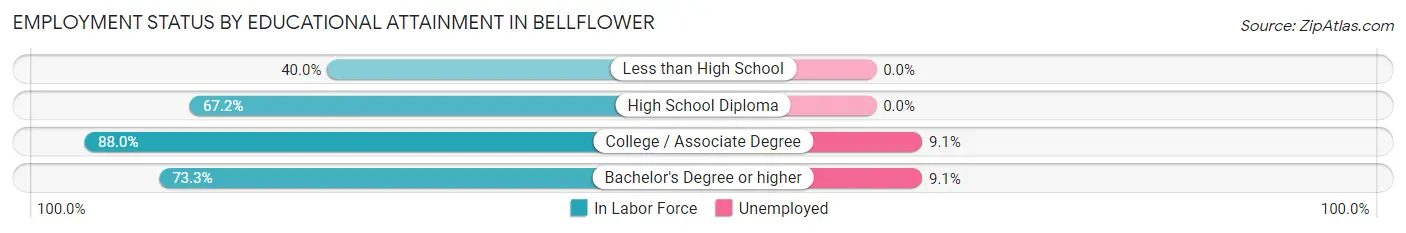
| Educational Attainment | In Labor Force | Unemployed |
| Less than High School | 4 (40.0%) | 0 (0.0%) |
| High School Diploma | 45 (67.2%) | 0 (0.0%) |
| College / Associate Degree | 66 (88.0%) | 7 (9.1%) |
| Bachelor's Degree or higher | 22 (73.3%) | 3 (9.1%) |
| Total | 137 (75.3%) | 11 (5.8%) |
Employment Occupations by Sex in Bellflower
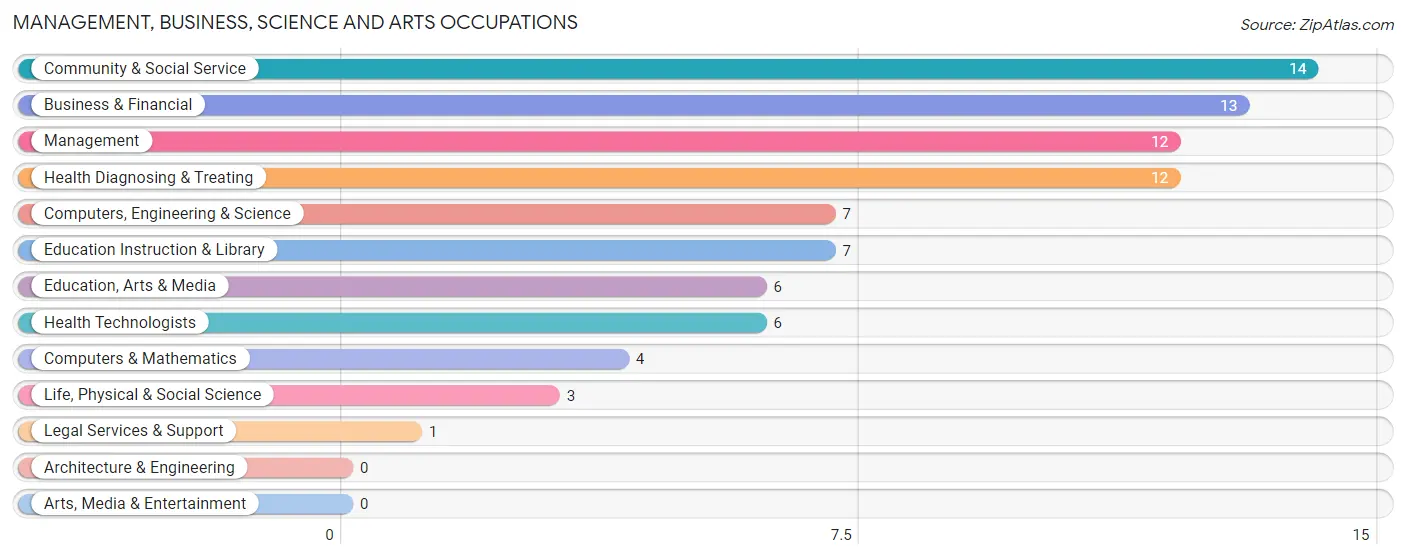
Management, Business, Science and Arts Occupations
The most common Management, Business, Science and Arts occupations in Bellflower are Community & Social Service (14 | 8.1%), Business & Financial (13 | 7.6%), Management (12 | 7.0%), Health Diagnosing & Treating (12 | 7.0%), and Computers, Engineering & Science (7 | 4.1%).
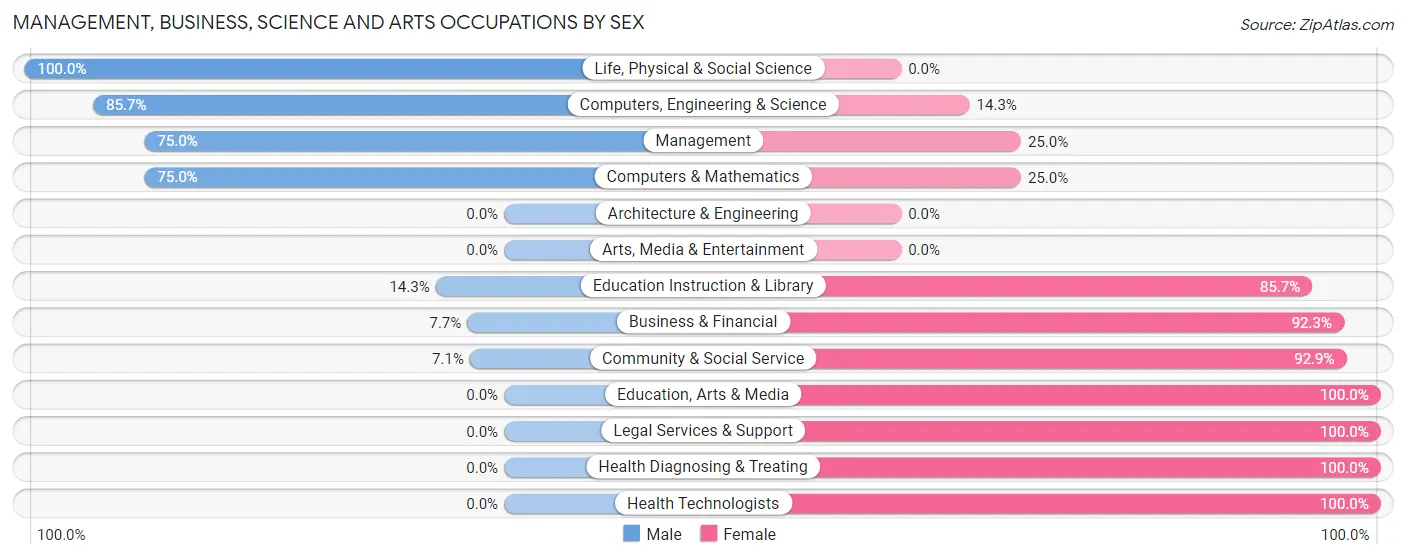
Management, Business, Science and Arts Occupations by Sex
Within the Management, Business, Science and Arts occupations in Bellflower, the most male-oriented occupations are Life, Physical & Social Science (100.0%), Computers, Engineering & Science (85.7%), and Management (75.0%), while the most female-oriented occupations are Education, Arts & Media (100.0%), Legal Services & Support (100.0%), and Health Diagnosing & Treating (100.0%).
| Occupation | Male | Female |
| Management | 9 (75.0%) | 3 (25.0%) |
| Business & Financial | 1 (7.7%) | 12 (92.3%) |
| Computers, Engineering & Science | 6 (85.7%) | 1 (14.3%) |
| Computers & Mathematics | 3 (75.0%) | 1 (25.0%) |
| Architecture & Engineering | 0 (0.0%) | 0 (0.0%) |
| Life, Physical & Social Science | 3 (100.0%) | 0 (0.0%) |
| Community & Social Service | 1 (7.1%) | 13 (92.9%) |
| Education, Arts & Media | 0 (0.0%) | 6 (100.0%) |
| Legal Services & Support | 0 (0.0%) | 1 (100.0%) |
| Education Instruction & Library | 1 (14.3%) | 6 (85.7%) |
| Arts, Media & Entertainment | 0 (0.0%) | 0 (0.0%) |
| Health Diagnosing & Treating | 0 (0.0%) | 12 (100.0%) |
| Health Technologists | 0 (0.0%) | 6 (100.0%) |
| Total (Category) | 17 (29.3%) | 41 (70.7%) |
| Total (Overall) | 82 (47.7%) | 90 (52.3%) |
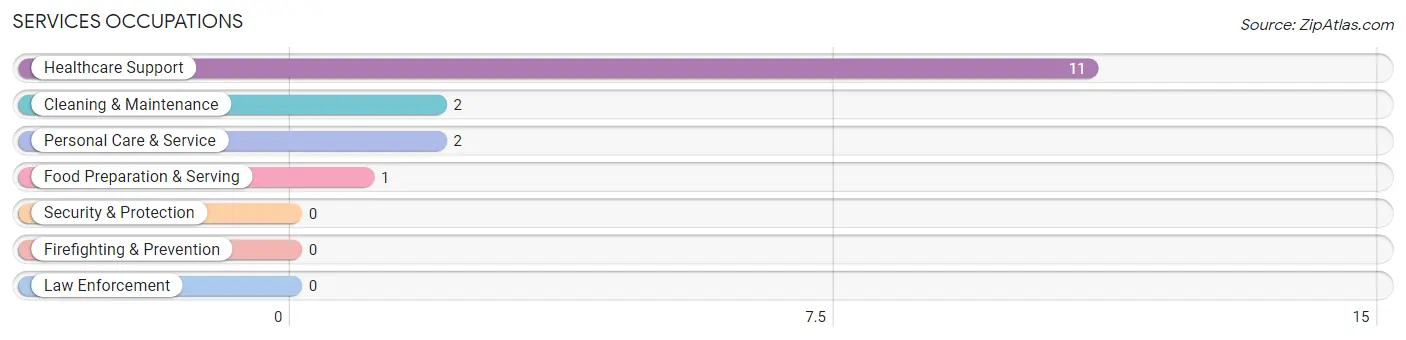
Services Occupations
The most common Services occupations in Bellflower are Healthcare Support (11 | 6.4%), Cleaning & Maintenance (2 | 1.2%), Personal Care & Service (2 | 1.2%), and Food Preparation & Serving (1 | 0.6%).
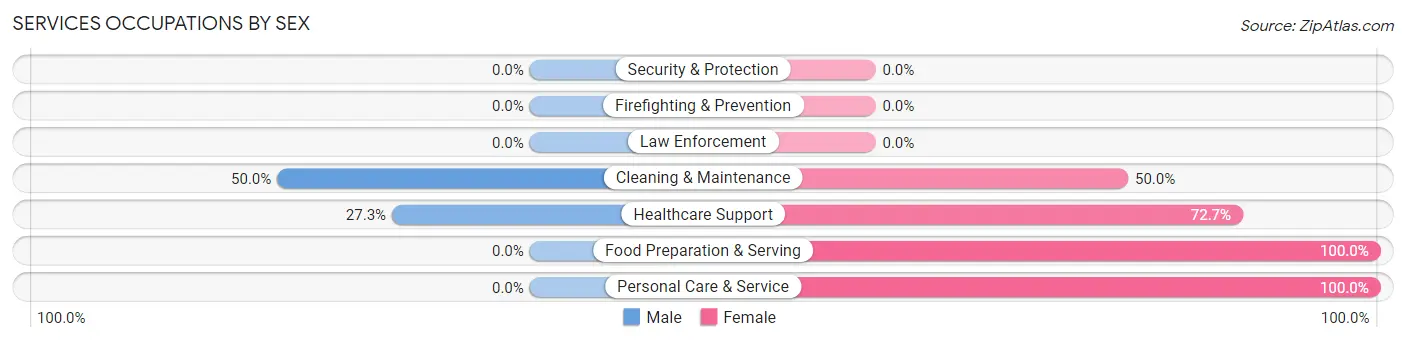
Services Occupations by Sex
Within the Services occupations in Bellflower, the most male-oriented occupations are Cleaning & Maintenance (50.0%), and Healthcare Support (27.3%), while the most female-oriented occupations are Food Preparation & Serving (100.0%), Personal Care & Service (100.0%), and Healthcare Support (72.7%).
| Occupation | Male | Female |
| Healthcare Support | 3 (27.3%) | 8 (72.7%) |
| Security & Protection | 0 (0.0%) | 0 (0.0%) |
| Firefighting & Prevention | 0 (0.0%) | 0 (0.0%) |
| Law Enforcement | 0 (0.0%) | 0 (0.0%) |
| Food Preparation & Serving | 0 (0.0%) | 1 (100.0%) |
| Cleaning & Maintenance | 1 (50.0%) | 1 (50.0%) |
| Personal Care & Service | 0 (0.0%) | 2 (100.0%) |
| Total (Category) | 4 (25.0%) | 12 (75.0%) |
| Total (Overall) | 82 (47.7%) | 90 (52.3%) |
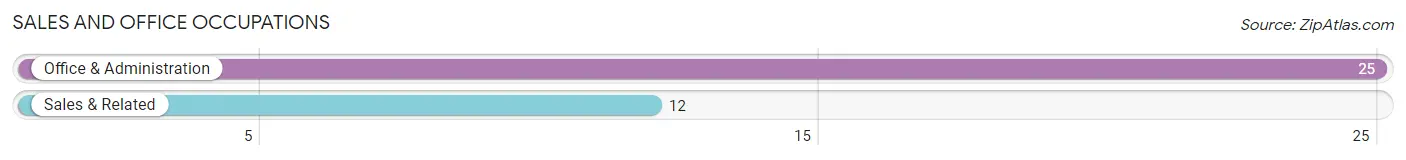
Sales and Office Occupations
The most common Sales and Office occupations in Bellflower are Office & Administration (25 | 14.5%), and Sales & Related (12 | 7.0%).
Sales and Office Occupations by Sex
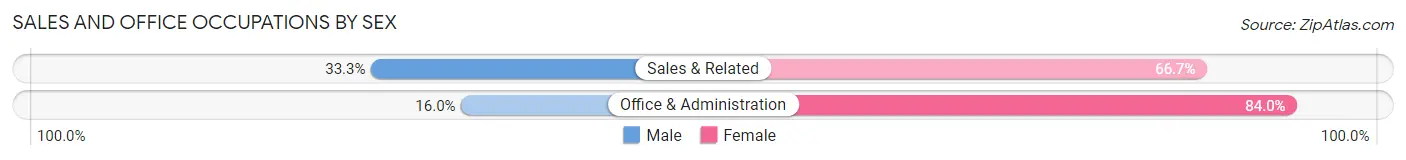
| Occupation | Male | Female |
| Sales & Related | 4 (33.3%) | 8 (66.7%) |
| Office & Administration | 4 (16.0%) | 21 (84.0%) |
| Total (Category) | 8 (21.6%) | 29 (78.4%) |
| Total (Overall) | 82 (47.7%) | 90 (52.3%) |
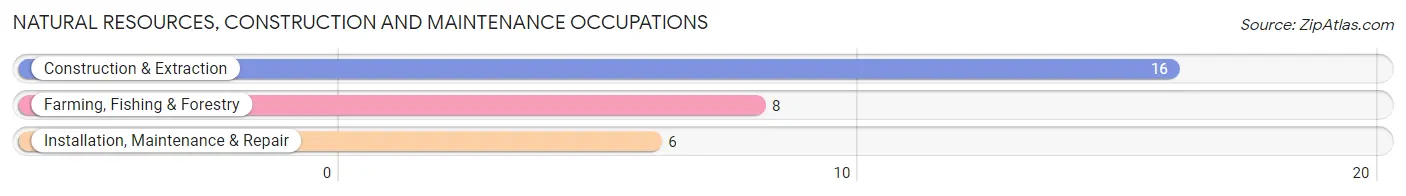
Natural Resources, Construction and Maintenance Occupations
The most common Natural Resources, Construction and Maintenance occupations in Bellflower are Construction & Extraction (16 | 9.3%), Farming, Fishing & Forestry (8 | 4.6%), and Installation, Maintenance & Repair (6 | 3.5%).
Natural Resources, Construction and Maintenance Occupations by Sex
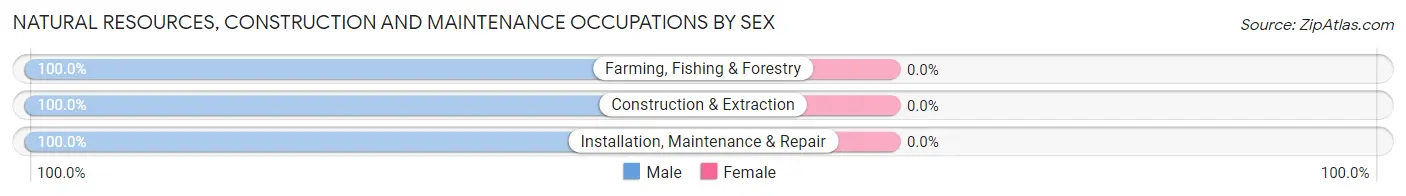
| Occupation | Male | Female |
| Farming, Fishing & Forestry | 8 (100.0%) | 0 (0.0%) |
| Construction & Extraction | 16 (100.0%) | 0 (0.0%) |
| Installation, Maintenance & Repair | 6 (100.0%) | 0 (0.0%) |
| Total (Category) | 30 (100.0%) | 0 (0.0%) |
| Total (Overall) | 82 (47.7%) | 90 (52.3%) |
Production, Transportation and Moving Occupations
The most common Production, Transportation and Moving occupations in Bellflower are Material Moving (13 | 7.6%), Transportation (12 | 7.0%), and Production (6 | 3.5%).
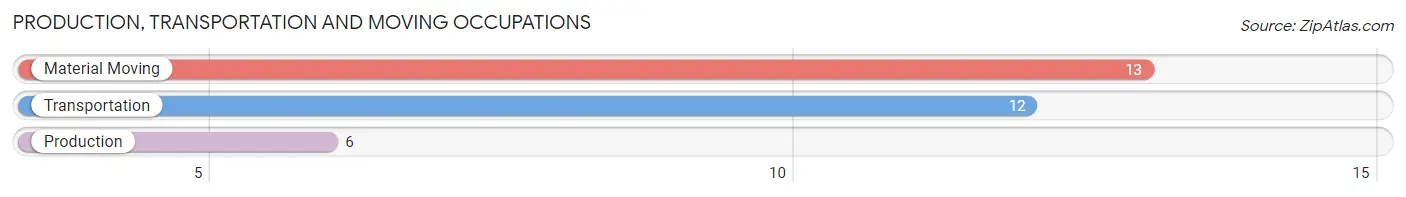
Production, Transportation and Moving Occupations by Sex
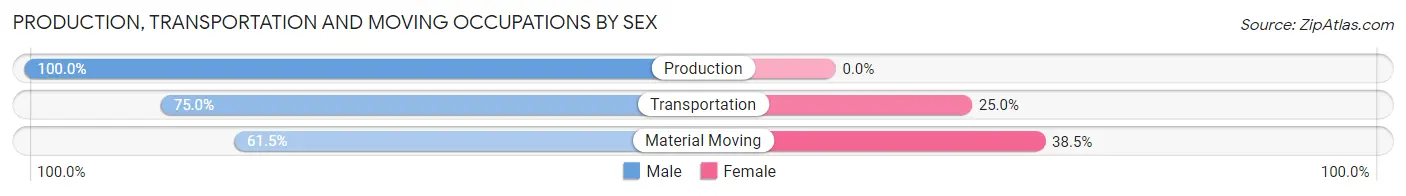
| Occupation | Male | Female |
| Production | 6 (100.0%) | 0 (0.0%) |
| Transportation | 9 (75.0%) | 3 (25.0%) |
| Material Moving | 8 (61.5%) | 5 (38.5%) |
| Total (Category) | 23 (74.2%) | 8 (25.8%) |
| Total (Overall) | 82 (47.7%) | 90 (52.3%) |
Employment Industries by Sex in Bellflower
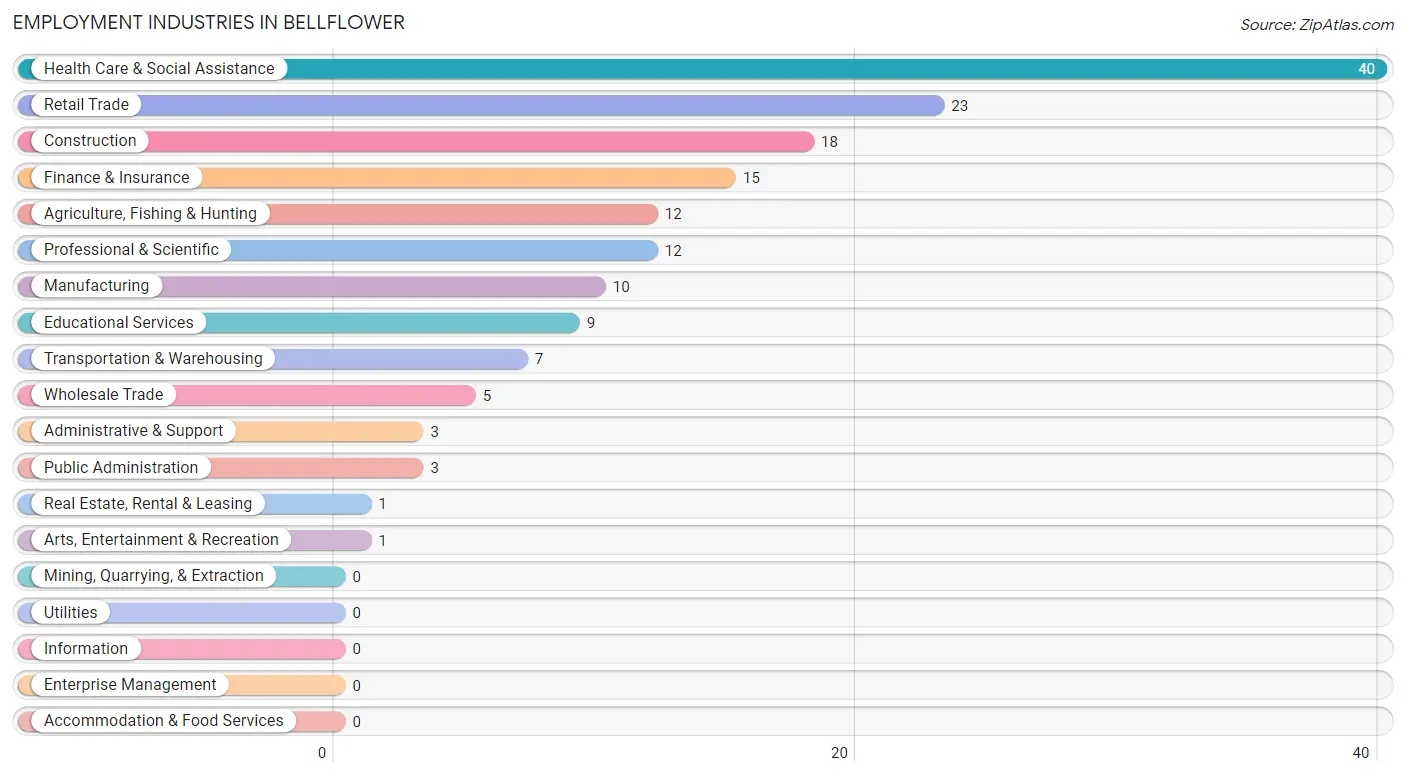
Employment Industries in Bellflower
The major employment industries in Bellflower include Health Care & Social Assistance (40 | 23.3%), Retail Trade (23 | 13.4%), Construction (18 | 10.5%), Finance & Insurance (15 | 8.7%), and Agriculture, Fishing & Hunting (12 | 7.0%).
Employment Industries by Sex in Bellflower
The Bellflower industries that see more men than women are Agriculture, Fishing & Hunting (100.0%), Construction (100.0%), and Manufacturing (100.0%), whereas the industries that tend to have a higher number of women are Wholesale Trade (100.0%), Arts, Entertainment & Recreation (100.0%), and Finance & Insurance (80.0%).
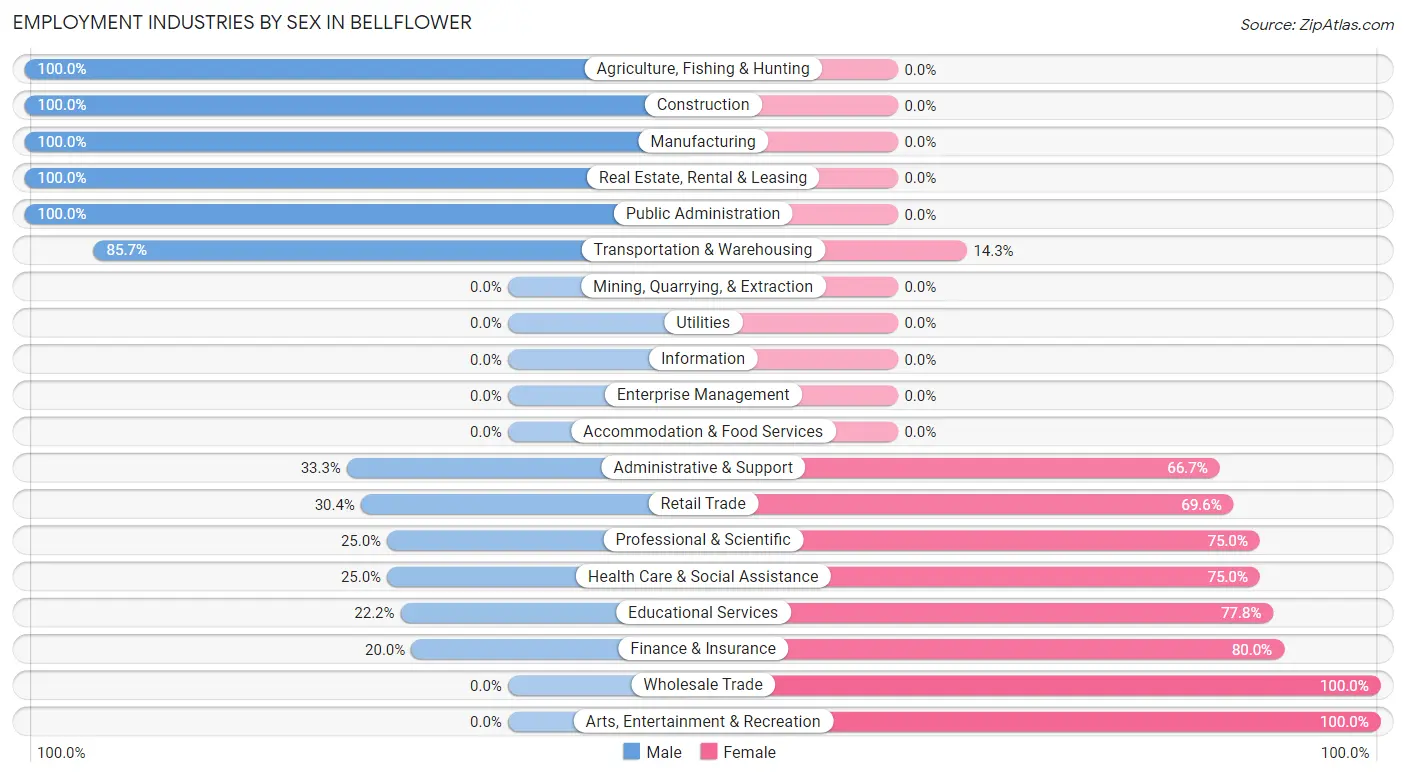
| Industry | Male | Female |
| Agriculture, Fishing & Hunting | 12 (100.0%) | 0 (0.0%) |
| Mining, Quarrying, & Extraction | 0 (0.0%) | 0 (0.0%) |
| Construction | 18 (100.0%) | 0 (0.0%) |
| Manufacturing | 10 (100.0%) | 0 (0.0%) |
| Wholesale Trade | 0 (0.0%) | 5 (100.0%) |
| Retail Trade | 7 (30.4%) | 16 (69.6%) |
| Transportation & Warehousing | 6 (85.7%) | 1 (14.3%) |
| Utilities | 0 (0.0%) | 0 (0.0%) |
| Information | 0 (0.0%) | 0 (0.0%) |
| Finance & Insurance | 3 (20.0%) | 12 (80.0%) |
| Real Estate, Rental & Leasing | 1 (100.0%) | 0 (0.0%) |
| Professional & Scientific | 3 (25.0%) | 9 (75.0%) |
| Enterprise Management | 0 (0.0%) | 0 (0.0%) |
| Administrative & Support | 1 (33.3%) | 2 (66.7%) |
| Educational Services | 2 (22.2%) | 7 (77.8%) |
| Health Care & Social Assistance | 10 (25.0%) | 30 (75.0%) |
| Arts, Entertainment & Recreation | 0 (0.0%) | 1 (100.0%) |
| Accommodation & Food Services | 0 (0.0%) | 0 (0.0%) |
| Public Administration | 3 (100.0%) | 0 (0.0%) |
| Total | 82 (47.7%) | 90 (52.3%) |
Education in Bellflower
School Enrollment in Bellflower
The most common levels of schooling among the 108 students in Bellflower are middle school (28 | 25.9%), high school (27 | 25.0%), and elementary school (21 | 19.4%).
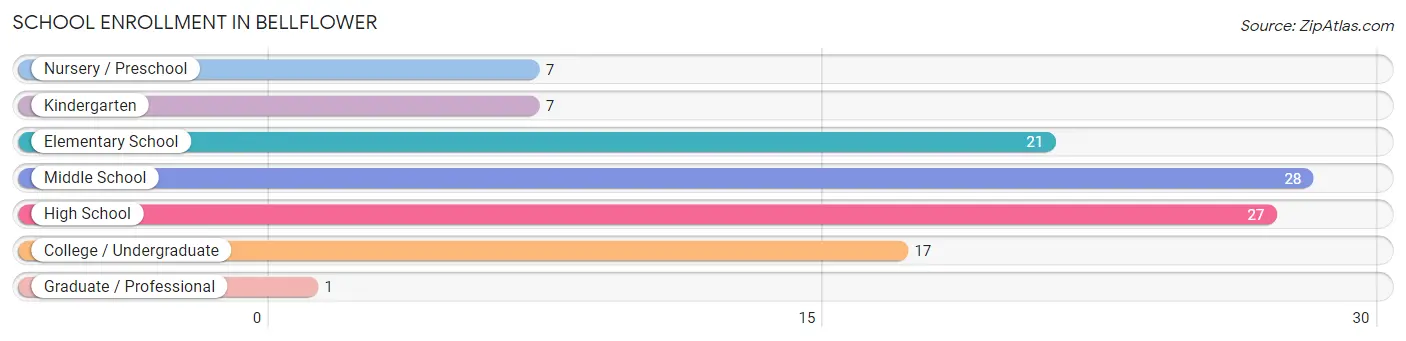
| School Level | # Students | % Students |
| Nursery / Preschool | 7 | 6.5% |
| Kindergarten | 7 | 6.5% |
| Elementary School | 21 | 19.4% |
| Middle School | 28 | 25.9% |
| High School | 27 | 25.0% |
| College / Undergraduate | 17 | 15.7% |
| Graduate / Professional | 1 | 0.9% |
| Total | 108 | 100.0% |
School Enrollment by Age by Funding Source in Bellflower
Out of a total of 108 students who are enrolled in schools in Bellflower, 19 (17.6%) attend a private institution, while the remaining 89 (82.4%) are enrolled in public schools. The age group of 10 to 14 year olds has the highest likelihood of being enrolled in private schools, with 12 (29.3% in the age bracket) enrolled. Conversely, the age group of 3 to 4 year olds has the lowest likelihood of being enrolled in a private school, with 2 (100.0% in the age bracket) attending a public institution.
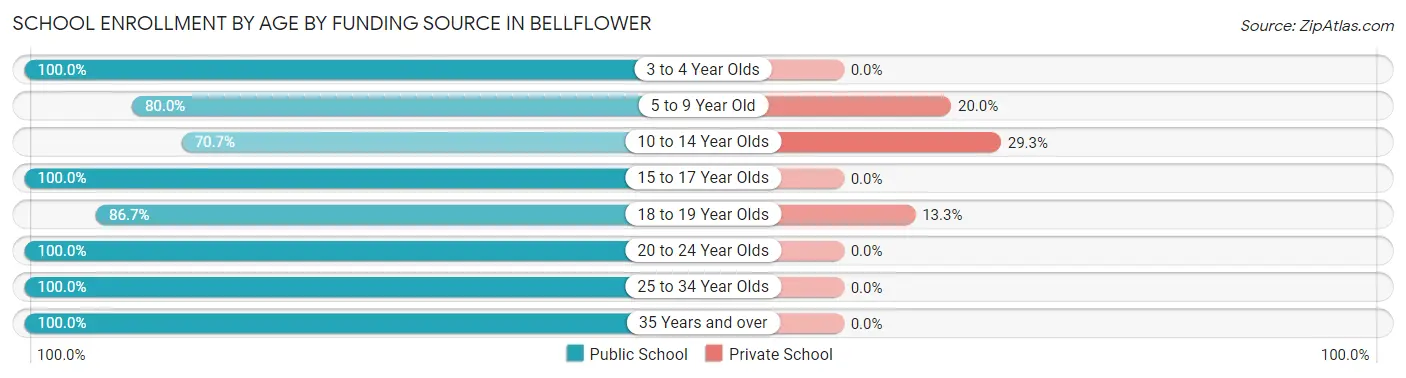
| Age Bracket | Public School | Private School |
| 3 to 4 Year Olds | 2 (100.0%) | 0 (0.0%) |
| 5 to 9 Year Old | 20 (80.0%) | 5 (20.0%) |
| 10 to 14 Year Olds | 29 (70.7%) | 12 (29.3%) |
| 15 to 17 Year Olds | 14 (100.0%) | 0 (0.0%) |
| 18 to 19 Year Olds | 13 (86.7%) | 2 (13.3%) |
| 20 to 24 Year Olds | 2 (100.0%) | 0 (0.0%) |
| 25 to 34 Year Olds | 7 (100.0%) | 0 (0.0%) |
| 35 Years and over | 2 (100.0%) | 0 (0.0%) |
| Total | 89 (82.4%) | 19 (17.6%) |
Educational Attainment by Field of Study in Bellflower
Arts & humanities (13 | 32.5%), bio, nature & agricultural (9 | 22.5%), science & technology (5 | 12.5%), education (4 | 10.0%), and business (3 | 7.5%) are the most common fields of study among 40 individuals in Bellflower who have obtained a bachelor's degree or higher.
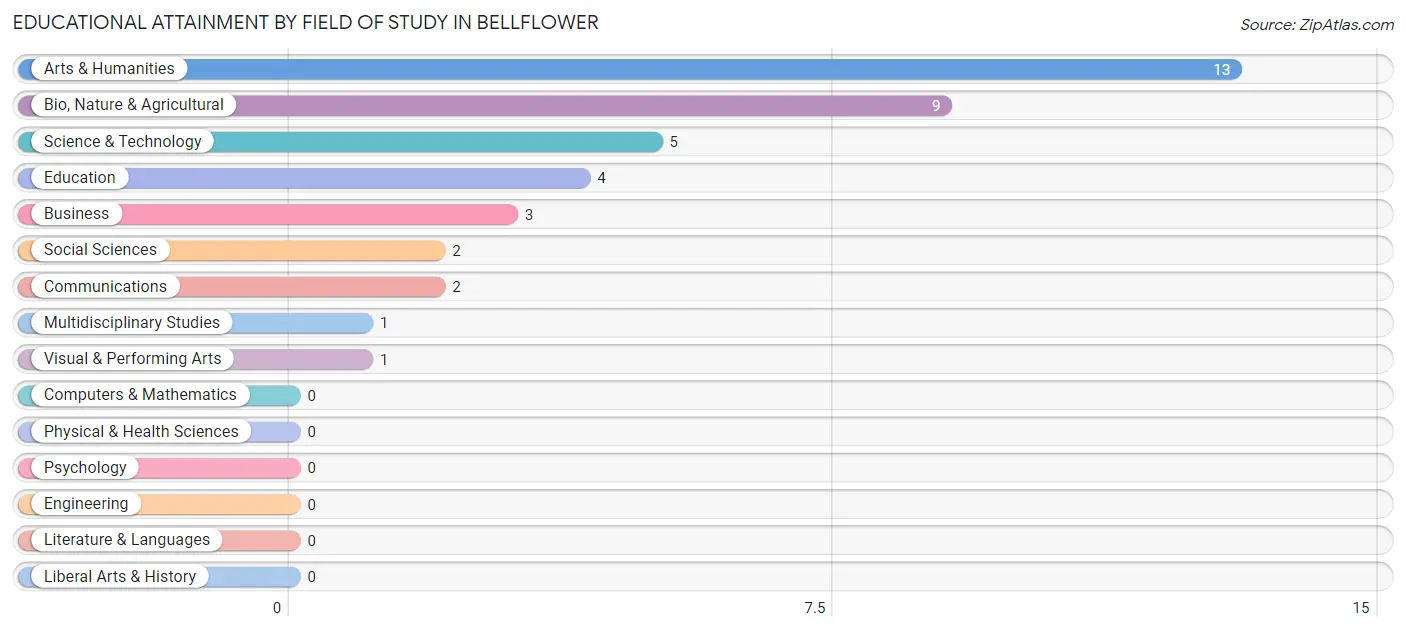
| Field of Study | # Graduates | % Graduates |
| Computers & Mathematics | 0 | 0.0% |
| Bio, Nature & Agricultural | 9 | 22.5% |
| Physical & Health Sciences | 0 | 0.0% |
| Psychology | 0 | 0.0% |
| Social Sciences | 2 | 5.0% |
| Engineering | 0 | 0.0% |
| Multidisciplinary Studies | 1 | 2.5% |
| Science & Technology | 5 | 12.5% |
| Business | 3 | 7.5% |
| Education | 4 | 10.0% |
| Literature & Languages | 0 | 0.0% |
| Liberal Arts & History | 0 | 0.0% |
| Visual & Performing Arts | 1 | 2.5% |
| Communications | 2 | 5.0% |
| Arts & Humanities | 13 | 32.5% |
| Total | 40 | 100.0% |
Transportation & Commute in Bellflower
Vehicle Availability by Sex in Bellflower
The most prevalent vehicle ownership categories in Bellflower are males with 1 vehicle (23, accounting for 28.1%) and females with 1 vehicle (13, making up 27.4%).
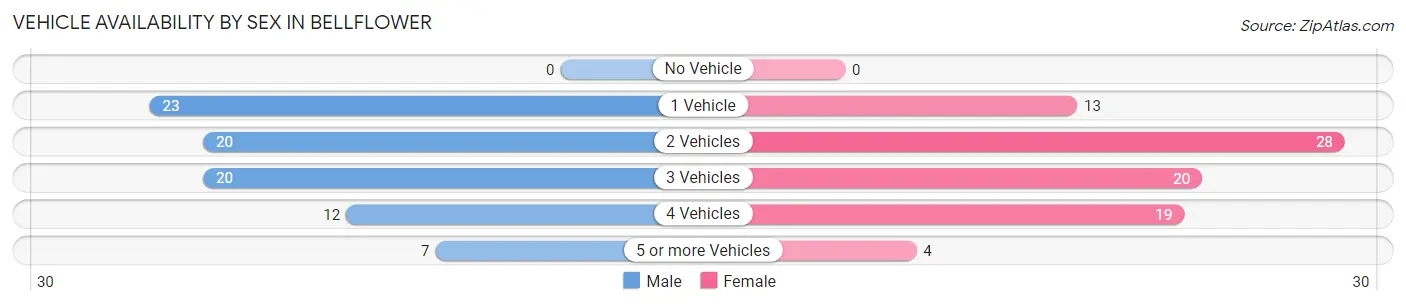
| Vehicles Available | Male | Female |
| No Vehicle | 0 (0.0%) | 0 (0.0%) |
| 1 Vehicle | 23 (28.1%) | 13 (15.5%) |
| 2 Vehicles | 20 (24.4%) | 28 (33.3%) |
| 3 Vehicles | 20 (24.4%) | 20 (23.8%) |
| 4 Vehicles | 12 (14.6%) | 19 (22.6%) |
| 5 or more Vehicles | 7 (8.5%) | 4 (4.8%) |
| Total | 82 (100.0%) | 84 (100.0%) |
Commute Time in Bellflower
The most frequently occuring commute durations in Bellflower are 30 to 34 minutes (49 commuters, 31.0%), 15 to 19 minutes (23 commuters, 14.6%), and 20 to 24 minutes (17 commuters, 10.8%).
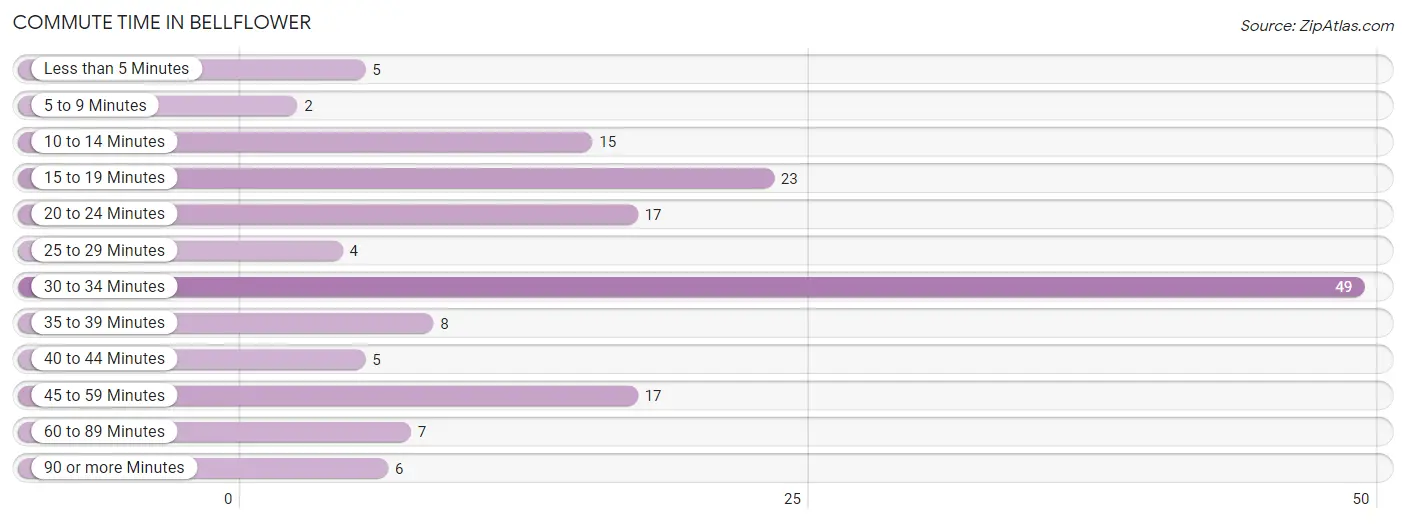
| Commute Time | # Commuters | % Commuters |
| Less than 5 Minutes | 5 | 3.2% |
| 5 to 9 Minutes | 2 | 1.3% |
| 10 to 14 Minutes | 15 | 9.5% |
| 15 to 19 Minutes | 23 | 14.6% |
| 20 to 24 Minutes | 17 | 10.8% |
| 25 to 29 Minutes | 4 | 2.5% |
| 30 to 34 Minutes | 49 | 31.0% |
| 35 to 39 Minutes | 8 | 5.1% |
| 40 to 44 Minutes | 5 | 3.2% |
| 45 to 59 Minutes | 17 | 10.8% |
| 60 to 89 Minutes | 7 | 4.4% |
| 90 or more Minutes | 6 | 3.8% |
Commute Time by Sex in Bellflower
The most common commute times in Bellflower are 30 to 34 minutes (29 commuters, 36.7%) for males and 30 to 34 minutes (20 commuters, 25.3%) for females.
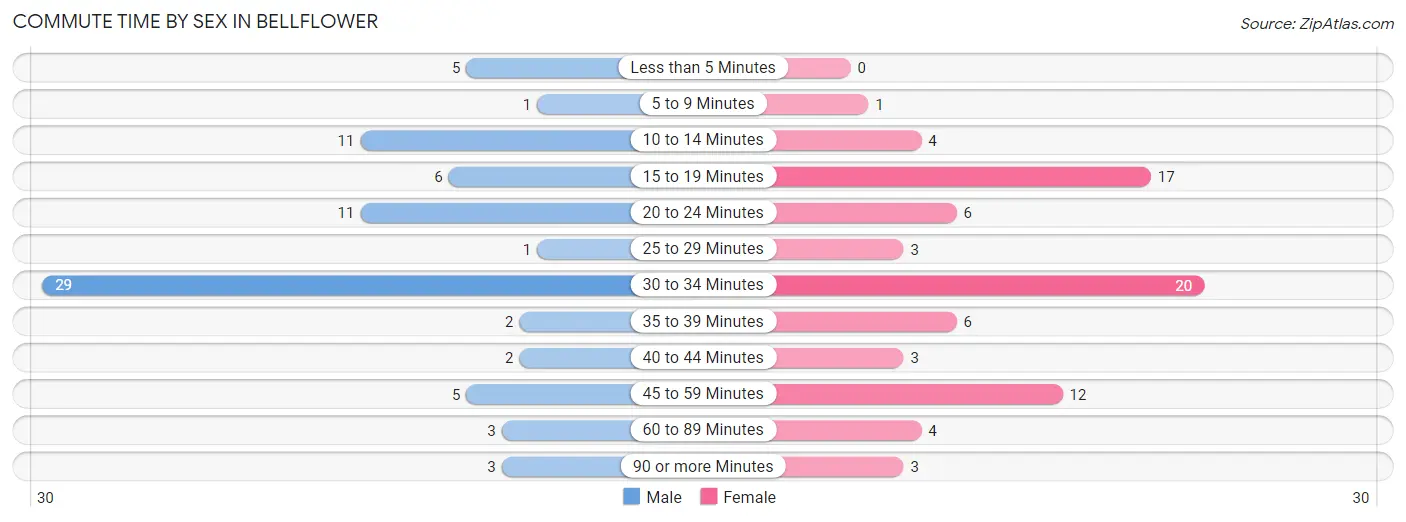
| Commute Time | Male | Female |
| Less than 5 Minutes | 5 (6.3%) | 0 (0.0%) |
| 5 to 9 Minutes | 1 (1.3%) | 1 (1.3%) |
| 10 to 14 Minutes | 11 (13.9%) | 4 (5.1%) |
| 15 to 19 Minutes | 6 (7.6%) | 17 (21.5%) |
| 20 to 24 Minutes | 11 (13.9%) | 6 (7.6%) |
| 25 to 29 Minutes | 1 (1.3%) | 3 (3.8%) |
| 30 to 34 Minutes | 29 (36.7%) | 20 (25.3%) |
| 35 to 39 Minutes | 2 (2.5%) | 6 (7.6%) |
| 40 to 44 Minutes | 2 (2.5%) | 3 (3.8%) |
| 45 to 59 Minutes | 5 (6.3%) | 12 (15.2%) |
| 60 to 89 Minutes | 3 (3.8%) | 4 (5.1%) |
| 90 or more Minutes | 3 (3.8%) | 3 (3.8%) |
Time of Departure to Work by Sex in Bellflower
The most frequent times of departure to work in Bellflower are 7:00 AM to 7:29 AM (31, 39.2%) for males and 7:00 AM to 7:29 AM (22, 27.9%) for females.
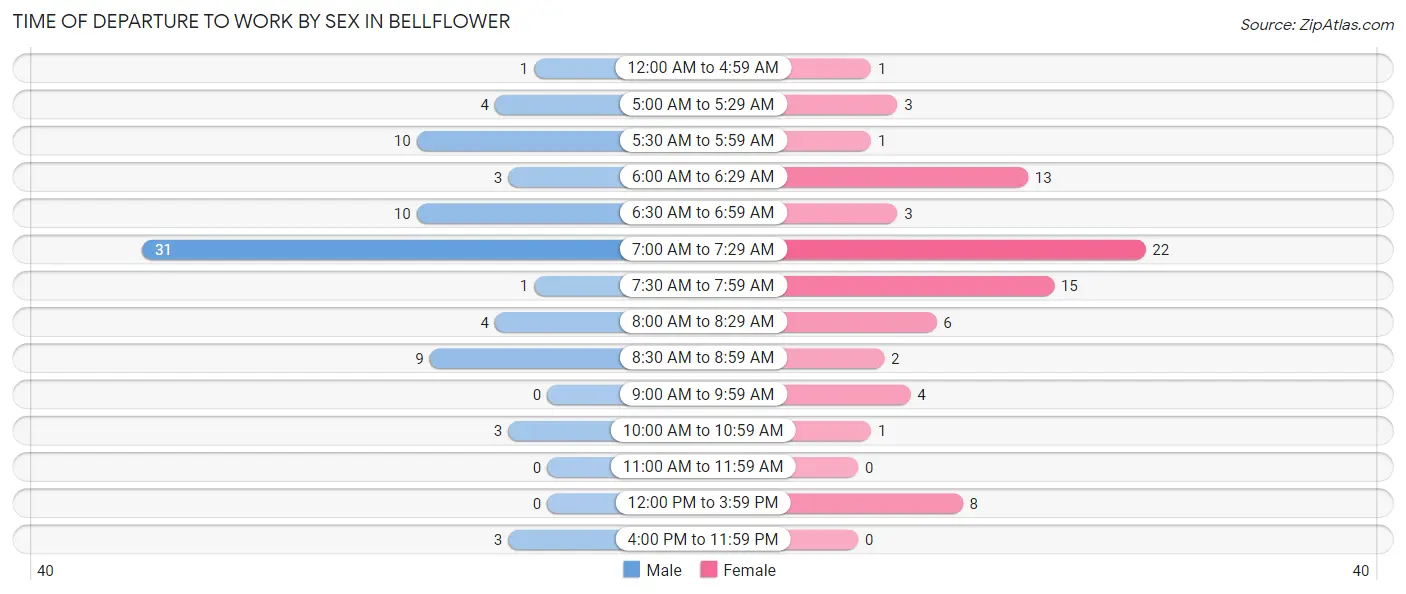
| Time of Departure | Male | Female |
| 12:00 AM to 4:59 AM | 1 (1.3%) | 1 (1.3%) |
| 5:00 AM to 5:29 AM | 4 (5.1%) | 3 (3.8%) |
| 5:30 AM to 5:59 AM | 10 (12.7%) | 1 (1.3%) |
| 6:00 AM to 6:29 AM | 3 (3.8%) | 13 (16.5%) |
| 6:30 AM to 6:59 AM | 10 (12.7%) | 3 (3.8%) |
| 7:00 AM to 7:29 AM | 31 (39.2%) | 22 (27.9%) |
| 7:30 AM to 7:59 AM | 1 (1.3%) | 15 (19.0%) |
| 8:00 AM to 8:29 AM | 4 (5.1%) | 6 (7.6%) |
| 8:30 AM to 8:59 AM | 9 (11.4%) | 2 (2.5%) |
| 9:00 AM to 9:59 AM | 0 (0.0%) | 4 (5.1%) |
| 10:00 AM to 10:59 AM | 3 (3.8%) | 1 (1.3%) |
| 11:00 AM to 11:59 AM | 0 (0.0%) | 0 (0.0%) |
| 12:00 PM to 3:59 PM | 0 (0.0%) | 8 (10.1%) |
| 4:00 PM to 11:59 PM | 3 (3.8%) | 0 (0.0%) |
| Total | 79 (100.0%) | 79 (100.0%) |
Housing Occupancy in Bellflower
Occupancy by Ownership in Bellflower
Of the total 141 dwellings in Bellflower, owner-occupied units account for 129 (91.5%), while renter-occupied units make up 12 (8.5%).
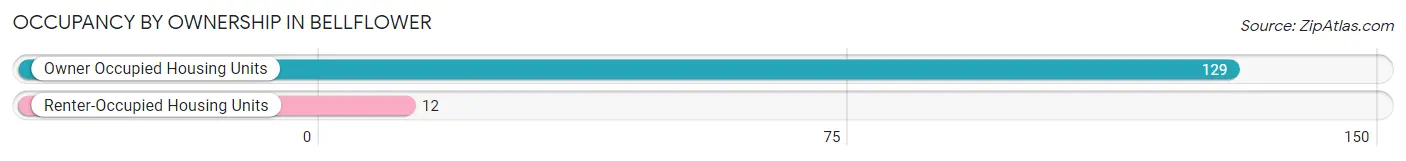
| Occupancy | # Housing Units | % Housing Units |
| Owner Occupied Housing Units | 129 | 91.5% |
| Renter-Occupied Housing Units | 12 | 8.5% |
| Total Occupied Housing Units | 141 | 100.0% |
Occupancy by Household Size in Bellflower
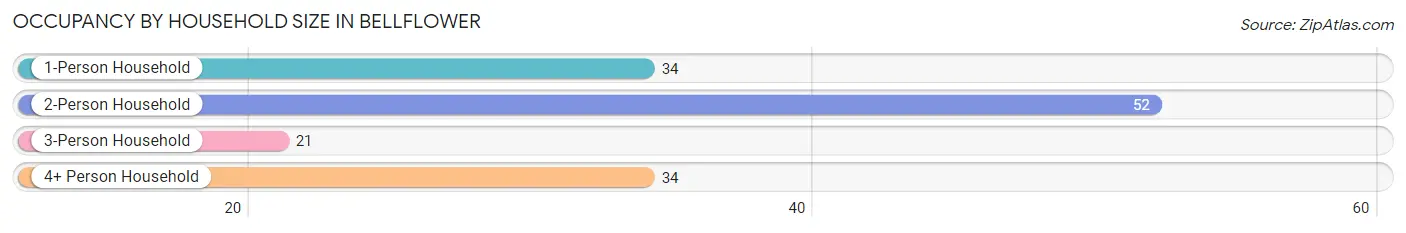
| Household Size | # Housing Units | % Housing Units |
| 1-Person Household | 34 | 24.1% |
| 2-Person Household | 52 | 36.9% |
| 3-Person Household | 21 | 14.9% |
| 4+ Person Household | 34 | 24.1% |
| Total Housing Units | 141 | 100.0% |
Occupancy by Ownership by Household Size in Bellflower
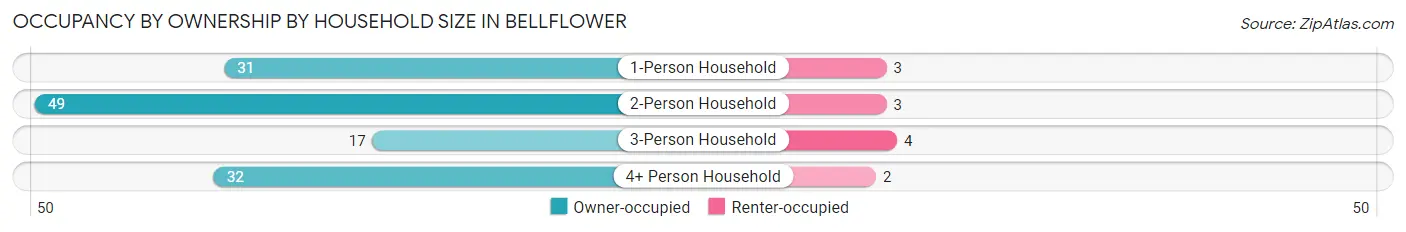
| Household Size | Owner-occupied | Renter-occupied |
| 1-Person Household | 31 (91.2%) | 3 (8.8%) |
| 2-Person Household | 49 (94.2%) | 3 (5.8%) |
| 3-Person Household | 17 (80.9%) | 4 (19.1%) |
| 4+ Person Household | 32 (94.1%) | 2 (5.9%) |
| Total Housing Units | 129 (91.5%) | 12 (8.5%) |
Occupancy by Educational Attainment in Bellflower
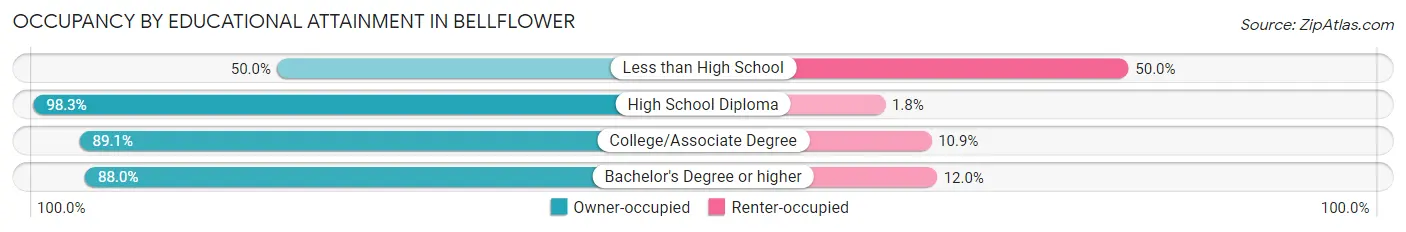
| Household Size | Owner-occupied | Renter-occupied |
| Less than High School | 2 (50.0%) | 2 (50.0%) |
| High School Diploma | 56 (98.3%) | 1 (1.8%) |
| College/Associate Degree | 49 (89.1%) | 6 (10.9%) |
| Bachelor's Degree or higher | 22 (88.0%) | 3 (12.0%) |
Occupancy by Age of Householder in Bellflower
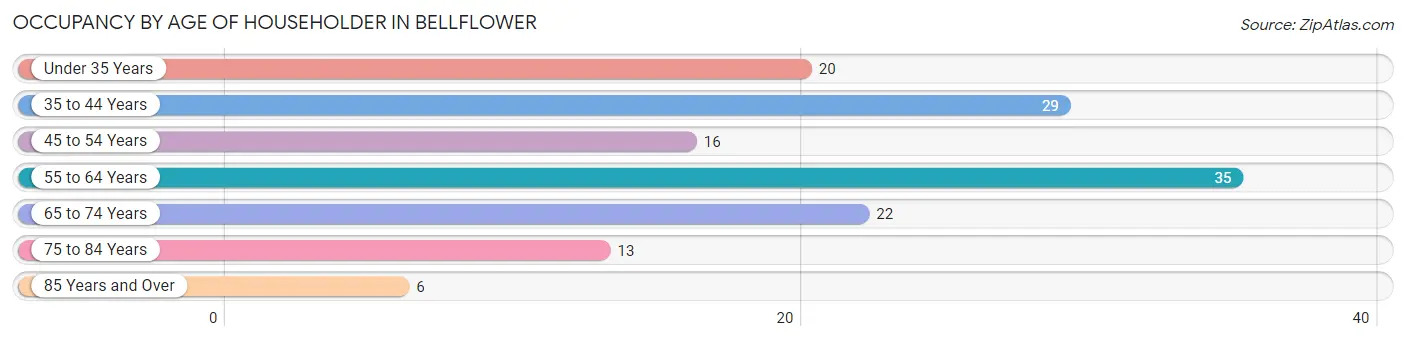
| Age Bracket | # Households | % Households |
| Under 35 Years | 20 | 14.2% |
| 35 to 44 Years | 29 | 20.6% |
| 45 to 54 Years | 16 | 11.4% |
| 55 to 64 Years | 35 | 24.8% |
| 65 to 74 Years | 22 | 15.6% |
| 75 to 84 Years | 13 | 9.2% |
| 85 Years and Over | 6 | 4.3% |
| Total | 141 | 100.0% |
Housing Finances in Bellflower
Median Income by Occupancy in Bellflower
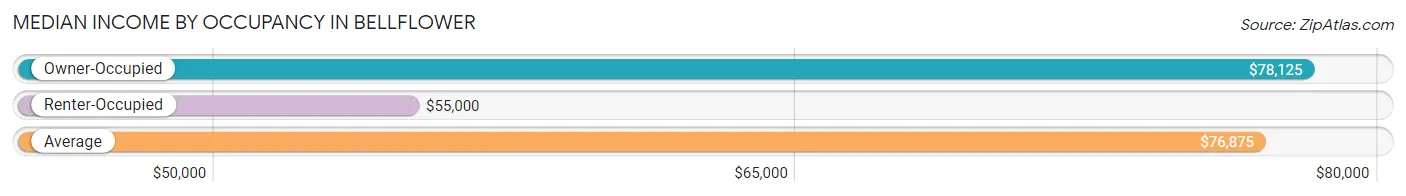
| Occupancy Type | # Households | Median Income |
| Owner-Occupied | 129 (91.5%) | $78,125 |
| Renter-Occupied | 12 (8.5%) | $55,000 |
| Average | 141 (100.0%) | $76,875 |
Occupancy by Householder Income Bracket in Bellflower
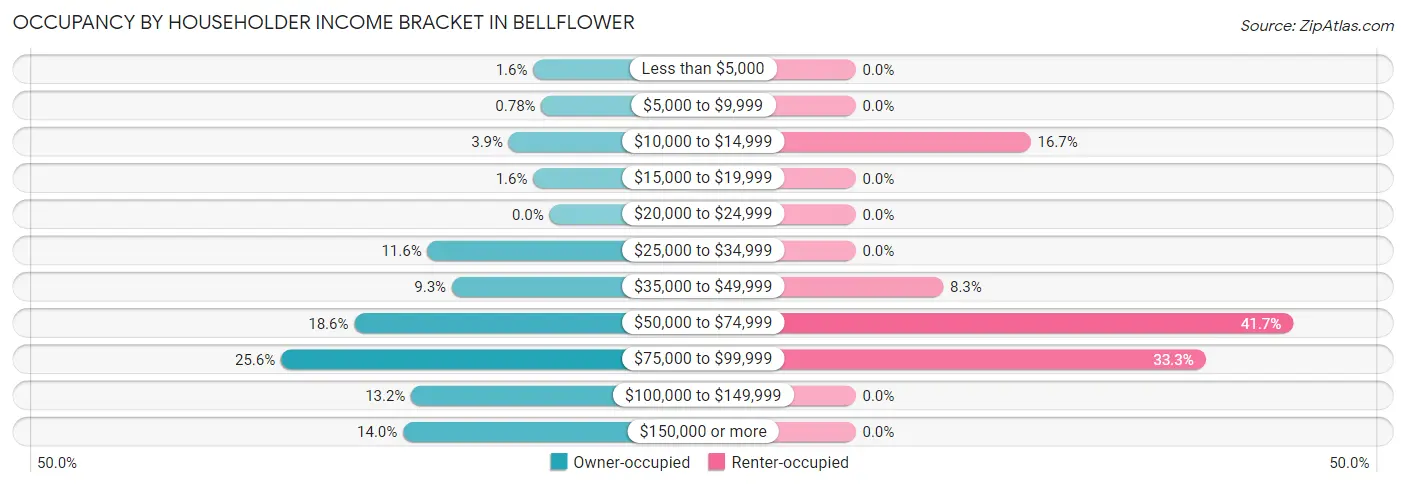
| Income Bracket | Owner-occupied | Renter-occupied |
| Less than $5,000 | 2 (1.5%) | 0 (0.0%) |
| $5,000 to $9,999 | 1 (0.8%) | 0 (0.0%) |
| $10,000 to $14,999 | 5 (3.9%) | 2 (16.7%) |
| $15,000 to $19,999 | 2 (1.5%) | 0 (0.0%) |
| $20,000 to $24,999 | 0 (0.0%) | 0 (0.0%) |
| $25,000 to $34,999 | 15 (11.6%) | 0 (0.0%) |
| $35,000 to $49,999 | 12 (9.3%) | 1 (8.3%) |
| $50,000 to $74,999 | 24 (18.6%) | 5 (41.7%) |
| $75,000 to $99,999 | 33 (25.6%) | 4 (33.3%) |
| $100,000 to $149,999 | 17 (13.2%) | 0 (0.0%) |
| $150,000 or more | 18 (14.0%) | 0 (0.0%) |
| Total | 129 (100.0%) | 12 (100.0%) |
Monthly Housing Cost Tiers in Bellflower
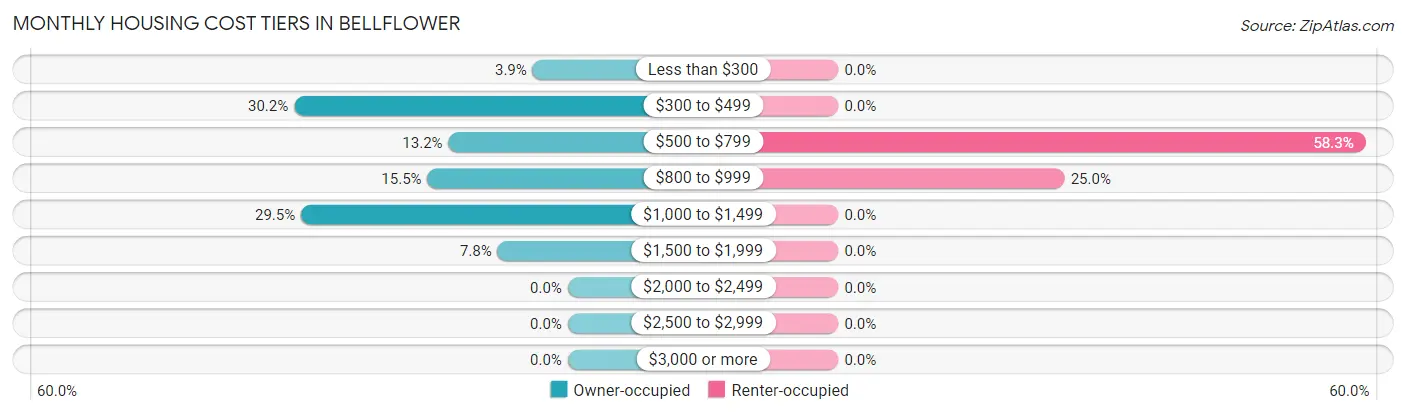
| Monthly Cost | Owner-occupied | Renter-occupied |
| Less than $300 | 5 (3.9%) | 0 (0.0%) |
| $300 to $499 | 39 (30.2%) | 0 (0.0%) |
| $500 to $799 | 17 (13.2%) | 7 (58.3%) |
| $800 to $999 | 20 (15.5%) | 3 (25.0%) |
| $1,000 to $1,499 | 38 (29.5%) | 0 (0.0%) |
| $1,500 to $1,999 | 10 (7.7%) | 0 (0.0%) |
| $2,000 to $2,499 | 0 (0.0%) | 0 (0.0%) |
| $2,500 to $2,999 | 0 (0.0%) | 0 (0.0%) |
| $3,000 or more | 0 (0.0%) | 0 (0.0%) |
| Total | 129 (100.0%) | 12 (100.0%) |
Physical Housing Characteristics in Bellflower
Housing Structures in Bellflower
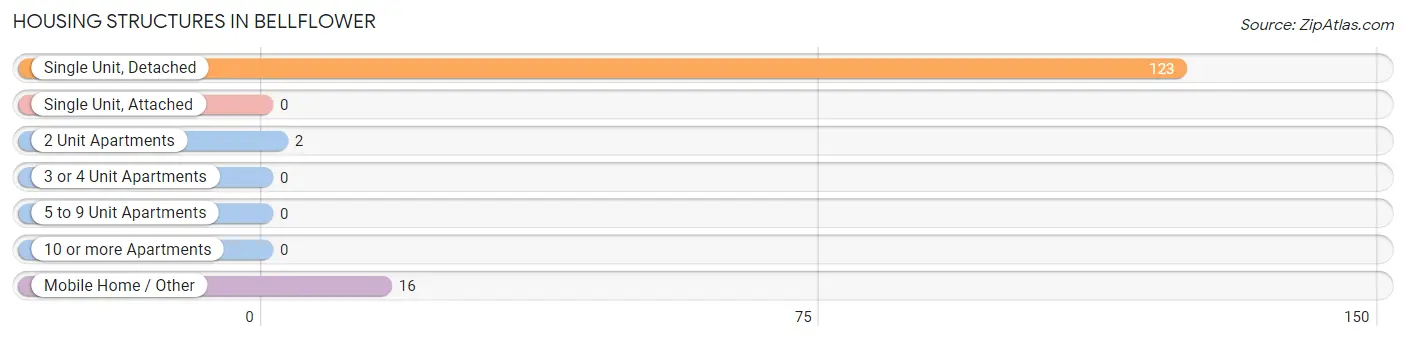
| Structure Type | # Housing Units | % Housing Units |
| Single Unit, Detached | 123 | 87.2% |
| Single Unit, Attached | 0 | 0.0% |
| 2 Unit Apartments | 2 | 1.4% |
| 3 or 4 Unit Apartments | 0 | 0.0% |
| 5 to 9 Unit Apartments | 0 | 0.0% |
| 10 or more Apartments | 0 | 0.0% |
| Mobile Home / Other | 16 | 11.4% |
| Total | 141 | 100.0% |
Housing Structures by Occupancy in Bellflower
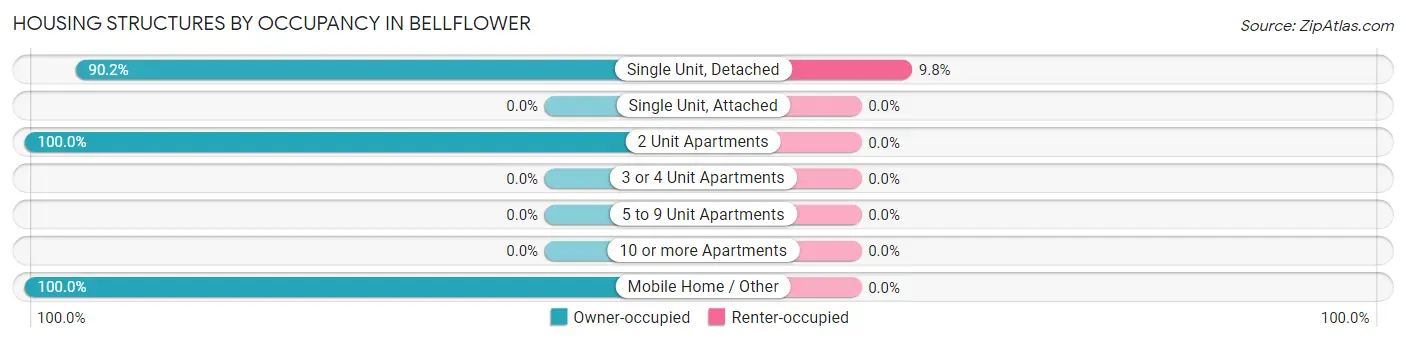
| Structure Type | Owner-occupied | Renter-occupied |
| Single Unit, Detached | 111 (90.2%) | 12 (9.8%) |
| Single Unit, Attached | 0 (0.0%) | 0 (0.0%) |
| 2 Unit Apartments | 2 (100.0%) | 0 (0.0%) |
| 3 or 4 Unit Apartments | 0 (0.0%) | 0 (0.0%) |
| 5 to 9 Unit Apartments | 0 (0.0%) | 0 (0.0%) |
| 10 or more Apartments | 0 (0.0%) | 0 (0.0%) |
| Mobile Home / Other | 16 (100.0%) | 0 (0.0%) |
| Total | 129 (91.5%) | 12 (8.5%) |
Housing Structures by Number of Rooms in Bellflower
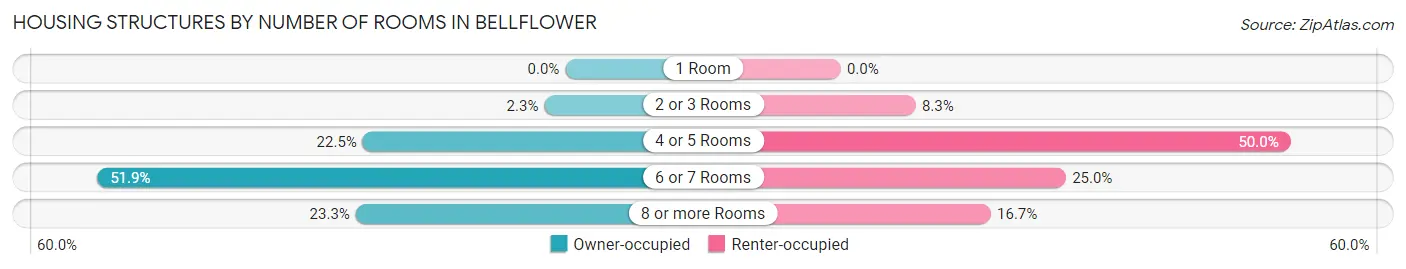
| Number of Rooms | Owner-occupied | Renter-occupied |
| 1 Room | 0 (0.0%) | 0 (0.0%) |
| 2 or 3 Rooms | 3 (2.3%) | 1 (8.3%) |
| 4 or 5 Rooms | 29 (22.5%) | 6 (50.0%) |
| 6 or 7 Rooms | 67 (51.9%) | 3 (25.0%) |
| 8 or more Rooms | 30 (23.3%) | 2 (16.7%) |
| Total | 129 (100.0%) | 12 (100.0%) |
Housing Structure by Heating Type in Bellflower
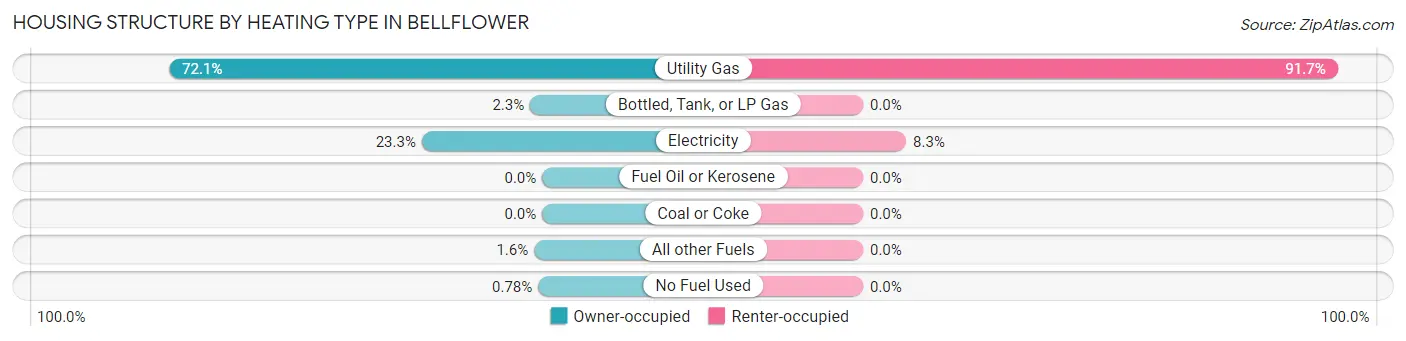
| Heating Type | Owner-occupied | Renter-occupied |
| Utility Gas | 93 (72.1%) | 11 (91.7%) |
| Bottled, Tank, or LP Gas | 3 (2.3%) | 0 (0.0%) |
| Electricity | 30 (23.3%) | 1 (8.3%) |
| Fuel Oil or Kerosene | 0 (0.0%) | 0 (0.0%) |
| Coal or Coke | 0 (0.0%) | 0 (0.0%) |
| All other Fuels | 2 (1.5%) | 0 (0.0%) |
| No Fuel Used | 1 (0.8%) | 0 (0.0%) |
| Total | 129 (100.0%) | 12 (100.0%) |
Household Vehicle Usage in Bellflower
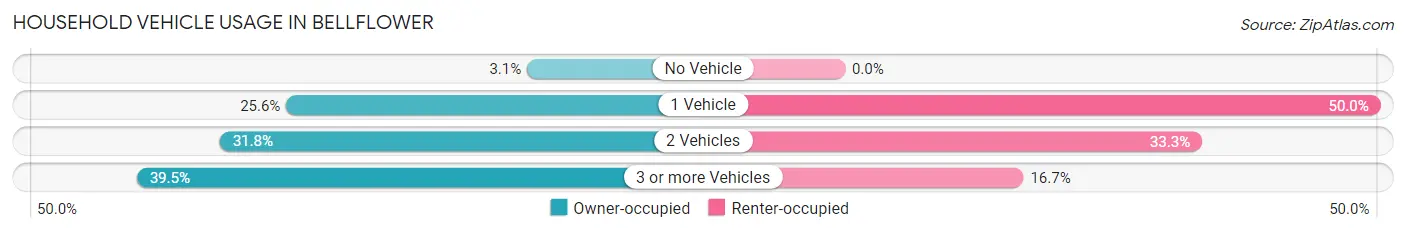
| Vehicles per Household | Owner-occupied | Renter-occupied |
| No Vehicle | 4 (3.1%) | 0 (0.0%) |
| 1 Vehicle | 33 (25.6%) | 6 (50.0%) |
| 2 Vehicles | 41 (31.8%) | 4 (33.3%) |
| 3 or more Vehicles | 51 (39.5%) | 2 (16.7%) |
| Total | 129 (100.0%) | 12 (100.0%) |
Real Estate & Mortgages in Bellflower
Real Estate and Mortgage Overview in Bellflower
| Characteristic | Without Mortgage | With Mortgage |
| Housing Units | 58 | 71 |
| Median Property Value | $92,000 | $110,600 |
| Median Household Income | $56,500 | $14 |
| Monthly Housing Costs | $400 | $0 |
| Real Estate Taxes | $1,400 | $2 |
Property Value by Mortgage Status in Bellflower
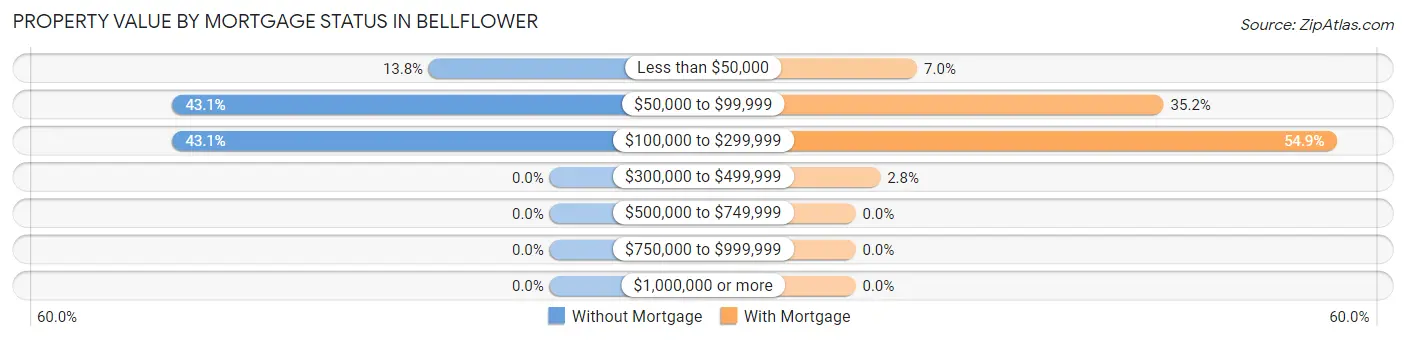
| Property Value | Without Mortgage | With Mortgage |
| Less than $50,000 | 8 (13.8%) | 5 (7.0%) |
| $50,000 to $99,999 | 25 (43.1%) | 25 (35.2%) |
| $100,000 to $299,999 | 25 (43.1%) | 39 (54.9%) |
| $300,000 to $499,999 | 0 (0.0%) | 2 (2.8%) |
| $500,000 to $749,999 | 0 (0.0%) | 0 (0.0%) |
| $750,000 to $999,999 | 0 (0.0%) | 0 (0.0%) |
| $1,000,000 or more | 0 (0.0%) | 0 (0.0%) |
| Total | 58 (100.0%) | 71 (100.0%) |
Household Income by Mortgage Status in Bellflower
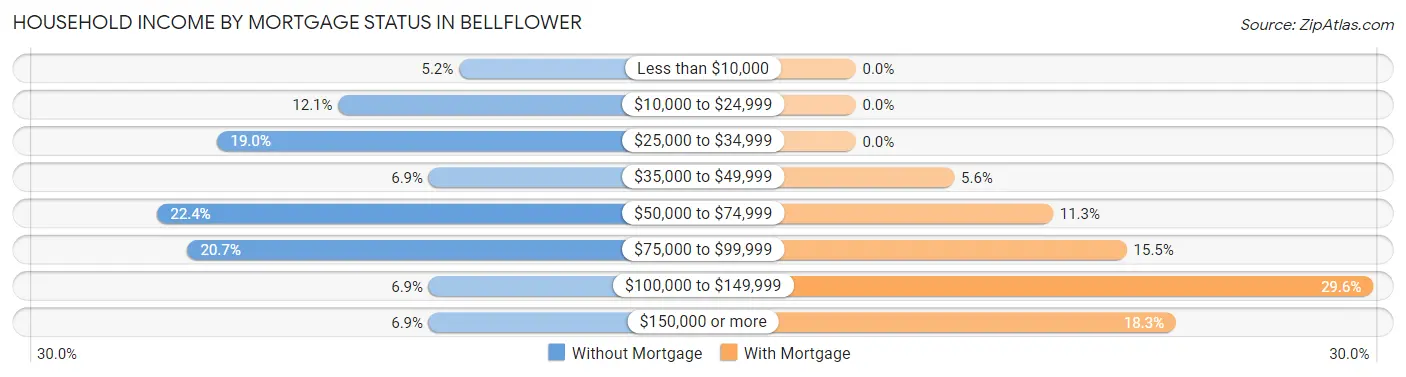
| Household Income | Without Mortgage | With Mortgage |
| Less than $10,000 | 3 (5.2%) | 0 (0.0%) |
| $10,000 to $24,999 | 7 (12.1%) | 0 (0.0%) |
| $25,000 to $34,999 | 11 (19.0%) | 0 (0.0%) |
| $35,000 to $49,999 | 4 (6.9%) | 4 (5.6%) |
| $50,000 to $74,999 | 13 (22.4%) | 8 (11.3%) |
| $75,000 to $99,999 | 12 (20.7%) | 11 (15.5%) |
| $100,000 to $149,999 | 4 (6.9%) | 21 (29.6%) |
| $150,000 or more | 4 (6.9%) | 13 (18.3%) |
| Total | 58 (100.0%) | 71 (100.0%) |
Property Value to Household Income Ratio in Bellflower
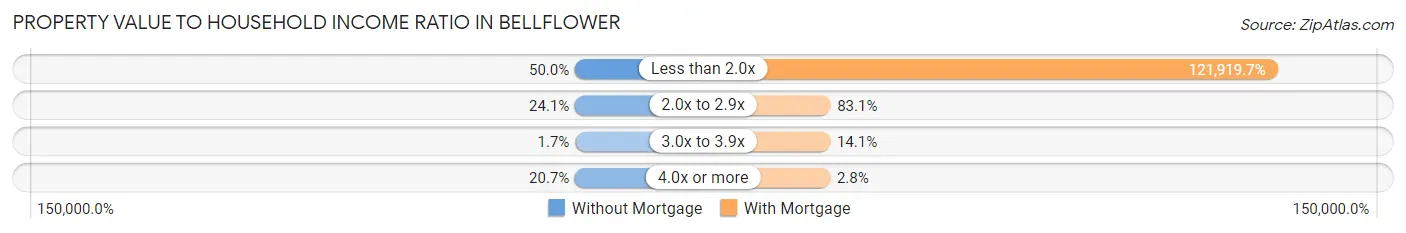
| Value-to-Income Ratio | Without Mortgage | With Mortgage |
| Less than 2.0x | 29 (50.0%) | 86,563 (121,919.7%) |
| 2.0x to 2.9x | 14 (24.1%) | 59 (83.1%) |
| 3.0x to 3.9x | 1 (1.7%) | 10 (14.1%) |
| 4.0x or more | 12 (20.7%) | 2 (2.8%) |
| Total | 58 (100.0%) | 71 (100.0%) |
Real Estate Taxes by Mortgage Status in Bellflower
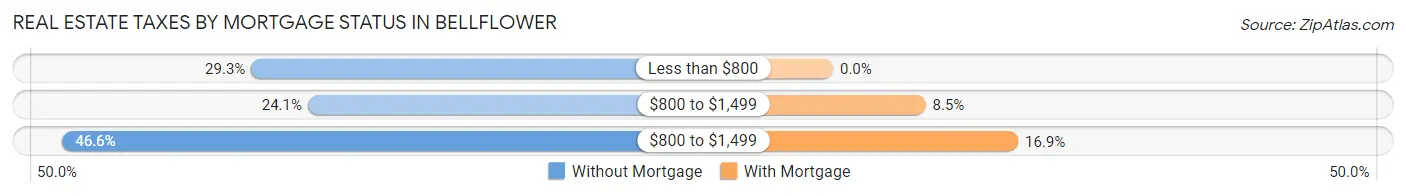
| Property Taxes | Without Mortgage | With Mortgage |
| Less than $800 | 17 (29.3%) | 0 (0.0%) |
| $800 to $1,499 | 14 (24.1%) | 6 (8.5%) |
| $800 to $1,499 | 27 (46.6%) | 12 (16.9%) |
| Total | 58 (100.0%) | 71 (100.0%) |
Health & Disability in Bellflower
Health Insurance Coverage by Age in Bellflower
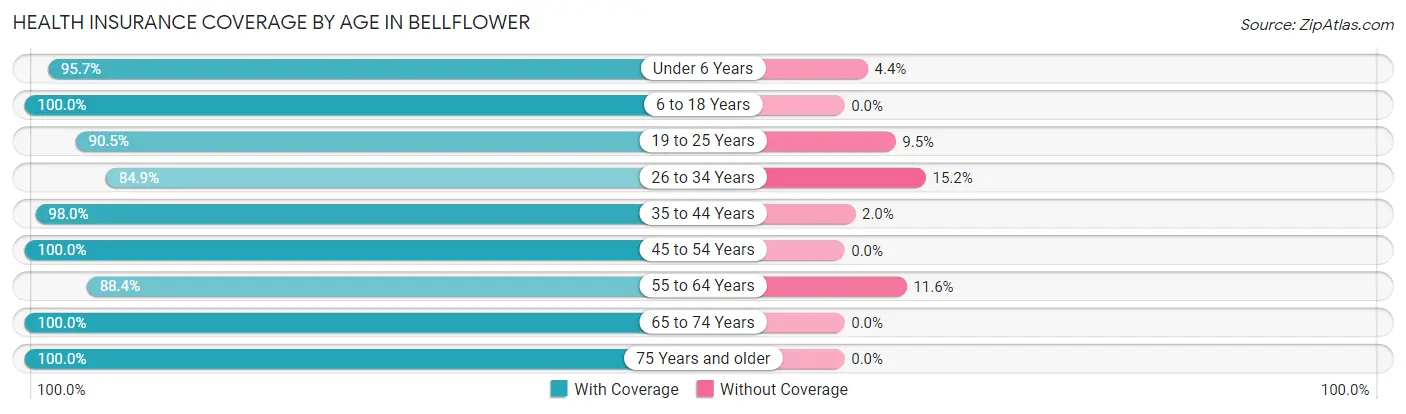
| Age Bracket | With Coverage | Without Coverage |
| Under 6 Years | 22 (95.7%) | 1 (4.3%) |
| 6 to 18 Years | 90 (100.0%) | 0 (0.0%) |
| 19 to 25 Years | 19 (90.5%) | 2 (9.5%) |
| 26 to 34 Years | 28 (84.9%) | 5 (15.1%) |
| 35 to 44 Years | 49 (98.0%) | 1 (2.0%) |
| 45 to 54 Years | 28 (100.0%) | 0 (0.0%) |
| 55 to 64 Years | 61 (88.4%) | 8 (11.6%) |
| 65 to 74 Years | 40 (100.0%) | 0 (0.0%) |
| 75 Years and older | 25 (100.0%) | 0 (0.0%) |
| Total | 362 (95.5%) | 17 (4.5%) |
Health Insurance Coverage by Citizenship Status in Bellflower
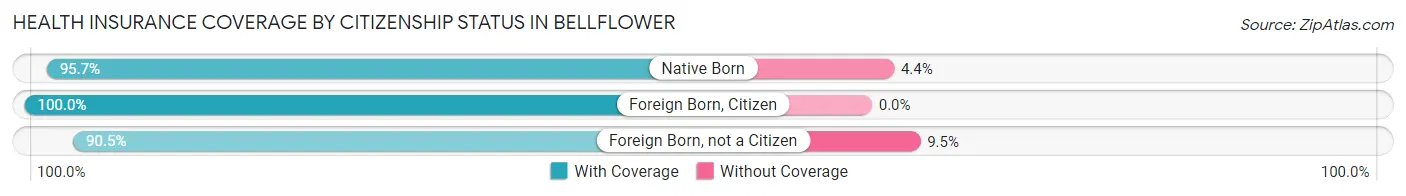
| Citizenship Status | With Coverage | Without Coverage |
| Native Born | 22 (95.7%) | 1 (4.3%) |
| Foreign Born, Citizen | 90 (100.0%) | 0 (0.0%) |
| Foreign Born, not a Citizen | 19 (90.5%) | 2 (9.5%) |
Health Insurance Coverage by Household Income in Bellflower
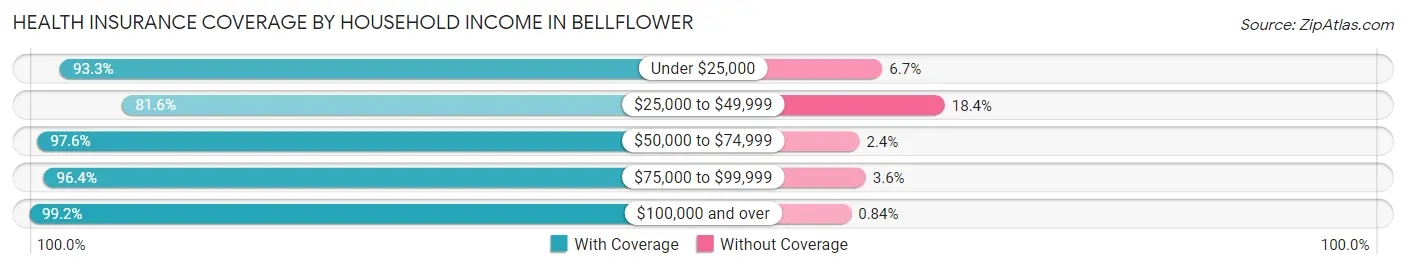
| Household Income | With Coverage | Without Coverage |
| Under $25,000 | 14 (93.3%) | 1 (6.7%) |
| $25,000 to $49,999 | 40 (81.6%) | 9 (18.4%) |
| $50,000 to $74,999 | 82 (97.6%) | 2 (2.4%) |
| $75,000 to $99,999 | 108 (96.4%) | 4 (3.6%) |
| $100,000 and over | 118 (99.2%) | 1 (0.8%) |
Public vs Private Health Insurance Coverage by Age in Bellflower
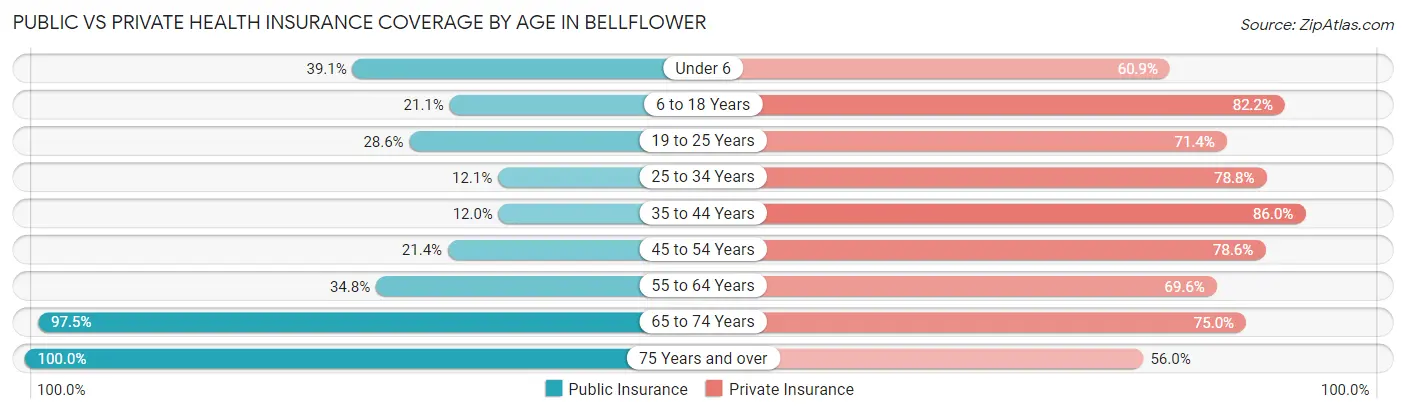
| Age Bracket | Public Insurance | Private Insurance |
| Under 6 | 9 (39.1%) | 14 (60.9%) |
| 6 to 18 Years | 19 (21.1%) | 74 (82.2%) |
| 19 to 25 Years | 6 (28.6%) | 15 (71.4%) |
| 25 to 34 Years | 4 (12.1%) | 26 (78.8%) |
| 35 to 44 Years | 6 (12.0%) | 43 (86.0%) |
| 45 to 54 Years | 6 (21.4%) | 22 (78.6%) |
| 55 to 64 Years | 24 (34.8%) | 48 (69.6%) |
| 65 to 74 Years | 39 (97.5%) | 30 (75.0%) |
| 75 Years and over | 25 (100.0%) | 14 (56.0%) |
| Total | 138 (36.4%) | 286 (75.5%) |
Disability Status by Sex by Age in Bellflower
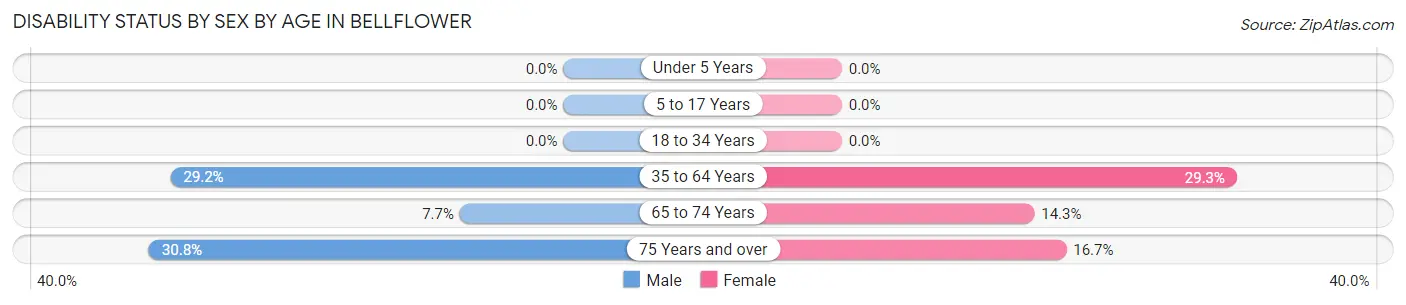
| Age Bracket | Male | Female |
| Under 5 Years | 0 (0.0%) | 0 (0.0%) |
| 5 to 17 Years | 0 (0.0%) | 0 (0.0%) |
| 18 to 34 Years | 0 (0.0%) | 0 (0.0%) |
| 35 to 64 Years | 21 (29.2%) | 22 (29.3%) |
| 65 to 74 Years | 2 (7.7%) | 2 (14.3%) |
| 75 Years and over | 4 (30.8%) | 2 (16.7%) |
Disability Class by Sex by Age in Bellflower
Disability Class: Hearing Difficulty
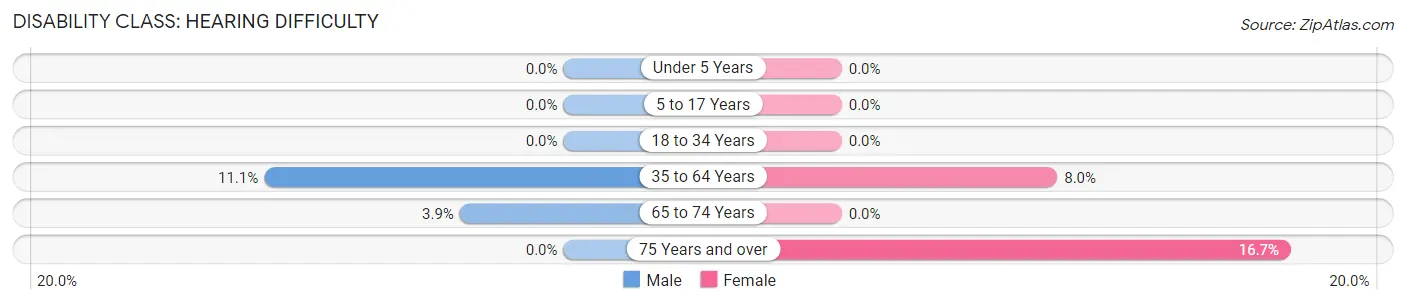
| Age Bracket | Male | Female |
| Under 5 Years | 0 (0.0%) | 0 (0.0%) |
| 5 to 17 Years | 0 (0.0%) | 0 (0.0%) |
| 18 to 34 Years | 0 (0.0%) | 0 (0.0%) |
| 35 to 64 Years | 8 (11.1%) | 6 (8.0%) |
| 65 to 74 Years | 1 (3.8%) | 0 (0.0%) |
| 75 Years and over | 0 (0.0%) | 2 (16.7%) |
Disability Class: Vision Difficulty
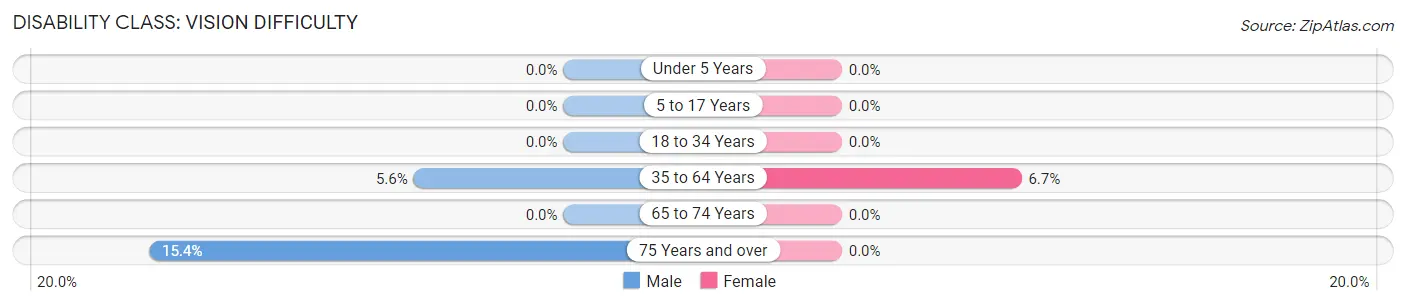
| Age Bracket | Male | Female |
| Under 5 Years | 0 (0.0%) | 0 (0.0%) |
| 5 to 17 Years | 0 (0.0%) | 0 (0.0%) |
| 18 to 34 Years | 0 (0.0%) | 0 (0.0%) |
| 35 to 64 Years | 4 (5.6%) | 5 (6.7%) |
| 65 to 74 Years | 0 (0.0%) | 0 (0.0%) |
| 75 Years and over | 2 (15.4%) | 0 (0.0%) |
Disability Class: Cognitive Difficulty
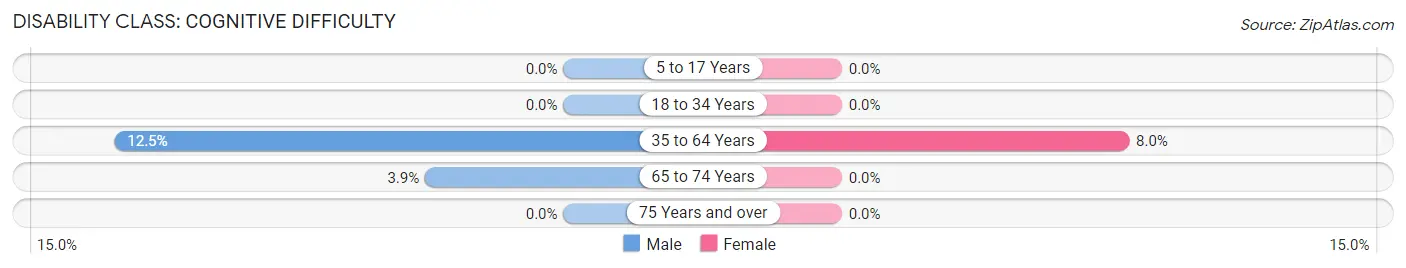
| Age Bracket | Male | Female |
| 5 to 17 Years | 0 (0.0%) | 0 (0.0%) |
| 18 to 34 Years | 0 (0.0%) | 0 (0.0%) |
| 35 to 64 Years | 9 (12.5%) | 6 (8.0%) |
| 65 to 74 Years | 1 (3.8%) | 0 (0.0%) |
| 75 Years and over | 0 (0.0%) | 0 (0.0%) |
Disability Class: Ambulatory Difficulty
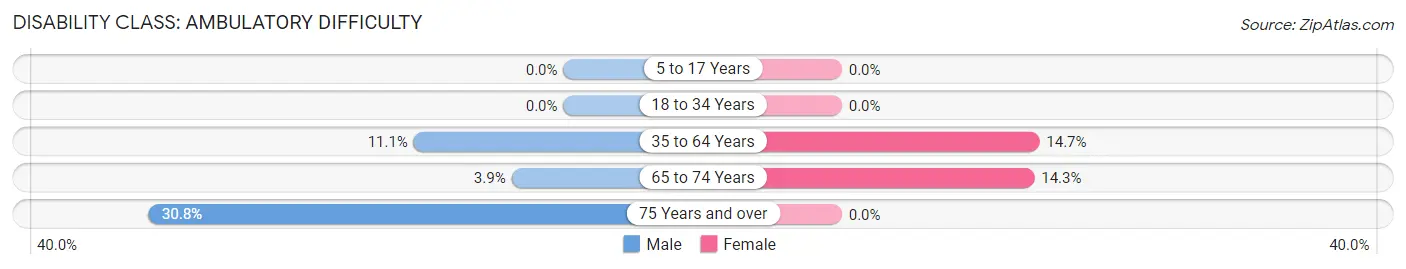
| Age Bracket | Male | Female |
| 5 to 17 Years | 0 (0.0%) | 0 (0.0%) |
| 18 to 34 Years | 0 (0.0%) | 0 (0.0%) |
| 35 to 64 Years | 8 (11.1%) | 11 (14.7%) |
| 65 to 74 Years | 1 (3.8%) | 2 (14.3%) |
| 75 Years and over | 4 (30.8%) | 0 (0.0%) |
Disability Class: Self-Care Difficulty
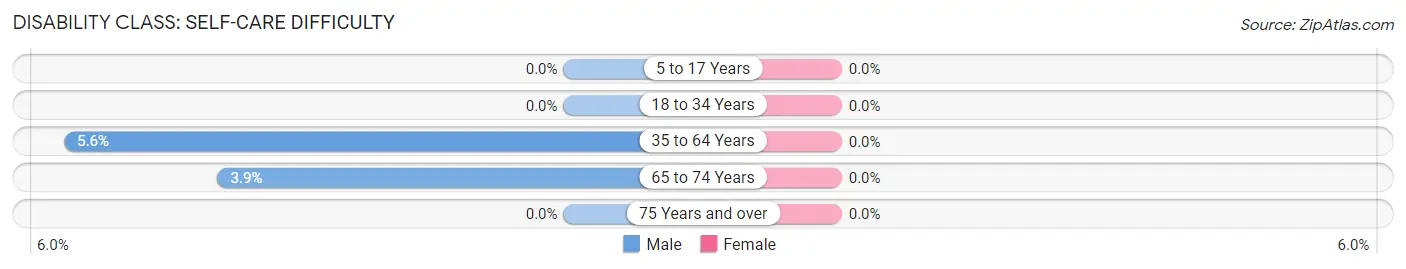
| Age Bracket | Male | Female |
| 5 to 17 Years | 0 (0.0%) | 0 (0.0%) |
| 18 to 34 Years | 0 (0.0%) | 0 (0.0%) |
| 35 to 64 Years | 4 (5.6%) | 0 (0.0%) |
| 65 to 74 Years | 1 (3.8%) | 0 (0.0%) |
| 75 Years and over | 0 (0.0%) | 0 (0.0%) |
Technology Access in Bellflower
Computing Device Access in Bellflower
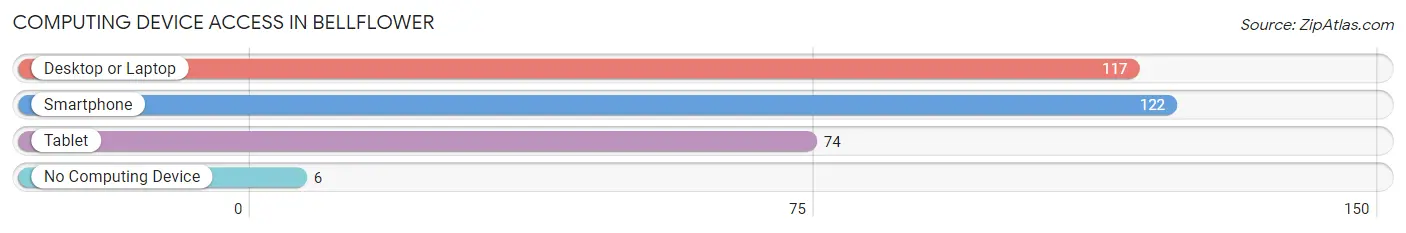
| Device Type | # Households | % Households |
| Desktop or Laptop | 117 | 83.0% |
| Smartphone | 122 | 86.5% |
| Tablet | 74 | 52.5% |
| No Computing Device | 6 | 4.3% |
| Total | 141 | 100.0% |
Internet Access in Bellflower
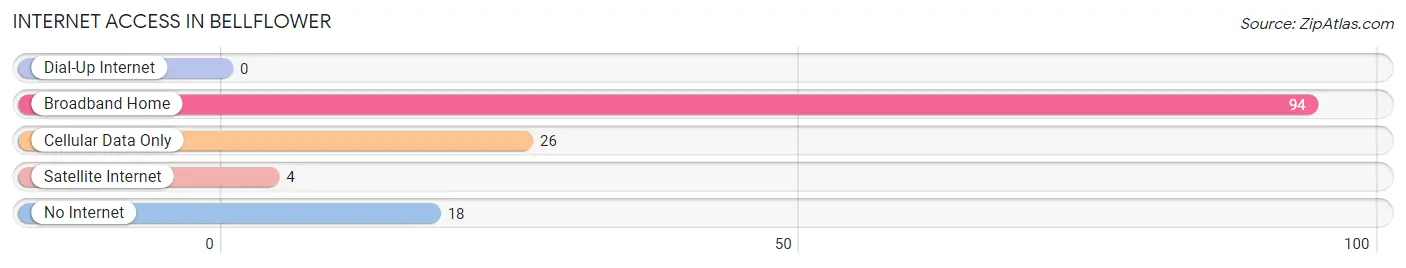
| Internet Type | # Households | % Households |
| Dial-Up Internet | 0 | 0.0% |
| Broadband Home | 94 | 66.7% |
| Cellular Data Only | 26 | 18.4% |
| Satellite Internet | 4 | 2.8% |
| No Internet | 18 | 12.8% |
| Total | 141 | 100.0% |
Bellflower Summary
Bellflower, Illinois is a small village located in McLean County, Illinois. It is situated in the heart of the Midwest, approximately 25 miles north of Bloomington-Normal and about 90 miles southwest of Chicago. The village has a population of approximately 1,000 people and covers an area of 0.6 square miles.
History
Bellflower was founded in 1854 by a group of settlers from Ohio. The village was named after the bellflower, a wildflower that was abundant in the area. The first settlers were primarily farmers and the village was largely agricultural until the late 19th century.
In 1871, the Chicago and Alton Railroad was built through the village, connecting it to the larger cities of Bloomington and Chicago. This allowed for the growth of the village and the development of a small business district. In 1876, the village was incorporated and the first mayor was elected.
In the early 20th century, Bellflower experienced a period of growth and development. The village was home to several businesses, including a bank, a hotel, a general store, and a blacksmith shop. The village also had a school, a post office, and a library.
Geography
Bellflower is located in the central part of McLean County, Illinois. It is situated in the heart of the Midwest, approximately 25 miles north of Bloomington-Normal and about 90 miles southwest of Chicago. The village is located on the banks of the Sangamon River and is surrounded by rolling hills and farmland.
The village has a total area of 0.6 square miles, all of which is land. The climate is humid continental, with hot summers and cold winters. The average annual temperature is around 50 degrees Fahrenheit.
Economy
The economy of Bellflower is largely based on agriculture. The village is home to several farms, which produce a variety of crops, including corn, soybeans, and wheat. The village also has a few small businesses, including a general store, a bank, and a hotel.
Demographics
As of the 2010 census, the population of Bellflower was 1,000 people. The racial makeup of the village was 97.7% White, 0.7% African American, 0.2% Native American, 0.2% Asian, and 1.2% from other races. The median household income was $45,000 and the median family income was $50,000.
Conclusion
Bellflower, Illinois is a small village located in McLean County, Illinois. It is situated in the heart of the Midwest, approximately 25 miles north of Bloomington-Normal and about 90 miles southwest of Chicago. The village has a population of approximately 1,000 people and covers an area of 0.6 square miles. The economy of Bellflower is largely based on agriculture and the village is home to several farms, which produce a variety of crops. The racial makeup of the village is predominantly White, with a small percentage of African American, Native American, and Asian residents.
Common Questions
What is Per Capita Income in Bellflower?
Per Capita income in Bellflower is $31,724.
What is the Median Family Income in Bellflower?
Median Family Income in Bellflower is $83,750.
What is the Median Household income in Bellflower?
Median Household Income in Bellflower is $76,875.
What is Income or Wage Gap in Bellflower?
Income or Wage Gap in Bellflower is 19.8%.
Women in Bellflower earn 80.2 cents for every dollar earned by a man.
What is Inequality or Gini Index in Bellflower?
Inequality or Gini Index in Bellflower is 0.35.
What is the Total Population of Bellflower?
Total Population of Bellflower is 379.
What is the Total Male Population of Bellflower?
Total Male Population of Bellflower is 192.
What is the Total Female Population of Bellflower?
Total Female Population of Bellflower is 187.
What is the Ratio of Males per 100 Females in Bellflower?
There are 102.67 Males per 100 Females in Bellflower.
What is the Ratio of Females per 100 Males in Bellflower?
There are 97.40 Females per 100 Males in Bellflower.
What is the Median Population Age in Bellflower?
Median Population Age in Bellflower is 40.1 Years.
What is the Average Family Size in Bellflower
Average Family Size in Bellflower is 3.1 People.
What is the Average Household Size in Bellflower
Average Household Size in Bellflower is 2.7 People.
How Large is the Labor Force in Bellflower?
There are 181 People in the Labor Forcein in Bellflower.
What is the Percentage of People in the Labor Force in Bellflower?
63.1% of People are in the Labor Force in Bellflower.
What is the Unemployment Rate in Bellflower?
Unemployment Rate in Bellflower is 5.0%.