Zip Codes with the Highest Percentage of Households with Income Above $200,000 in Nampa, ID
RELATED REPORTS & OPTIONS
Household Income | $200k+
Nampa
Compare Zip Codes
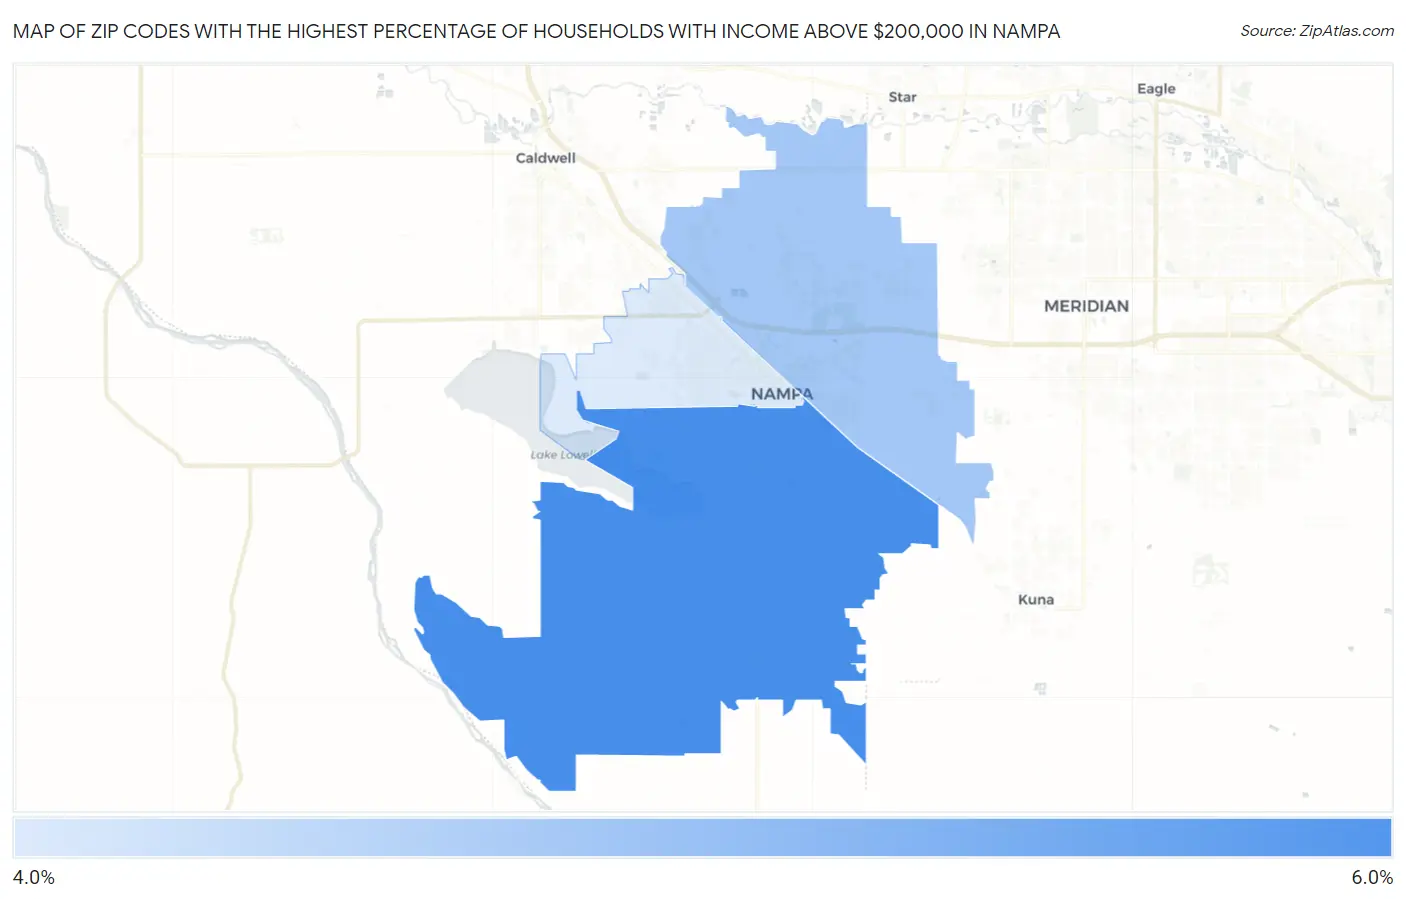
Map of Zip Codes with the Highest Percentage of Households with Income Above $200,000 in Nampa
4.1%
5.4%
Zip Codes with the Highest Percentage of Households with Income Above $200,000 in Nampa, ID
| Zip Code | Households with Income > $200k | vs State | vs National | |
| 1. | 83686 | 5.4% | 7.3%(-1.90)#82 | 11.4%(-6.00)#14,651 |
| 2. | 83687 | 4.6% | 7.3%(-2.70)#111 | 11.4%(-6.80)#16,515 |
| 3. | 83651 | 4.1% | 7.3%(-3.20)#123 | 11.4%(-7.30)#17,814 |
1
Common Questions
What are the Top Zip Codes with the Highest Percentage of Households with Income Above $200,000 in Nampa, ID?
Top Zip Codes with the Highest Percentage of Households with Income Above $200,000 in Nampa, ID are:
What zip code has the Highest Percentage of Households with Income Above $200,000 in Nampa, ID?
83686 has the Highest Percentage of Households with Income Above $200,000 in Nampa, ID with 5.4%.
What is the Percentage of Households with Income Above $200,000 in Nampa, ID?
Percentage of Households with Income Above $200,000 in Nampa is 3.0%.
What is the Percentage of Households with Income Above $200,000 in Idaho?
Percentage of Households with Income Above $200,000 in Idaho is 7.3%.
What is the Percentage of Households with Income Above $200,000 in the United States?
Percentage of Households with Income Above $200,000 in the United States is 11.4%.