Zip Codes with the Highest Percentage of Population Employed in Food Preparation & Serving in Nampa, ID
RELATED REPORTS & OPTIONS
Food Preparation & Serving
Nampa
Compare Zip Codes
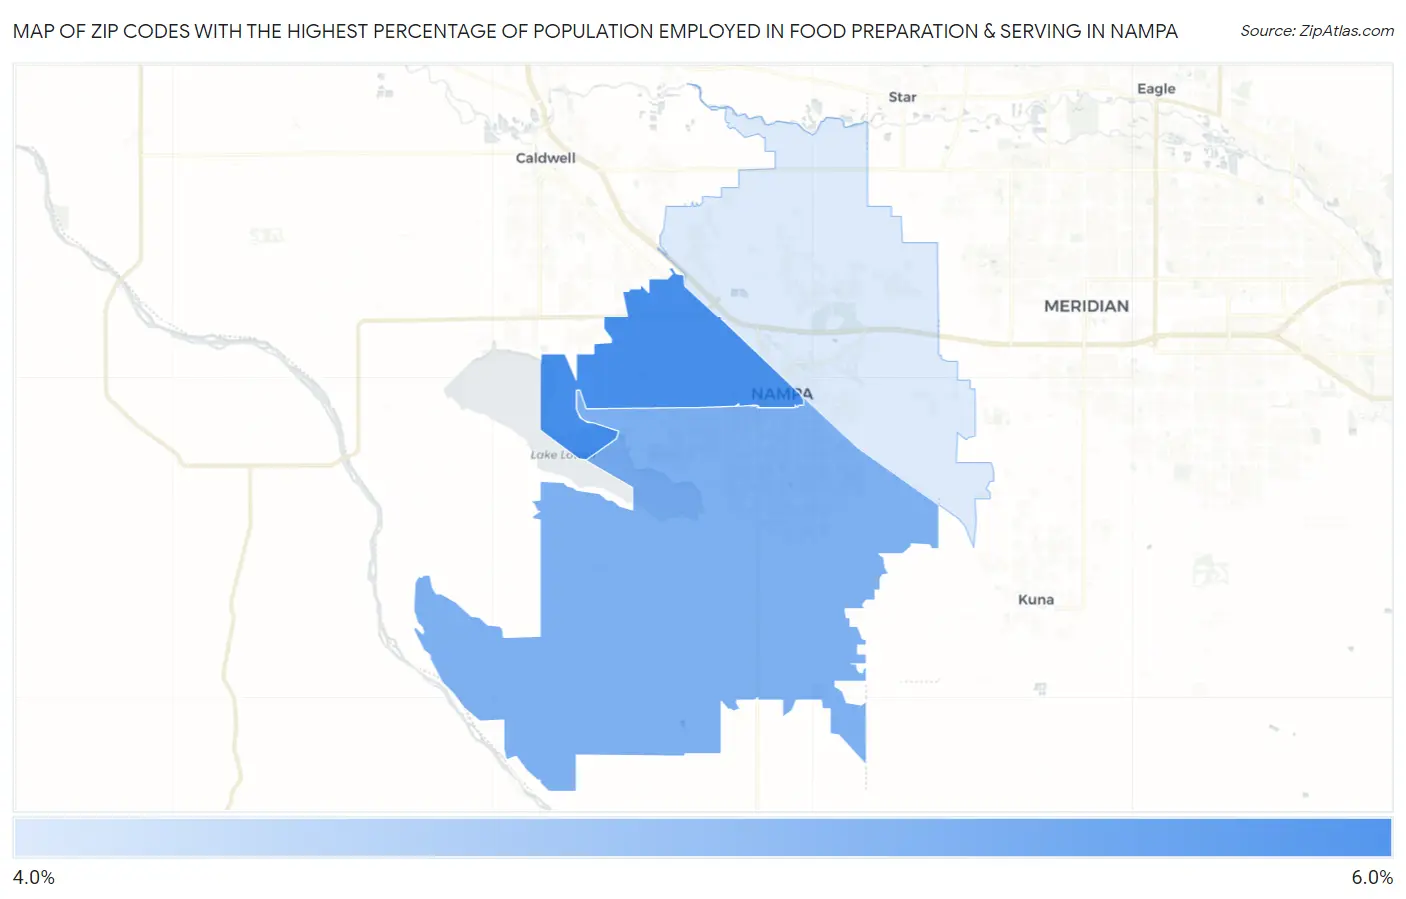
Map of Zip Codes with the Highest Percentage of Population Employed in Food Preparation & Serving in Nampa
4.9%
5.6%
Zip Codes with the Highest Percentage of Population Employed in Food Preparation & Serving in Nampa, ID
| Zip Code | % Employed | vs State | vs National | |
| 1. | 83651 | 5.6% | 5.7%(-0.084)#93 | 5.3%(+0.303)#10,747 |
| 2. | 83686 | 5.4% | 5.7%(-0.309)#97 | 5.3%(+0.079)#11,523 |
| 3. | 83687 | 4.9% | 5.7%(-0.730)#105 | 5.3%(-0.343)#13,175 |
1
Common Questions
What are the Top Zip Codes with the Highest Percentage of Population Employed in Food Preparation & Serving in Nampa, ID?
Top Zip Codes with the Highest Percentage of Population Employed in Food Preparation & Serving in Nampa, ID are:
What zip code has the Highest Percentage of Population Employed in Food Preparation & Serving in Nampa, ID?
83651 has the Highest Percentage of Population Employed in Food Preparation & Serving in Nampa, ID with 5.6%.
What is the Percentage of Population Employed in Food Preparation & Serving in Nampa, ID?
Percentage of Population Employed in Food Preparation & Serving in Nampa is 5.3%.
What is the Percentage of Population Employed in Food Preparation & Serving in Idaho?
Percentage of Population Employed in Food Preparation & Serving in Idaho is 5.7%.
What is the Percentage of Population Employed in Food Preparation & Serving in the United States?
Percentage of Population Employed in Food Preparation & Serving in the United States is 5.3%.