Zip Codes with the Highest Percentage of Population Employed in Administrative & Support Services in Nampa, ID
RELATED REPORTS & OPTIONS
Administrative & Support Services
Nampa
Compare Zip Codes
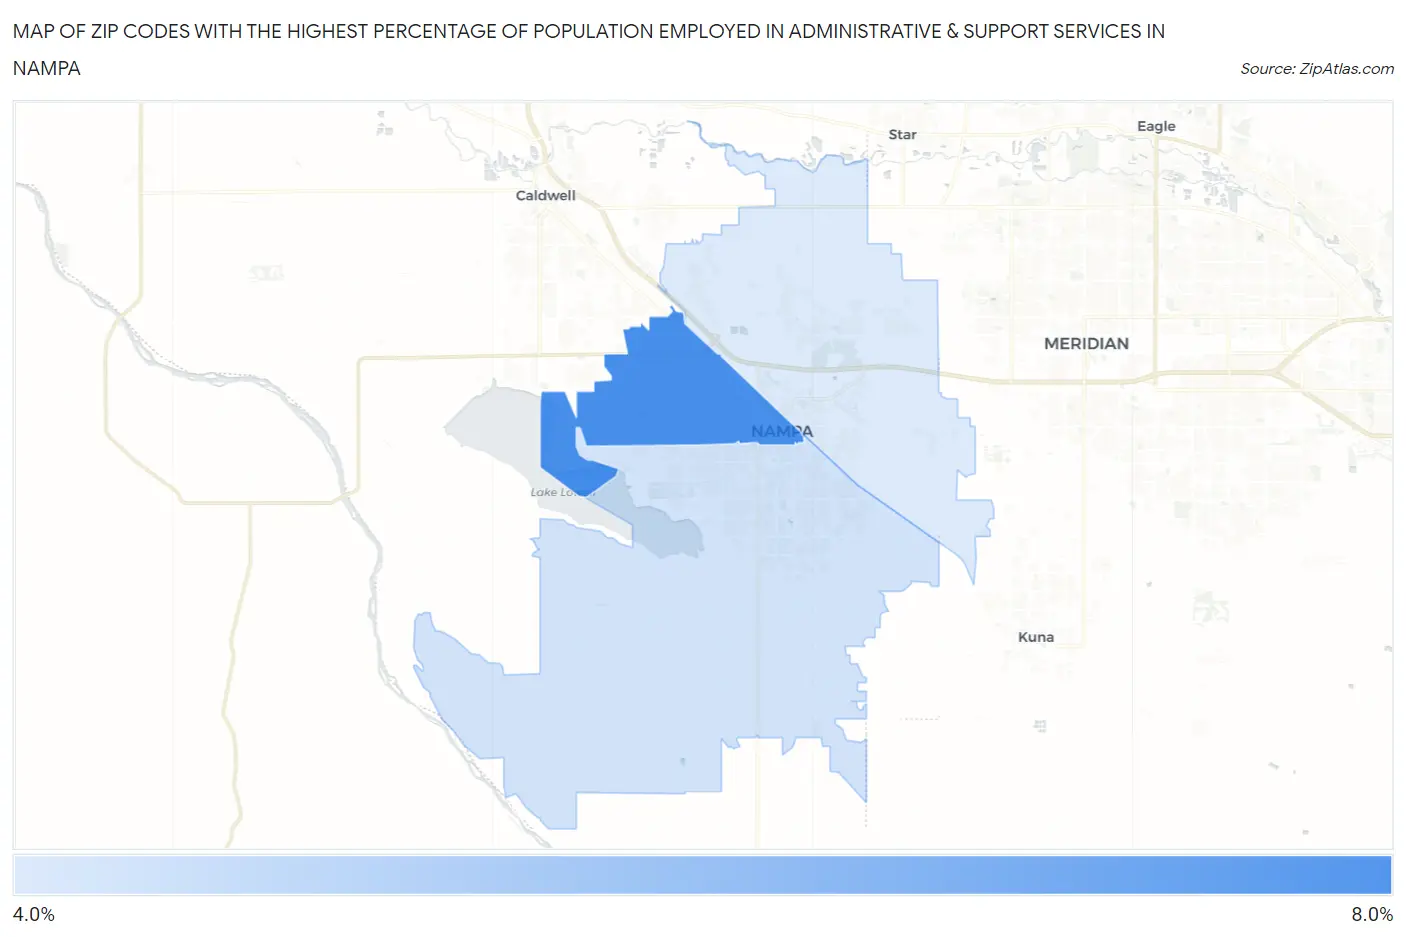
Map of Zip Codes with the Highest Percentage of Population Employed in Administrative & Support Services in Nampa
4.2%
6.2%
Zip Codes with the Highest Percentage of Population Employed in Administrative & Support Services in Nampa, ID
| Zip Code | % Employed | vs State | vs National | |
| 1. | 83651 | 6.2% | 3.6%(+2.61)#25 | 4.1%(+2.05)#4,399 |
| 2. | 83686 | 4.3% | 3.6%(+0.720)#58 | 4.1%(+0.169)#9,375 |
| 3. | 83687 | 4.2% | 3.6%(+0.553)#63 | 4.1%(+0.001)#10,032 |
1
Common Questions
What are the Top Zip Codes with the Highest Percentage of Population Employed in Administrative & Support Services in Nampa, ID?
Top Zip Codes with the Highest Percentage of Population Employed in Administrative & Support Services in Nampa, ID are:
What zip code has the Highest Percentage of Population Employed in Administrative & Support Services in Nampa, ID?
83651 has the Highest Percentage of Population Employed in Administrative & Support Services in Nampa, ID with 6.2%.
What is the Percentage of Population Employed in Administrative & Support Services in Nampa, ID?
Percentage of Population Employed in Administrative & Support Services in Nampa is 5.0%.
What is the Percentage of Population Employed in Administrative & Support Services in Idaho?
Percentage of Population Employed in Administrative & Support Services in Idaho is 3.6%.
What is the Percentage of Population Employed in Administrative & Support Services in the United States?
Percentage of Population Employed in Administrative & Support Services in the United States is 4.1%.