Zip Codes with the Highest Percentage of Population with a Degree in Liberal Arts and History in Nampa, ID
RELATED REPORTS & OPTIONS
Liberal Arts and History
Nampa
Compare Zip Codes
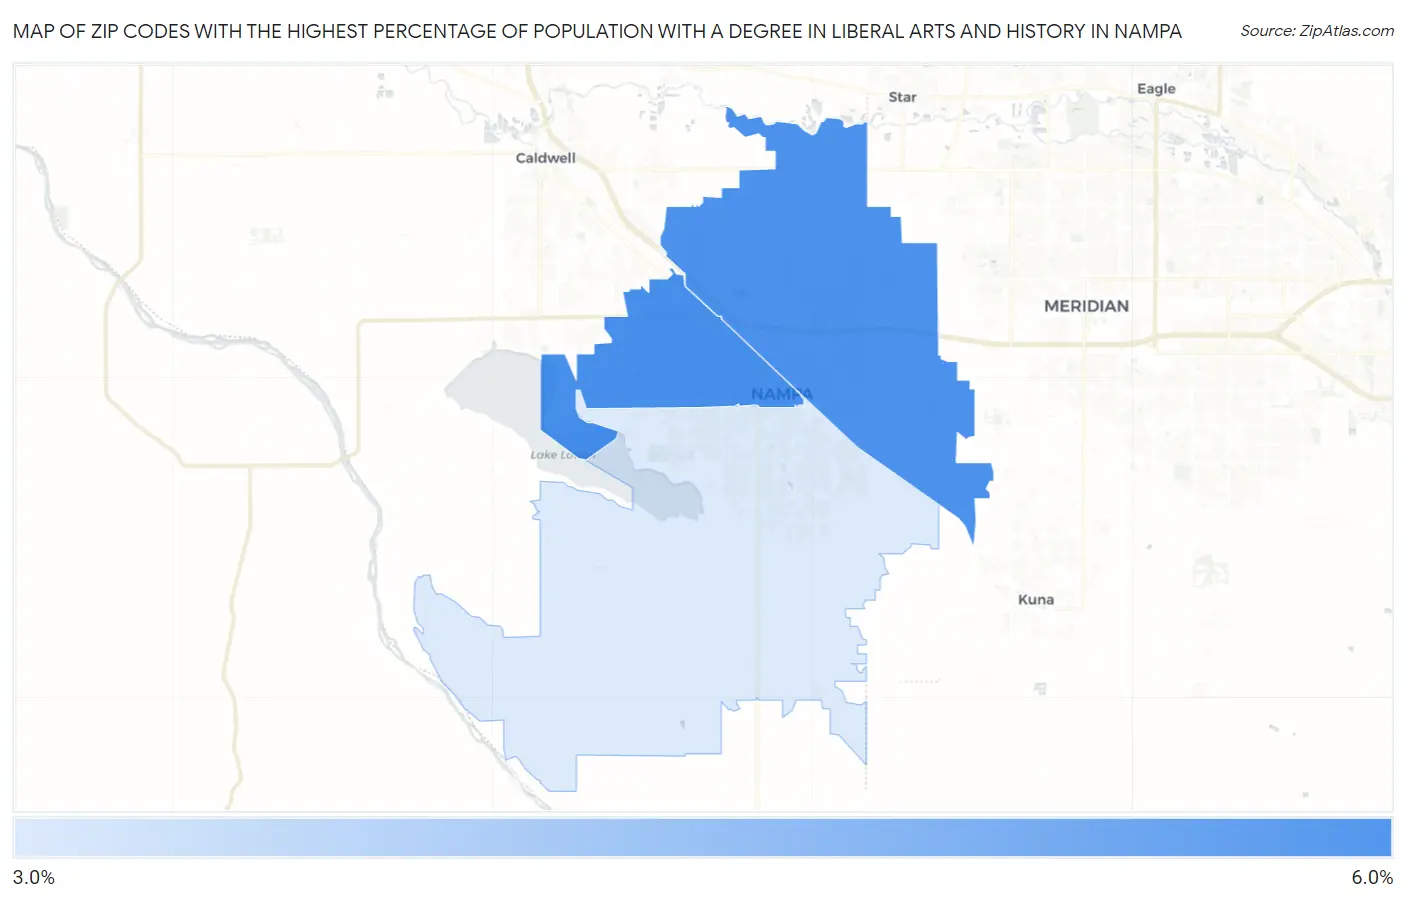
Map of Zip Codes with the Highest Percentage of Population with a Degree in Liberal Arts and History in Nampa
3.7%
5.4%
Zip Codes with the Highest Percentage of Population with a Degree in Liberal Arts and History in Nampa, ID
| Zip Code | % Graduates | vs State | vs National | |
| 1. | 83651 | 5.4% | 4.2%(+1.16)#67 | 4.9%(+0.488)#10,246 |
| 2. | 83687 | 5.3% | 4.2%(+1.11)#68 | 4.9%(+0.436)#10,414 |
| 3. | 83686 | 3.7% | 4.2%(-0.526)#110 | 4.9%(-1.20)#15,979 |
1
Common Questions
What are the Top Zip Codes with the Highest Percentage of Population with a Degree in Liberal Arts and History in Nampa, ID?
Top Zip Codes with the Highest Percentage of Population with a Degree in Liberal Arts and History in Nampa, ID are:
What zip code has the Highest Percentage of Population with a Degree in Liberal Arts and History in Nampa, ID?
83651 has the Highest Percentage of Population with a Degree in Liberal Arts and History in Nampa, ID with 5.4%.
What is the Percentage of Population with a Degree in Liberal Arts and History in Nampa, ID?
Percentage of Population with a Degree in Liberal Arts and History in Nampa is 5.6%.
What is the Percentage of Population with a Degree in Liberal Arts and History in Idaho?
Percentage of Population with a Degree in Liberal Arts and History in Idaho is 4.2%.
What is the Percentage of Population with a Degree in Liberal Arts and History in the United States?
Percentage of Population with a Degree in Liberal Arts and History in the United States is 4.9%.