Zip Codes with the Highest Percentage of Population Employed in Health Diagnosing & Treating in Nampa, ID
RELATED REPORTS & OPTIONS
Health Diagnosing & Treating
Nampa
Compare Zip Codes
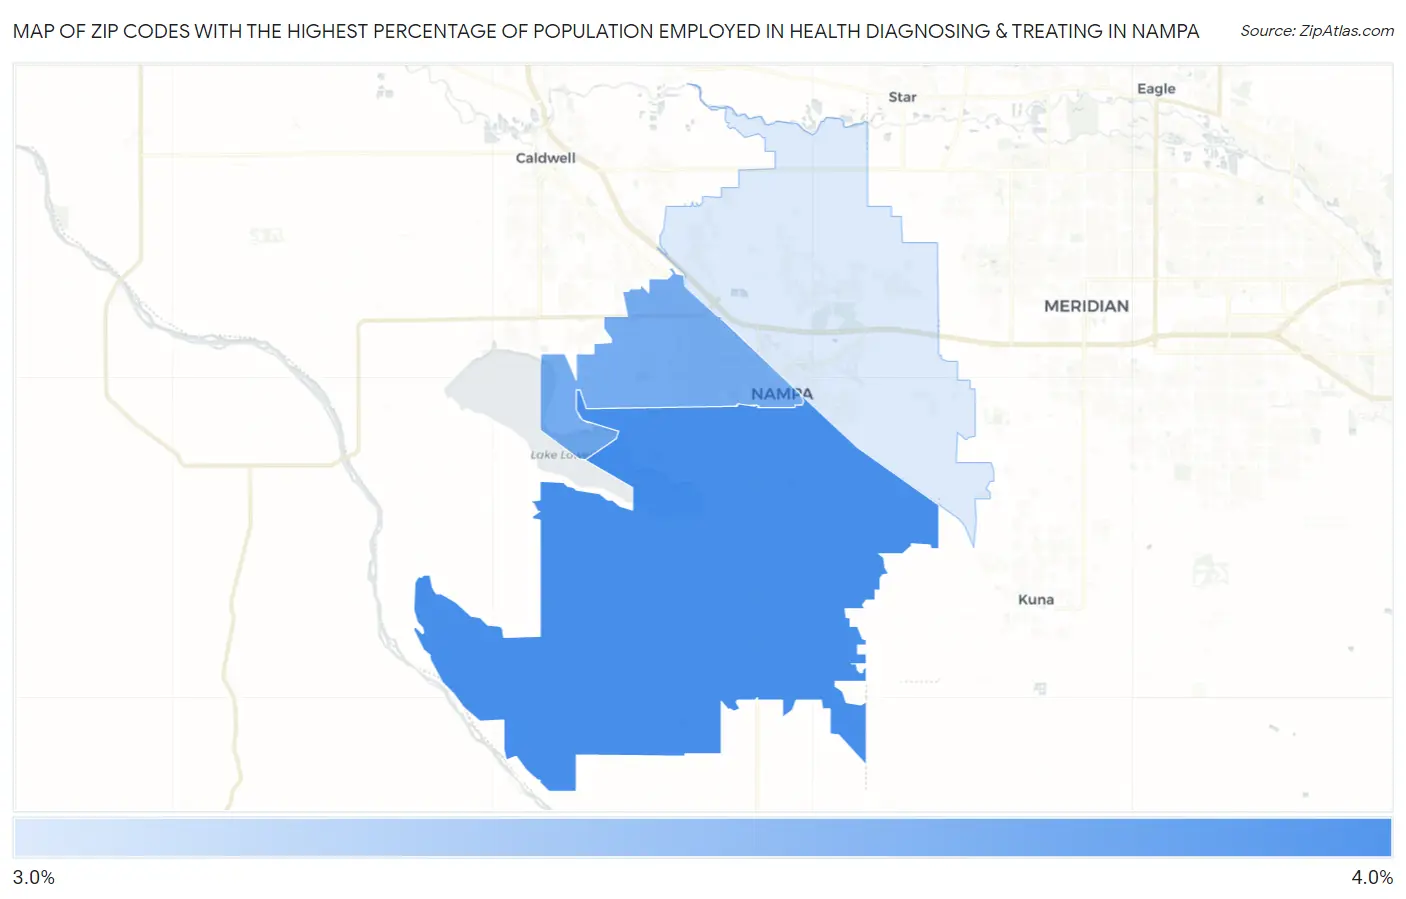
Map of Zip Codes with the Highest Percentage of Population Employed in Health Diagnosing & Treating in Nampa
3.1%
3.8%
Zip Codes with the Highest Percentage of Population Employed in Health Diagnosing & Treating in Nampa, ID
| Zip Code | % Employed | vs State | vs National | |
| 1. | 83686 | 3.8% | 5.6%(-1.80)#132 | 6.2%(-2.44)#21,987 |
| 2. | 83651 | 3.6% | 5.6%(-2.02)#137 | 6.2%(-2.66)#22,663 |
| 3. | 83687 | 3.1% | 5.6%(-2.51)#151 | 6.2%(-3.15)#24,094 |
1
Common Questions
What are the Top Zip Codes with the Highest Percentage of Population Employed in Health Diagnosing & Treating in Nampa, ID?
Top Zip Codes with the Highest Percentage of Population Employed in Health Diagnosing & Treating in Nampa, ID are:
What zip code has the Highest Percentage of Population Employed in Health Diagnosing & Treating in Nampa, ID?
83686 has the Highest Percentage of Population Employed in Health Diagnosing & Treating in Nampa, ID with 3.8%.
What is the Percentage of Population Employed in Health Diagnosing & Treating in Nampa, ID?
Percentage of Population Employed in Health Diagnosing & Treating in Nampa is 3.4%.
What is the Percentage of Population Employed in Health Diagnosing & Treating in Idaho?
Percentage of Population Employed in Health Diagnosing & Treating in Idaho is 5.6%.
What is the Percentage of Population Employed in Health Diagnosing & Treating in the United States?
Percentage of Population Employed in Health Diagnosing & Treating in the United States is 6.2%.