Zip Codes with the Highest Percentage of Population with a Degree in Visual and Performing Arts in Nampa, ID
RELATED REPORTS & OPTIONS
Visual and Performing Arts
Nampa
Compare Zip Codes
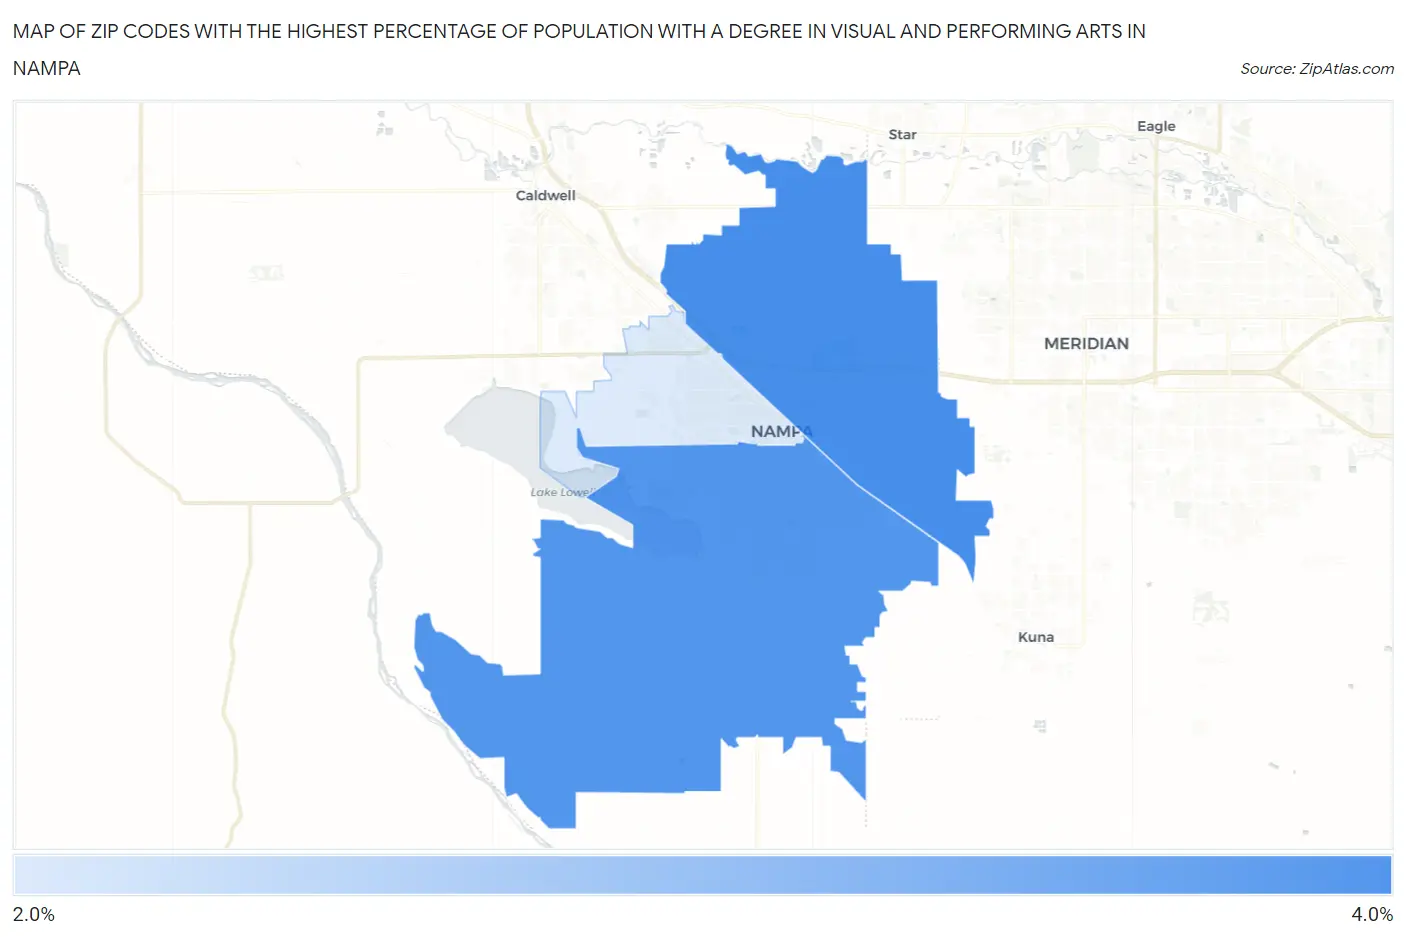
Map of Zip Codes with the Highest Percentage of Population with a Degree in Visual and Performing Arts in Nampa
2.0%
3.6%
Zip Codes with the Highest Percentage of Population with a Degree in Visual and Performing Arts in Nampa, ID
| Zip Code | % Graduates | vs State | vs National | |
| 1. | 83687 | 3.6% | 4.0%(-0.337)#80 | 4.3%(-0.604)#10,341 |
| 2. | 83686 | 3.5% | 4.0%(-0.457)#84 | 4.3%(-0.723)#10,788 |
| 3. | 83651 | 2.0% | 4.0%(-1.98)#119 | 4.3%(-2.24)#16,429 |
1
Common Questions
What are the Top Zip Codes with the Highest Percentage of Population with a Degree in Visual and Performing Arts in Nampa, ID?
Top Zip Codes with the Highest Percentage of Population with a Degree in Visual and Performing Arts in Nampa, ID are:
What zip code has the Highest Percentage of Population with a Degree in Visual and Performing Arts in Nampa, ID?
83687 has the Highest Percentage of Population with a Degree in Visual and Performing Arts in Nampa, ID with 3.6%.
What is the Percentage of Population with a Degree in Visual and Performing Arts in Nampa, ID?
Percentage of Population with a Degree in Visual and Performing Arts in Nampa is 3.4%.
What is the Percentage of Population with a Degree in Visual and Performing Arts in Idaho?
Percentage of Population with a Degree in Visual and Performing Arts in Idaho is 4.0%.
What is the Percentage of Population with a Degree in Visual and Performing Arts in the United States?
Percentage of Population with a Degree in Visual and Performing Arts in the United States is 4.3%.