Zip Codes with the Highest Percentage of Population Employed in Legal Services & Support in Nampa, ID
RELATED REPORTS & OPTIONS
Legal Services & Support
Nampa
Compare Zip Codes
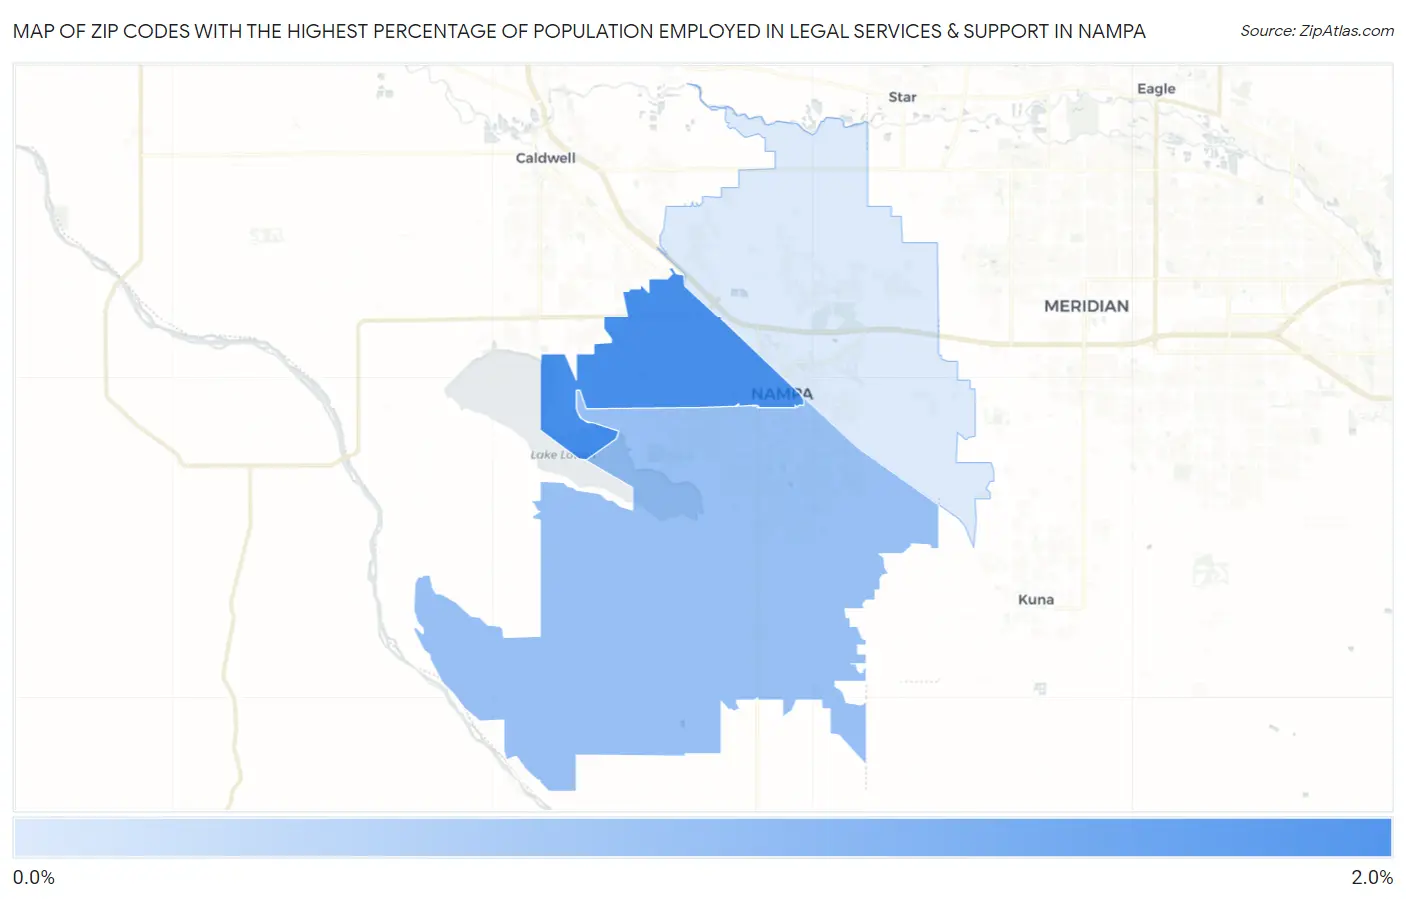
Map of Zip Codes with the Highest Percentage of Population Employed in Legal Services & Support in Nampa
0.078%
1.8%
Zip Codes with the Highest Percentage of Population Employed in Legal Services & Support in Nampa, ID
| Zip Code | % Employed | vs State | vs National | |
| 1. | 83651 | 1.8% | 0.88%(+0.890)#24 | 1.2%(+0.585)#4,087 |
| 2. | 83686 | 0.87% | 0.88%(-0.012)#58 | 1.2%(-0.317)#8,885 |
| 3. | 83687 | 0.078% | 0.88%(-0.801)#111 | 1.2%(-1.11)#17,286 |
1
Common Questions
What are the Top Zip Codes with the Highest Percentage of Population Employed in Legal Services & Support in Nampa, ID?
Top Zip Codes with the Highest Percentage of Population Employed in Legal Services & Support in Nampa, ID are:
What zip code has the Highest Percentage of Population Employed in Legal Services & Support in Nampa, ID?
83651 has the Highest Percentage of Population Employed in Legal Services & Support in Nampa, ID with 1.8%.
What is the Percentage of Population Employed in Legal Services & Support in Nampa, ID?
Percentage of Population Employed in Legal Services & Support in Nampa is 0.51%.
What is the Percentage of Population Employed in Legal Services & Support in Idaho?
Percentage of Population Employed in Legal Services & Support in Idaho is 0.88%.
What is the Percentage of Population Employed in Legal Services & Support in the United States?
Percentage of Population Employed in Legal Services & Support in the United States is 1.2%.