Zip Codes with the Highest Percentage of Population Employed in Architecture & Engineering in Ames, IA
RELATED REPORTS & OPTIONS
Architecture & Engineering
Ames
Compare Zip Codes
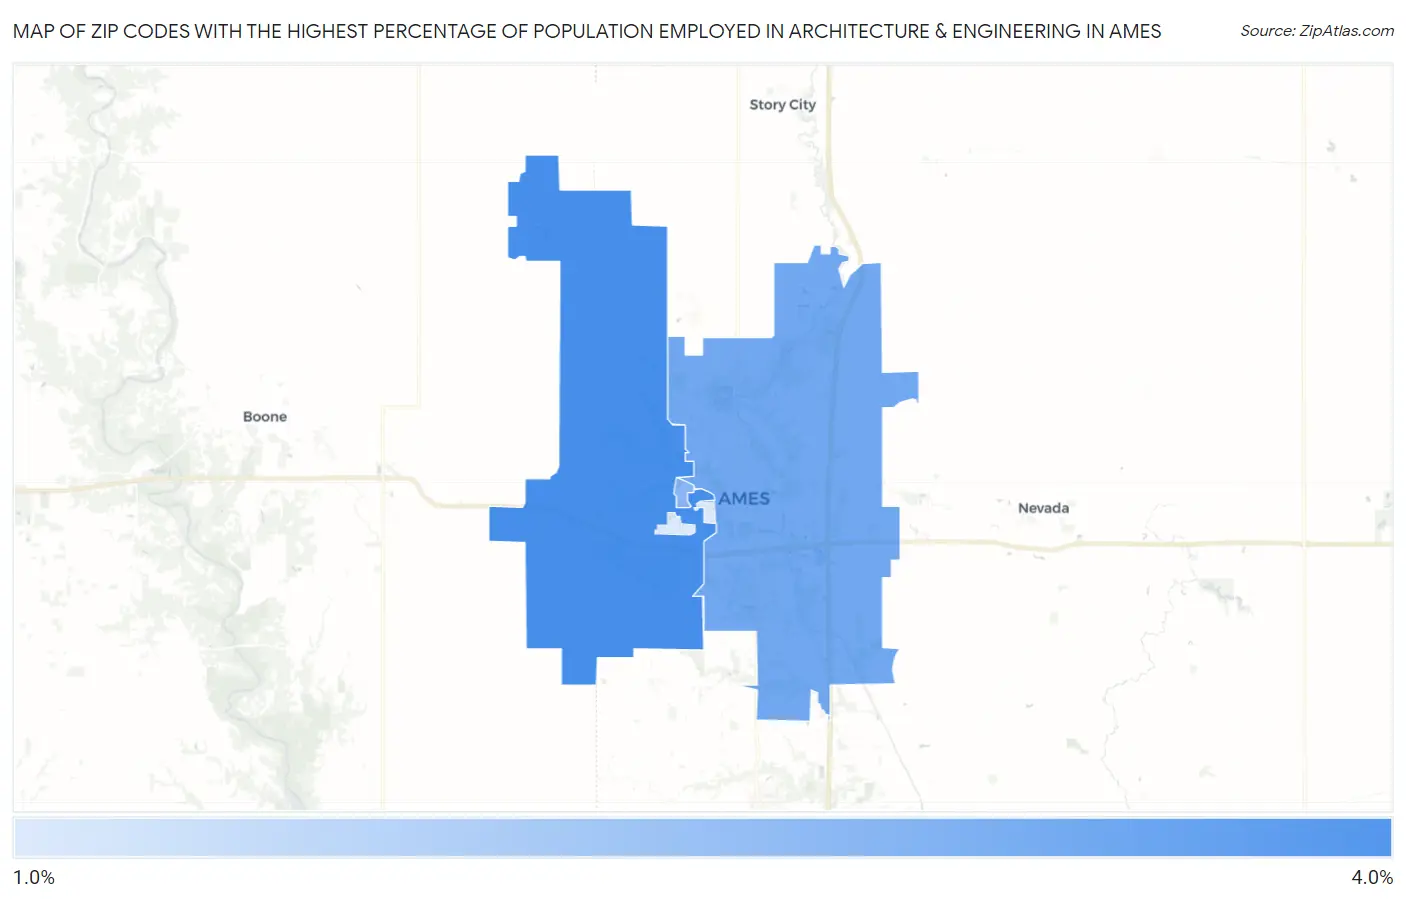
Map of Zip Codes with the Highest Percentage of Population Employed in Architecture & Engineering in Ames
1.3%
3.7%
Zip Codes with the Highest Percentage of Population Employed in Architecture & Engineering in Ames, IA
| Zip Code | % Employed | vs State | vs National | |
| 1. | 50014 | 3.7% | 1.8%(+1.87)#87 | 2.1%(+1.50)#3,396 |
| 2. | 50010 | 3.0% | 1.8%(+1.18)#128 | 2.1%(+0.819)#5,168 |
| 3. | 50012 | 2.6% | 1.8%(+0.820)#162 | 2.1%(+0.454)#6,566 |
| 4. | 50013 | 1.3% | 1.8%(-0.519)#343 | 2.1%(-0.885)#14,575 |
1
Common Questions
What are the Top 3 Zip Codes with the Highest Percentage of Population Employed in Architecture & Engineering in Ames, IA?
Top 3 Zip Codes with the Highest Percentage of Population Employed in Architecture & Engineering in Ames, IA are:
What zip code has the Highest Percentage of Population Employed in Architecture & Engineering in Ames, IA?
50014 has the Highest Percentage of Population Employed in Architecture & Engineering in Ames, IA with 3.7%.
What is the Percentage of Population Employed in Architecture & Engineering in Ames, IA?
Percentage of Population Employed in Architecture & Engineering in Ames is 3.3%.
What is the Percentage of Population Employed in Architecture & Engineering in Iowa?
Percentage of Population Employed in Architecture & Engineering in Iowa is 1.8%.
What is the Percentage of Population Employed in Architecture & Engineering in the United States?
Percentage of Population Employed in Architecture & Engineering in the United States is 2.1%.