Zip Codes with the Highest Percentage of Population Employed in Architecture & Engineering in Urbandale, IA
RELATED REPORTS & OPTIONS
Architecture & Engineering
Urbandale
Compare Zip Codes
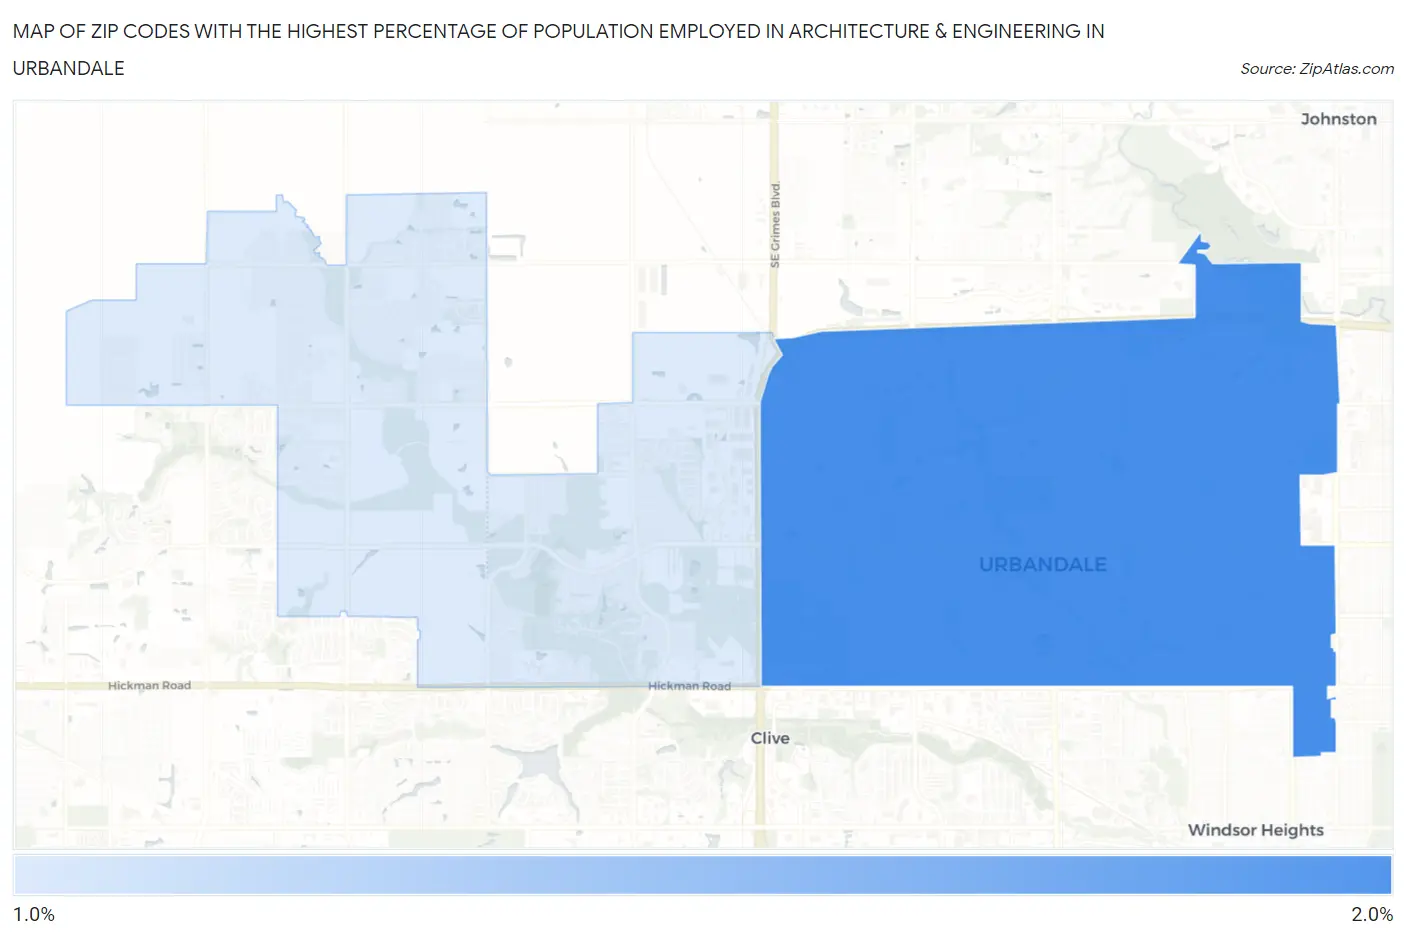
Map of Zip Codes with the Highest Percentage of Population Employed in Architecture & Engineering in Urbandale
1.5%
1.5%
Zip Codes with the Highest Percentage of Population Employed in Architecture & Engineering in Urbandale, IA
| Zip Code | % Employed | vs State | vs National | |
| 1. | 50322 | 1.5% | 1.8%(-0.235)#293 | 2.1%(-0.601)#12,510 |
| 2. | 50323 | 1.5% | 1.8%(-0.319)#305 | 2.1%(-0.685)#13,132 |
1
Common Questions
What are the Top Zip Codes with the Highest Percentage of Population Employed in Architecture & Engineering in Urbandale, IA?
Top Zip Codes with the Highest Percentage of Population Employed in Architecture & Engineering in Urbandale, IA are:
What zip code has the Highest Percentage of Population Employed in Architecture & Engineering in Urbandale, IA?
50322 has the Highest Percentage of Population Employed in Architecture & Engineering in Urbandale, IA with 1.5%.
What is the Percentage of Population Employed in Architecture & Engineering in Urbandale, IA?
Percentage of Population Employed in Architecture & Engineering in Urbandale is 1.6%.
What is the Percentage of Population Employed in Architecture & Engineering in Iowa?
Percentage of Population Employed in Architecture & Engineering in Iowa is 1.8%.
What is the Percentage of Population Employed in Architecture & Engineering in the United States?
Percentage of Population Employed in Architecture & Engineering in the United States is 2.1%.