Zip Codes with the Highest Percentage of Population Employed in Architecture & Engineering in Iowa City, IA
RELATED REPORTS & OPTIONS
Architecture & Engineering
Iowa City
Compare Zip Codes
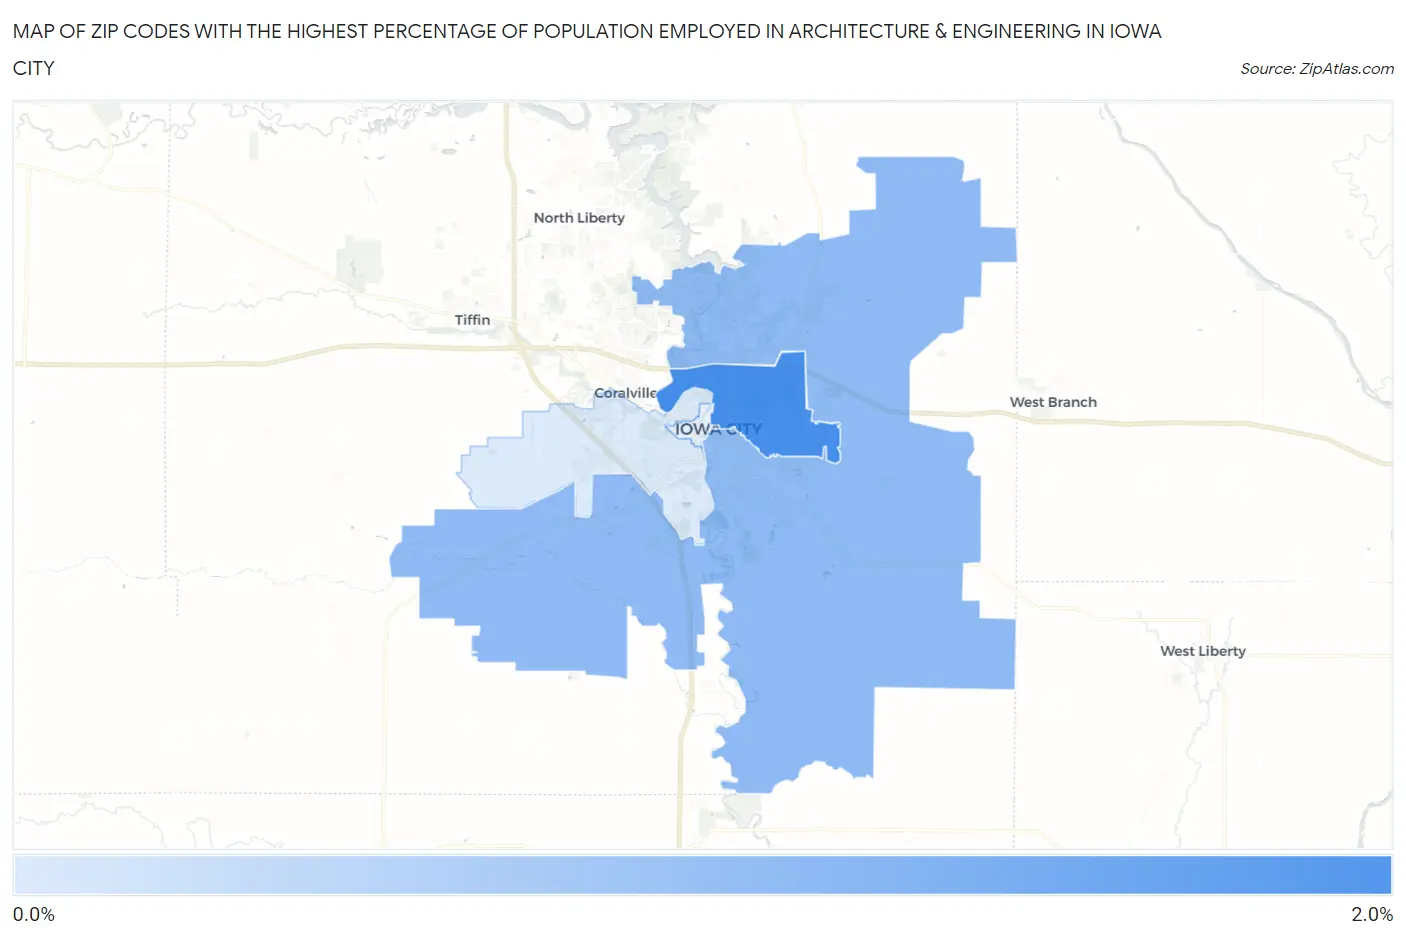
Map of Zip Codes with the Highest Percentage of Population Employed in Architecture & Engineering in Iowa City
0.90%
2.0%
Zip Codes with the Highest Percentage of Population Employed in Architecture & Engineering in Iowa City, IA
| Zip Code | % Employed | vs State | vs National | |
| 1. | 52245 | 2.0% | 1.8%(+0.198)#228 | 2.1%(-0.168)#9,732 |
| 2. | 52240 | 1.5% | 1.8%(-0.329)#306 | 2.1%(-0.695)#13,206 |
| 3. | 52246 | 0.90% | 1.8%(-0.887)#437 | 2.1%(-1.25)#17,399 |
1
Common Questions
What are the Top 3 Zip Codes with the Highest Percentage of Population Employed in Architecture & Engineering in Iowa City, IA?
Top 3 Zip Codes with the Highest Percentage of Population Employed in Architecture & Engineering in Iowa City, IA are:
What zip code has the Highest Percentage of Population Employed in Architecture & Engineering in Iowa City, IA?
52245 has the Highest Percentage of Population Employed in Architecture & Engineering in Iowa City, IA with 2.0%.
What is the Percentage of Population Employed in Architecture & Engineering in Iowa City, IA?
Percentage of Population Employed in Architecture & Engineering in Iowa City is 1.4%.
What is the Percentage of Population Employed in Architecture & Engineering in Iowa?
Percentage of Population Employed in Architecture & Engineering in Iowa is 1.8%.
What is the Percentage of Population Employed in Architecture & Engineering in the United States?
Percentage of Population Employed in Architecture & Engineering in the United States is 2.1%.