Zip Codes with the Highest Percentage of Population Employed in Architecture & Engineering in Cedar Rapids, IA
RELATED REPORTS & OPTIONS
Architecture & Engineering
Cedar Rapids
Compare Zip Codes
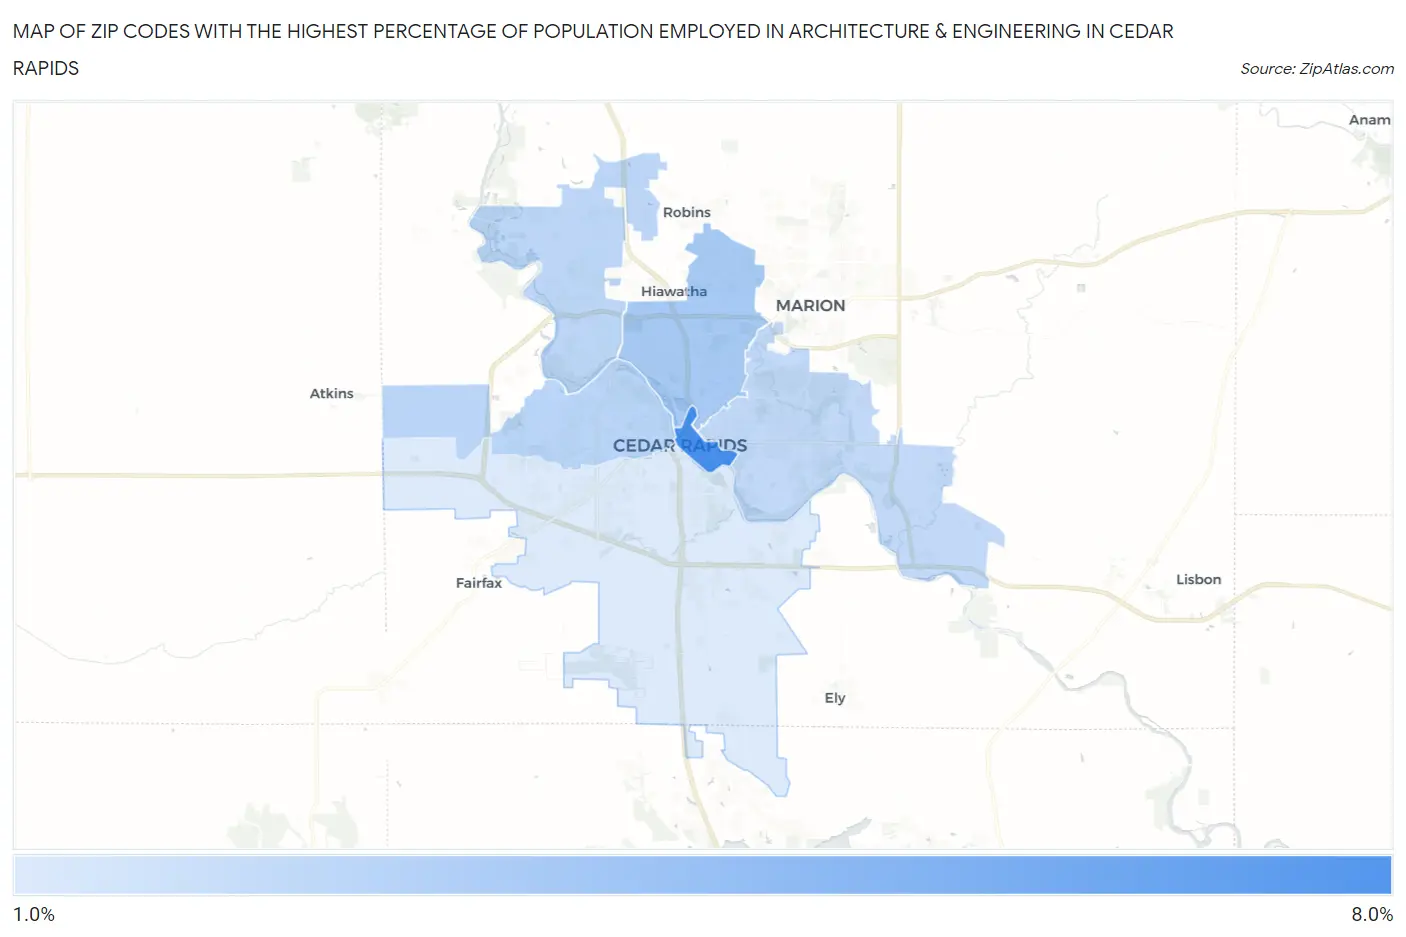
Map of Zip Codes with the Highest Percentage of Population Employed in Architecture & Engineering in Cedar Rapids
1.8%
7.2%
Zip Codes with the Highest Percentage of Population Employed in Architecture & Engineering in Cedar Rapids, IA
| Zip Code | % Employed | vs State | vs National | |
| 1. | 52401 | 7.2% | 1.8%(+5.45)#20 | 2.1%(+5.08)#702 |
| 2. | 52402 | 3.6% | 1.8%(+1.86)#89 | 2.1%(+1.49)#3,429 |
| 3. | 52405 | 3.0% | 1.8%(+1.23)#125 | 2.1%(+0.868)#5,000 |
| 4. | 52411 | 2.9% | 1.8%(+1.11)#135 | 2.1%(+0.741)#5,451 |
| 5. | 52403 | 2.8% | 1.8%(+0.973)#145 | 2.1%(+0.607)#5,939 |
| 6. | 52404 | 1.8% | 1.8%(-0.015)#252 | 2.1%(-0.381)#11,019 |
1
Common Questions
What are the Top 5 Zip Codes with the Highest Percentage of Population Employed in Architecture & Engineering in Cedar Rapids, IA?
Top 5 Zip Codes with the Highest Percentage of Population Employed in Architecture & Engineering in Cedar Rapids, IA are:
What zip code has the Highest Percentage of Population Employed in Architecture & Engineering in Cedar Rapids, IA?
52401 has the Highest Percentage of Population Employed in Architecture & Engineering in Cedar Rapids, IA with 7.2%.
What is the Percentage of Population Employed in Architecture & Engineering in Cedar Rapids, IA?
Percentage of Population Employed in Architecture & Engineering in Cedar Rapids is 2.9%.
What is the Percentage of Population Employed in Architecture & Engineering in Iowa?
Percentage of Population Employed in Architecture & Engineering in Iowa is 1.8%.
What is the Percentage of Population Employed in Architecture & Engineering in the United States?
Percentage of Population Employed in Architecture & Engineering in the United States is 2.1%.