Zip Codes with the Highest Percentage of Population Employed in Architecture & Engineering in Waterloo, IA
RELATED REPORTS & OPTIONS
Architecture & Engineering
Waterloo
Compare Zip Codes
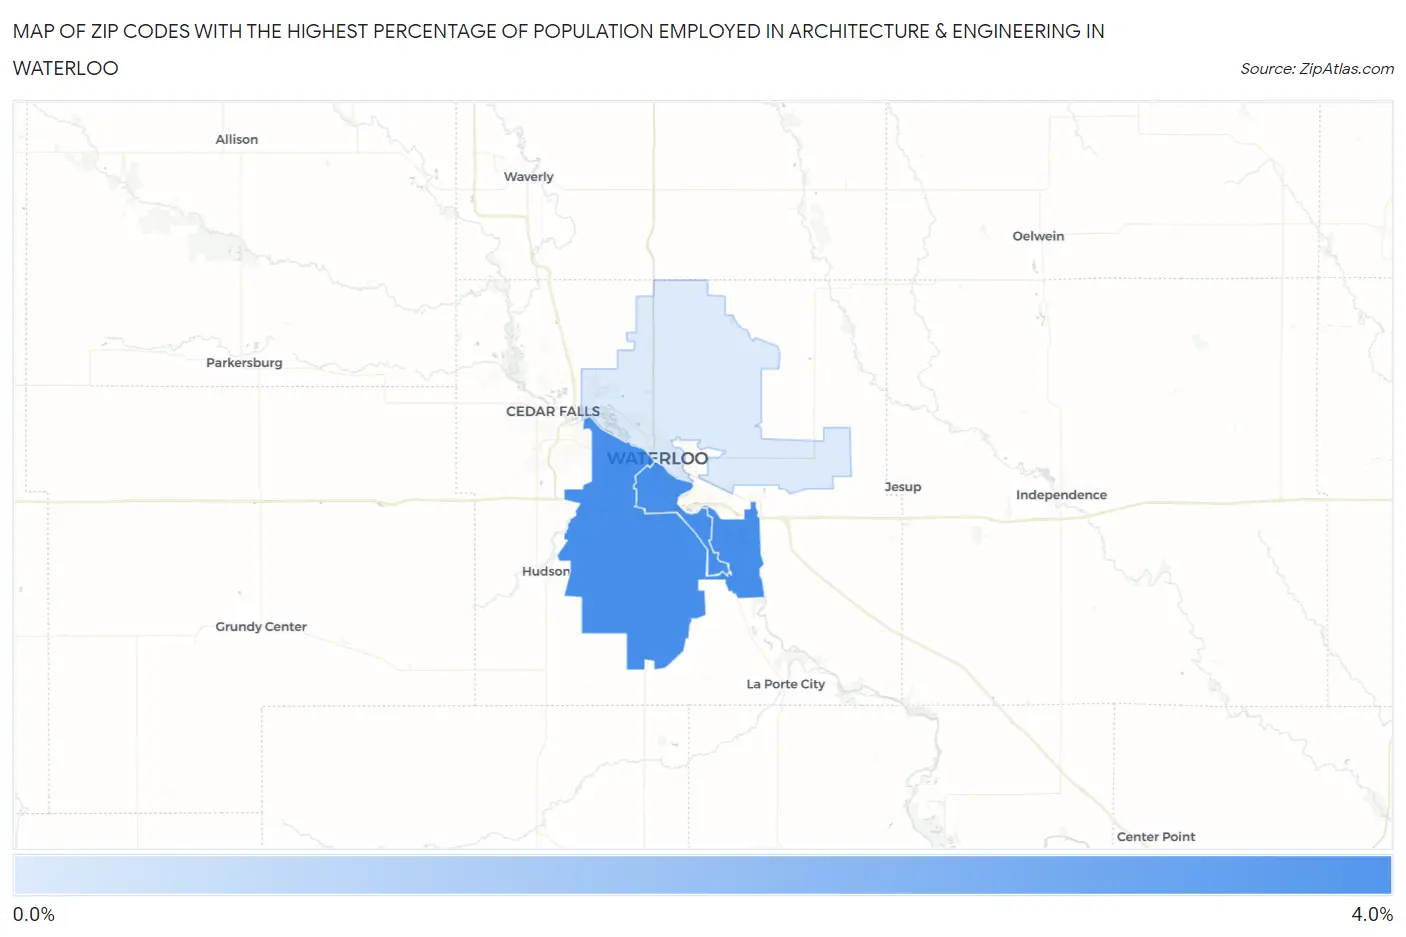
Map of Zip Codes with the Highest Percentage of Population Employed in Architecture & Engineering in Waterloo
0.45%
3.9%
Zip Codes with the Highest Percentage of Population Employed in Architecture & Engineering in Waterloo, IA
| Zip Code | % Employed | vs State | vs National | |
| 1. | 50701 | 3.9% | 1.8%(+2.11)#74 | 2.1%(+1.74)#2,952 |
| 2. | 50702 | 3.9% | 1.8%(+2.10)#75 | 2.1%(+1.73)#2,964 |
| 3. | 50703 | 0.45% | 1.8%(-1.34)#551 | 2.1%(-1.70)#20,600 |
1
Common Questions
What are the Top Zip Codes with the Highest Percentage of Population Employed in Architecture & Engineering in Waterloo, IA?
Top Zip Codes with the Highest Percentage of Population Employed in Architecture & Engineering in Waterloo, IA are:
What zip code has the Highest Percentage of Population Employed in Architecture & Engineering in Waterloo, IA?
50701 has the Highest Percentage of Population Employed in Architecture & Engineering in Waterloo, IA with 3.9%.
What is the Percentage of Population Employed in Architecture & Engineering in Waterloo, IA?
Percentage of Population Employed in Architecture & Engineering in Waterloo is 2.8%.
What is the Percentage of Population Employed in Architecture & Engineering in Iowa?
Percentage of Population Employed in Architecture & Engineering in Iowa is 1.8%.
What is the Percentage of Population Employed in Architecture & Engineering in the United States?
Percentage of Population Employed in Architecture & Engineering in the United States is 2.1%.