Zip Codes with the Highest Percentage of Population Employed in Architecture & Engineering in Sioux City, IA
RELATED REPORTS & OPTIONS
Architecture & Engineering
Sioux City
Compare Zip Codes
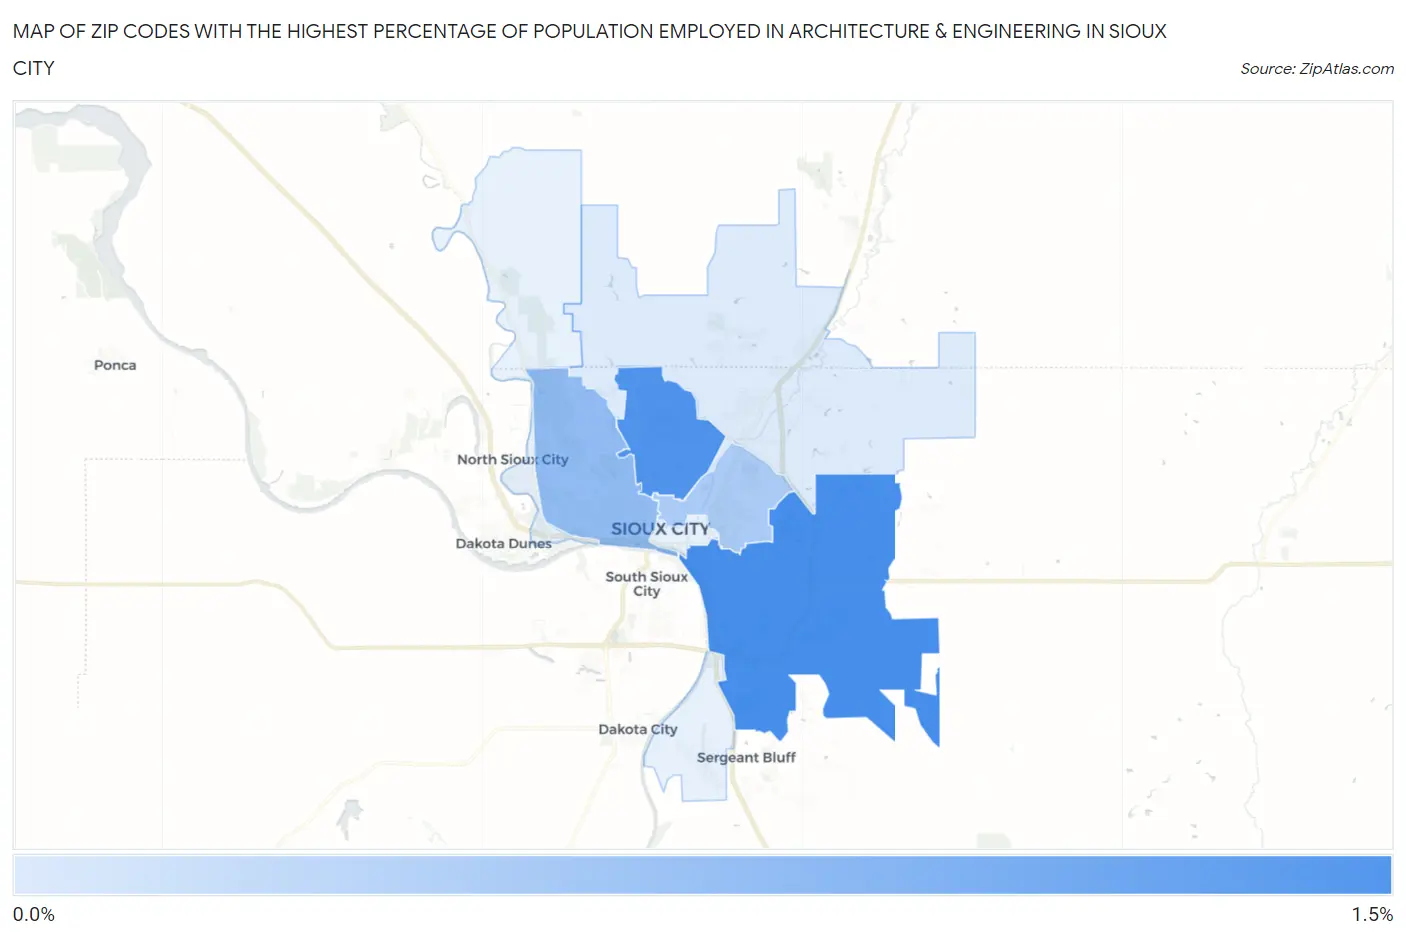
Map of Zip Codes with the Highest Percentage of Population Employed in Architecture & Engineering in Sioux City
0.13%
1.3%
Zip Codes with the Highest Percentage of Population Employed in Architecture & Engineering in Sioux City, IA
| Zip Code | % Employed | vs State | vs National | |
| 1. | 51106 | 1.3% | 1.8%(-0.522)#344 | 2.1%(-0.888)#14,594 |
| 2. | 51104 | 1.2% | 1.8%(-0.583)#366 | 2.1%(-0.949)#15,067 |
| 3. | 51103 | 0.69% | 1.8%(-1.09)#478 | 2.1%(-1.46)#18,940 |
| 4. | 51105 | 0.51% | 1.8%(-1.27)#530 | 2.1%(-1.64)#20,186 |
| 5. | 51108 | 0.13% | 1.8%(-1.66)#623 | 2.1%(-2.02)#22,319 |
1
Common Questions
What are the Top 5 Zip Codes with the Highest Percentage of Population Employed in Architecture & Engineering in Sioux City, IA?
Top 5 Zip Codes with the Highest Percentage of Population Employed in Architecture & Engineering in Sioux City, IA are:
What zip code has the Highest Percentage of Population Employed in Architecture & Engineering in Sioux City, IA?
51106 has the Highest Percentage of Population Employed in Architecture & Engineering in Sioux City, IA with 1.3%.
What is the Percentage of Population Employed in Architecture & Engineering in Sioux City, IA?
Percentage of Population Employed in Architecture & Engineering in Sioux City is 0.84%.
What is the Percentage of Population Employed in Architecture & Engineering in Iowa?
Percentage of Population Employed in Architecture & Engineering in Iowa is 1.8%.
What is the Percentage of Population Employed in Architecture & Engineering in the United States?
Percentage of Population Employed in Architecture & Engineering in the United States is 2.1%.