Zip Codes with the Highest Percentage of Population Employed in Architecture & Engineering in West Des Moines, IA
RELATED REPORTS & OPTIONS
Architecture & Engineering
West Des Moines
Compare Zip Codes
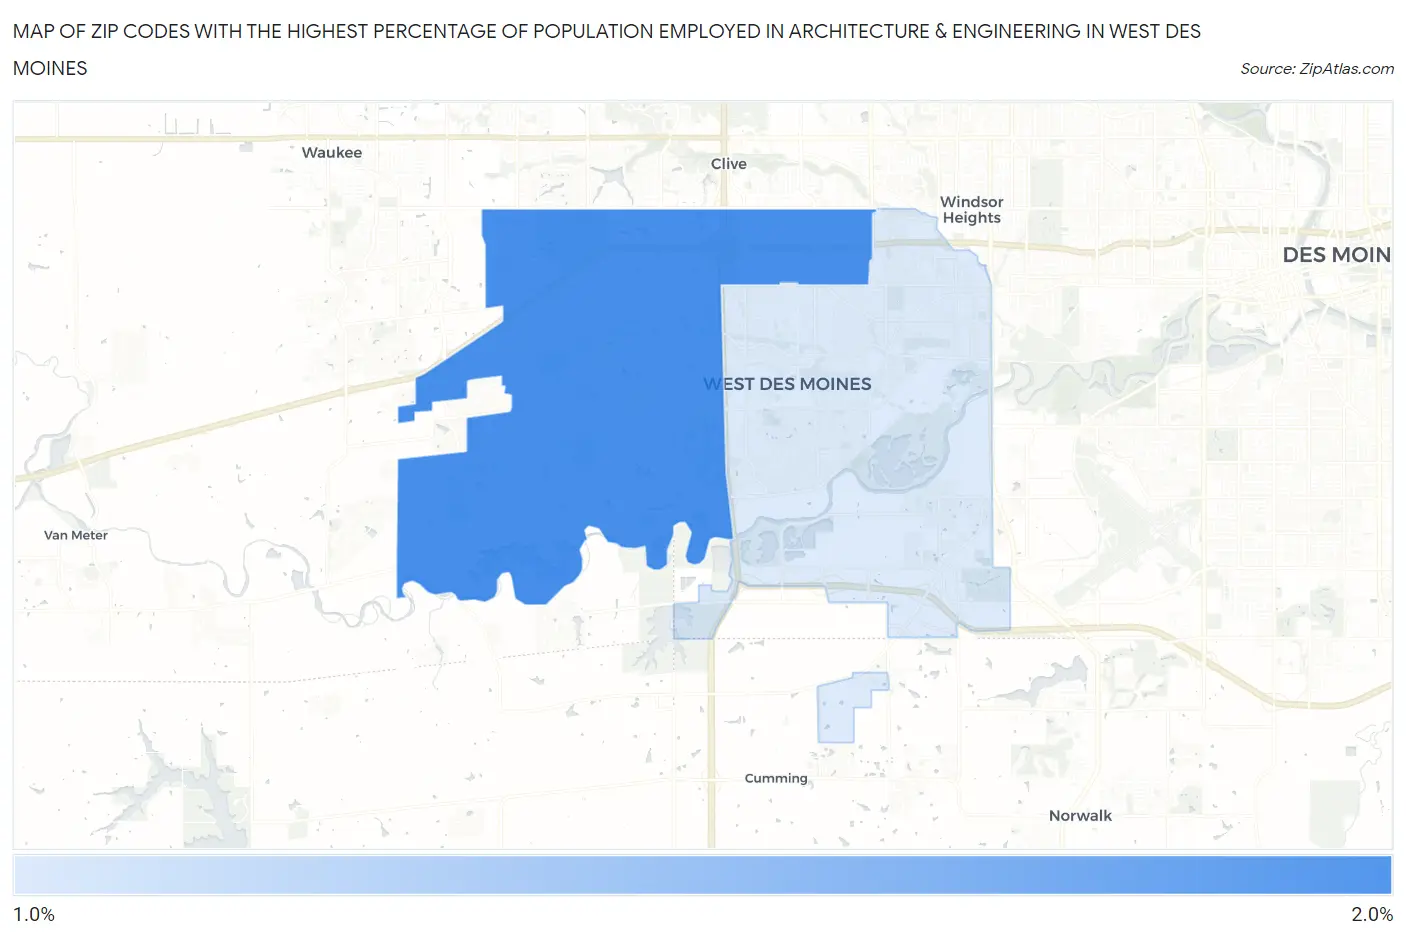
Map of Zip Codes with the Highest Percentage of Population Employed in Architecture & Engineering in West Des Moines
1.7%
1.8%
Zip Codes with the Highest Percentage of Population Employed in Architecture & Engineering in West Des Moines, IA
| Zip Code | % Employed | vs State | vs National | |
| 1. | 50266 | 1.8% | 1.8%(-0.020)#253 | 2.1%(-0.386)#11,051 |
| 2. | 50265 | 1.7% | 1.8%(-0.091)#266 | 2.1%(-0.457)#11,550 |
1
Common Questions
What are the Top Zip Codes with the Highest Percentage of Population Employed in Architecture & Engineering in West Des Moines, IA?
Top Zip Codes with the Highest Percentage of Population Employed in Architecture & Engineering in West Des Moines, IA are:
What zip code has the Highest Percentage of Population Employed in Architecture & Engineering in West Des Moines, IA?
50266 has the Highest Percentage of Population Employed in Architecture & Engineering in West Des Moines, IA with 1.8%.
What is the Percentage of Population Employed in Architecture & Engineering in West Des Moines, IA?
Percentage of Population Employed in Architecture & Engineering in West Des Moines is 1.7%.
What is the Percentage of Population Employed in Architecture & Engineering in Iowa?
Percentage of Population Employed in Architecture & Engineering in Iowa is 1.8%.
What is the Percentage of Population Employed in Architecture & Engineering in the United States?
Percentage of Population Employed in Architecture & Engineering in the United States is 2.1%.