Indian Rocks Beach, FL Map & Demographics
Indian Rocks Beach Map
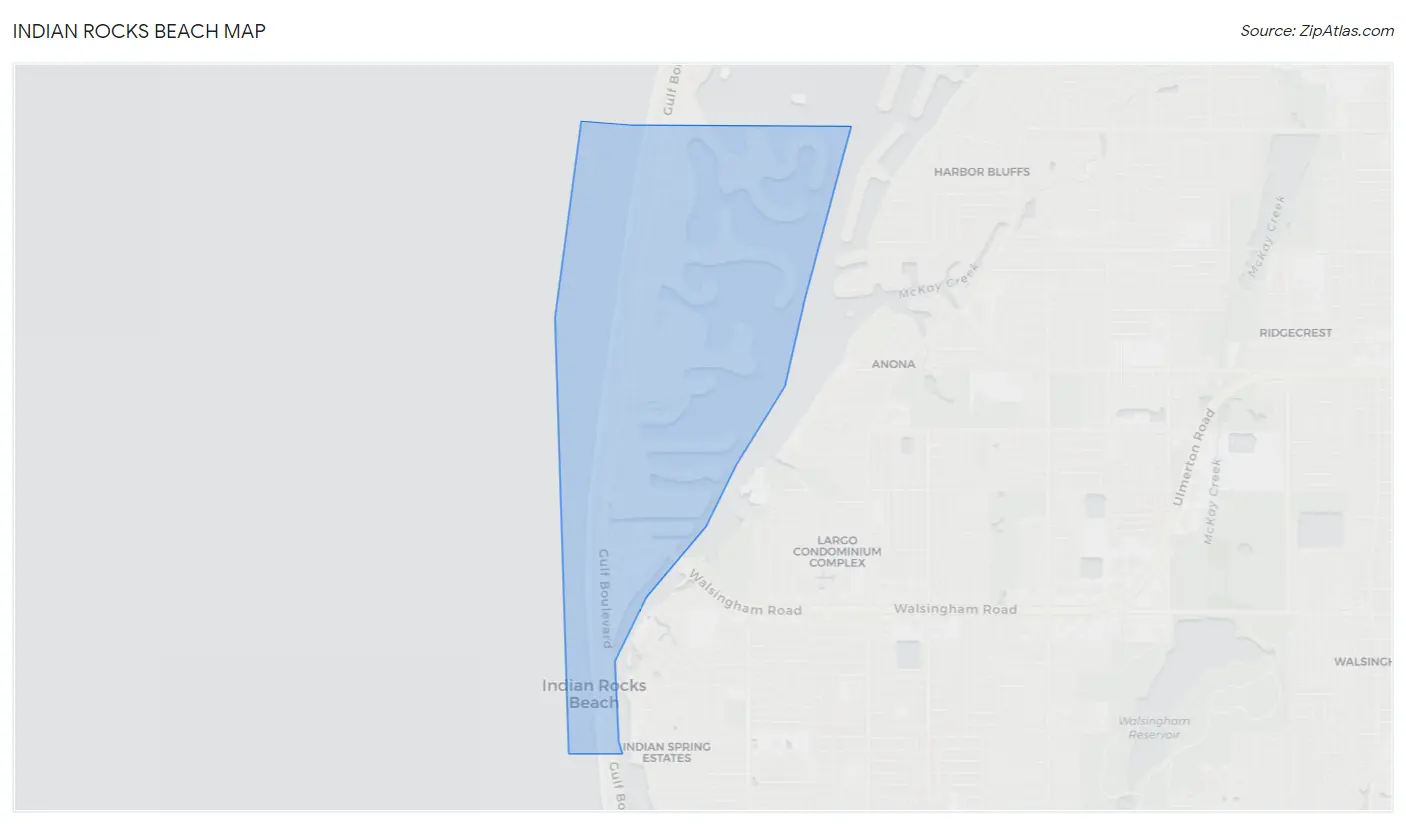
Indian Rocks Beach Overview
$68,585
PER CAPITA INCOME
$133,783
AVG FAMILY INCOME
$92,283
AVG HOUSEHOLD INCOME
39.8%
WAGE / INCOME GAP [ % ]
60.2¢/ $1
WAGE / INCOME GAP [ $ ]
0.49
INEQUALITY / GINI INDEX
3,689
TOTAL POPULATION
1,934
MALE POPULATION
1,755
FEMALE POPULATION
110.20
MALES / 100 FEMALES
90.74
FEMALES / 100 MALES
58.2
MEDIAN AGE
2.4
AVG FAMILY SIZE
2.0
AVG HOUSEHOLD SIZE
2,080
LABOR FORCE [ PEOPLE ]
58.9%
PERCENT IN LABOR FORCE
4.9%
UNEMPLOYMENT RATE
Indian Rocks Beach Zip Codes
Indian Rocks Beach Area Codes
Income in Indian Rocks Beach
Income Overview in Indian Rocks Beach
Per Capita Income in Indian Rocks Beach is $68,585, while median incomes of families and households are $133,783 and $92,283 respectively.
| Characteristic | Number | Measure |
| Per Capita Income | 3,689 | $68,585 |
| Median Family Income | 995 | $133,783 |
| Mean Family Income | 995 | $173,373 |
| Median Household Income | 1,840 | $92,283 |
| Mean Household Income | 1,840 | $132,613 |
| Income Deficit | 995 | $0 |
| Wage / Income Gap (%) | 3,689 | 39.78% |
| Wage / Income Gap ($) | 3,689 | 60.22¢ per $1 |
| Gini / Inequality Index | 3,689 | 0.49 |
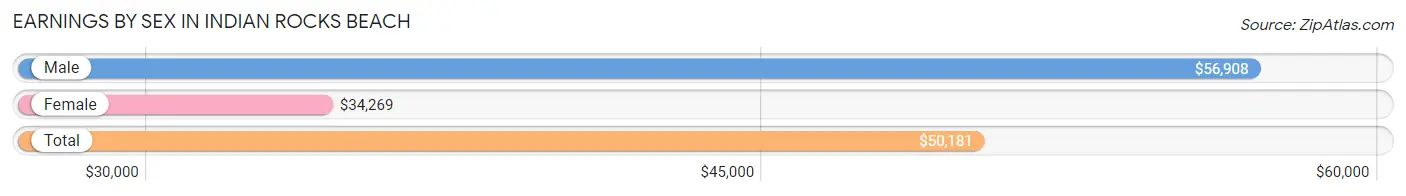
Earnings by Sex in Indian Rocks Beach
Average Earnings in Indian Rocks Beach are $50,181, $56,908 for men and $34,269 for women, a difference of 39.8%.
| Sex | Number | Average Earnings |
| Male | 1,133 (52.7%) | $56,908 |
| Female | 1,018 (47.3%) | $34,269 |
| Total | 2,151 (100.0%) | $50,181 |
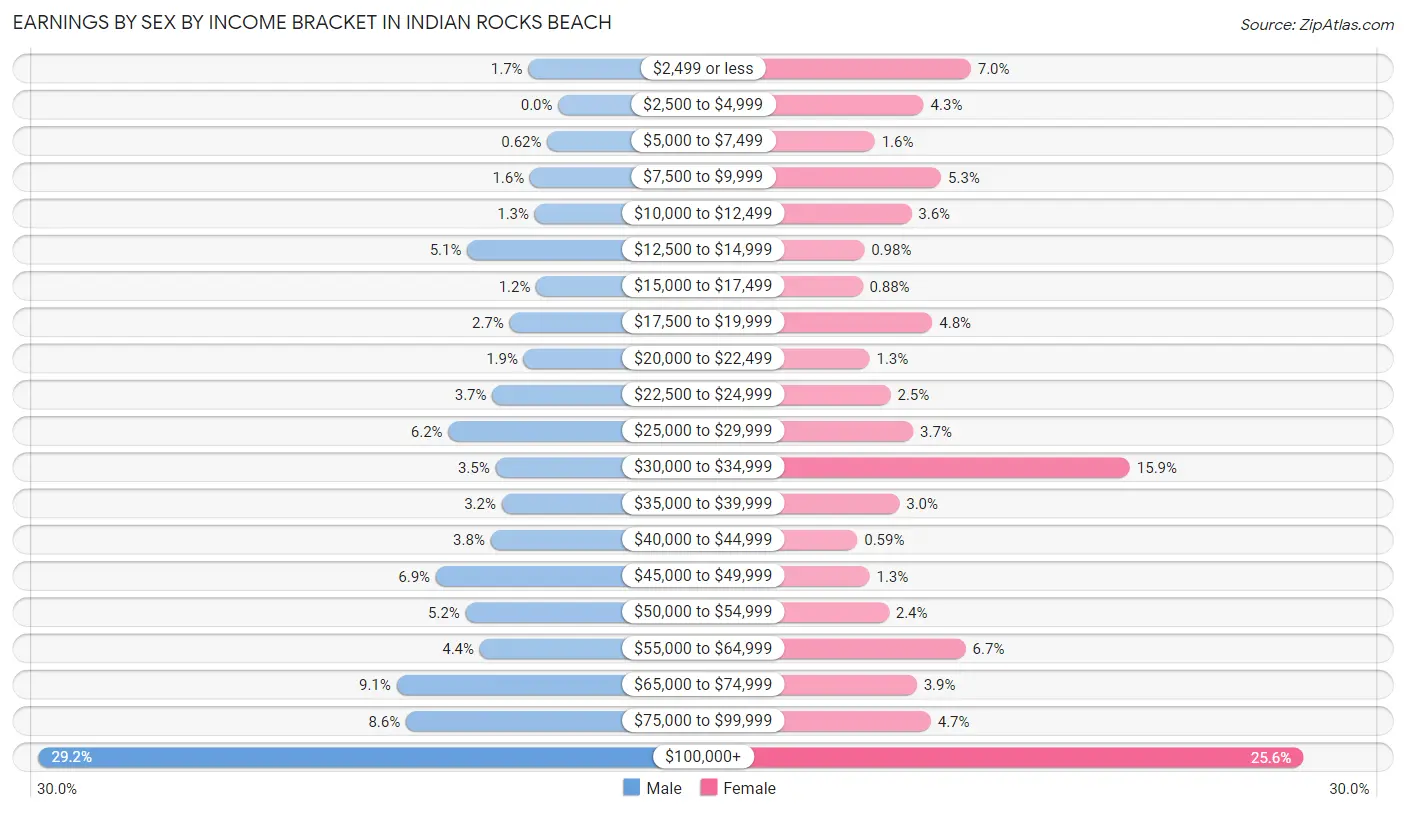
Earnings by Sex by Income Bracket in Indian Rocks Beach
The most common earnings brackets in Indian Rocks Beach are $100,000+ for men (331 | 29.2%) and $100,000+ for women (261 | 25.6%).
| Income | Male | Female |
| $2,499 or less | 19 (1.7%) | 71 (7.0%) |
| $2,500 to $4,999 | 0 (0.0%) | 44 (4.3%) |
| $5,000 to $7,499 | 7 (0.6%) | 16 (1.6%) |
| $7,500 to $9,999 | 18 (1.6%) | 54 (5.3%) |
| $10,000 to $12,499 | 15 (1.3%) | 37 (3.6%) |
| $12,500 to $14,999 | 58 (5.1%) | 10 (1.0%) |
| $15,000 to $17,499 | 14 (1.2%) | 9 (0.9%) |
| $17,500 to $19,999 | 31 (2.7%) | 49 (4.8%) |
| $20,000 to $22,499 | 22 (1.9%) | 13 (1.3%) |
| $22,500 to $24,999 | 42 (3.7%) | 25 (2.5%) |
| $25,000 to $29,999 | 70 (6.2%) | 38 (3.7%) |
| $30,000 to $34,999 | 40 (3.5%) | 162 (15.9%) |
| $35,000 to $39,999 | 36 (3.2%) | 30 (2.9%) |
| $40,000 to $44,999 | 43 (3.8%) | 6 (0.6%) |
| $45,000 to $49,999 | 78 (6.9%) | 13 (1.3%) |
| $50,000 to $54,999 | 59 (5.2%) | 24 (2.4%) |
| $55,000 to $64,999 | 50 (4.4%) | 68 (6.7%) |
| $65,000 to $74,999 | 103 (9.1%) | 40 (3.9%) |
| $75,000 to $99,999 | 97 (8.6%) | 48 (4.7%) |
| $100,000+ | 331 (29.2%) | 261 (25.6%) |
| Total | 1,133 (100.0%) | 1,018 (100.0%) |
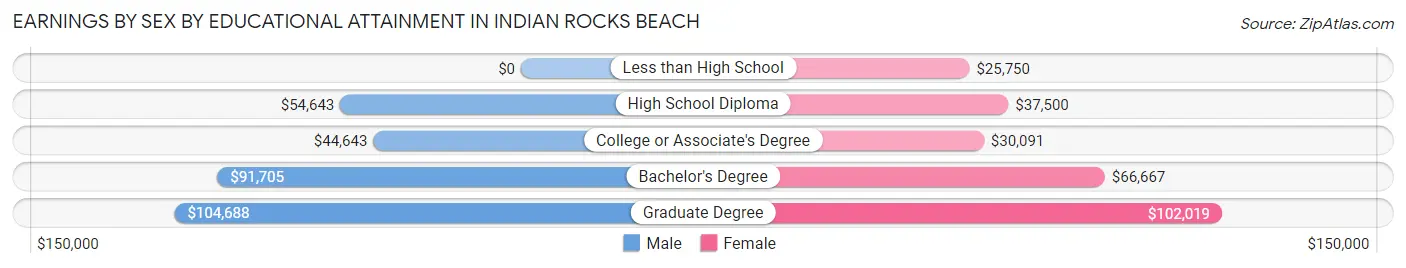
Earnings by Sex by Educational Attainment in Indian Rocks Beach
Average earnings in Indian Rocks Beach are $62,000 for men and $43,958 for women, a difference of 29.1%. Men with an educational attainment of graduate degree enjoy the highest average annual earnings of $104,688, while those with college or associate's degree education earn the least with $44,643. Women with an educational attainment of graduate degree earn the most with the average annual earnings of $102,019, while those with less than high school education have the smallest earnings of $25,750.
| Educational Attainment | Male Income | Female Income |
| Less than High School | - | - |
| High School Diploma | $54,643 | $37,500 |
| College or Associate's Degree | $44,643 | $30,091 |
| Bachelor's Degree | $91,705 | $66,667 |
| Graduate Degree | $104,688 | $102,019 |
| Total | $62,000 | $43,958 |
Family Income in Indian Rocks Beach
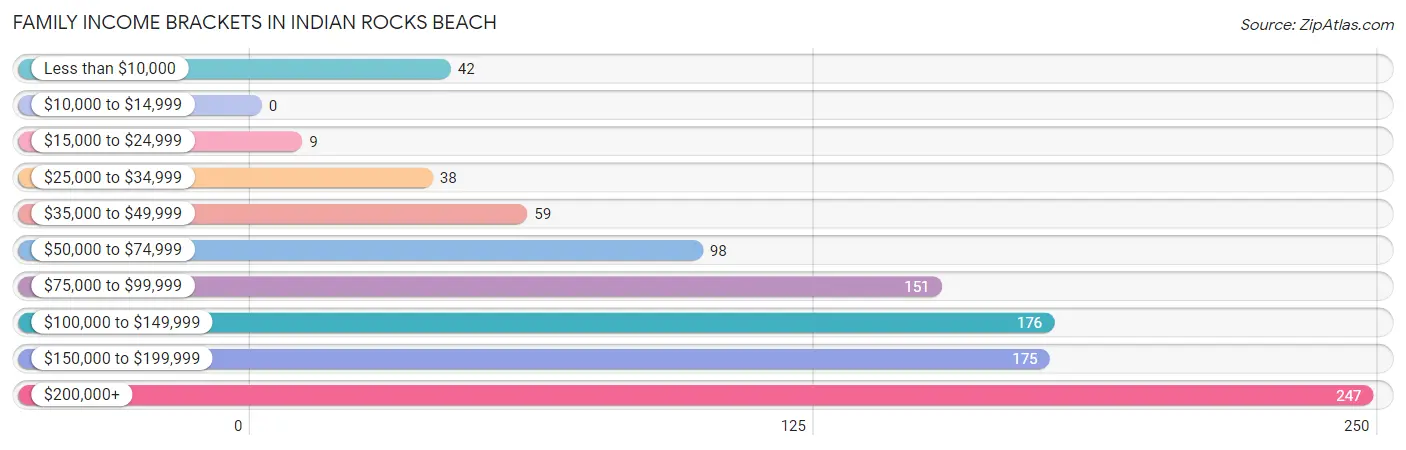
Family Income Brackets in Indian Rocks Beach
According to the Indian Rocks Beach family income data, there are 247 families falling into the $200,000+ income range, which is the most common income bracket and makes up 24.8% of all families.
| Income Bracket | # Families | % Families |
| Less than $10,000 | 42 | 4.2% |
| $10,000 to $14,999 | 0 | 0.0% |
| $15,000 to $24,999 | 9 | 0.9% |
| $25,000 to $34,999 | 38 | 3.8% |
| $35,000 to $49,999 | 59 | 5.9% |
| $50,000 to $74,999 | 98 | 9.8% |
| $75,000 to $99,999 | 151 | 15.2% |
| $100,000 to $149,999 | 176 | 17.7% |
| $150,000 to $199,999 | 175 | 17.6% |
| $200,000+ | 247 | 24.8% |
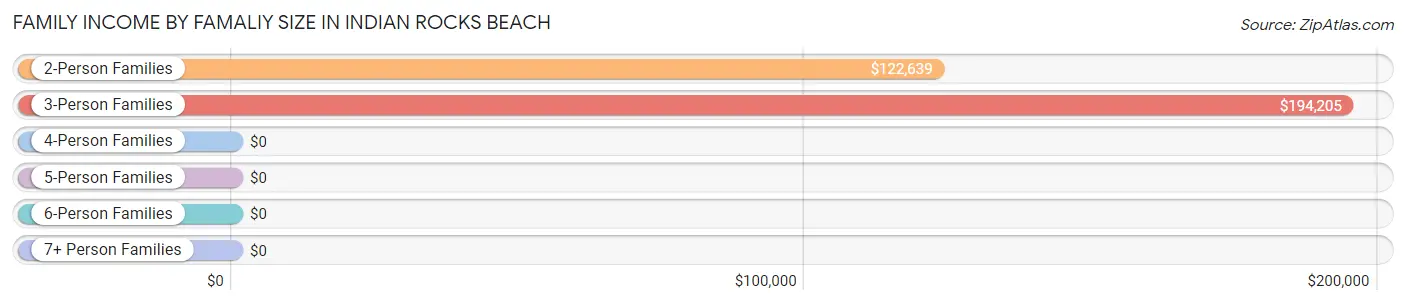
Family Income by Famaliy Size in Indian Rocks Beach
3-person families (117 | 11.8%) account for the highest median family income in Indian Rocks Beach with $194,205 per family, while 3-person families (117 | 11.8%) have the highest median income of $64,735 per family member.
| Income Bracket | # Families | Median Income |
| 2-Person Families | 801 (80.5%) | $122,639 |
| 3-Person Families | 117 (11.8%) | $194,205 |
| 4-Person Families | 64 (6.4%) | $0 |
| 5-Person Families | 8 (0.8%) | $0 |
| 6-Person Families | 5 (0.5%) | $0 |
| 7+ Person Families | 0 (0.0%) | $0 |
| Total | 995 (100.0%) | $133,783 |
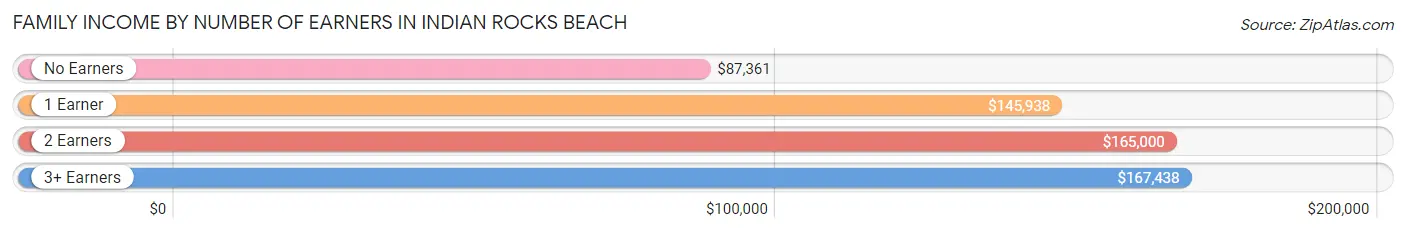
Family Income by Number of Earners in Indian Rocks Beach
The median family income in Indian Rocks Beach is $133,783, with families comprising 3+ earners (39) having the highest median family income of $167,438, while families with no earners (319) have the lowest median family income of $87,361, accounting for 3.9% and 32.1% of families, respectively.
| Number of Earners | # Families | Median Income |
| No Earners | 319 (32.1%) | $87,361 |
| 1 Earner | 229 (23.0%) | $145,938 |
| 2 Earners | 408 (41.0%) | $165,000 |
| 3+ Earners | 39 (3.9%) | $167,438 |
| Total | 995 (100.0%) | $133,783 |
Household Income in Indian Rocks Beach
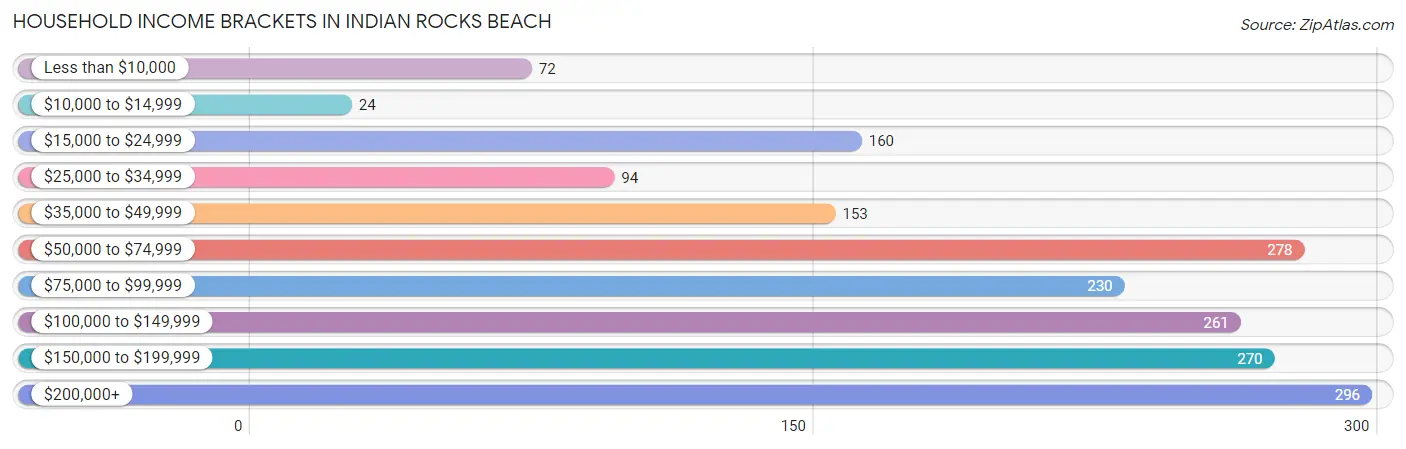
Household Income Brackets in Indian Rocks Beach
With 296 households falling in the category, the $200,000+ income range is the most frequent in Indian Rocks Beach, accounting for 16.1% of all households. In contrast, only 24 households (1.3%) fall into the $10,000 to $14,999 income bracket, making it the least populous group.
| Income Bracket | # Households | % Households |
| Less than $10,000 | 72 | 3.9% |
| $10,000 to $14,999 | 24 | 1.3% |
| $15,000 to $24,999 | 160 | 8.7% |
| $25,000 to $34,999 | 94 | 5.1% |
| $35,000 to $49,999 | 153 | 8.3% |
| $50,000 to $74,999 | 278 | 15.1% |
| $75,000 to $99,999 | 230 | 12.5% |
| $100,000 to $149,999 | 261 | 14.2% |
| $150,000 to $199,999 | 270 | 14.7% |
| $200,000+ | 296 | 16.1% |
Household Income by Householder Age in Indian Rocks Beach
The median household income in Indian Rocks Beach is $92,283, with the highest median household income of $127,891 found in the 45 to 64 years age bracket for the primary householder. A total of 773 households (42.0%) fall into this category. Meanwhile, the 15 to 24 years age bracket for the primary householder has the lowest median household income of $43,370, with 44 households (2.4%) in this group.
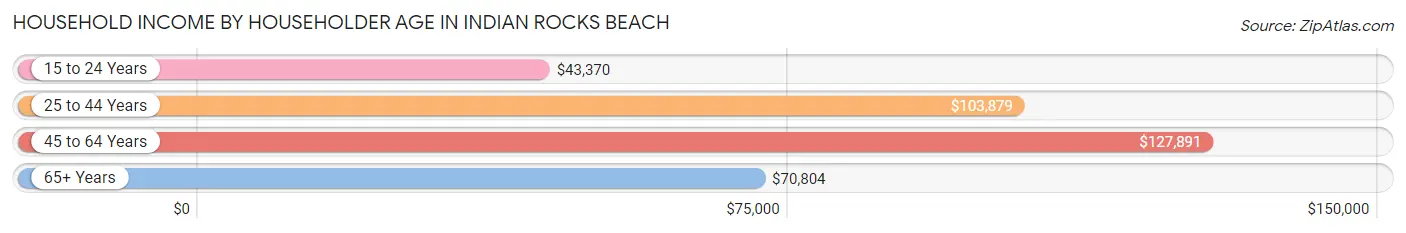
| Income Bracket | # Households | Median Income |
| 15 to 24 Years | 44 (2.4%) | $43,370 |
| 25 to 44 Years | 268 (14.6%) | $103,879 |
| 45 to 64 Years | 773 (42.0%) | $127,891 |
| 65+ Years | 755 (41.0%) | $70,804 |
| Total | 1,840 (100.0%) | $92,283 |
Poverty in Indian Rocks Beach
Income Below Poverty by Sex and Age in Indian Rocks Beach
With 7.9% poverty level for males and 10.2% for females among the residents of Indian Rocks Beach, 25 to 34 year old males and 15 year old females are the most vulnerable to poverty, with 17 males (17.9%) and 7 females (31.8%) in their respective age groups living below the poverty level.
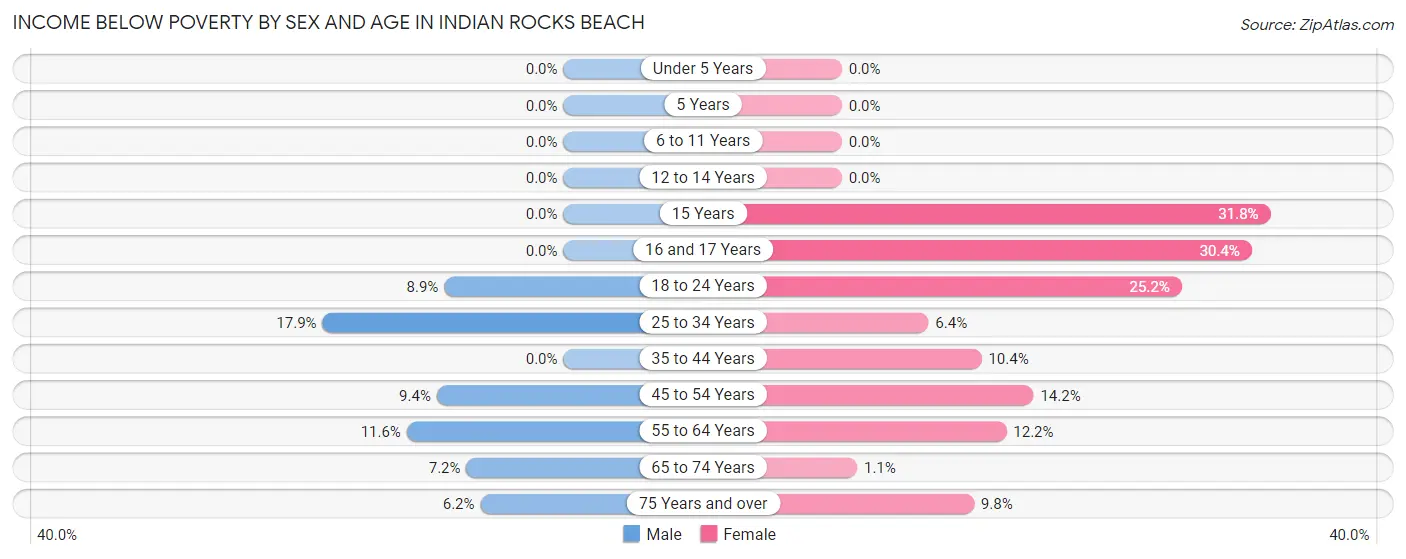
| Age Bracket | Male | Female |
| Under 5 Years | 0 (0.0%) | 0 (0.0%) |
| 5 Years | 0 (0.0%) | 0 (0.0%) |
| 6 to 11 Years | 0 (0.0%) | 0 (0.0%) |
| 12 to 14 Years | 0 (0.0%) | 0 (0.0%) |
| 15 Years | 0 (0.0%) | 7 (31.8%) |
| 16 and 17 Years | 0 (0.0%) | 7 (30.4%) |
| 18 to 24 Years | 10 (8.8%) | 27 (25.2%) |
| 25 to 34 Years | 17 (17.9%) | 9 (6.4%) |
| 35 to 44 Years | 0 (0.0%) | 17 (10.4%) |
| 45 to 54 Years | 30 (9.4%) | 37 (14.2%) |
| 55 to 64 Years | 50 (11.6%) | 50 (12.2%) |
| 65 to 74 Years | 28 (7.2%) | 4 (1.1%) |
| 75 Years and over | 17 (6.2%) | 21 (9.8%) |
| Total | 152 (7.9%) | 179 (10.2%) |
Income Above Poverty by Sex and Age in Indian Rocks Beach
According to the poverty statistics in Indian Rocks Beach, males aged under 5 years and females aged under 5 years are the age groups that are most secure financially, with 100.0% of males and 100.0% of females in these age groups living above the poverty line.
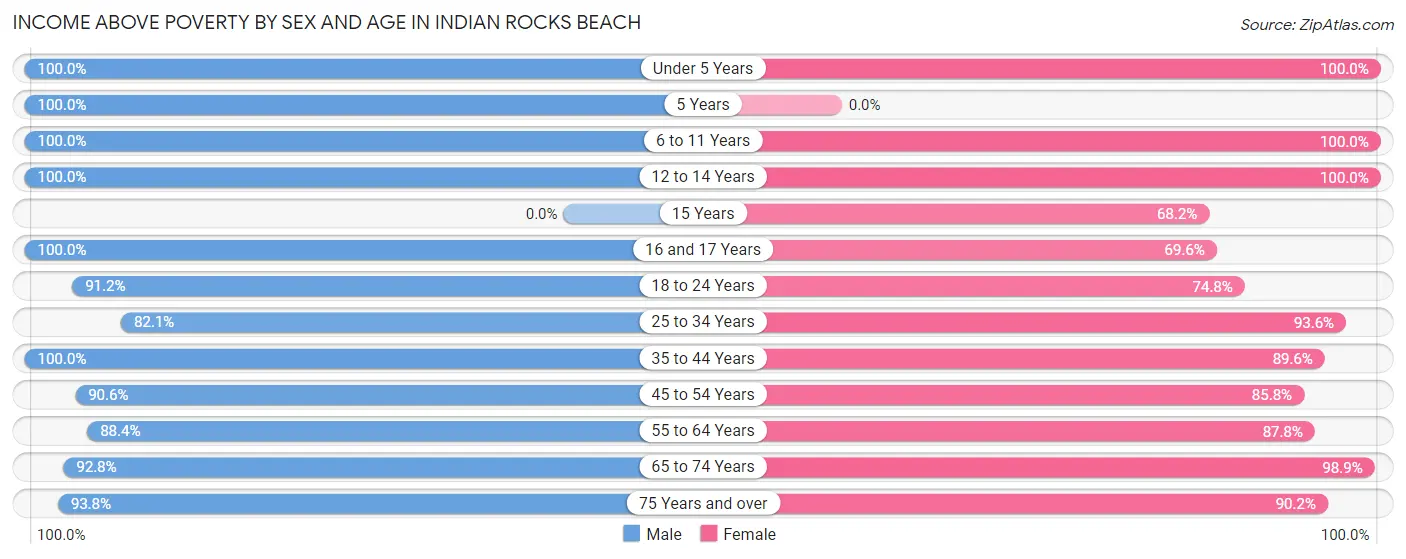
| Age Bracket | Male | Female |
| Under 5 Years | 8 (100.0%) | 31 (100.0%) |
| 5 Years | 18 (100.0%) | 0 (0.0%) |
| 6 to 11 Years | 30 (100.0%) | 22 (100.0%) |
| 12 to 14 Years | 16 (100.0%) | 10 (100.0%) |
| 15 Years | 0 (0.0%) | 15 (68.2%) |
| 16 and 17 Years | 53 (100.0%) | 16 (69.6%) |
| 18 to 24 Years | 103 (91.1%) | 80 (74.8%) |
| 25 to 34 Years | 78 (82.1%) | 131 (93.6%) |
| 35 to 44 Years | 187 (100.0%) | 147 (89.6%) |
| 45 to 54 Years | 289 (90.6%) | 223 (85.8%) |
| 55 to 64 Years | 380 (88.4%) | 359 (87.8%) |
| 65 to 74 Years | 361 (92.8%) | 349 (98.9%) |
| 75 Years and over | 259 (93.8%) | 193 (90.2%) |
| Total | 1,782 (92.1%) | 1,576 (89.8%) |
Income Below Poverty Among Married-Couple Families in Indian Rocks Beach
The poverty statistics for married-couple families in Indian Rocks Beach show that 3.5% or 31 of the total 877 families live below the poverty line. Families with 1 or 2 children have the highest poverty rate of 5.0%, comprising of 6 families. On the other hand, families with 3 or 4 children have the lowest poverty rate of 0.0%, which includes 0 families.
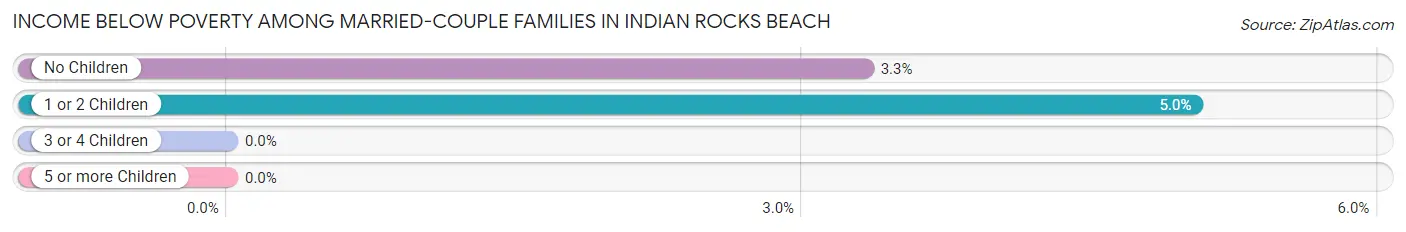
| Children | Above Poverty | Below Poverty |
| No Children | 728 (96.7%) | 25 (3.3%) |
| 1 or 2 Children | 113 (95.0%) | 6 (5.0%) |
| 3 or 4 Children | 5 (100.0%) | 0 (0.0%) |
| 5 or more Children | 0 (0.0%) | 0 (0.0%) |
| Total | 846 (96.5%) | 31 (3.5%) |
Income Below Poverty Among Single-Parent Households in Indian Rocks Beach
According to the poverty data in Indian Rocks Beach, 23.8% or 5 single-father households and 11.3% or 11 single-mother households are living below the poverty line. Among single-father households, those with no children have the highest poverty rate, with 5 households (23.8%) experiencing poverty. Likewise, among single-mother households, those with no children have the highest poverty rate, with 11 households (20.0%) falling below the poverty line.
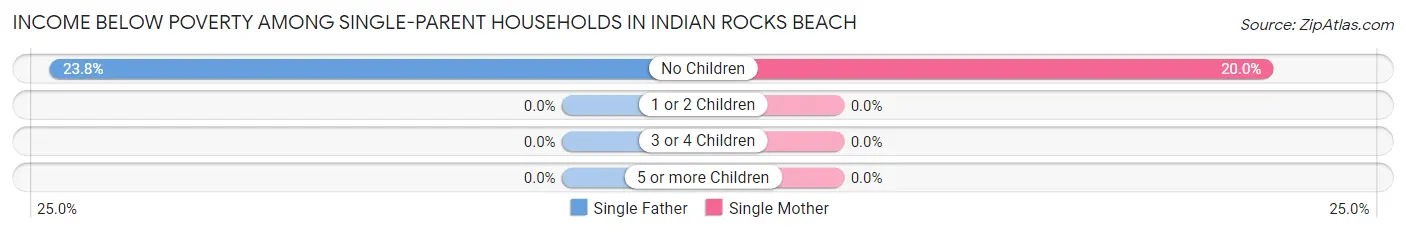
| Children | Single Father | Single Mother |
| No Children | 5 (23.8%) | 11 (20.0%) |
| 1 or 2 Children | 0 (0.0%) | 0 (0.0%) |
| 3 or 4 Children | 0 (0.0%) | 0 (0.0%) |
| 5 or more Children | 0 (0.0%) | 0 (0.0%) |
| Total | 5 (23.8%) | 11 (11.3%) |
Income Below Poverty Among Married-Couple vs Single-Parent Households in Indian Rocks Beach
The poverty data for Indian Rocks Beach shows that 31 of the married-couple family households (3.5%) and 16 of the single-parent households (13.6%) are living below the poverty level. Within the married-couple family households, those with 1 or 2 children have the highest poverty rate, with 6 households (5.0%) falling below the poverty line. Among the single-parent households, those with no children have the highest poverty rate, with 16 household (21.0%) living below poverty.
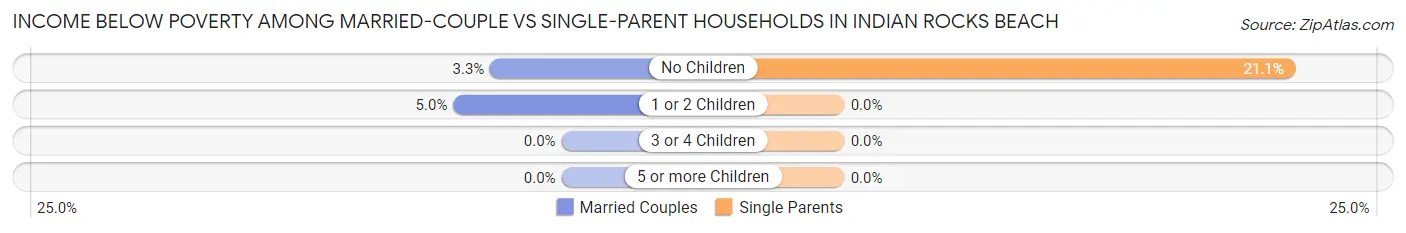
| Children | Married-Couple Families | Single-Parent Households |
| No Children | 25 (3.3%) | 16 (21.0%) |
| 1 or 2 Children | 6 (5.0%) | 0 (0.0%) |
| 3 or 4 Children | 0 (0.0%) | 0 (0.0%) |
| 5 or more Children | 0 (0.0%) | 0 (0.0%) |
| Total | 31 (3.5%) | 16 (13.6%) |
Race in Indian Rocks Beach
The most populous races in Indian Rocks Beach are White / Caucasian (3,262 | 88.4%), Hispanic or Latino (301 | 8.2%), and Two or more Races (161 | 4.4%).
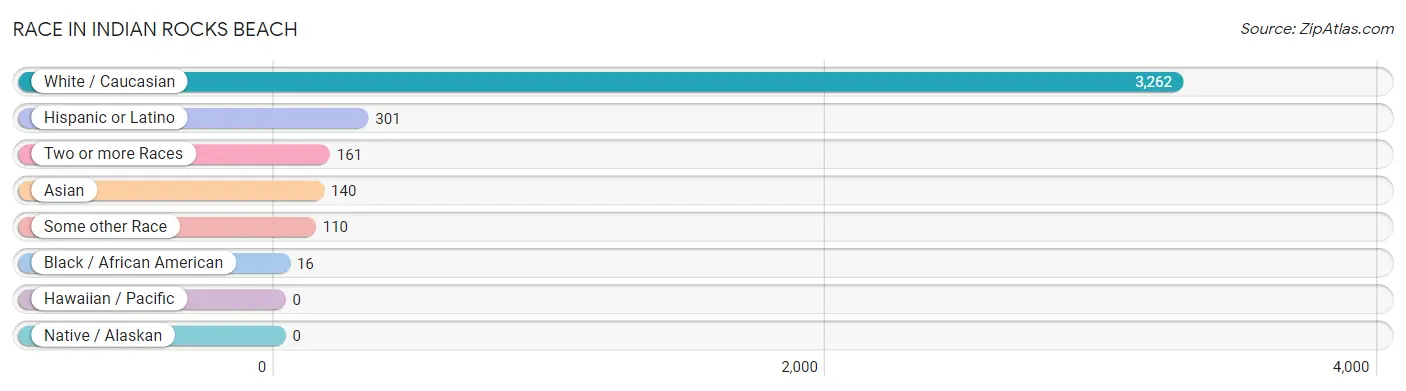
| Race | # Population | % Population |
| Asian | 140 | 3.8% |
| Black / African American | 16 | 0.4% |
| Hawaiian / Pacific | 0 | 0.0% |
| Hispanic or Latino | 301 | 8.2% |
| Native / Alaskan | 0 | 0.0% |
| White / Caucasian | 3,262 | 88.4% |
| Two or more Races | 161 | 4.4% |
| Some other Race | 110 | 3.0% |
| Total | 3,689 | 100.0% |
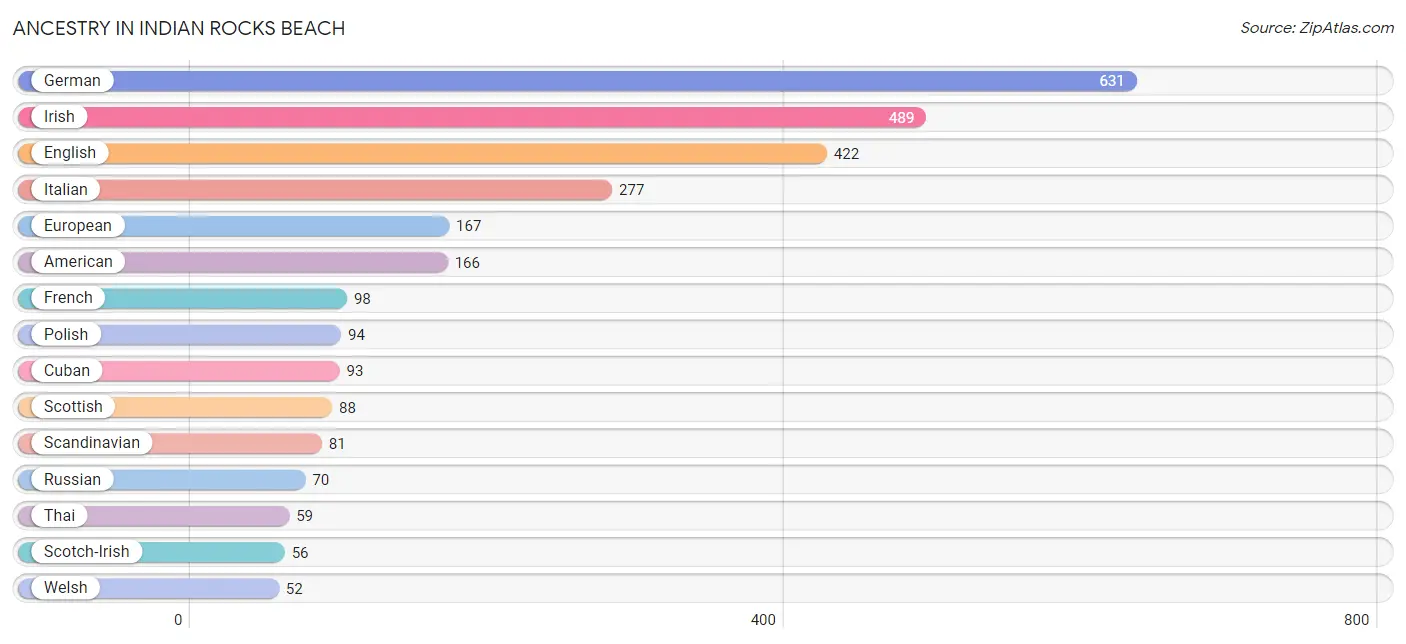
Ancestry in Indian Rocks Beach
The most populous ancestries reported in Indian Rocks Beach are German (631 | 17.1%), Irish (489 | 13.3%), English (422 | 11.4%), Italian (277 | 7.5%), and European (167 | 4.5%), together accounting for 53.8% of all Indian Rocks Beach residents.
| Ancestry | # Population | % Population |
| Alsatian | 5 | 0.1% |
| American | 166 | 4.5% |
| Arab | 20 | 0.5% |
| Argentinean | 4 | 0.1% |
| Austrian | 11 | 0.3% |
| Belgian | 24 | 0.6% |
| Brazilian | 8 | 0.2% |
| British | 45 | 1.2% |
| Canadian | 38 | 1.0% |
| Cherokee | 12 | 0.3% |
| Colombian | 12 | 0.3% |
| Croatian | 17 | 0.5% |
| Cuban | 93 | 2.5% |
| Czech | 17 | 0.5% |
| Czechoslovakian | 25 | 0.7% |
| Danish | 5 | 0.1% |
| Dominican | 17 | 0.5% |
| Dutch | 51 | 1.4% |
| Eastern European | 38 | 1.0% |
| Egyptian | 10 | 0.3% |
| English | 422 | 11.4% |
| European | 167 | 4.5% |
| Finnish | 20 | 0.5% |
| French | 98 | 2.7% |
| French Canadian | 8 | 0.2% |
| German | 631 | 17.1% |
| Greek | 22 | 0.6% |
| Indian (Asian) | 49 | 1.3% |
| Irish | 489 | 13.3% |
| Italian | 277 | 7.5% |
| Jamaican | 5 | 0.1% |
| Korean | 32 | 0.9% |
| Lebanese | 5 | 0.1% |
| Mexican | 17 | 0.5% |
| Norwegian | 42 | 1.1% |
| Polish | 94 | 2.5% |
| Portuguese | 8 | 0.2% |
| Puerto Rican | 23 | 0.6% |
| Romanian | 3 | 0.1% |
| Russian | 70 | 1.9% |
| Scandinavian | 81 | 2.2% |
| Scotch-Irish | 56 | 1.5% |
| Scottish | 88 | 2.4% |
| Serbian | 10 | 0.3% |
| Slovak | 7 | 0.2% |
| South African | 5 | 0.1% |
| South American | 16 | 0.4% |
| Spaniard | 30 | 0.8% |
| Spanish | 21 | 0.6% |
| Subsaharan African | 5 | 0.1% |
| Swedish | 25 | 0.7% |
| Swiss | 21 | 0.6% |
| Thai | 59 | 1.6% |
| Ukrainian | 6 | 0.2% |
| Welsh | 52 | 1.4% | View All 55 Rows |
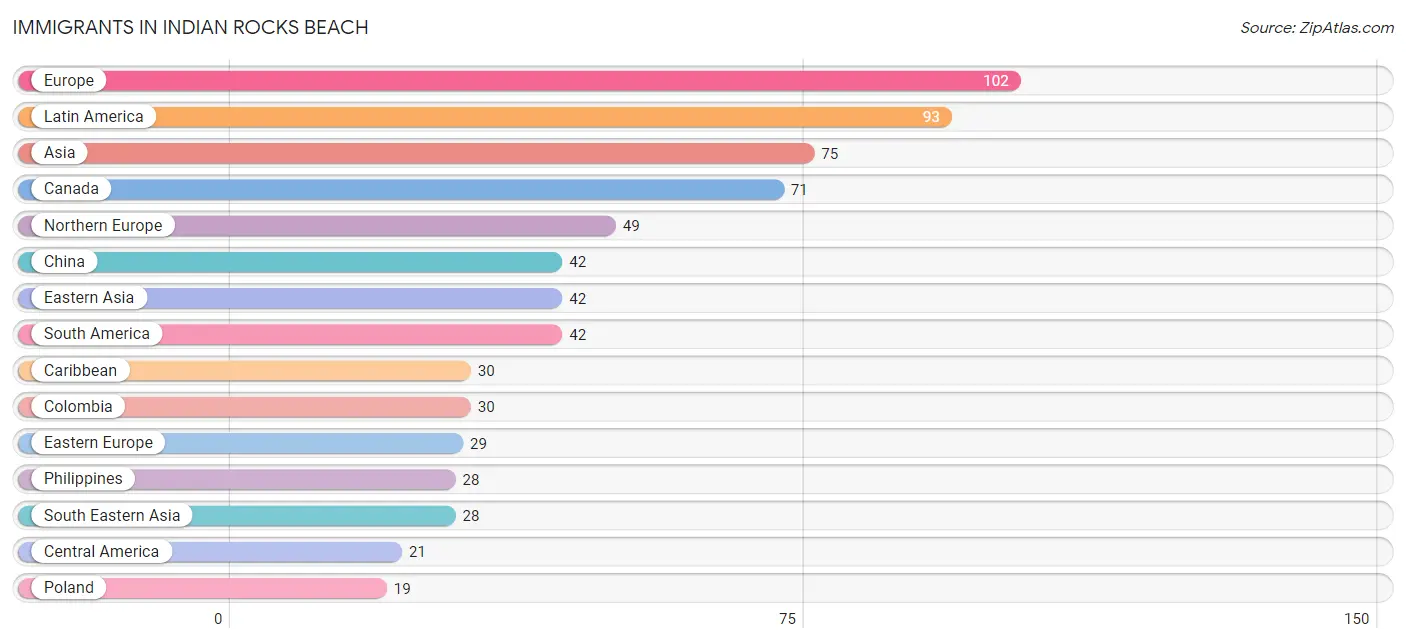
Immigrants in Indian Rocks Beach
The most numerous immigrant groups reported in Indian Rocks Beach came from Europe (102 | 2.8%), Latin America (93 | 2.5%), Asia (75 | 2.0%), Canada (71 | 1.9%), and Northern Europe (49 | 1.3%), together accounting for 10.6% of all Indian Rocks Beach residents.
| Immigration Origin | # Population | % Population |
| Argentina | 4 | 0.1% |
| Asia | 75 | 2.0% |
| Belize | 6 | 0.2% |
| Brazil | 8 | 0.2% |
| Canada | 71 | 1.9% |
| Caribbean | 30 | 0.8% |
| Central America | 21 | 0.6% |
| China | 42 | 1.1% |
| Colombia | 30 | 0.8% |
| Croatia | 5 | 0.1% |
| Cuba | 8 | 0.2% |
| Dominican Republic | 17 | 0.5% |
| Eastern Asia | 42 | 1.1% |
| Eastern Europe | 29 | 0.8% |
| England | 12 | 0.3% |
| Europe | 102 | 2.8% |
| France | 8 | 0.2% |
| Germany | 6 | 0.2% |
| Greece | 10 | 0.3% |
| Guatemala | 10 | 0.3% |
| India | 5 | 0.1% |
| Ireland | 7 | 0.2% |
| Latin America | 93 | 2.5% |
| Northern Europe | 49 | 1.3% |
| Panama | 5 | 0.1% |
| Philippines | 28 | 0.8% |
| Poland | 19 | 0.5% |
| Serbia | 5 | 0.1% |
| South America | 42 | 1.1% |
| South Central Asia | 5 | 0.1% |
| South Eastern Asia | 28 | 0.8% |
| Southern Europe | 10 | 0.3% |
| Trinidad and Tobago | 5 | 0.1% |
| Western Europe | 14 | 0.4% | View All 34 Rows |
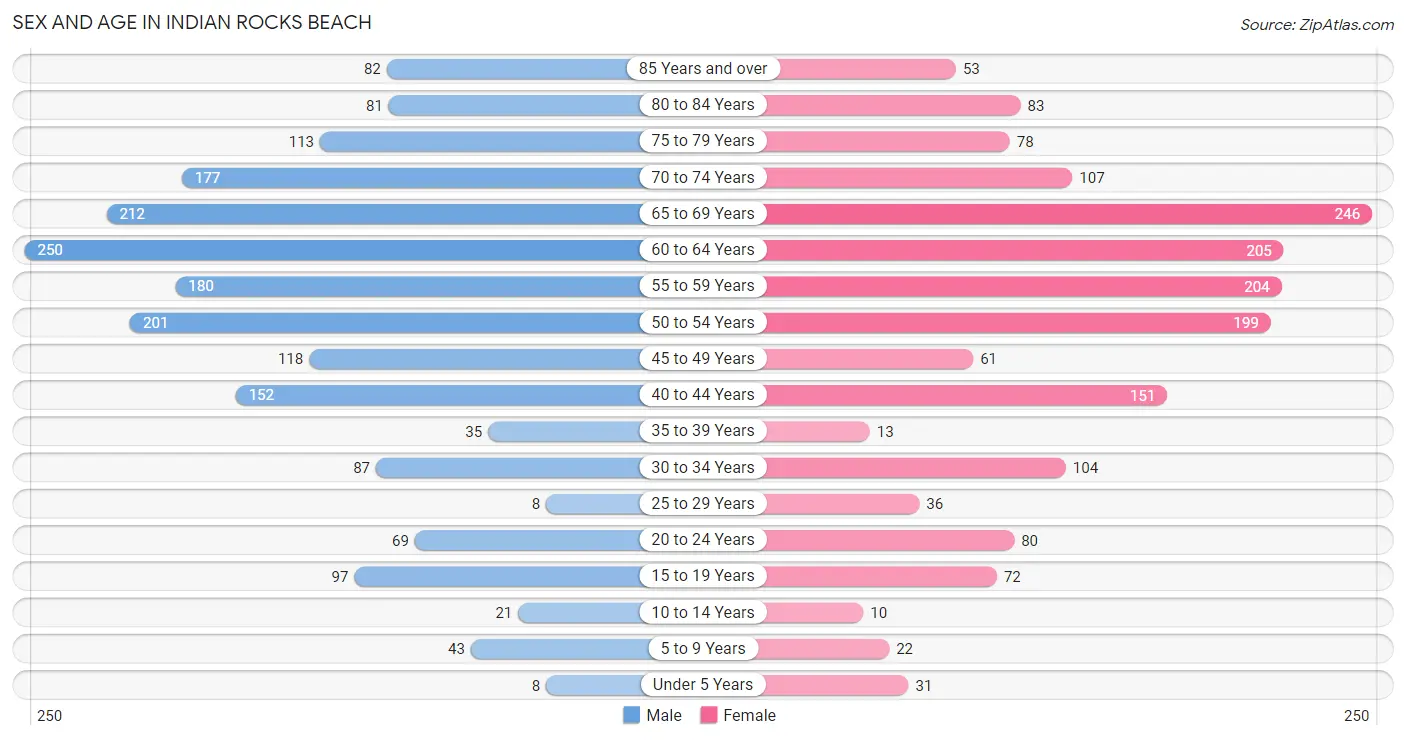
Sex and Age in Indian Rocks Beach
Sex and Age in Indian Rocks Beach
The most populous age groups in Indian Rocks Beach are 60 to 64 Years (250 | 12.9%) for men and 65 to 69 Years (246 | 14.0%) for women.
| Age Bracket | Male | Female |
| Under 5 Years | 8 (0.4%) | 31 (1.8%) |
| 5 to 9 Years | 43 (2.2%) | 22 (1.3%) |
| 10 to 14 Years | 21 (1.1%) | 10 (0.6%) |
| 15 to 19 Years | 97 (5.0%) | 72 (4.1%) |
| 20 to 24 Years | 69 (3.6%) | 80 (4.6%) |
| 25 to 29 Years | 8 (0.4%) | 36 (2.1%) |
| 30 to 34 Years | 87 (4.5%) | 104 (5.9%) |
| 35 to 39 Years | 35 (1.8%) | 13 (0.7%) |
| 40 to 44 Years | 152 (7.9%) | 151 (8.6%) |
| 45 to 49 Years | 118 (6.1%) | 61 (3.5%) |
| 50 to 54 Years | 201 (10.4%) | 199 (11.3%) |
| 55 to 59 Years | 180 (9.3%) | 204 (11.6%) |
| 60 to 64 Years | 250 (12.9%) | 205 (11.7%) |
| 65 to 69 Years | 212 (11.0%) | 246 (14.0%) |
| 70 to 74 Years | 177 (9.1%) | 107 (6.1%) |
| 75 to 79 Years | 113 (5.8%) | 78 (4.4%) |
| 80 to 84 Years | 81 (4.2%) | 83 (4.7%) |
| 85 Years and over | 82 (4.2%) | 53 (3.0%) |
| Total | 1,934 (100.0%) | 1,755 (100.0%) |
Families and Households in Indian Rocks Beach
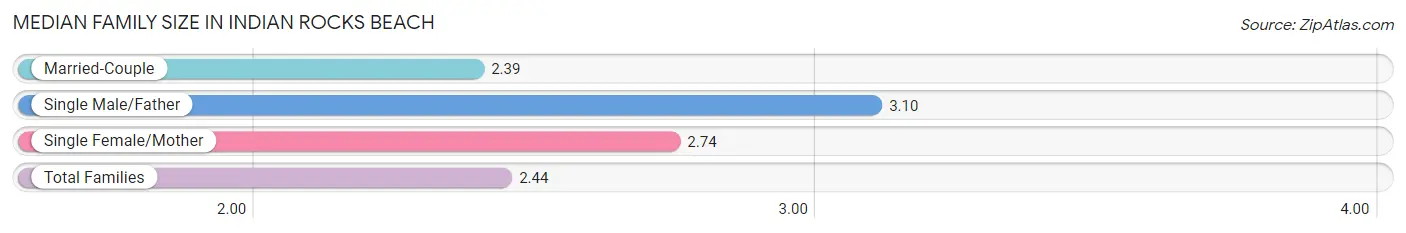
Median Family Size in Indian Rocks Beach
The median family size in Indian Rocks Beach is 2.44 persons per family, with single male/father families (21 | 2.1%) accounting for the largest median family size of 3.1 persons per family. On the other hand, married-couple families (877 | 88.1%) represent the smallest median family size with 2.39 persons per family.
| Family Type | # Families | Family Size |
| Married-Couple | 877 (88.1%) | 2.39 |
| Single Male/Father | 21 (2.1%) | 3.10 |
| Single Female/Mother | 97 (9.8%) | 2.74 |
| Total Families | 995 (100.0%) | 2.44 |
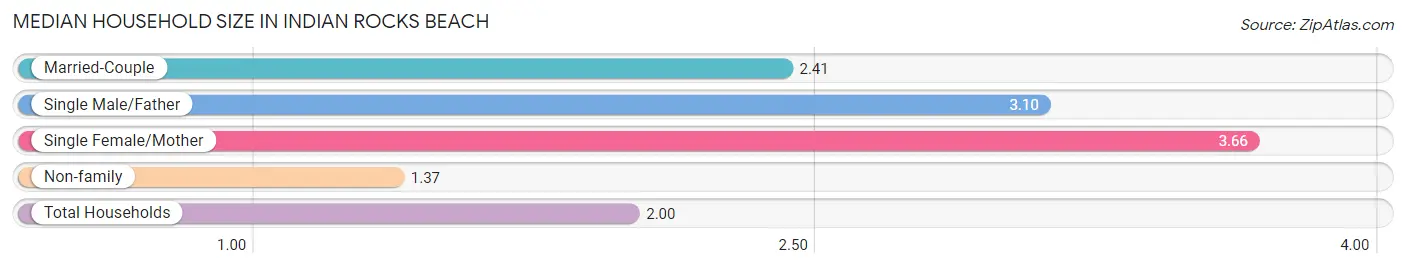
Median Household Size in Indian Rocks Beach
The median household size in Indian Rocks Beach is 2.00 persons per household, with single female/mother households (97 | 5.3%) accounting for the largest median household size of 3.66 persons per household. non-family households (845 | 45.9%) represent the smallest median household size with 1.37 persons per household.
| Household Type | # Households | Household Size |
| Married-Couple | 877 (47.7%) | 2.41 |
| Single Male/Father | 21 (1.1%) | 3.10 |
| Single Female/Mother | 97 (5.3%) | 3.66 |
| Non-family | 845 (45.9%) | 1.37 |
| Total Households | 1,840 (100.0%) | 2.00 |
Household Size by Marriage Status in Indian Rocks Beach
Out of a total of 1,840 households in Indian Rocks Beach, 995 (54.1%) are family households, while 845 (45.9%) are nonfamily households. The most numerous type of family households are 2-person households, comprising 767, and the most common type of nonfamily households are 1-person households, comprising 591.
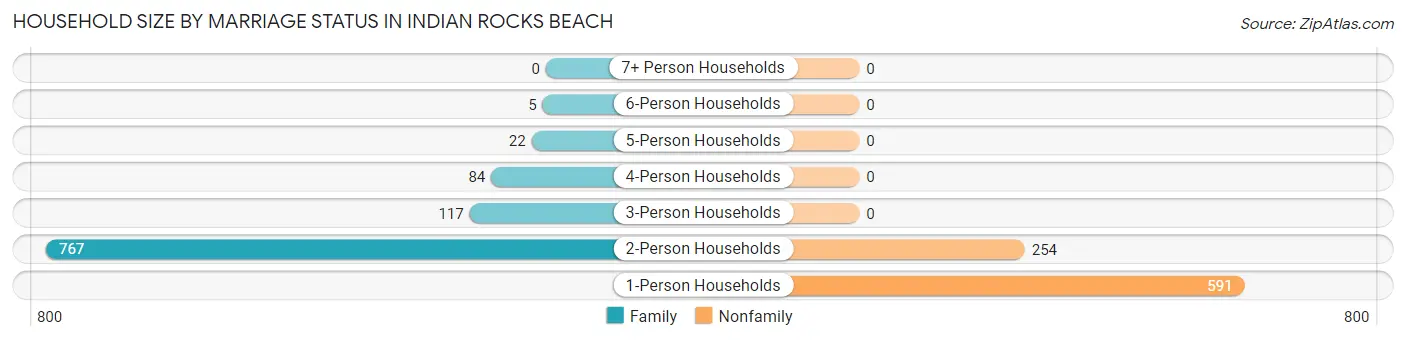
| Household Size | Family Households | Nonfamily Households |
| 1-Person Households | - | 591 (32.1%) |
| 2-Person Households | 767 (41.7%) | 254 (13.8%) |
| 3-Person Households | 117 (6.4%) | 0 (0.0%) |
| 4-Person Households | 84 (4.6%) | 0 (0.0%) |
| 5-Person Households | 22 (1.2%) | 0 (0.0%) |
| 6-Person Households | 5 (0.3%) | 0 (0.0%) |
| 7+ Person Households | 0 (0.0%) | 0 (0.0%) |
| Total | 995 (54.1%) | 845 (45.9%) |
Female Fertility in Indian Rocks Beach
Fertility by Age in Indian Rocks Beach
| Age Bracket | Women with Births | Births / 1,000 Women |
| 15 to 19 years | 0 (0.0%) | 0.0 |
| 20 to 34 years | 0 (0.0%) | 0.0 |
| 35 to 50 years | 0 (0.0%) | 0.0 |
| Total | 0 (0.0%) | 0.0 |
Fertility by Age by Marriage Status in Indian Rocks Beach
| Age Bracket | Married | Unmarried |
| 15 to 19 years | 0 (0.0%) | 0 (0.0%) |
| 20 to 34 years | 0 (0.0%) | 0 (0.0%) |
| 35 to 50 years | 0 (0.0%) | 0 (0.0%) |
| Total | 0 (0.0%) | 0 (0.0%) |
Fertility by Education in Indian Rocks Beach
| Educational Attainment | Women with Births | Births / 1,000 Women |
| Less than High School | 0 (0.0%) | 0.0 |
| High School Diploma | 0 (0.0%) | 0.0 |
| College or Associate's Degree | 0 (0.0%) | 0.0 |
| Bachelor's Degree | 0 (0.0%) | 0.0 |
| Graduate Degree | 0 (0.0%) | 0.0 |
| Total | 0 (0.0%) | 0.0 |
Fertility by Education by Marriage Status in Indian Rocks Beach
| Educational Attainment | Married | Unmarried |
| Less than High School | 0 (0.0%) | 0 (0.0%) |
| High School Diploma | 0 (0.0%) | 0 (0.0%) |
| College or Associate's Degree | 0 (0.0%) | 0 (0.0%) |
| Bachelor's Degree | 0 (0.0%) | 0 (0.0%) |
| Graduate Degree | 0 (0.0%) | 0 (0.0%) |
| Total | 0 (0.0%) | 0 (0.0%) |
Employment Characteristics in Indian Rocks Beach
Employment by Class of Employer in Indian Rocks Beach
Among the 1,925 employed individuals in Indian Rocks Beach, private company employees (1,358 | 70.6%), self-employed (incorporated) (232 | 12.0%), and self-employed (not incorporated) (146 | 7.6%) make up the most common classes of employment.
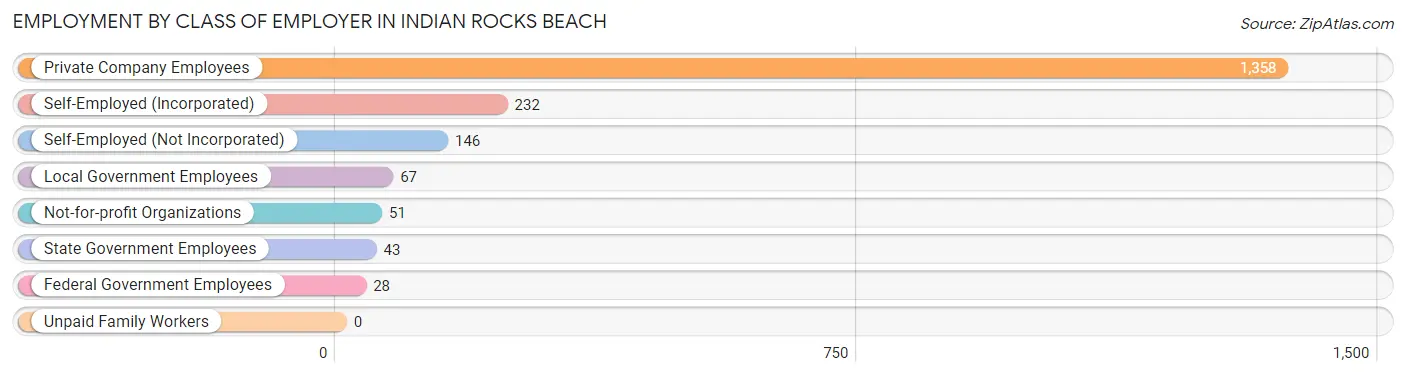
| Employer Class | # Employees | % Employees |
| Private Company Employees | 1,358 | 70.6% |
| Self-Employed (Incorporated) | 232 | 12.0% |
| Self-Employed (Not Incorporated) | 146 | 7.6% |
| Not-for-profit Organizations | 51 | 2.6% |
| Local Government Employees | 67 | 3.5% |
| State Government Employees | 43 | 2.2% |
| Federal Government Employees | 28 | 1.5% |
| Unpaid Family Workers | 0 | 0.0% |
| Total | 1,925 | 100.0% |
Employment Status by Age in Indian Rocks Beach
According to the labor force statistics for Indian Rocks Beach, out of the total population over 16 years of age (3,532), 58.9% or 2,080 individuals are in the labor force, with 4.9% or 102 of them unemployed. The age group with the highest labor force participation rate is 25 to 29 years, with 100.0% or 44 individuals in the labor force. Within the labor force, the 35 to 44 years age range has the highest percentage of unemployed individuals, with 10.4% or 31 of them being unemployed.
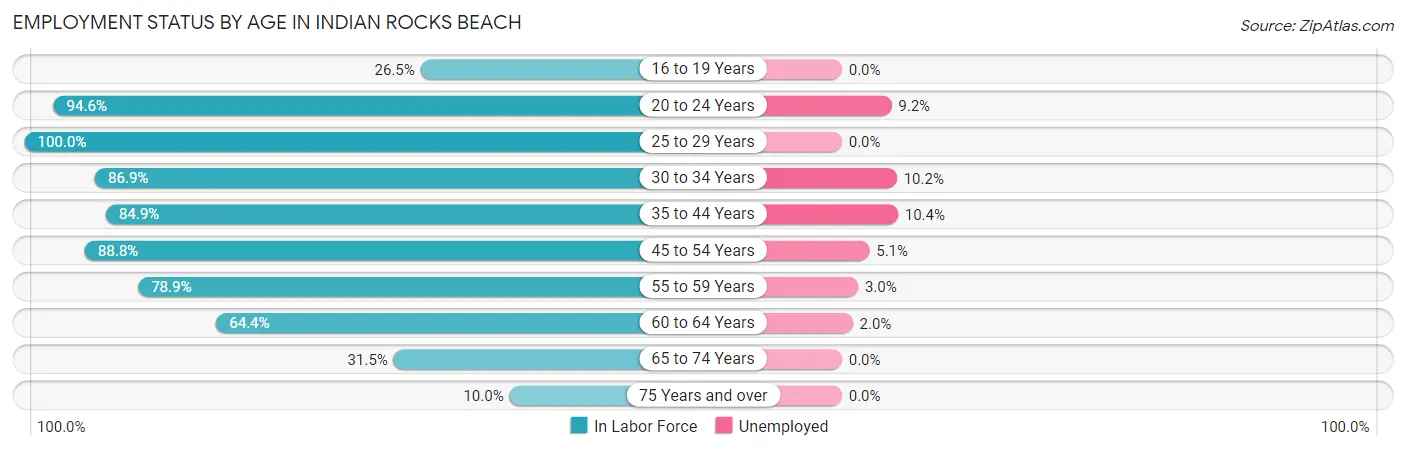
| Age Bracket | In Labor Force | Unemployed |
| 16 to 19 Years | 39 (26.5%) | 0 (0.0%) |
| 20 to 24 Years | 141 (94.6%) | 13 (9.2%) |
| 25 to 29 Years | 44 (100.0%) | 0 (0.0%) |
| 30 to 34 Years | 166 (86.9%) | 17 (10.2%) |
| 35 to 44 Years | 298 (84.9%) | 31 (10.4%) |
| 45 to 54 Years | 514 (88.8%) | 26 (5.1%) |
| 55 to 59 Years | 303 (78.9%) | 9 (3.0%) |
| 60 to 64 Years | 293 (64.4%) | 6 (2.0%) |
| 65 to 74 Years | 234 (31.5%) | 0 (0.0%) |
| 75 Years and over | 49 (10.0%) | 0 (0.0%) |
| Total | 2,080 (58.9%) | 102 (4.9%) |
Employment Status by Educational Attainment in Indian Rocks Beach
According to labor force statistics for Indian Rocks Beach, 80.7% of individuals (1,617) out of the total population between 25 and 64 years of age (2,004) are in the labor force, with 5.5% or 89 of them being unemployed. The group with the highest labor force participation rate are those with the educational attainment of less than high school, with 100.0% or 55 individuals in the labor force. Within the labor force, individuals with bachelor's degree or higher education have the highest percentage of unemployment, with 5.9% or 41 of them being unemployed.
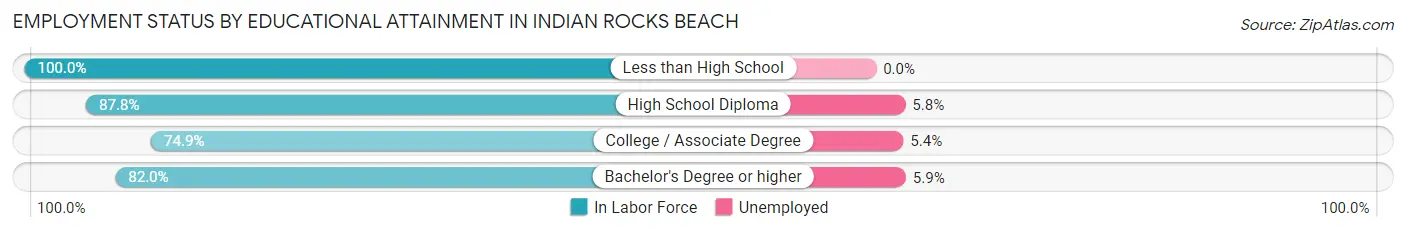
| Educational Attainment | In Labor Force | Unemployed |
| Less than High School | 55 (100.0%) | 0 (0.0%) |
| High School Diploma | 295 (87.8%) | 19 (5.8%) |
| College / Associate Degree | 575 (74.9%) | 41 (5.4%) |
| Bachelor's Degree or higher | 693 (82.0%) | 50 (5.9%) |
| Total | 1,617 (80.7%) | 110 (5.5%) |
Employment Occupations by Sex in Indian Rocks Beach
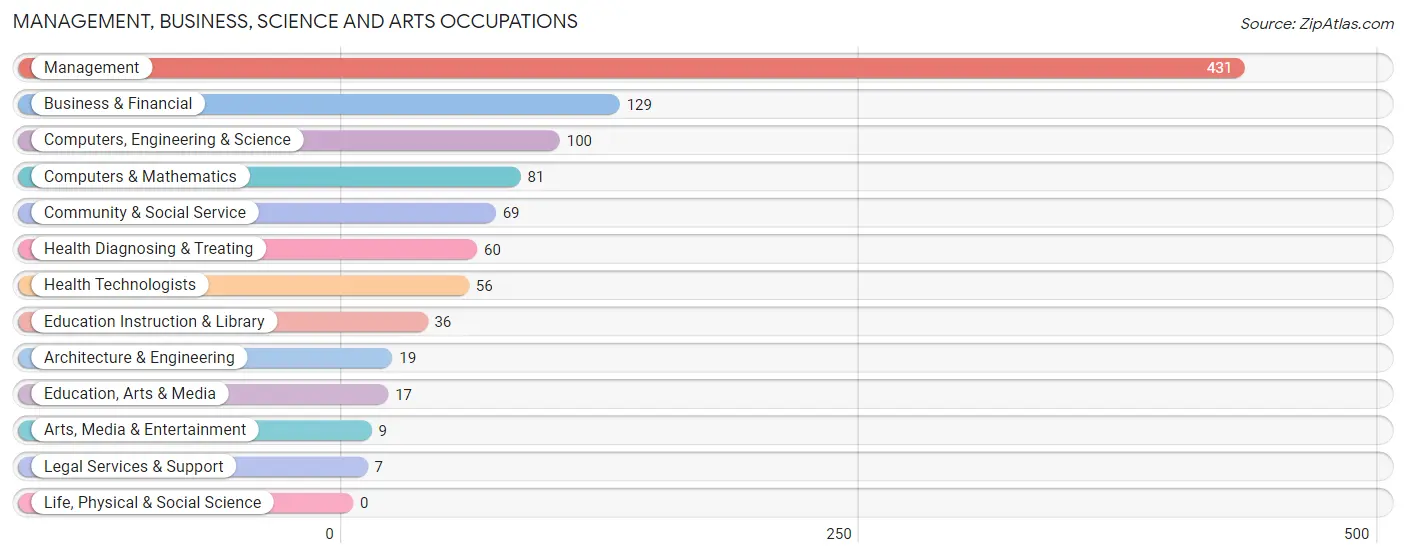
Management, Business, Science and Arts Occupations
The most common Management, Business, Science and Arts occupations in Indian Rocks Beach are Management (431 | 21.8%), Business & Financial (129 | 6.5%), Computers, Engineering & Science (100 | 5.1%), Computers & Mathematics (81 | 4.1%), and Community & Social Service (69 | 3.5%).
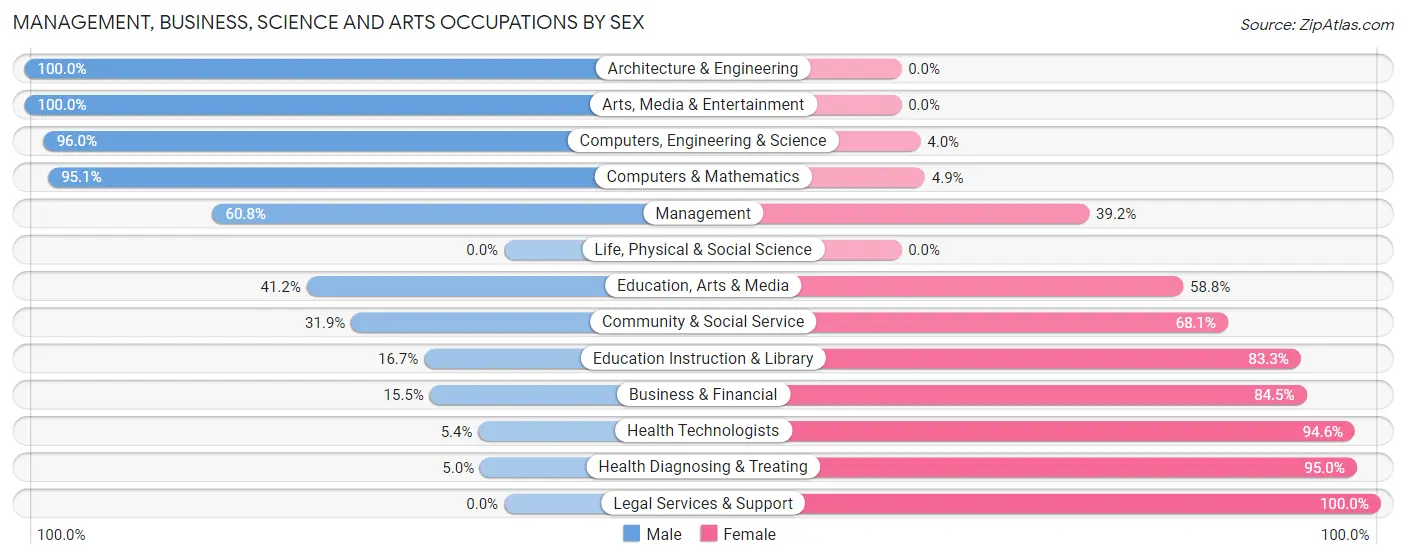
Management, Business, Science and Arts Occupations by Sex
Within the Management, Business, Science and Arts occupations in Indian Rocks Beach, the most male-oriented occupations are Architecture & Engineering (100.0%), Arts, Media & Entertainment (100.0%), and Computers, Engineering & Science (96.0%), while the most female-oriented occupations are Legal Services & Support (100.0%), Health Diagnosing & Treating (95.0%), and Health Technologists (94.6%).
| Occupation | Male | Female |
| Management | 262 (60.8%) | 169 (39.2%) |
| Business & Financial | 20 (15.5%) | 109 (84.5%) |
| Computers, Engineering & Science | 96 (96.0%) | 4 (4.0%) |
| Computers & Mathematics | 77 (95.1%) | 4 (4.9%) |
| Architecture & Engineering | 19 (100.0%) | 0 (0.0%) |
| Life, Physical & Social Science | 0 (0.0%) | 0 (0.0%) |
| Community & Social Service | 22 (31.9%) | 47 (68.1%) |
| Education, Arts & Media | 7 (41.2%) | 10 (58.8%) |
| Legal Services & Support | 0 (0.0%) | 7 (100.0%) |
| Education Instruction & Library | 6 (16.7%) | 30 (83.3%) |
| Arts, Media & Entertainment | 9 (100.0%) | 0 (0.0%) |
| Health Diagnosing & Treating | 3 (5.0%) | 57 (95.0%) |
| Health Technologists | 3 (5.4%) | 53 (94.6%) |
| Total (Category) | 403 (51.1%) | 386 (48.9%) |
| Total (Overall) | 1,043 (52.8%) | 932 (47.2%) |
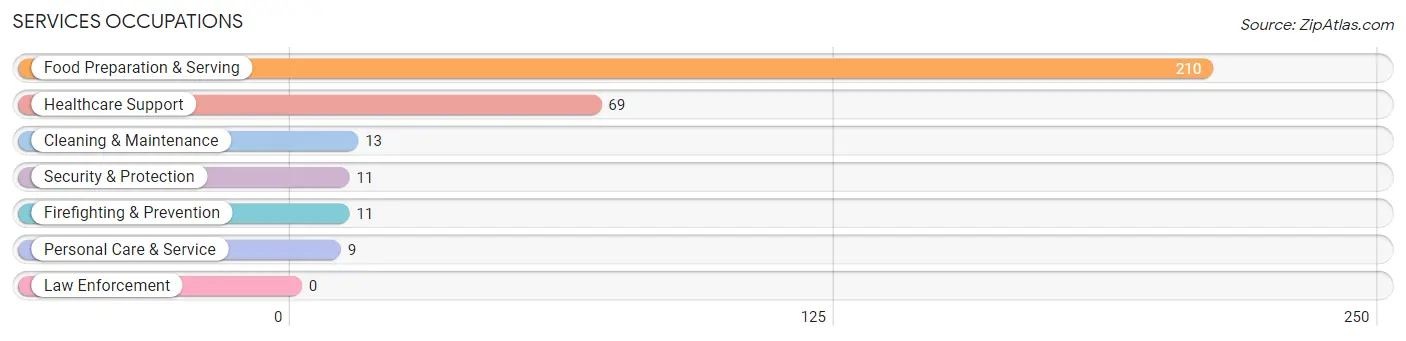
Services Occupations
The most common Services occupations in Indian Rocks Beach are Food Preparation & Serving (210 | 10.6%), Healthcare Support (69 | 3.5%), Cleaning & Maintenance (13 | 0.7%), Security & Protection (11 | 0.6%), and Firefighting & Prevention (11 | 0.6%).
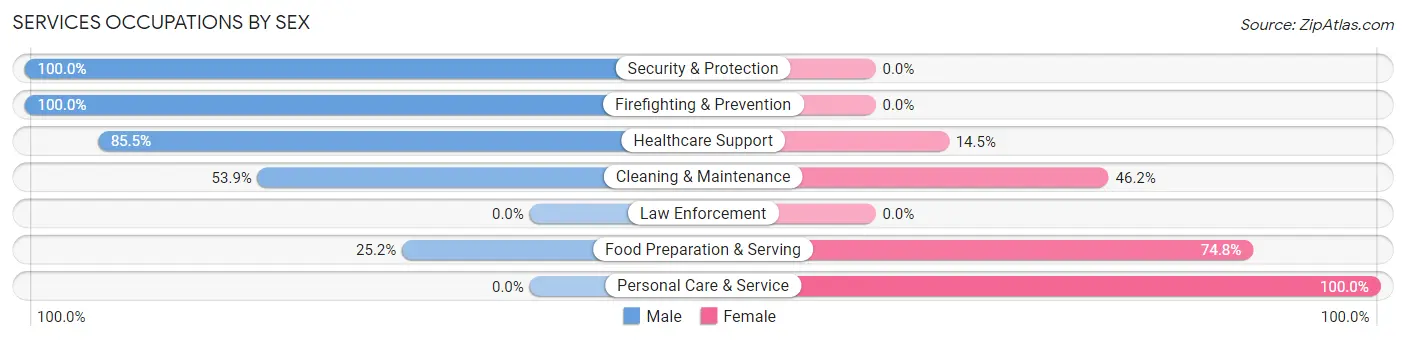
Services Occupations by Sex
Within the Services occupations in Indian Rocks Beach, the most male-oriented occupations are Security & Protection (100.0%), Firefighting & Prevention (100.0%), and Healthcare Support (85.5%), while the most female-oriented occupations are Personal Care & Service (100.0%), Food Preparation & Serving (74.8%), and Cleaning & Maintenance (46.2%).
| Occupation | Male | Female |
| Healthcare Support | 59 (85.5%) | 10 (14.5%) |
| Security & Protection | 11 (100.0%) | 0 (0.0%) |
| Firefighting & Prevention | 11 (100.0%) | 0 (0.0%) |
| Law Enforcement | 0 (0.0%) | 0 (0.0%) |
| Food Preparation & Serving | 53 (25.2%) | 157 (74.8%) |
| Cleaning & Maintenance | 7 (53.8%) | 6 (46.2%) |
| Personal Care & Service | 0 (0.0%) | 9 (100.0%) |
| Total (Category) | 130 (41.7%) | 182 (58.3%) |
| Total (Overall) | 1,043 (52.8%) | 932 (47.2%) |
Sales and Office Occupations
The most common Sales and Office occupations in Indian Rocks Beach are Sales & Related (387 | 19.6%), and Office & Administration (174 | 8.8%).
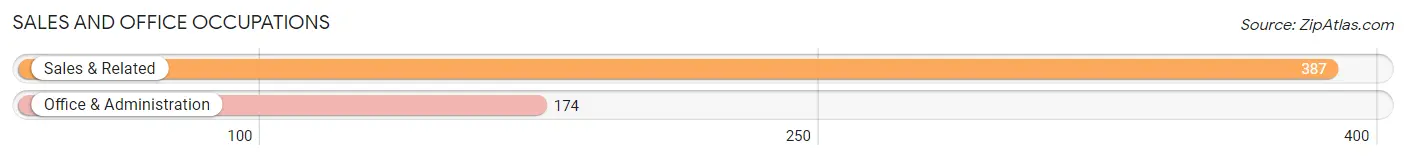
Sales and Office Occupations by Sex
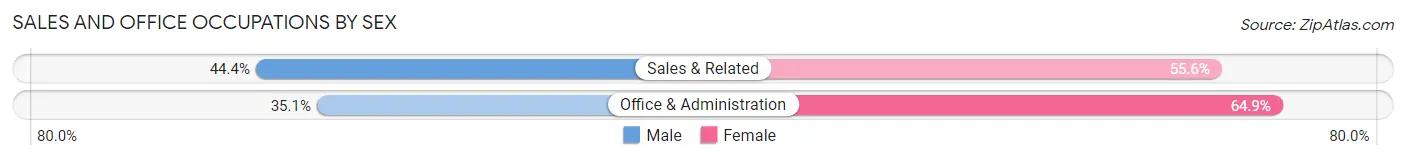
| Occupation | Male | Female |
| Sales & Related | 172 (44.4%) | 215 (55.6%) |
| Office & Administration | 61 (35.1%) | 113 (64.9%) |
| Total (Category) | 233 (41.5%) | 328 (58.5%) |
| Total (Overall) | 1,043 (52.8%) | 932 (47.2%) |
Natural Resources, Construction and Maintenance Occupations
The most common Natural Resources, Construction and Maintenance occupations in Indian Rocks Beach are Installation, Maintenance & Repair (109 | 5.5%), and Construction & Extraction (93 | 4.7%).
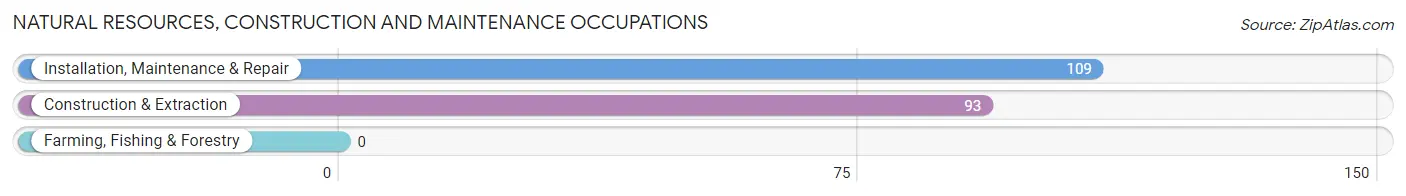
Natural Resources, Construction and Maintenance Occupations by Sex
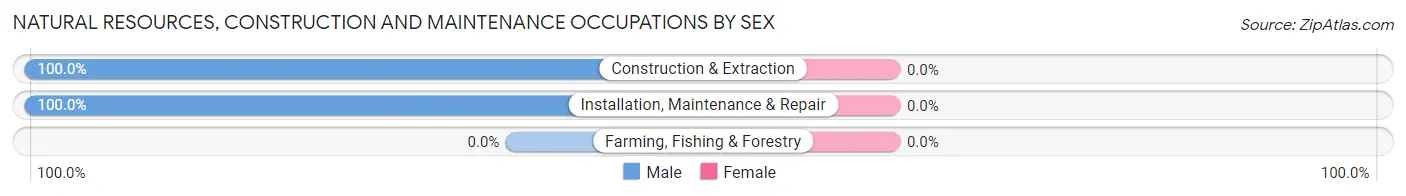
| Occupation | Male | Female |
| Farming, Fishing & Forestry | 0 (0.0%) | 0 (0.0%) |
| Construction & Extraction | 93 (100.0%) | 0 (0.0%) |
| Installation, Maintenance & Repair | 109 (100.0%) | 0 (0.0%) |
| Total (Category) | 202 (100.0%) | 0 (0.0%) |
| Total (Overall) | 1,043 (52.8%) | 932 (47.2%) |
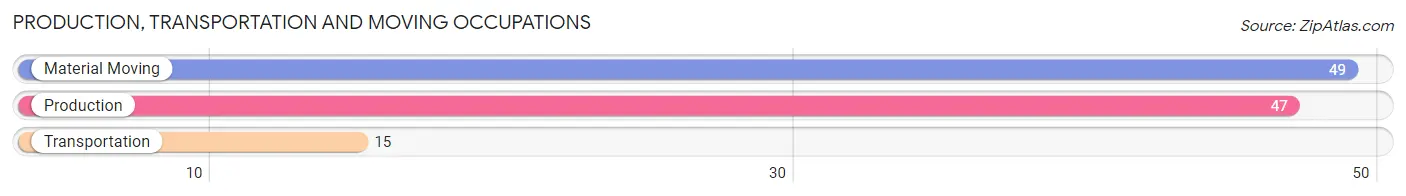
Production, Transportation and Moving Occupations
The most common Production, Transportation and Moving occupations in Indian Rocks Beach are Material Moving (49 | 2.5%), Production (47 | 2.4%), and Transportation (15 | 0.8%).
Production, Transportation and Moving Occupations by Sex
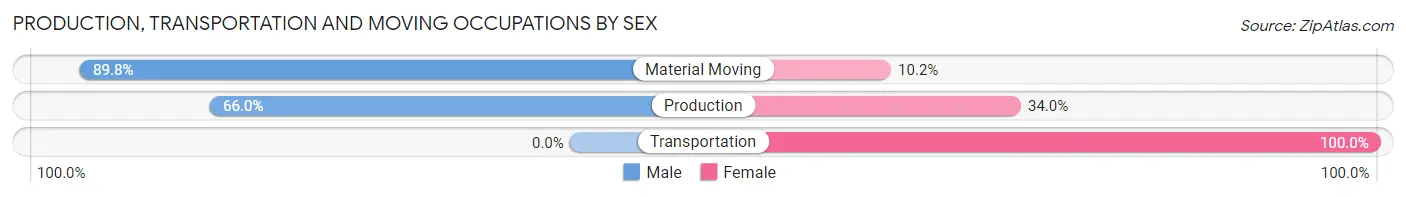
| Occupation | Male | Female |
| Production | 31 (66.0%) | 16 (34.0%) |
| Transportation | 0 (0.0%) | 15 (100.0%) |
| Material Moving | 44 (89.8%) | 5 (10.2%) |
| Total (Category) | 75 (67.6%) | 36 (32.4%) |
| Total (Overall) | 1,043 (52.8%) | 932 (47.2%) |
Employment Industries by Sex in Indian Rocks Beach
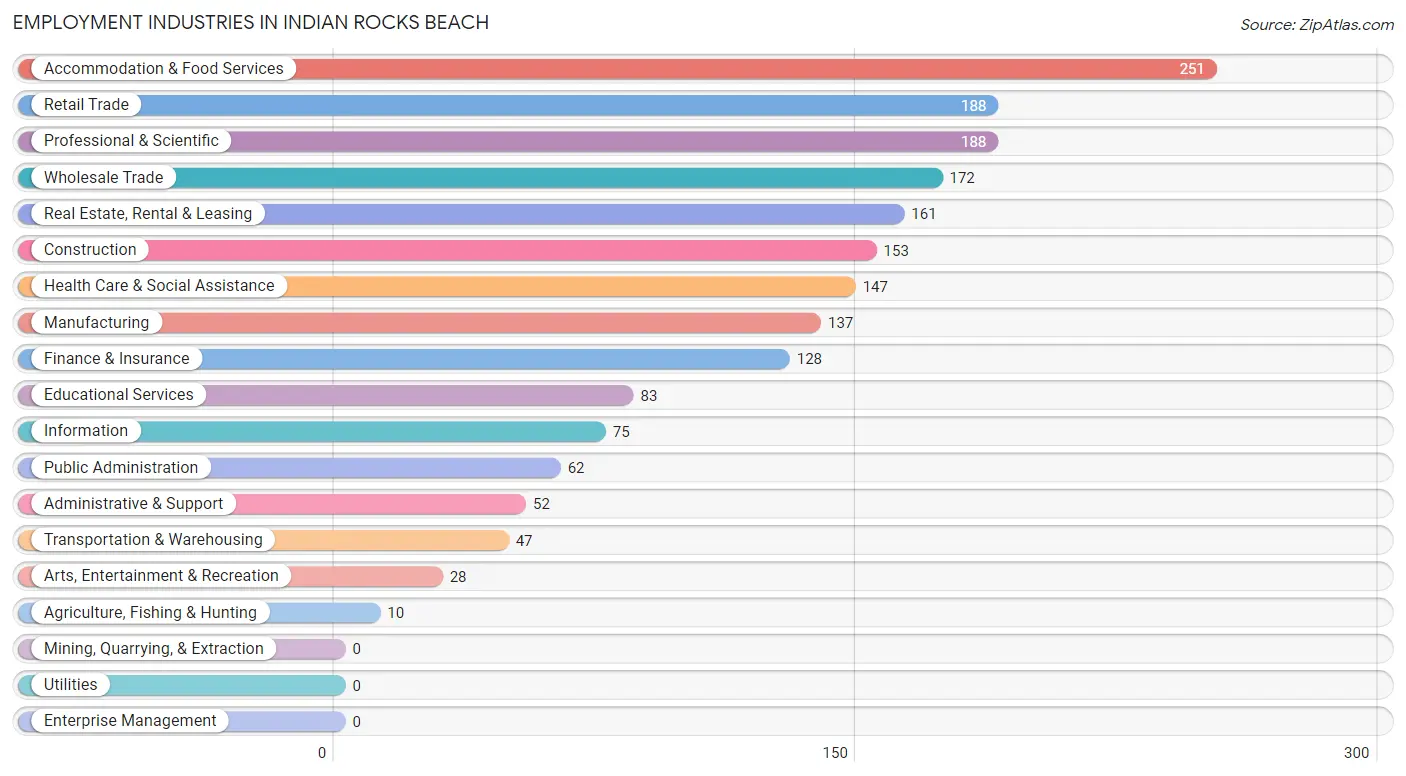
Employment Industries in Indian Rocks Beach
The major employment industries in Indian Rocks Beach include Accommodation & Food Services (251 | 12.7%), Retail Trade (188 | 9.5%), Professional & Scientific (188 | 9.5%), Wholesale Trade (172 | 8.7%), and Real Estate, Rental & Leasing (161 | 8.2%).
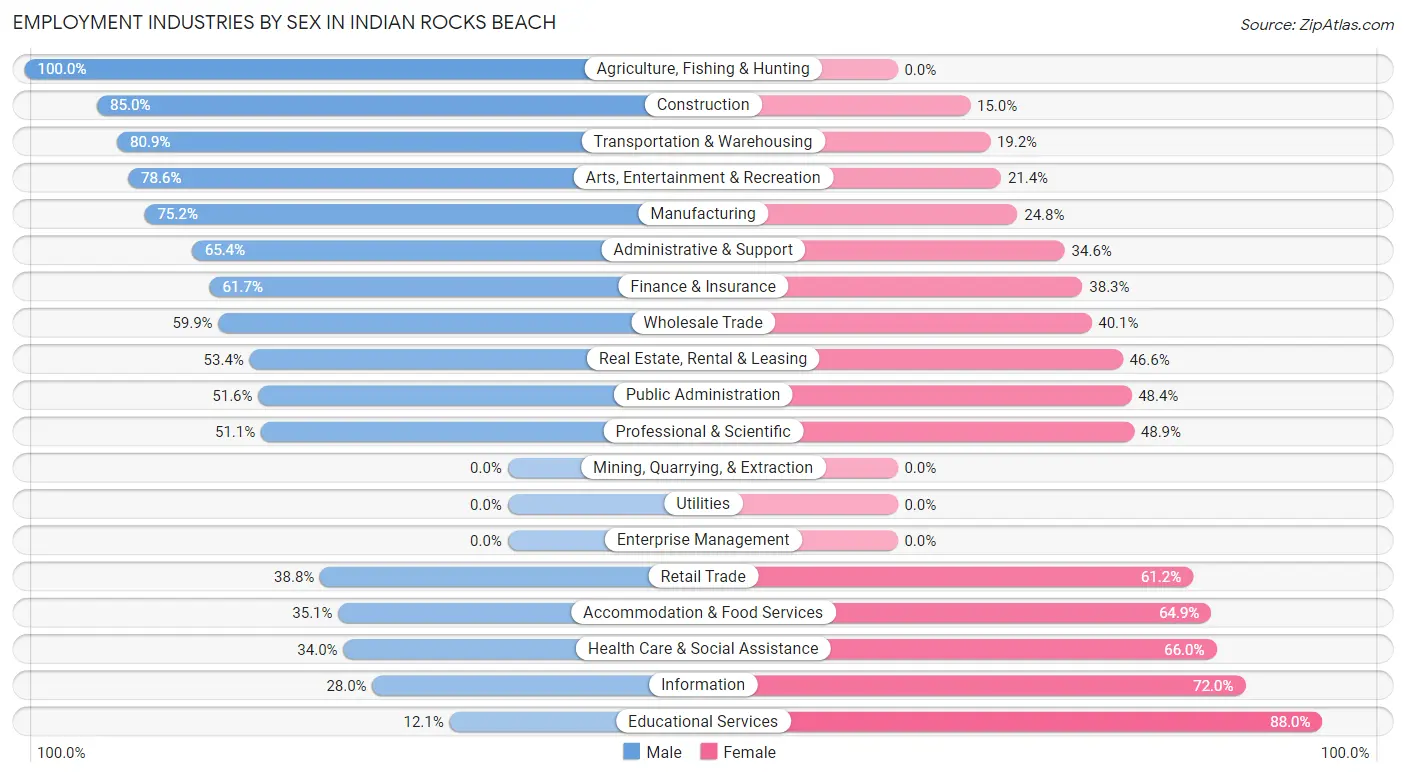
Employment Industries by Sex in Indian Rocks Beach
The Indian Rocks Beach industries that see more men than women are Agriculture, Fishing & Hunting (100.0%), Construction (85.0%), and Transportation & Warehousing (80.8%), whereas the industries that tend to have a higher number of women are Educational Services (87.9%), Information (72.0%), and Health Care & Social Assistance (66.0%).
| Industry | Male | Female |
| Agriculture, Fishing & Hunting | 10 (100.0%) | 0 (0.0%) |
| Mining, Quarrying, & Extraction | 0 (0.0%) | 0 (0.0%) |
| Construction | 130 (85.0%) | 23 (15.0%) |
| Manufacturing | 103 (75.2%) | 34 (24.8%) |
| Wholesale Trade | 103 (59.9%) | 69 (40.1%) |
| Retail Trade | 73 (38.8%) | 115 (61.2%) |
| Transportation & Warehousing | 38 (80.8%) | 9 (19.2%) |
| Utilities | 0 (0.0%) | 0 (0.0%) |
| Information | 21 (28.0%) | 54 (72.0%) |
| Finance & Insurance | 79 (61.7%) | 49 (38.3%) |
| Real Estate, Rental & Leasing | 86 (53.4%) | 75 (46.6%) |
| Professional & Scientific | 96 (51.1%) | 92 (48.9%) |
| Enterprise Management | 0 (0.0%) | 0 (0.0%) |
| Administrative & Support | 34 (65.4%) | 18 (34.6%) |
| Educational Services | 10 (12.0%) | 73 (87.9%) |
| Health Care & Social Assistance | 50 (34.0%) | 97 (66.0%) |
| Arts, Entertainment & Recreation | 22 (78.6%) | 6 (21.4%) |
| Accommodation & Food Services | 88 (35.1%) | 163 (64.9%) |
| Public Administration | 32 (51.6%) | 30 (48.4%) |
| Total | 1,043 (52.8%) | 932 (47.2%) |
Education in Indian Rocks Beach
School Enrollment in Indian Rocks Beach
The most common levels of schooling among the 501 students in Indian Rocks Beach are college / undergraduate (197 | 39.3%), high school (150 | 29.9%), and kindergarten (43 | 8.6%).
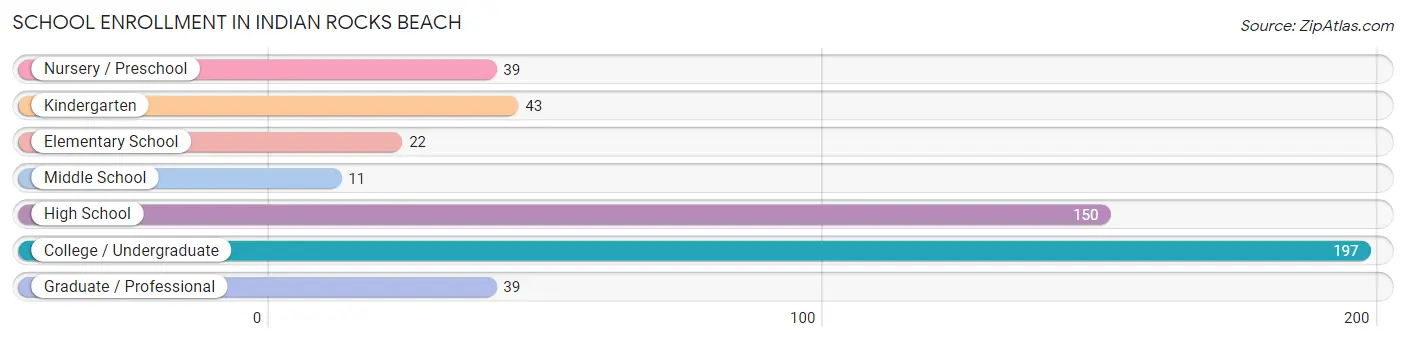
| School Level | # Students | % Students |
| Nursery / Preschool | 39 | 7.8% |
| Kindergarten | 43 | 8.6% |
| Elementary School | 22 | 4.4% |
| Middle School | 11 | 2.2% |
| High School | 150 | 29.9% |
| College / Undergraduate | 197 | 39.3% |
| Graduate / Professional | 39 | 7.8% |
| Total | 501 | 100.0% |
School Enrollment by Age by Funding Source in Indian Rocks Beach
Out of a total of 501 students who are enrolled in schools in Indian Rocks Beach, 129 (25.7%) attend a private institution, while the remaining 372 (74.3%) are enrolled in public schools. The age group of 3 to 4 year olds has the highest likelihood of being enrolled in private schools, with 39 (100.0% in the age bracket) enrolled. Conversely, the age group of 10 to 14 year olds has the lowest likelihood of being enrolled in a private school, with 31 (100.0% in the age bracket) attending a public institution.
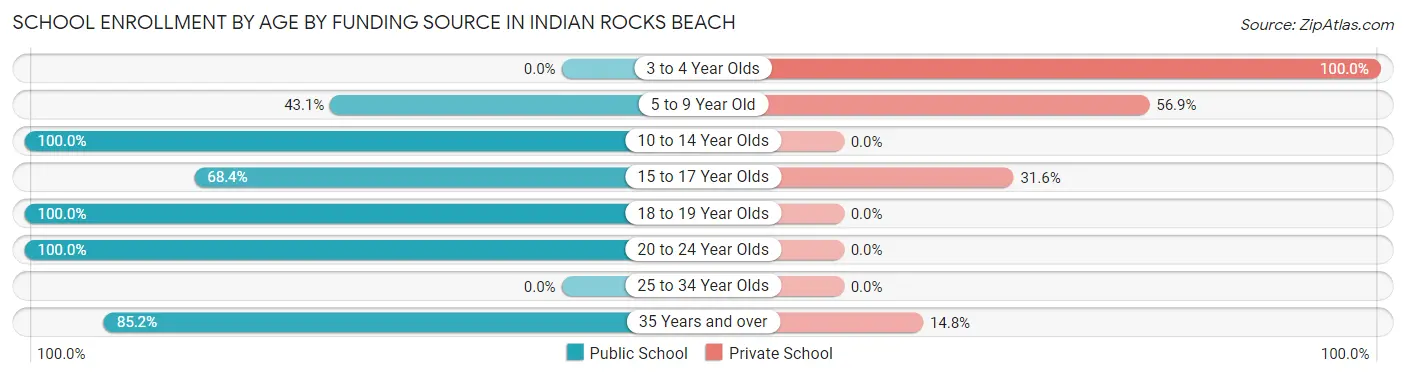
| Age Bracket | Public School | Private School |
| 3 to 4 Year Olds | 0 (0.0%) | 39 (100.0%) |
| 5 to 9 Year Old | 28 (43.1%) | 37 (56.9%) |
| 10 to 14 Year Olds | 31 (100.0%) | 0 (0.0%) |
| 15 to 17 Year Olds | 67 (68.4%) | 31 (31.6%) |
| 18 to 19 Year Olds | 61 (100.0%) | 0 (0.0%) |
| 20 to 24 Year Olds | 58 (100.0%) | 0 (0.0%) |
| 25 to 34 Year Olds | 0 (0.0%) | 0 (0.0%) |
| 35 Years and over | 127 (85.2%) | 22 (14.8%) |
| Total | 372 (74.3%) | 129 (25.7%) |
Educational Attainment by Field of Study in Indian Rocks Beach
Business (436 | 26.3%), education (207 | 12.5%), social sciences (170 | 10.2%), science & technology (147 | 8.9%), and engineering (113 | 6.8%) are the most common fields of study among 1,660 individuals in Indian Rocks Beach who have obtained a bachelor's degree or higher.
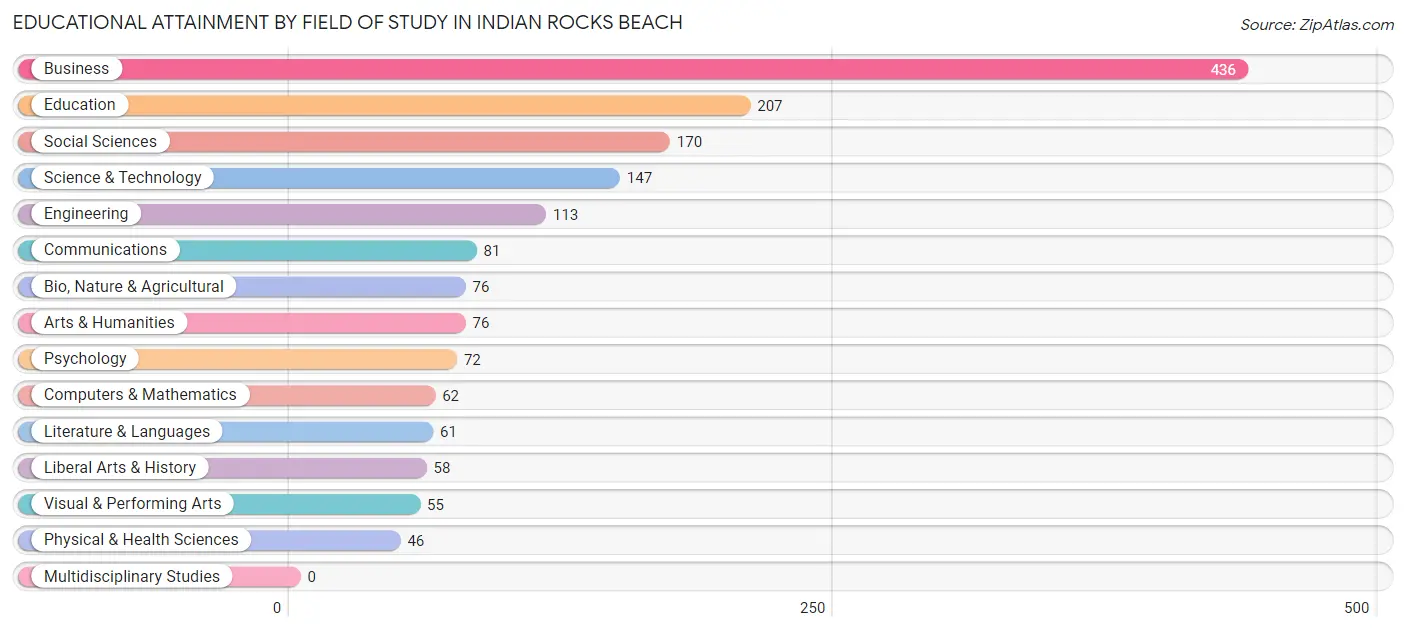
| Field of Study | # Graduates | % Graduates |
| Computers & Mathematics | 62 | 3.7% |
| Bio, Nature & Agricultural | 76 | 4.6% |
| Physical & Health Sciences | 46 | 2.8% |
| Psychology | 72 | 4.3% |
| Social Sciences | 170 | 10.2% |
| Engineering | 113 | 6.8% |
| Multidisciplinary Studies | 0 | 0.0% |
| Science & Technology | 147 | 8.9% |
| Business | 436 | 26.3% |
| Education | 207 | 12.5% |
| Literature & Languages | 61 | 3.7% |
| Liberal Arts & History | 58 | 3.5% |
| Visual & Performing Arts | 55 | 3.3% |
| Communications | 81 | 4.9% |
| Arts & Humanities | 76 | 4.6% |
| Total | 1,660 | 100.0% |
Transportation & Commute in Indian Rocks Beach
Vehicle Availability by Sex in Indian Rocks Beach
The most prevalent vehicle ownership categories in Indian Rocks Beach are males with 2 vehicles (482, accounting for 47.5%) and females with 2 vehicles (508, making up 53.0%).
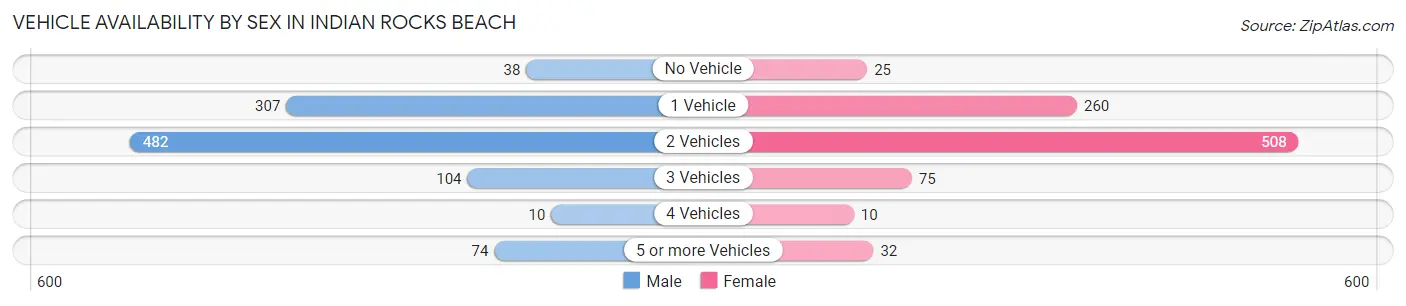
| Vehicles Available | Male | Female |
| No Vehicle | 38 (3.7%) | 25 (2.8%) |
| 1 Vehicle | 307 (30.2%) | 260 (28.6%) |
| 2 Vehicles | 482 (47.5%) | 508 (55.8%) |
| 3 Vehicles | 104 (10.2%) | 75 (8.2%) |
| 4 Vehicles | 10 (1.0%) | 10 (1.1%) |
| 5 or more Vehicles | 74 (7.3%) | 32 (3.5%) |
| Total | 1,015 (100.0%) | 910 (100.0%) |
Commute Time in Indian Rocks Beach
The most frequently occuring commute durations in Indian Rocks Beach are 10 to 14 minutes (188 commuters, 13.5%), 20 to 24 minutes (188 commuters, 13.5%), and 15 to 19 minutes (180 commuters, 12.9%).
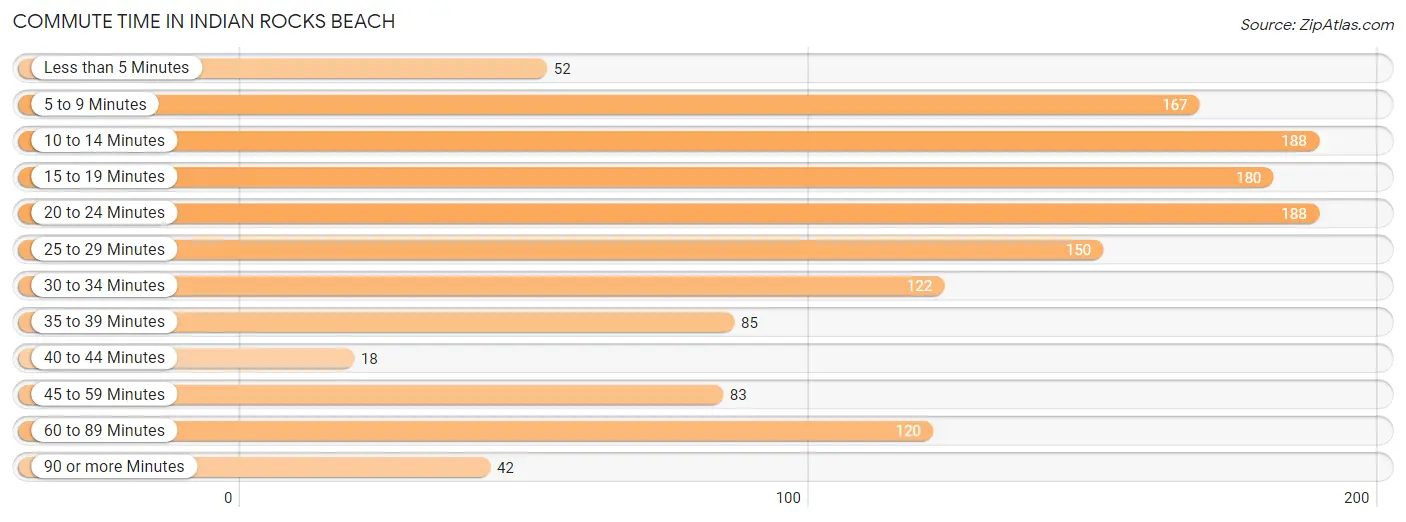
| Commute Time | # Commuters | % Commuters |
| Less than 5 Minutes | 52 | 3.7% |
| 5 to 9 Minutes | 167 | 12.0% |
| 10 to 14 Minutes | 188 | 13.5% |
| 15 to 19 Minutes | 180 | 12.9% |
| 20 to 24 Minutes | 188 | 13.5% |
| 25 to 29 Minutes | 150 | 10.7% |
| 30 to 34 Minutes | 122 | 8.7% |
| 35 to 39 Minutes | 85 | 6.1% |
| 40 to 44 Minutes | 18 | 1.3% |
| 45 to 59 Minutes | 83 | 5.9% |
| 60 to 89 Minutes | 120 | 8.6% |
| 90 or more Minutes | 42 | 3.0% |
Commute Time by Sex in Indian Rocks Beach
The most common commute times in Indian Rocks Beach are 5 to 9 minutes (116 commuters, 14.8%) for males and 10 to 14 minutes (125 commuters, 20.5%) for females.
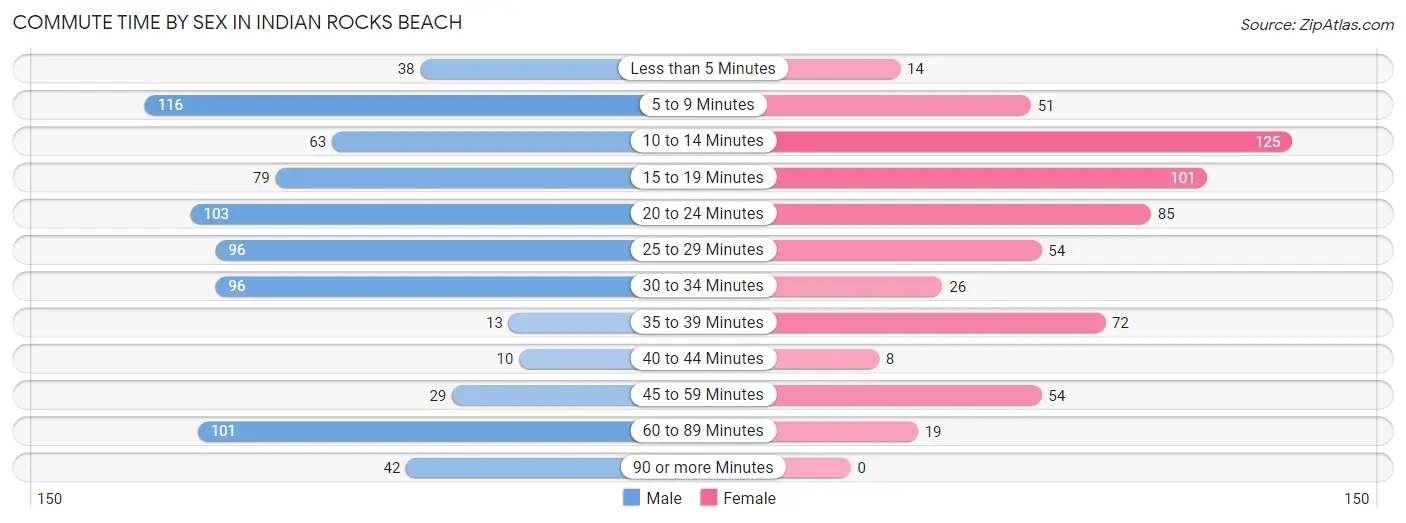
| Commute Time | Male | Female |
| Less than 5 Minutes | 38 (4.8%) | 14 (2.3%) |
| 5 to 9 Minutes | 116 (14.8%) | 51 (8.4%) |
| 10 to 14 Minutes | 63 (8.0%) | 125 (20.5%) |
| 15 to 19 Minutes | 79 (10.1%) | 101 (16.6%) |
| 20 to 24 Minutes | 103 (13.1%) | 85 (14.0%) |
| 25 to 29 Minutes | 96 (12.2%) | 54 (8.9%) |
| 30 to 34 Minutes | 96 (12.2%) | 26 (4.3%) |
| 35 to 39 Minutes | 13 (1.7%) | 72 (11.8%) |
| 40 to 44 Minutes | 10 (1.3%) | 8 (1.3%) |
| 45 to 59 Minutes | 29 (3.7%) | 54 (8.9%) |
| 60 to 89 Minutes | 101 (12.9%) | 19 (3.1%) |
| 90 or more Minutes | 42 (5.3%) | 0 (0.0%) |
Time of Departure to Work by Sex in Indian Rocks Beach
The most frequent times of departure to work in Indian Rocks Beach are 7:00 AM to 7:29 AM (107, 13.6%) for males and 7:30 AM to 7:59 AM (99, 16.3%) for females.
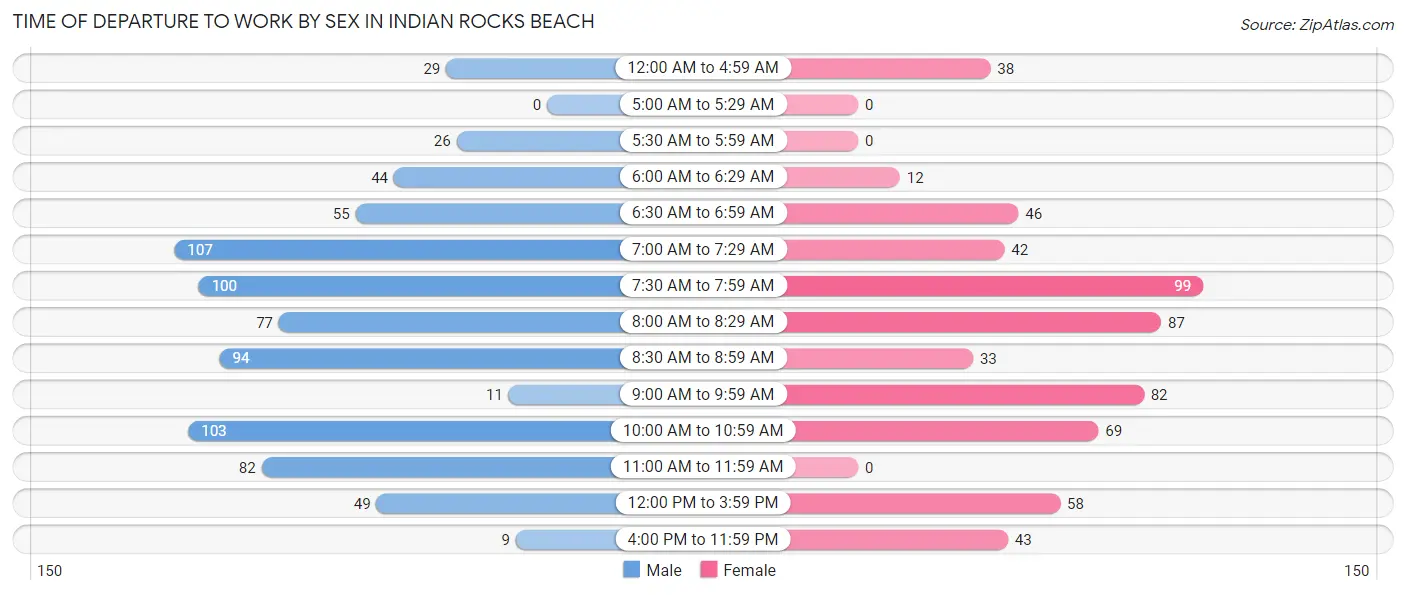
| Time of Departure | Male | Female |
| 12:00 AM to 4:59 AM | 29 (3.7%) | 38 (6.2%) |
| 5:00 AM to 5:29 AM | 0 (0.0%) | 0 (0.0%) |
| 5:30 AM to 5:59 AM | 26 (3.3%) | 0 (0.0%) |
| 6:00 AM to 6:29 AM | 44 (5.6%) | 12 (2.0%) |
| 6:30 AM to 6:59 AM | 55 (7.0%) | 46 (7.5%) |
| 7:00 AM to 7:29 AM | 107 (13.6%) | 42 (6.9%) |
| 7:30 AM to 7:59 AM | 100 (12.7%) | 99 (16.3%) |
| 8:00 AM to 8:29 AM | 77 (9.8%) | 87 (14.3%) |
| 8:30 AM to 8:59 AM | 94 (12.0%) | 33 (5.4%) |
| 9:00 AM to 9:59 AM | 11 (1.4%) | 82 (13.5%) |
| 10:00 AM to 10:59 AM | 103 (13.1%) | 69 (11.3%) |
| 11:00 AM to 11:59 AM | 82 (10.4%) | 0 (0.0%) |
| 12:00 PM to 3:59 PM | 49 (6.2%) | 58 (9.5%) |
| 4:00 PM to 11:59 PM | 9 (1.1%) | 43 (7.1%) |
| Total | 786 (100.0%) | 609 (100.0%) |
Housing Occupancy in Indian Rocks Beach
Occupancy by Ownership in Indian Rocks Beach
Of the total 1,840 dwellings in Indian Rocks Beach, owner-occupied units account for 1,338 (72.7%), while renter-occupied units make up 502 (27.3%).
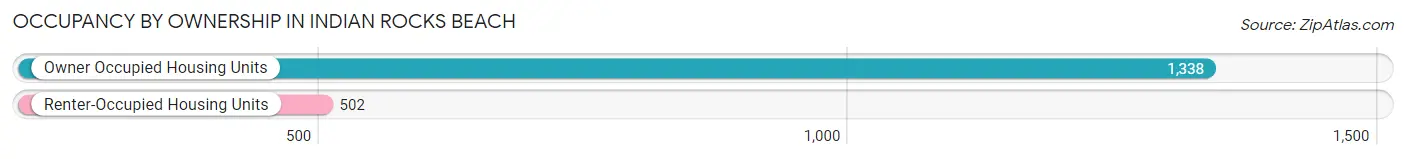
| Occupancy | # Housing Units | % Housing Units |
| Owner Occupied Housing Units | 1,338 | 72.7% |
| Renter-Occupied Housing Units | 502 | 27.3% |
| Total Occupied Housing Units | 1,840 | 100.0% |
Occupancy by Household Size in Indian Rocks Beach
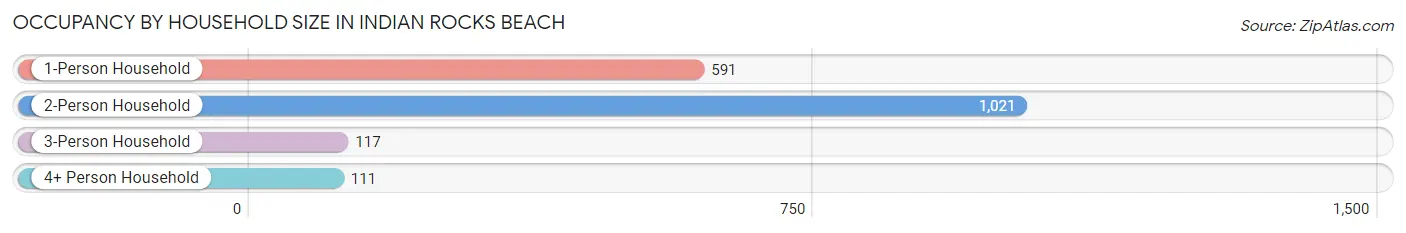
| Household Size | # Housing Units | % Housing Units |
| 1-Person Household | 591 | 32.1% |
| 2-Person Household | 1,021 | 55.5% |
| 3-Person Household | 117 | 6.4% |
| 4+ Person Household | 111 | 6.0% |
| Total Housing Units | 1,840 | 100.0% |
Occupancy by Ownership by Household Size in Indian Rocks Beach
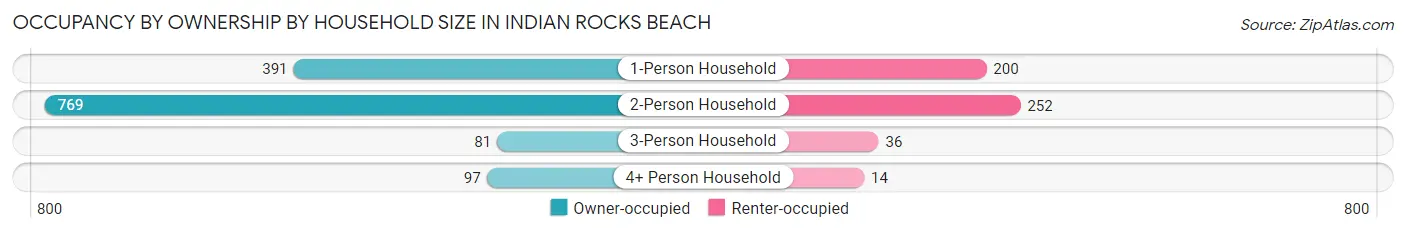
| Household Size | Owner-occupied | Renter-occupied |
| 1-Person Household | 391 (66.2%) | 200 (33.8%) |
| 2-Person Household | 769 (75.3%) | 252 (24.7%) |
| 3-Person Household | 81 (69.2%) | 36 (30.8%) |
| 4+ Person Household | 97 (87.4%) | 14 (12.6%) |
| Total Housing Units | 1,338 (72.7%) | 502 (27.3%) |
Occupancy by Educational Attainment in Indian Rocks Beach
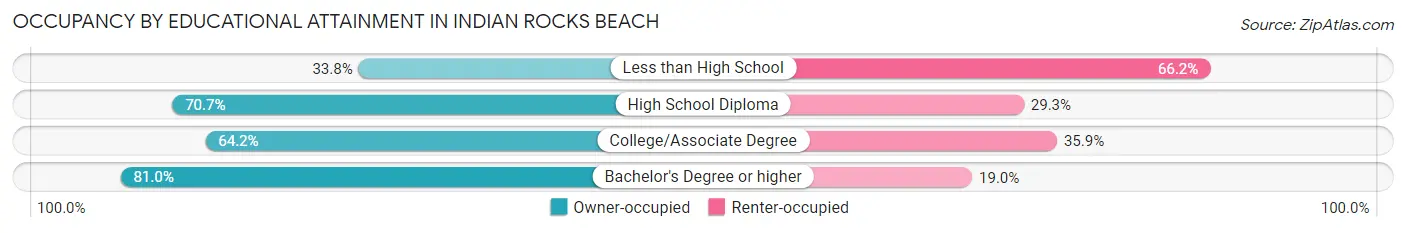
| Household Size | Owner-occupied | Renter-occupied |
| Less than High School | 24 (33.8%) | 47 (66.2%) |
| High School Diploma | 186 (70.7%) | 77 (29.3%) |
| College/Associate Degree | 349 (64.1%) | 195 (35.8%) |
| Bachelor's Degree or higher | 779 (81.0%) | 183 (19.0%) |
Occupancy by Age of Householder in Indian Rocks Beach
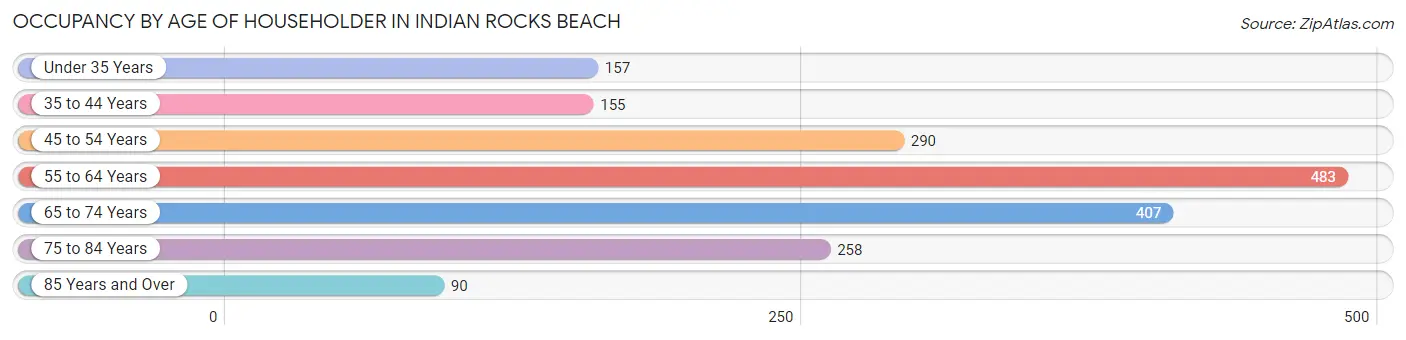
| Age Bracket | # Households | % Households |
| Under 35 Years | 157 | 8.5% |
| 35 to 44 Years | 155 | 8.4% |
| 45 to 54 Years | 290 | 15.8% |
| 55 to 64 Years | 483 | 26.3% |
| 65 to 74 Years | 407 | 22.1% |
| 75 to 84 Years | 258 | 14.0% |
| 85 Years and Over | 90 | 4.9% |
| Total | 1,840 | 100.0% |
Housing Finances in Indian Rocks Beach
Median Income by Occupancy in Indian Rocks Beach
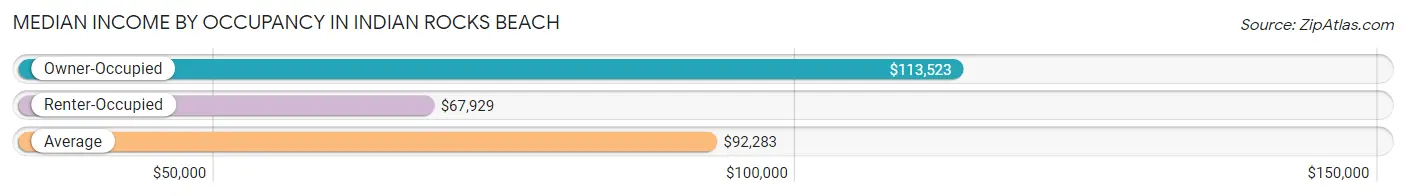
| Occupancy Type | # Households | Median Income |
| Owner-Occupied | 1,338 (72.7%) | $113,523 |
| Renter-Occupied | 502 (27.3%) | $67,929 |
| Average | 1,840 (100.0%) | $92,283 |
Occupancy by Householder Income Bracket in Indian Rocks Beach
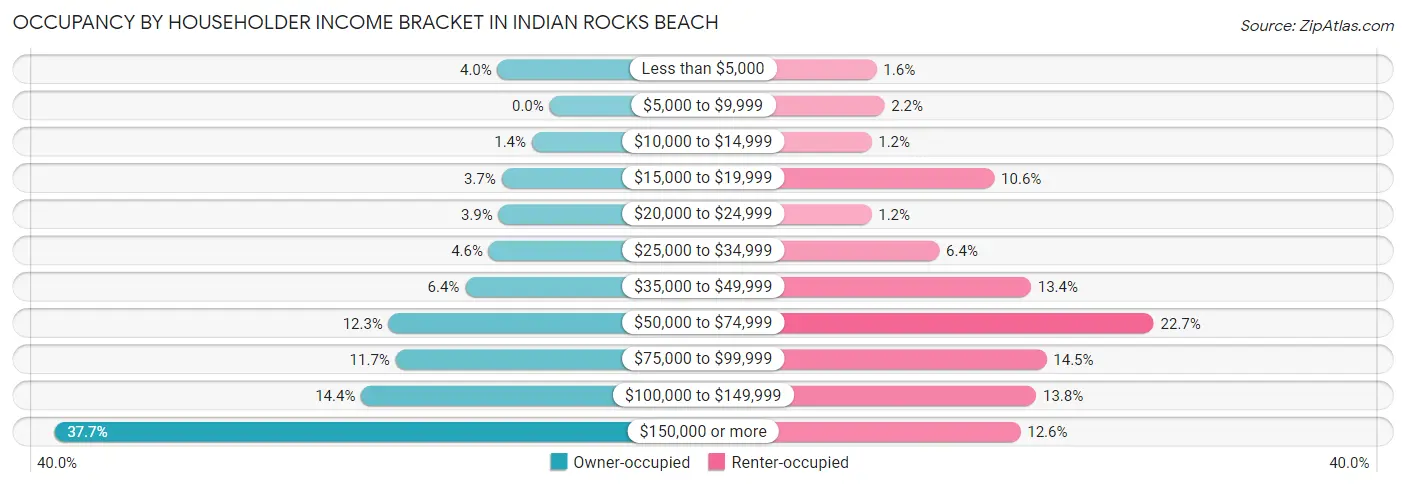
| Income Bracket | Owner-occupied | Renter-occupied |
| Less than $5,000 | 53 (4.0%) | 8 (1.6%) |
| $5,000 to $9,999 | 0 (0.0%) | 11 (2.2%) |
| $10,000 to $14,999 | 18 (1.3%) | 6 (1.2%) |
| $15,000 to $19,999 | 49 (3.7%) | 53 (10.6%) |
| $20,000 to $24,999 | 52 (3.9%) | 6 (1.2%) |
| $25,000 to $34,999 | 62 (4.6%) | 32 (6.4%) |
| $35,000 to $49,999 | 86 (6.4%) | 67 (13.4%) |
| $50,000 to $74,999 | 164 (12.3%) | 114 (22.7%) |
| $75,000 to $99,999 | 157 (11.7%) | 73 (14.5%) |
| $100,000 to $149,999 | 192 (14.3%) | 69 (13.8%) |
| $150,000 or more | 505 (37.7%) | 63 (12.6%) |
| Total | 1,338 (100.0%) | 502 (100.0%) |
Monthly Housing Cost Tiers in Indian Rocks Beach
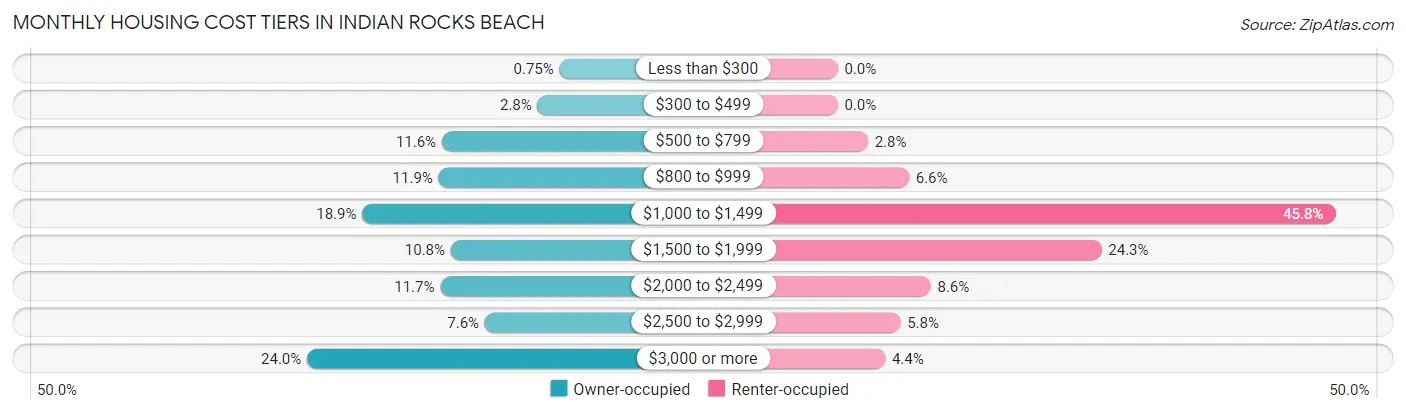
| Monthly Cost | Owner-occupied | Renter-occupied |
| Less than $300 | 10 (0.7%) | 0 (0.0%) |
| $300 to $499 | 37 (2.8%) | 0 (0.0%) |
| $500 to $799 | 155 (11.6%) | 14 (2.8%) |
| $800 to $999 | 159 (11.9%) | 33 (6.6%) |
| $1,000 to $1,499 | 253 (18.9%) | 230 (45.8%) |
| $1,500 to $1,999 | 144 (10.8%) | 122 (24.3%) |
| $2,000 to $2,499 | 157 (11.7%) | 43 (8.6%) |
| $2,500 to $2,999 | 102 (7.6%) | 29 (5.8%) |
| $3,000 or more | 321 (24.0%) | 22 (4.4%) |
| Total | 1,338 (100.0%) | 502 (100.0%) |
Physical Housing Characteristics in Indian Rocks Beach
Housing Structures in Indian Rocks Beach
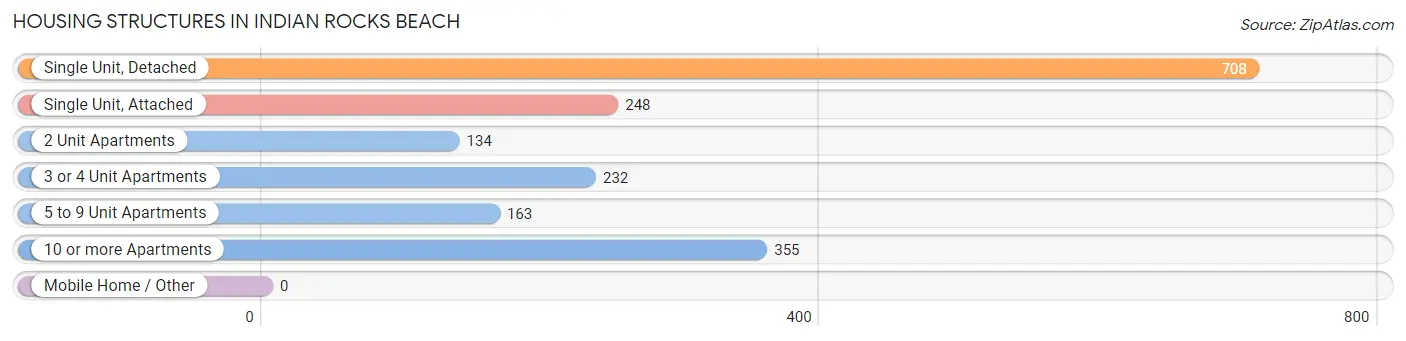
| Structure Type | # Housing Units | % Housing Units |
| Single Unit, Detached | 708 | 38.5% |
| Single Unit, Attached | 248 | 13.5% |
| 2 Unit Apartments | 134 | 7.3% |
| 3 or 4 Unit Apartments | 232 | 12.6% |
| 5 to 9 Unit Apartments | 163 | 8.9% |
| 10 or more Apartments | 355 | 19.3% |
| Mobile Home / Other | 0 | 0.0% |
| Total | 1,840 | 100.0% |
Housing Structures by Occupancy in Indian Rocks Beach
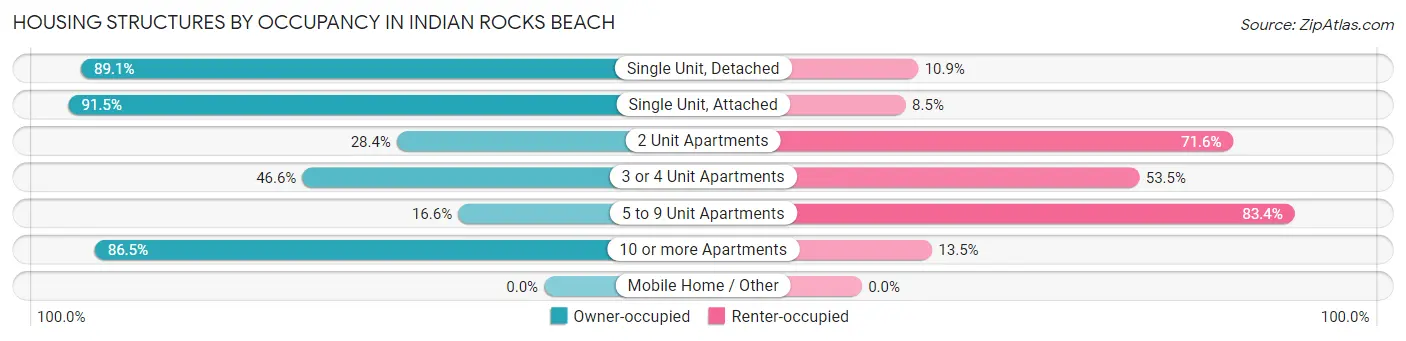
| Structure Type | Owner-occupied | Renter-occupied |
| Single Unit, Detached | 631 (89.1%) | 77 (10.9%) |
| Single Unit, Attached | 227 (91.5%) | 21 (8.5%) |
| 2 Unit Apartments | 38 (28.4%) | 96 (71.6%) |
| 3 or 4 Unit Apartments | 108 (46.6%) | 124 (53.4%) |
| 5 to 9 Unit Apartments | 27 (16.6%) | 136 (83.4%) |
| 10 or more Apartments | 307 (86.5%) | 48 (13.5%) |
| Mobile Home / Other | 0 (0.0%) | 0 (0.0%) |
| Total | 1,338 (72.7%) | 502 (27.3%) |
Housing Structures by Number of Rooms in Indian Rocks Beach
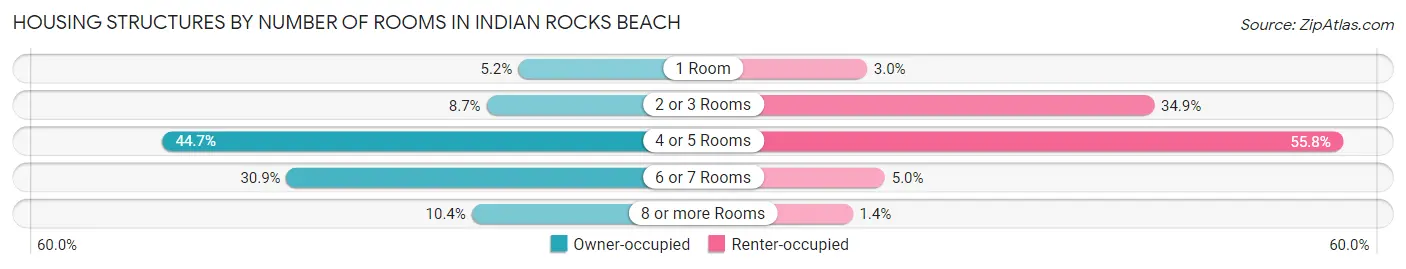
| Number of Rooms | Owner-occupied | Renter-occupied |
| 1 Room | 70 (5.2%) | 15 (3.0%) |
| 2 or 3 Rooms | 117 (8.7%) | 175 (34.9%) |
| 4 or 5 Rooms | 598 (44.7%) | 280 (55.8%) |
| 6 or 7 Rooms | 414 (30.9%) | 25 (5.0%) |
| 8 or more Rooms | 139 (10.4%) | 7 (1.4%) |
| Total | 1,338 (100.0%) | 502 (100.0%) |
Housing Structure by Heating Type in Indian Rocks Beach
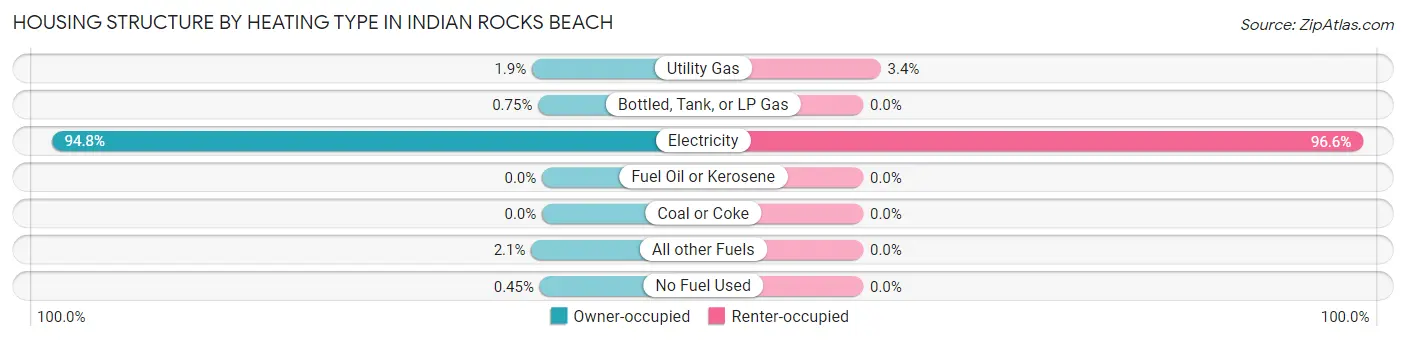
| Heating Type | Owner-occupied | Renter-occupied |
| Utility Gas | 26 (1.9%) | 17 (3.4%) |
| Bottled, Tank, or LP Gas | 10 (0.7%) | 0 (0.0%) |
| Electricity | 1,268 (94.8%) | 485 (96.6%) |
| Fuel Oil or Kerosene | 0 (0.0%) | 0 (0.0%) |
| Coal or Coke | 0 (0.0%) | 0 (0.0%) |
| All other Fuels | 28 (2.1%) | 0 (0.0%) |
| No Fuel Used | 6 (0.4%) | 0 (0.0%) |
| Total | 1,338 (100.0%) | 502 (100.0%) |
Household Vehicle Usage in Indian Rocks Beach
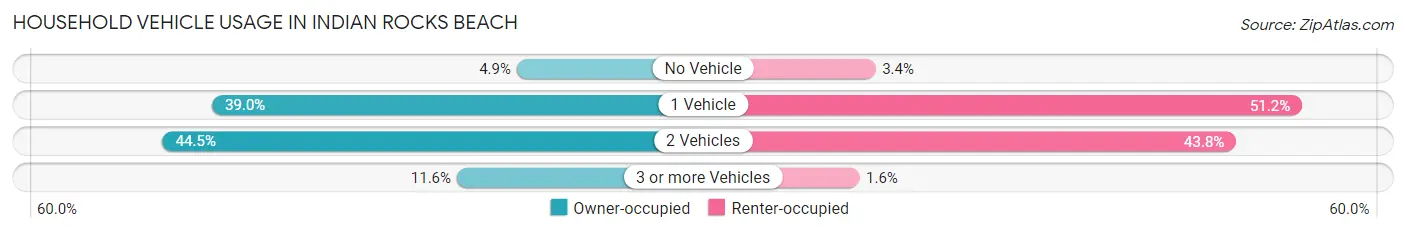
| Vehicles per Household | Owner-occupied | Renter-occupied |
| No Vehicle | 65 (4.9%) | 17 (3.4%) |
| 1 Vehicle | 522 (39.0%) | 257 (51.2%) |
| 2 Vehicles | 596 (44.5%) | 220 (43.8%) |
| 3 or more Vehicles | 155 (11.6%) | 8 (1.6%) |
| Total | 1,338 (100.0%) | 502 (100.0%) |
Real Estate & Mortgages in Indian Rocks Beach
Real Estate and Mortgage Overview in Indian Rocks Beach
| Characteristic | Without Mortgage | With Mortgage |
| Housing Units | 667 | 671 |
| Median Property Value | $671,200 | $662,100 |
| Median Household Income | $78,250 | $323 |
| Monthly Housing Costs | $990 | $315 |
| Real Estate Taxes | $4,567 | $15 |
Property Value by Mortgage Status in Indian Rocks Beach
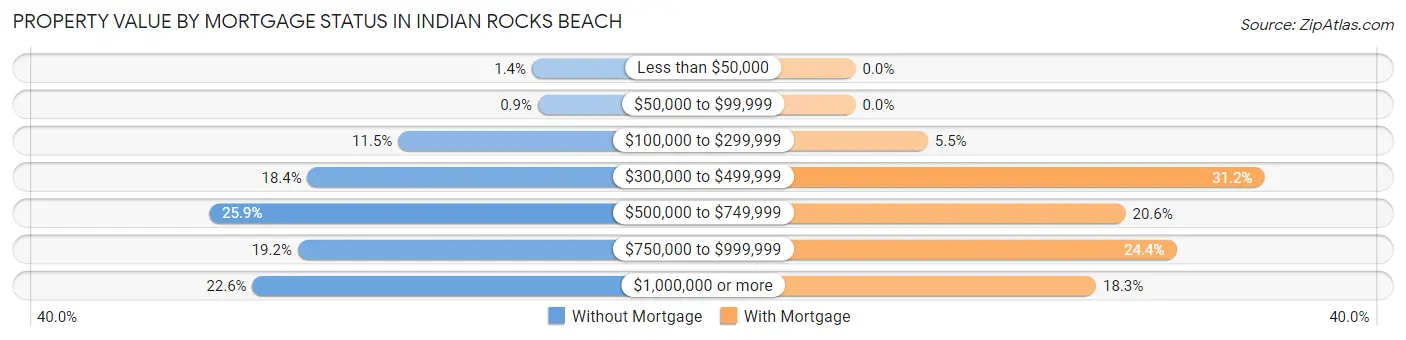
| Property Value | Without Mortgage | With Mortgage |
| Less than $50,000 | 9 (1.3%) | 0 (0.0%) |
| $50,000 to $99,999 | 6 (0.9%) | 0 (0.0%) |
| $100,000 to $299,999 | 77 (11.5%) | 37 (5.5%) |
| $300,000 to $499,999 | 123 (18.4%) | 209 (31.1%) |
| $500,000 to $749,999 | 173 (25.9%) | 138 (20.6%) |
| $750,000 to $999,999 | 128 (19.2%) | 164 (24.4%) |
| $1,000,000 or more | 151 (22.6%) | 123 (18.3%) |
| Total | 667 (100.0%) | 671 (100.0%) |
Household Income by Mortgage Status in Indian Rocks Beach
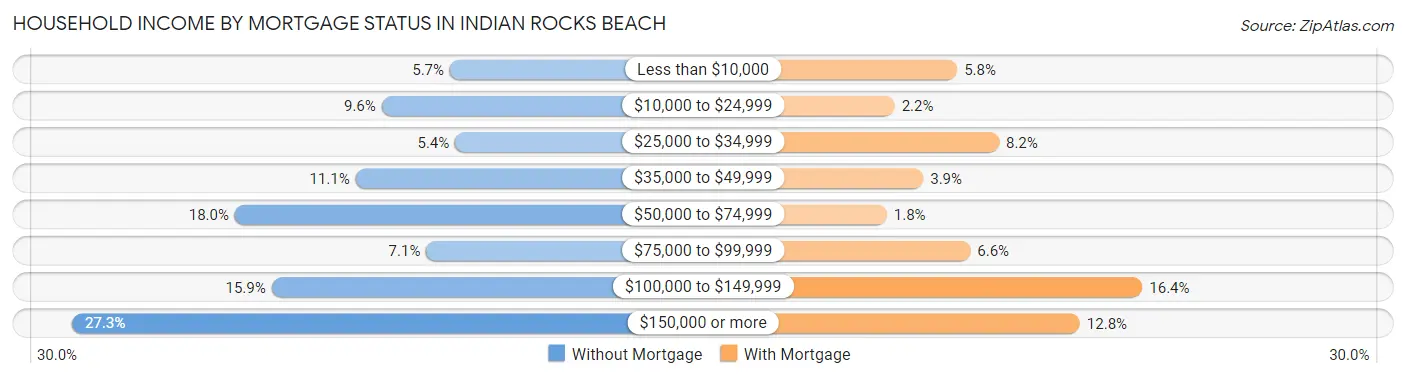
| Household Income | Without Mortgage | With Mortgage |
| Less than $10,000 | 38 (5.7%) | 39 (5.8%) |
| $10,000 to $24,999 | 64 (9.6%) | 15 (2.2%) |
| $25,000 to $34,999 | 36 (5.4%) | 55 (8.2%) |
| $35,000 to $49,999 | 74 (11.1%) | 26 (3.9%) |
| $50,000 to $74,999 | 120 (18.0%) | 12 (1.8%) |
| $75,000 to $99,999 | 47 (7.0%) | 44 (6.6%) |
| $100,000 to $149,999 | 106 (15.9%) | 110 (16.4%) |
| $150,000 or more | 182 (27.3%) | 86 (12.8%) |
| Total | 667 (100.0%) | 671 (100.0%) |
Property Value to Household Income Ratio in Indian Rocks Beach
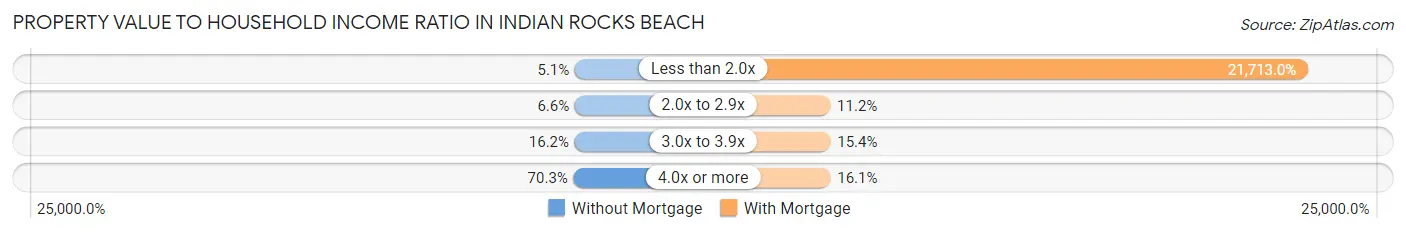
| Value-to-Income Ratio | Without Mortgage | With Mortgage |
| Less than 2.0x | 34 (5.1%) | 145,694 (21,713.0%) |
| 2.0x to 2.9x | 44 (6.6%) | 75 (11.2%) |
| 3.0x to 3.9x | 108 (16.2%) | 103 (15.3%) |
| 4.0x or more | 469 (70.3%) | 108 (16.1%) |
| Total | 667 (100.0%) | 671 (100.0%) |
Real Estate Taxes by Mortgage Status in Indian Rocks Beach
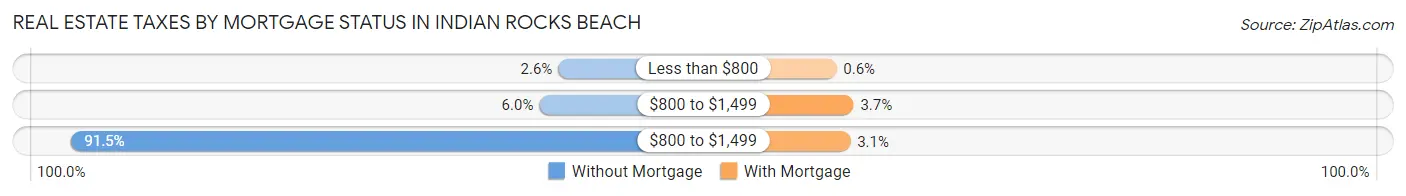
| Property Taxes | Without Mortgage | With Mortgage |
| Less than $800 | 17 (2.5%) | 4 (0.6%) |
| $800 to $1,499 | 40 (6.0%) | 25 (3.7%) |
| $800 to $1,499 | 610 (91.4%) | 21 (3.1%) |
| Total | 667 (100.0%) | 671 (100.0%) |
Health & Disability in Indian Rocks Beach
Health Insurance Coverage by Age in Indian Rocks Beach
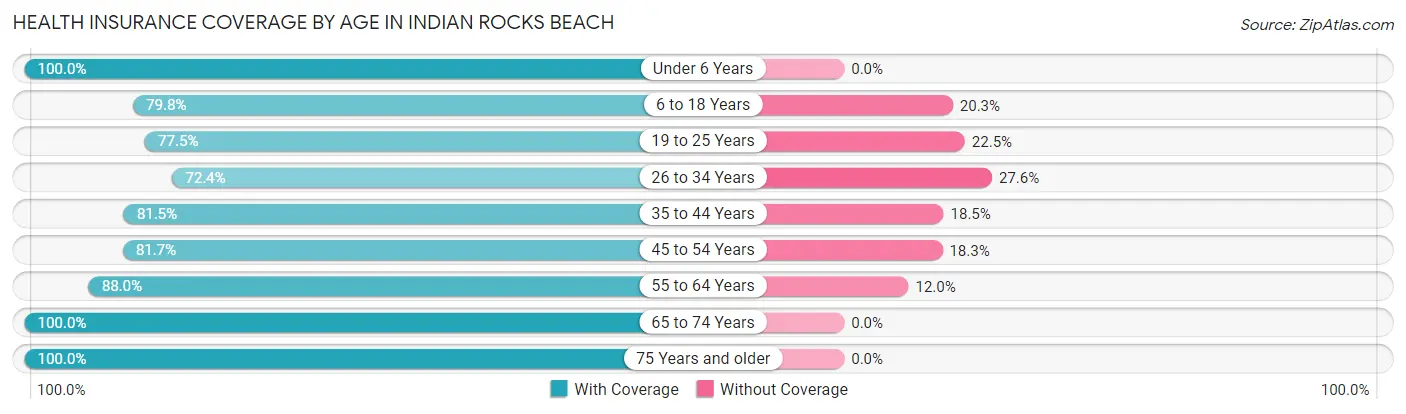
| Age Bracket | With Coverage | Without Coverage |
| Under 6 Years | 57 (100.0%) | 0 (0.0%) |
| 6 to 18 Years | 189 (79.7%) | 48 (20.3%) |
| 19 to 25 Years | 131 (77.5%) | 38 (22.5%) |
| 26 to 34 Years | 163 (72.4%) | 62 (27.6%) |
| 35 to 44 Years | 286 (81.5%) | 65 (18.5%) |
| 45 to 54 Years | 473 (81.7%) | 106 (18.3%) |
| 55 to 64 Years | 735 (88.0%) | 100 (12.0%) |
| 65 to 74 Years | 742 (100.0%) | 0 (0.0%) |
| 75 Years and older | 490 (100.0%) | 0 (0.0%) |
| Total | 3,266 (88.6%) | 419 (11.4%) |
Health Insurance Coverage by Citizenship Status in Indian Rocks Beach
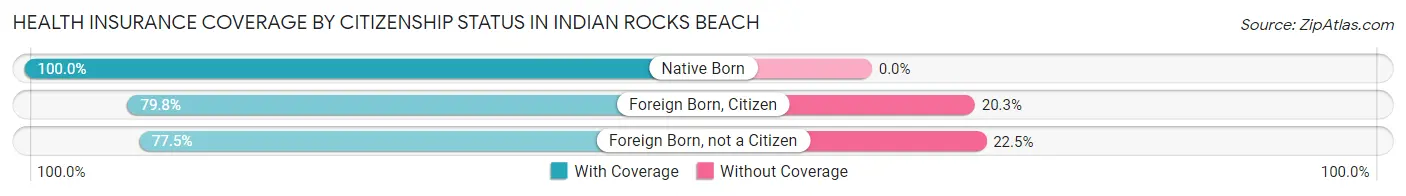
| Citizenship Status | With Coverage | Without Coverage |
| Native Born | 57 (100.0%) | 0 (0.0%) |
| Foreign Born, Citizen | 189 (79.7%) | 48 (20.3%) |
| Foreign Born, not a Citizen | 131 (77.5%) | 38 (22.5%) |
Health Insurance Coverage by Household Income in Indian Rocks Beach
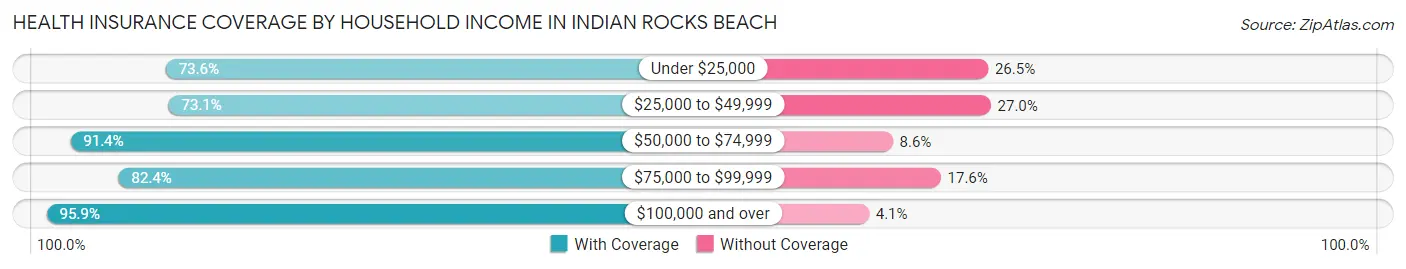
| Household Income | With Coverage | Without Coverage |
| Under $25,000 | 292 (73.6%) | 105 (26.5%) |
| $25,000 to $49,999 | 309 (73.1%) | 114 (27.0%) |
| $50,000 to $74,999 | 426 (91.4%) | 40 (8.6%) |
| $75,000 to $99,999 | 375 (82.4%) | 80 (17.6%) |
| $100,000 and over | 1,864 (95.9%) | 80 (4.1%) |
Public vs Private Health Insurance Coverage by Age in Indian Rocks Beach
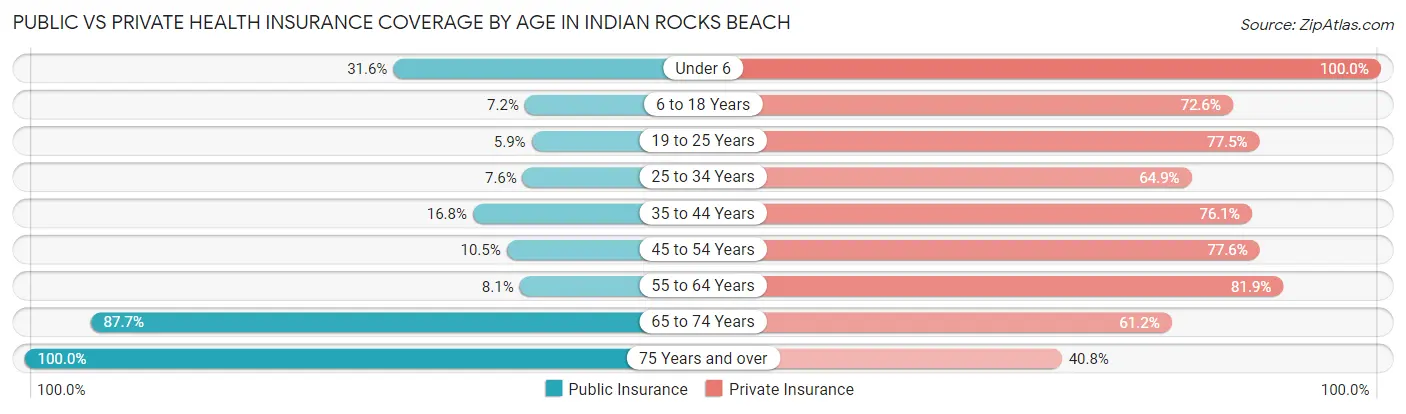
| Age Bracket | Public Insurance | Private Insurance |
| Under 6 | 18 (31.6%) | 57 (100.0%) |
| 6 to 18 Years | 17 (7.2%) | 172 (72.6%) |
| 19 to 25 Years | 10 (5.9%) | 131 (77.5%) |
| 25 to 34 Years | 17 (7.6%) | 146 (64.9%) |
| 35 to 44 Years | 59 (16.8%) | 267 (76.1%) |
| 45 to 54 Years | 61 (10.5%) | 449 (77.5%) |
| 55 to 64 Years | 68 (8.1%) | 684 (81.9%) |
| 65 to 74 Years | 651 (87.7%) | 454 (61.2%) |
| 75 Years and over | 490 (100.0%) | 200 (40.8%) |
| Total | 1,391 (37.8%) | 2,560 (69.5%) |
Disability Status by Sex by Age in Indian Rocks Beach
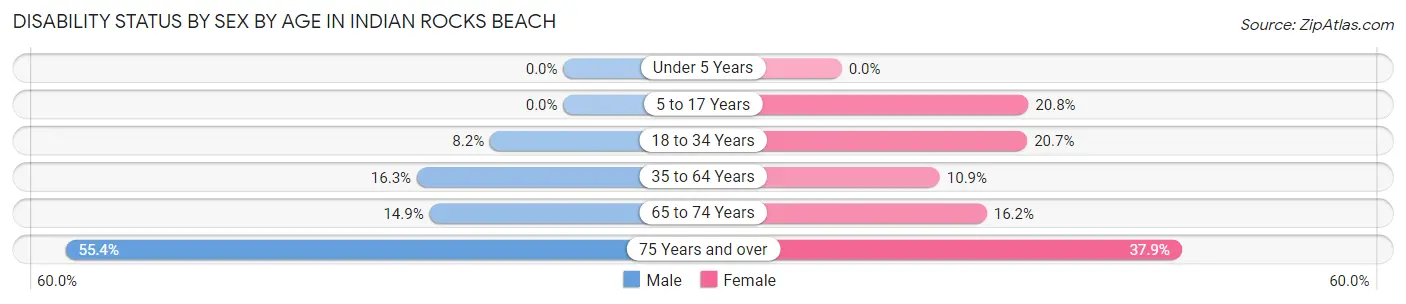
| Age Bracket | Male | Female |
| Under 5 Years | 0 (0.0%) | 0 (0.0%) |
| 5 to 17 Years | 0 (0.0%) | 16 (20.8%) |
| 18 to 34 Years | 17 (8.2%) | 51 (20.6%) |
| 35 to 64 Years | 152 (16.3%) | 91 (10.9%) |
| 65 to 74 Years | 58 (14.9%) | 57 (16.2%) |
| 75 Years and over | 153 (55.4%) | 81 (37.9%) |
Disability Class by Sex by Age in Indian Rocks Beach
Disability Class: Hearing Difficulty
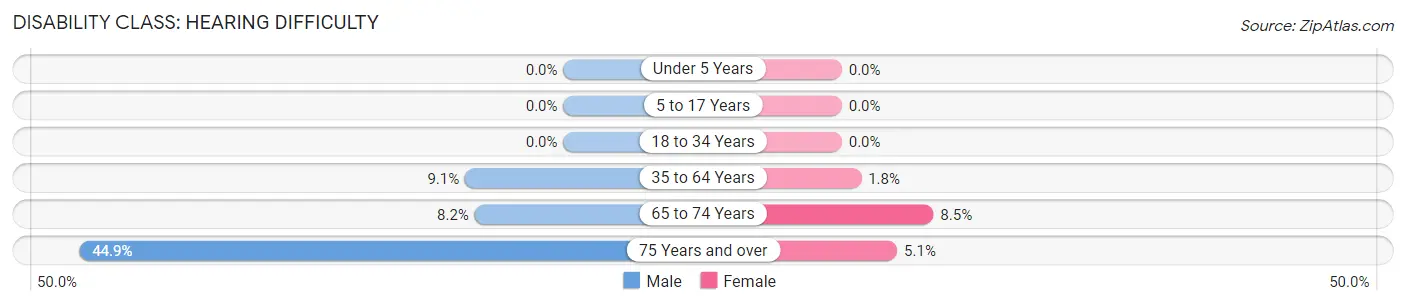
| Age Bracket | Male | Female |
| Under 5 Years | 0 (0.0%) | 0 (0.0%) |
| 5 to 17 Years | 0 (0.0%) | 0 (0.0%) |
| 18 to 34 Years | 0 (0.0%) | 0 (0.0%) |
| 35 to 64 Years | 85 (9.1%) | 15 (1.8%) |
| 65 to 74 Years | 32 (8.2%) | 30 (8.5%) |
| 75 Years and over | 124 (44.9%) | 11 (5.1%) |
Disability Class: Vision Difficulty
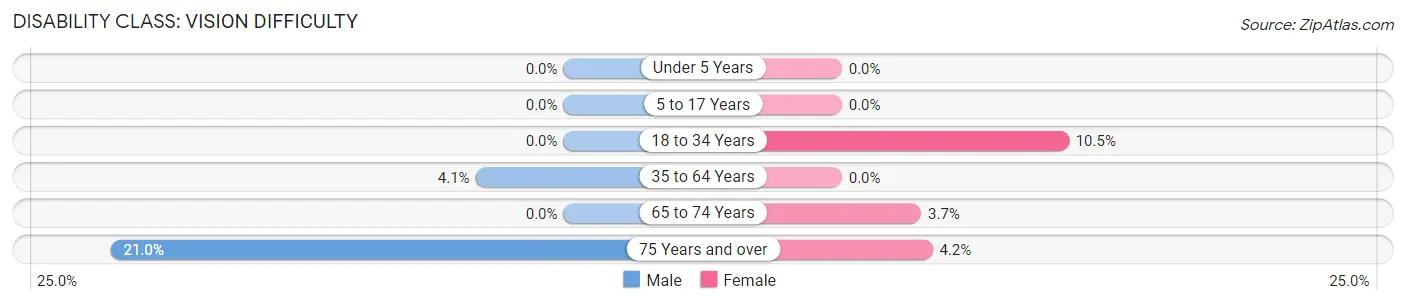
| Age Bracket | Male | Female |
| Under 5 Years | 0 (0.0%) | 0 (0.0%) |
| 5 to 17 Years | 0 (0.0%) | 0 (0.0%) |
| 18 to 34 Years | 0 (0.0%) | 26 (10.5%) |
| 35 to 64 Years | 38 (4.1%) | 0 (0.0%) |
| 65 to 74 Years | 0 (0.0%) | 13 (3.7%) |
| 75 Years and over | 58 (21.0%) | 9 (4.2%) |
Disability Class: Cognitive Difficulty
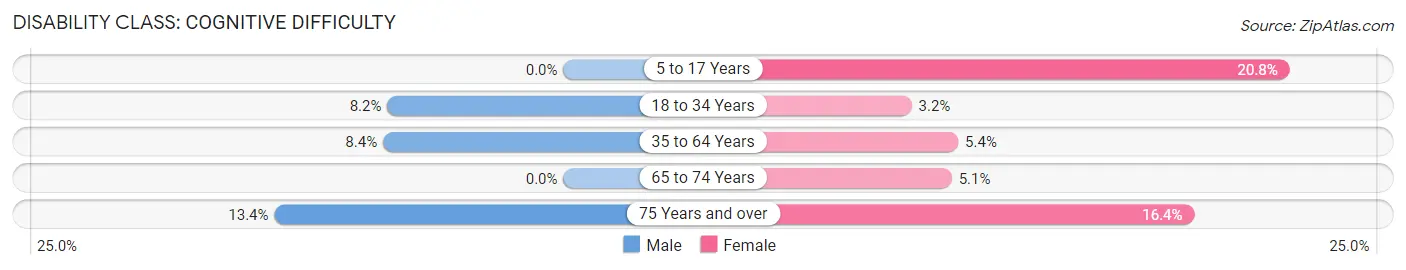
| Age Bracket | Male | Female |
| 5 to 17 Years | 0 (0.0%) | 16 (20.8%) |
| 18 to 34 Years | 17 (8.2%) | 8 (3.2%) |
| 35 to 64 Years | 78 (8.4%) | 45 (5.4%) |
| 65 to 74 Years | 0 (0.0%) | 18 (5.1%) |
| 75 Years and over | 37 (13.4%) | 35 (16.4%) |
Disability Class: Ambulatory Difficulty
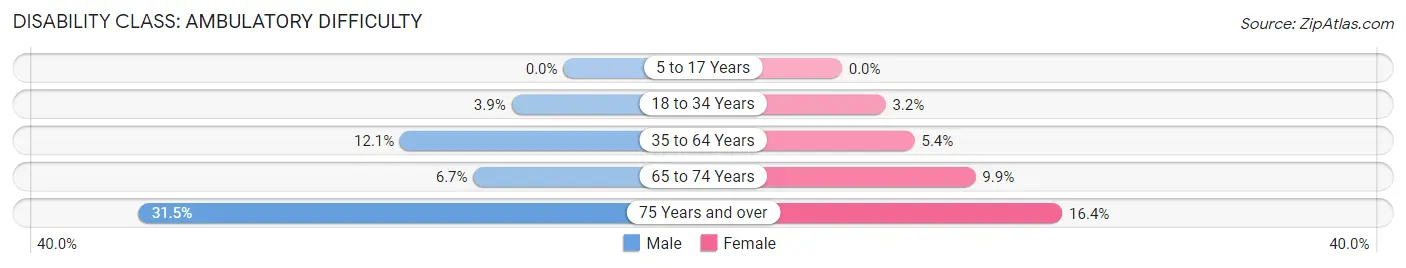
| Age Bracket | Male | Female |
| 5 to 17 Years | 0 (0.0%) | 0 (0.0%) |
| 18 to 34 Years | 8 (3.8%) | 8 (3.2%) |
| 35 to 64 Years | 113 (12.1%) | 45 (5.4%) |
| 65 to 74 Years | 26 (6.7%) | 35 (9.9%) |
| 75 Years and over | 87 (31.5%) | 35 (16.4%) |
Disability Class: Self-Care Difficulty
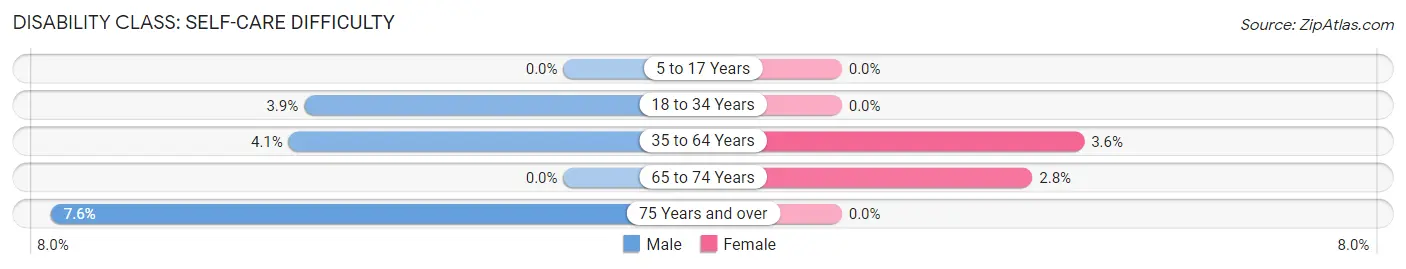
| Age Bracket | Male | Female |
| 5 to 17 Years | 0 (0.0%) | 0 (0.0%) |
| 18 to 34 Years | 8 (3.8%) | 0 (0.0%) |
| 35 to 64 Years | 38 (4.1%) | 30 (3.6%) |
| 65 to 74 Years | 0 (0.0%) | 10 (2.8%) |
| 75 Years and over | 21 (7.6%) | 0 (0.0%) |
Technology Access in Indian Rocks Beach
Computing Device Access in Indian Rocks Beach
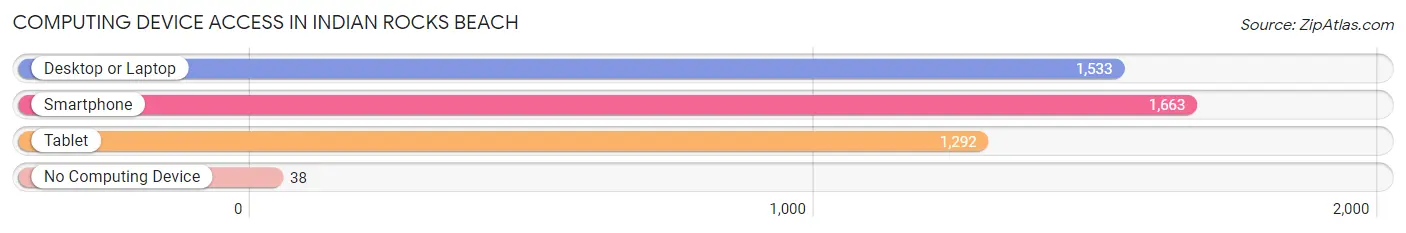
| Device Type | # Households | % Households |
| Desktop or Laptop | 1,533 | 83.3% |
| Smartphone | 1,663 | 90.4% |
| Tablet | 1,292 | 70.2% |
| No Computing Device | 38 | 2.1% |
| Total | 1,840 | 100.0% |
Internet Access in Indian Rocks Beach
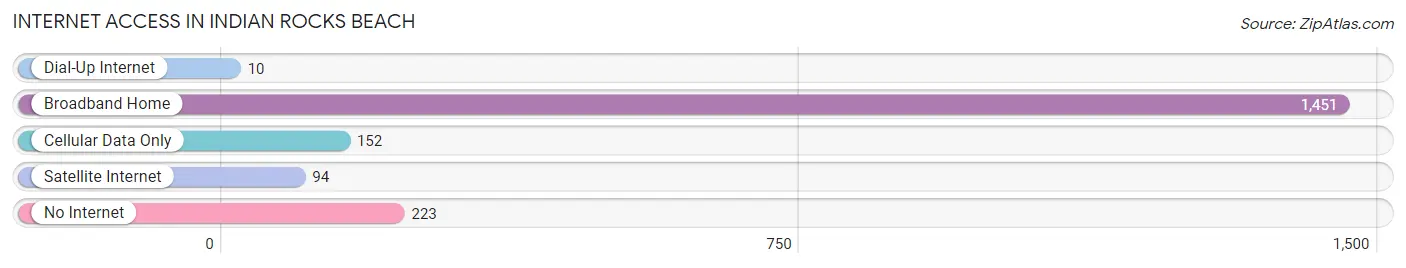
| Internet Type | # Households | % Households |
| Dial-Up Internet | 10 | 0.5% |
| Broadband Home | 1,451 | 78.9% |
| Cellular Data Only | 152 | 8.3% |
| Satellite Internet | 94 | 5.1% |
| No Internet | 223 | 12.1% |
| Total | 1,840 | 100.0% |
Indian Rocks Beach Summary
History
Indian Rocks Beach is a city located in Pinellas County, Florida. It is situated on a barrier island along the Gulf of Mexico, just south of Clearwater Beach. The city was originally inhabited by the Tocobaga Indians, who were the first known inhabitants of the area. The first recorded European contact with the area was in 1528, when Spanish explorer Panfilo de Narvaez landed on the shores of Indian Rocks Beach. The area remained largely undeveloped until the late 19th century, when the first settlers began to arrive.
The first permanent settlement in Indian Rocks Beach was established in 1892 by William and Mary Starkey. The Starkeys purchased a large tract of land on the island and began to develop it into a resort community. They built a hotel, a post office, and a general store, and the area quickly became a popular destination for tourists. The Starkeys also built a bridge connecting the island to the mainland, which allowed for easier access to the area.
In the early 20th century, the area continued to grow and develop. The city was officially incorporated in 1925, and the population grew to over 1,000 by the 1940s. The city continued to grow throughout the mid-20th century, and by the 1990s, the population had grown to over 3,000.
Geography
Indian Rocks Beach is located in Pinellas County, Florida, on a barrier island along the Gulf of Mexico. The city is situated between Clearwater Beach to the north and St. Pete Beach to the south. The city is bordered by the Intracoastal Waterway to the east and the Gulf of Mexico to the west. The city covers an area of approximately 4.5 square miles, and the population was 3,092 at the 2010 census.
The city is located on a barrier island, which is composed of sand and limestone. The island is surrounded by the Intracoastal Waterway and the Gulf of Mexico. The city is home to several beaches, including Indian Rocks Beach, Indian Shores Beach, and Redington Beach. The city also has several parks, including Indian Rocks Beach Nature Preserve, Indian Rocks Beach Park, and Indian Rocks Beach Recreation Center.
Economy
The economy of Indian Rocks Beach is largely based on tourism. The city is home to several hotels, restaurants, and other businesses that cater to tourists. The city also has several marinas, which provide services to boaters and fishermen. The city is also home to several retail stores, including souvenir shops, clothing stores, and convenience stores.
The city is also home to several manufacturing and industrial businesses. These businesses include a boat manufacturing plant, a printing company, and a plastics factory. The city also has several medical facilities, including a hospital and several medical offices.
Demographics
As of the 2010 census, the population of Indian Rocks Beach was 3,092. The racial makeup of the city was 94.3% White, 1.3% African American, 0.3% Native American, 1.2% Asian, 0.1% Pacific Islander, 1.2% from other races, and 1.6% from two or more races. Hispanic or Latino of any race were 4.2% of the population.
The median household income in Indian Rocks Beach was $50,945, and the median family income was $60,917. The per capita income for the city was $30,945. About 8.3% of families and 10.3% of the population were below the poverty line, including 15.2% of those under age 18 and 4.2% of those age 65 or over.
Common Questions
What is Per Capita Income in Indian Rocks Beach?
Per Capita income in Indian Rocks Beach is $68,585.
What is the Median Family Income in Indian Rocks Beach?
Median Family Income in Indian Rocks Beach is $133,783.
What is the Median Household income in Indian Rocks Beach?
Median Household Income in Indian Rocks Beach is $92,283.
What is Income or Wage Gap in Indian Rocks Beach?
Income or Wage Gap in Indian Rocks Beach is 39.8%.
Women in Indian Rocks Beach earn 60.2 cents for every dollar earned by a man.
What is Inequality or Gini Index in Indian Rocks Beach?
Inequality or Gini Index in Indian Rocks Beach is 0.49.
What is the Total Population of Indian Rocks Beach?
Total Population of Indian Rocks Beach is 3,689.
What is the Total Male Population of Indian Rocks Beach?
Total Male Population of Indian Rocks Beach is 1,934.
What is the Total Female Population of Indian Rocks Beach?
Total Female Population of Indian Rocks Beach is 1,755.
What is the Ratio of Males per 100 Females in Indian Rocks Beach?
There are 110.20 Males per 100 Females in Indian Rocks Beach.
What is the Ratio of Females per 100 Males in Indian Rocks Beach?
There are 90.74 Females per 100 Males in Indian Rocks Beach.
What is the Median Population Age in Indian Rocks Beach?
Median Population Age in Indian Rocks Beach is 58.2 Years.
What is the Average Family Size in Indian Rocks Beach
Average Family Size in Indian Rocks Beach is 2.4 People.
What is the Average Household Size in Indian Rocks Beach
Average Household Size in Indian Rocks Beach is 2.0 People.
How Large is the Labor Force in Indian Rocks Beach?
There are 2,080 People in the Labor Forcein in Indian Rocks Beach.
What is the Percentage of People in the Labor Force in Indian Rocks Beach?
58.9% of People are in the Labor Force in Indian Rocks Beach.
What is the Unemployment Rate in Indian Rocks Beach?
Unemployment Rate in Indian Rocks Beach is 4.9%.