Englewood, FL Map & Demographics
Englewood Map
Englewood Overview
$45,531
PER CAPITA INCOME
$72,695
AVG FAMILY INCOME
$61,734
AVG HOUSEHOLD INCOME
0.6%
WAGE / INCOME GAP [ % ]
99.4¢/ $1
WAGE / INCOME GAP [ $ ]
0.46
INEQUALITY / GINI INDEX
19,378
TOTAL POPULATION
9,671
MALE POPULATION
9,707
FEMALE POPULATION
99.63
MALES / 100 FEMALES
100.37
FEMALES / 100 MALES
67.8
MEDIAN AGE
2.4
AVG FAMILY SIZE
1.9
AVG HOUSEHOLD SIZE
5,720
LABOR FORCE [ PEOPLE ]
31.2%
PERCENT IN LABOR FORCE
4.6%
UNEMPLOYMENT RATE
Englewood Area Codes
Income in Englewood
Income Overview in Englewood
Per Capita Income in Englewood is $45,531, while median incomes of families and households are $72,695 and $61,734 respectively.
| Characteristic | Number | Measure |
| Per Capita Income | 19,378 | $45,531 |
| Median Family Income | 5,849 | $72,695 |
| Mean Family Income | 5,849 | $101,868 |
| Median Household Income | 10,132 | $61,734 |
| Mean Household Income | 10,132 | $85,382 |
| Income Deficit | 5,849 | $0 |
| Wage / Income Gap (%) | 19,378 | 0.63% |
| Wage / Income Gap ($) | 19,378 | 99.37¢ per $1 |
| Gini / Inequality Index | 19,378 | 0.46 |
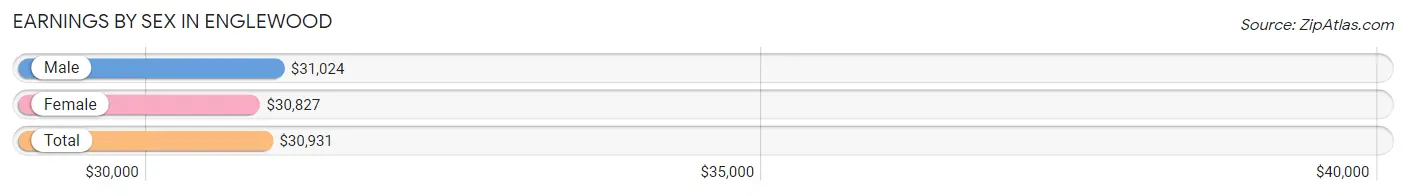
Earnings by Sex in Englewood
Average Earnings in Englewood are $30,931, $31,024 for men and $30,827 for women, a difference of 0.6%.
| Sex | Number | Average Earnings |
| Male | 3,293 (51.9%) | $31,024 |
| Female | 3,049 (48.1%) | $30,827 |
| Total | 6,342 (100.0%) | $30,931 |
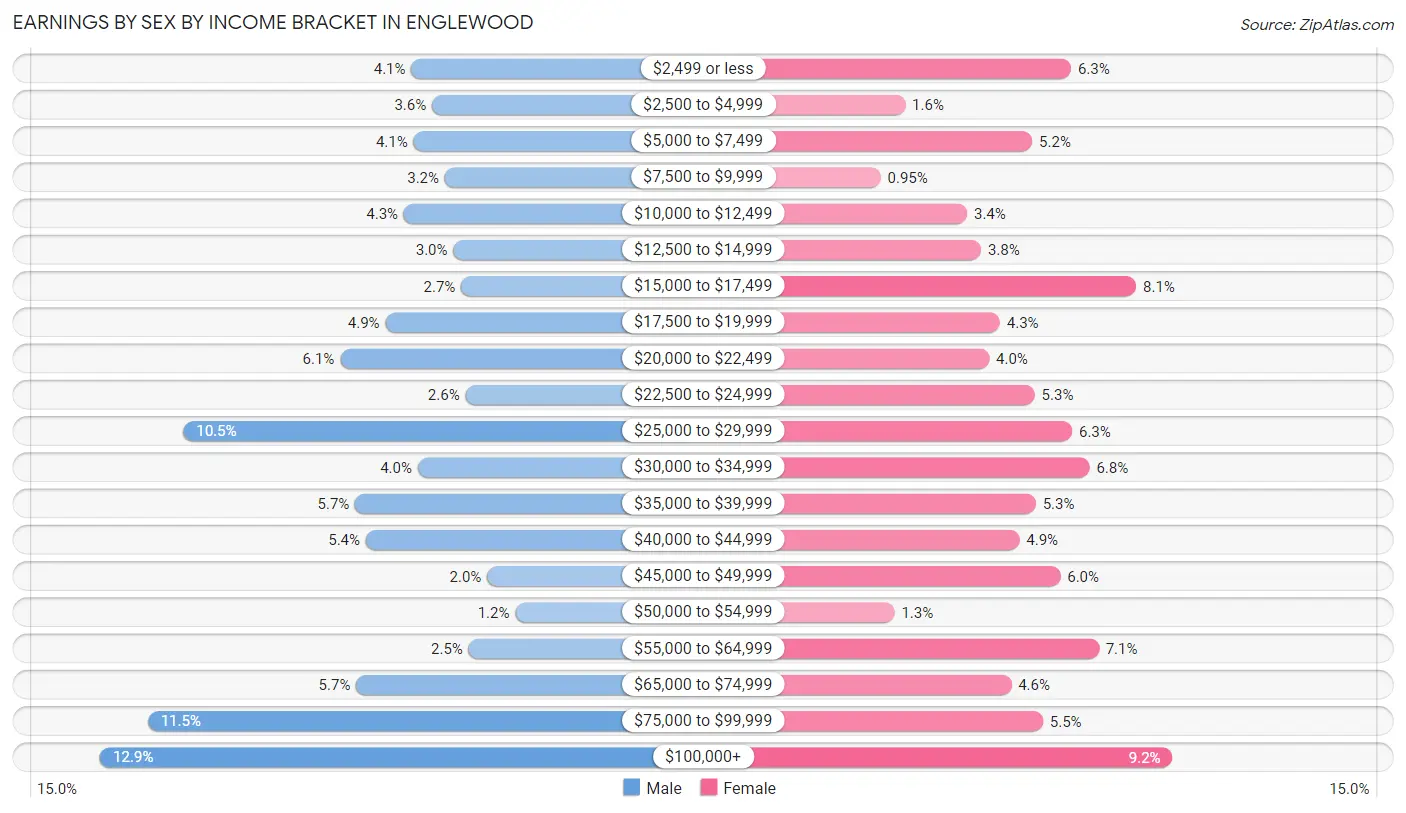
Earnings by Sex by Income Bracket in Englewood
The most common earnings brackets in Englewood are $100,000+ for men (424 | 12.9%) and $100,000+ for women (279 | 9.1%).
| Income | Male | Female |
| $2,499 or less | 136 (4.1%) | 192 (6.3%) |
| $2,500 to $4,999 | 117 (3.5%) | 50 (1.6%) |
| $5,000 to $7,499 | 134 (4.1%) | 159 (5.2%) |
| $7,500 to $9,999 | 105 (3.2%) | 29 (0.9%) |
| $10,000 to $12,499 | 143 (4.3%) | 103 (3.4%) |
| $12,500 to $14,999 | 97 (2.9%) | 115 (3.8%) |
| $15,000 to $17,499 | 90 (2.7%) | 248 (8.1%) |
| $17,500 to $19,999 | 160 (4.9%) | 131 (4.3%) |
| $20,000 to $22,499 | 202 (6.1%) | 122 (4.0%) |
| $22,500 to $24,999 | 86 (2.6%) | 161 (5.3%) |
| $25,000 to $29,999 | 347 (10.5%) | 193 (6.3%) |
| $30,000 to $34,999 | 130 (4.0%) | 208 (6.8%) |
| $35,000 to $39,999 | 188 (5.7%) | 162 (5.3%) |
| $40,000 to $44,999 | 178 (5.4%) | 148 (4.9%) |
| $45,000 to $49,999 | 66 (2.0%) | 183 (6.0%) |
| $50,000 to $54,999 | 40 (1.2%) | 41 (1.3%) |
| $55,000 to $64,999 | 83 (2.5%) | 216 (7.1%) |
| $65,000 to $74,999 | 187 (5.7%) | 141 (4.6%) |
| $75,000 to $99,999 | 380 (11.5%) | 168 (5.5%) |
| $100,000+ | 424 (12.9%) | 279 (9.1%) |
| Total | 3,293 (100.0%) | 3,049 (100.0%) |
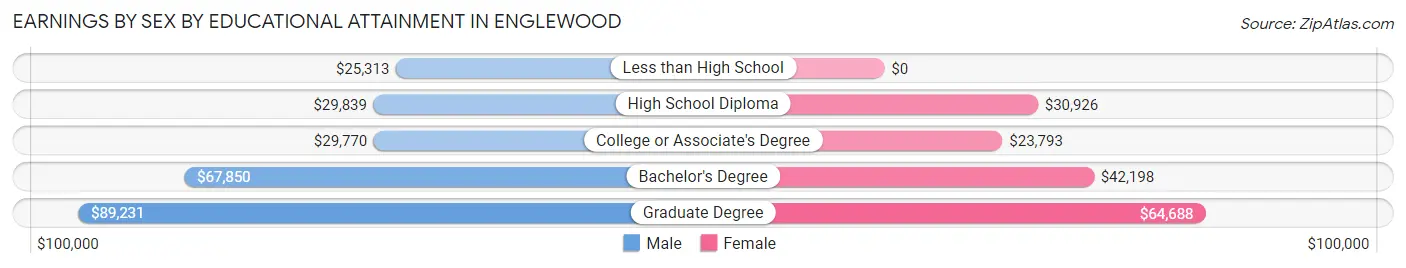
Earnings by Sex by Educational Attainment in Englewood
Average earnings in Englewood are $36,511 for men and $34,050 for women, a difference of 6.7%. Men with an educational attainment of graduate degree enjoy the highest average annual earnings of $89,231, while those with less than high school education earn the least with $25,313. Women with an educational attainment of graduate degree earn the most with the average annual earnings of $64,688, while those with college or associate's degree education have the smallest earnings of $23,793.
| Educational Attainment | Male Income | Female Income |
| Less than High School | $25,313 | $0 |
| High School Diploma | $29,839 | $30,926 |
| College or Associate's Degree | $29,770 | $23,793 |
| Bachelor's Degree | $67,850 | $42,198 |
| Graduate Degree | $89,231 | $64,688 |
| Total | $36,511 | $34,050 |
Family Income in Englewood
Family Income Brackets in Englewood
According to the Englewood family income data, there are 1,246 families falling into the $50,000 to $74,999 income range, which is the most common income bracket and makes up 21.3% of all families. Conversely, the $10,000 to $14,999 income bracket is the least frequent group with only 58 families (1.0%) belonging to this category.
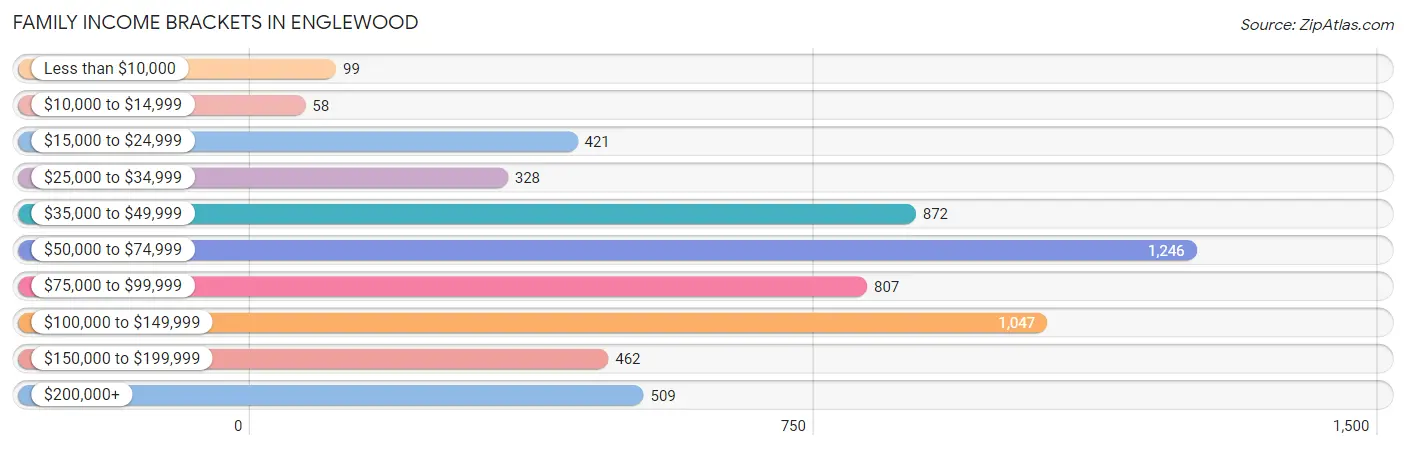
| Income Bracket | # Families | % Families |
| Less than $10,000 | 99 | 1.7% |
| $10,000 to $14,999 | 58 | 1.0% |
| $15,000 to $24,999 | 421 | 7.2% |
| $25,000 to $34,999 | 328 | 5.6% |
| $35,000 to $49,999 | 872 | 14.9% |
| $50,000 to $74,999 | 1,246 | 21.3% |
| $75,000 to $99,999 | 807 | 13.8% |
| $100,000 to $149,999 | 1,047 | 17.9% |
| $150,000 to $199,999 | 462 | 7.9% |
| $200,000+ | 509 | 8.7% |
Family Income by Famaliy Size in Englewood
4-person families (225 | 3.8%) account for the highest median family income in Englewood with $112,679 per family, while 2-person families (4,960 | 84.8%) have the highest median income of $36,552 per family member.
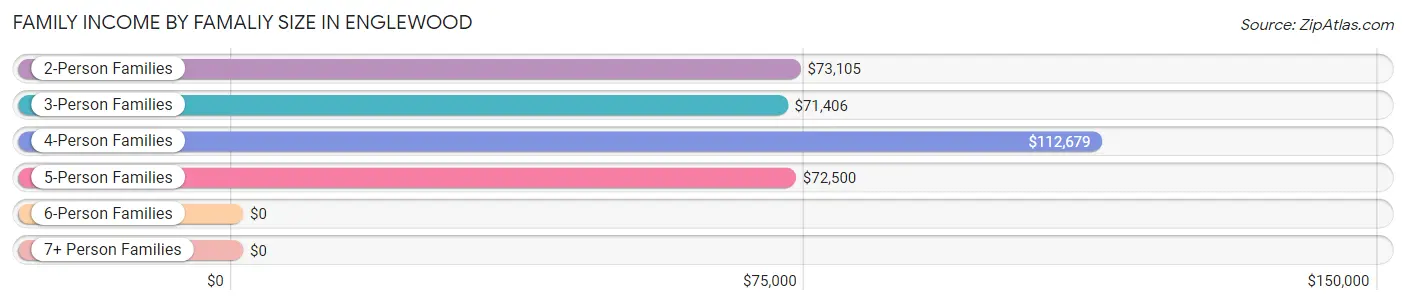
| Income Bracket | # Families | Median Income |
| 2-Person Families | 4,960 (84.8%) | $73,105 |
| 3-Person Families | 490 (8.4%) | $71,406 |
| 4-Person Families | 225 (3.8%) | $112,679 |
| 5-Person Families | 104 (1.8%) | $72,500 |
| 6-Person Families | 70 (1.2%) | $0 |
| 7+ Person Families | 0 (0.0%) | $0 |
| Total | 5,849 (100.0%) | $72,695 |
Family Income by Number of Earners in Englewood
The median family income in Englewood is $72,695, with families comprising 3+ earners (164) having the highest median family income of $113,857, while families with no earners (3,225) have the lowest median family income of $63,410, accounting for 2.8% and 55.1% of families, respectively.
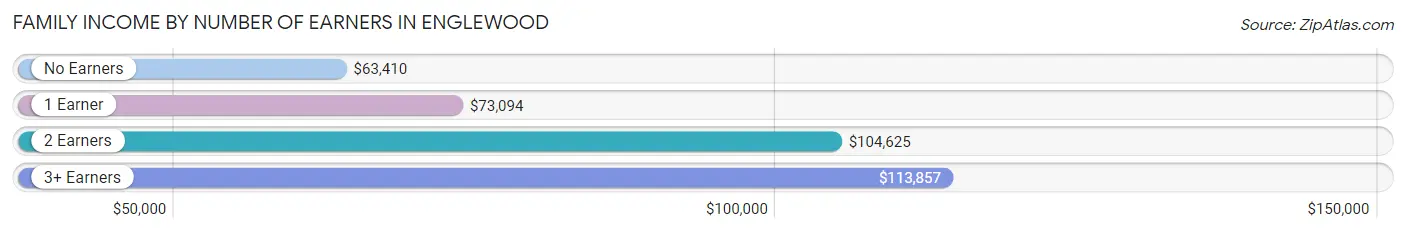
| Number of Earners | # Families | Median Income |
| No Earners | 3,225 (55.1%) | $63,410 |
| 1 Earner | 1,251 (21.4%) | $73,094 |
| 2 Earners | 1,209 (20.7%) | $104,625 |
| 3+ Earners | 164 (2.8%) | $113,857 |
| Total | 5,849 (100.0%) | $72,695 |
Household Income in Englewood
Household Income Brackets in Englewood
With 2,229 households falling in the category, the $50,000 to $74,999 income range is the most frequent in Englewood, accounting for 22.0% of all households. In contrast, only 304 households (3.0%) fall into the $10,000 to $14,999 income bracket, making it the least populous group.
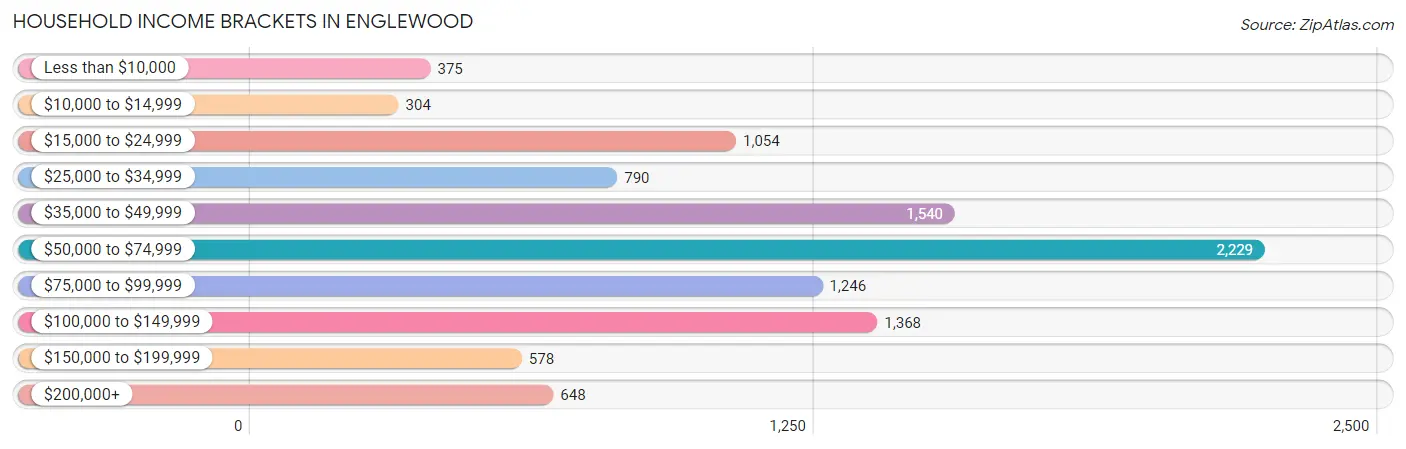
| Income Bracket | # Households | % Households |
| Less than $10,000 | 375 | 3.7% |
| $10,000 to $14,999 | 304 | 3.0% |
| $15,000 to $24,999 | 1,054 | 10.4% |
| $25,000 to $34,999 | 790 | 7.8% |
| $35,000 to $49,999 | 1,540 | 15.2% |
| $50,000 to $74,999 | 2,229 | 22.0% |
| $75,000 to $99,999 | 1,246 | 12.3% |
| $100,000 to $149,999 | 1,368 | 13.5% |
| $150,000 to $199,999 | 578 | 5.7% |
| $200,000+ | 648 | 6.4% |
Household Income by Householder Age in Englewood
The median household income in Englewood is $61,734, with the highest median household income of $72,258 found in the 25 to 44 years age bracket for the primary householder. A total of 640 households (6.3%) fall into this category. Meanwhile, the 15 to 24 years age bracket for the primary householder has the lowest median household income of $0, with 79 households (0.8%) in this group.
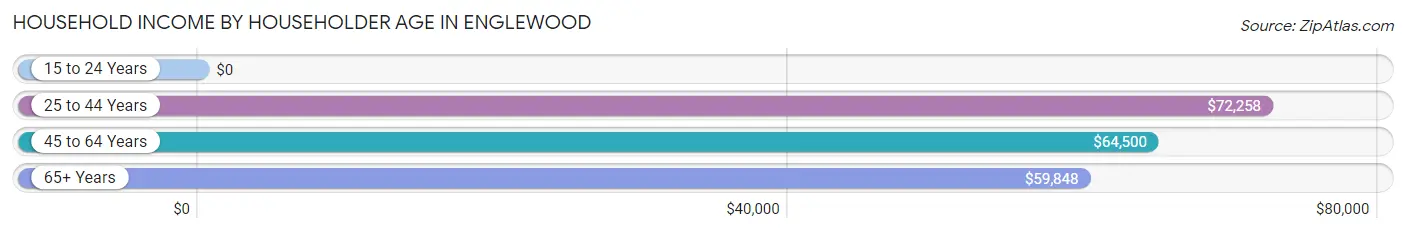
| Income Bracket | # Households | Median Income |
| 15 to 24 Years | 79 (0.8%) | $0 |
| 25 to 44 Years | 640 (6.3%) | $72,258 |
| 45 to 64 Years | 2,602 (25.7%) | $64,500 |
| 65+ Years | 6,811 (67.2%) | $59,848 |
| Total | 10,132 (100.0%) | $61,734 |
Poverty in Englewood
Income Below Poverty by Sex and Age in Englewood
With 5.5% poverty level for males and 8.9% for females among the residents of Englewood, under 5 year old males and under 5 year old females are the most vulnerable to poverty, with 20 males (12.8%) and 35 females (32.4%) in their respective age groups living below the poverty level.
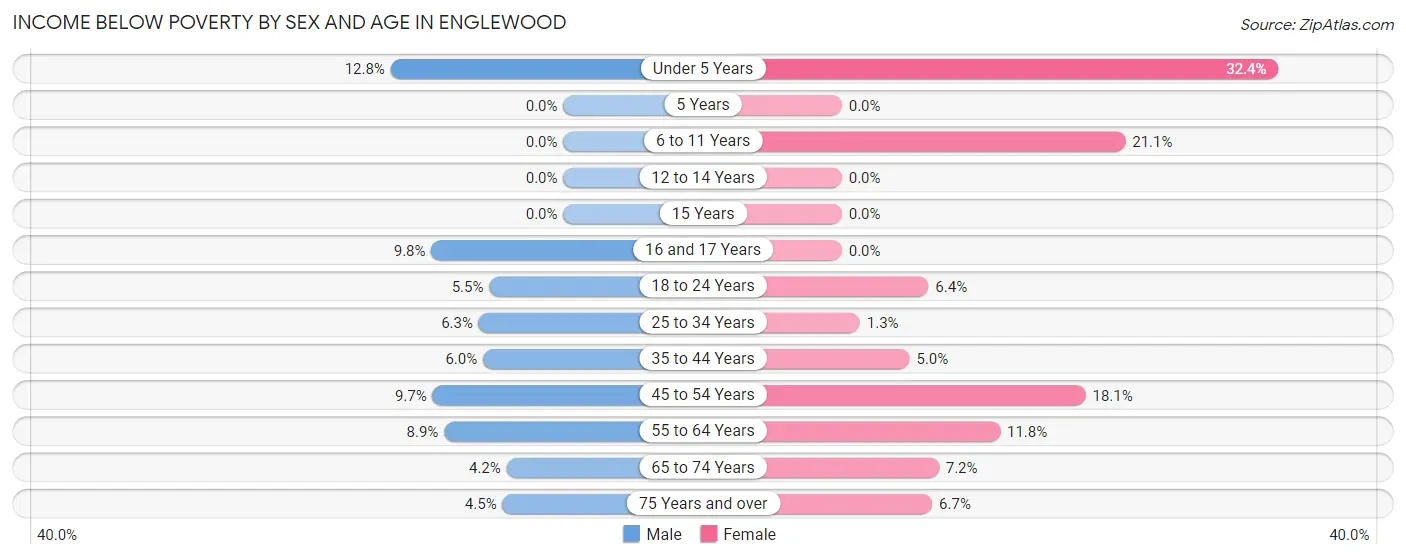
| Age Bracket | Male | Female |
| Under 5 Years | 20 (12.8%) | 35 (32.4%) |
| 5 Years | 0 (0.0%) | 0 (0.0%) |
| 6 to 11 Years | 0 (0.0%) | 28 (21.0%) |
| 12 to 14 Years | 0 (0.0%) | 0 (0.0%) |
| 15 Years | 0 (0.0%) | 0 (0.0%) |
| 16 and 17 Years | 10 (9.8%) | 0 (0.0%) |
| 18 to 24 Years | 23 (5.5%) | 18 (6.4%) |
| 25 to 34 Years | 28 (6.3%) | 5 (1.3%) |
| 35 to 44 Years | 30 (6.0%) | 15 (5.0%) |
| 45 to 54 Years | 57 (9.7%) | 160 (18.1%) |
| 55 to 64 Years | 119 (8.8%) | 208 (11.7%) |
| 65 to 74 Years | 107 (4.2%) | 197 (7.2%) |
| 75 Years and over | 133 (4.5%) | 193 (6.7%) |
| Total | 527 (5.5%) | 859 (8.9%) |
Income Above Poverty by Sex and Age in Englewood
According to the poverty statistics in Englewood, males aged 5 years and females aged 5 years are the age groups that are most secure financially, with 100.0% of males and 100.0% of females in these age groups living above the poverty line.
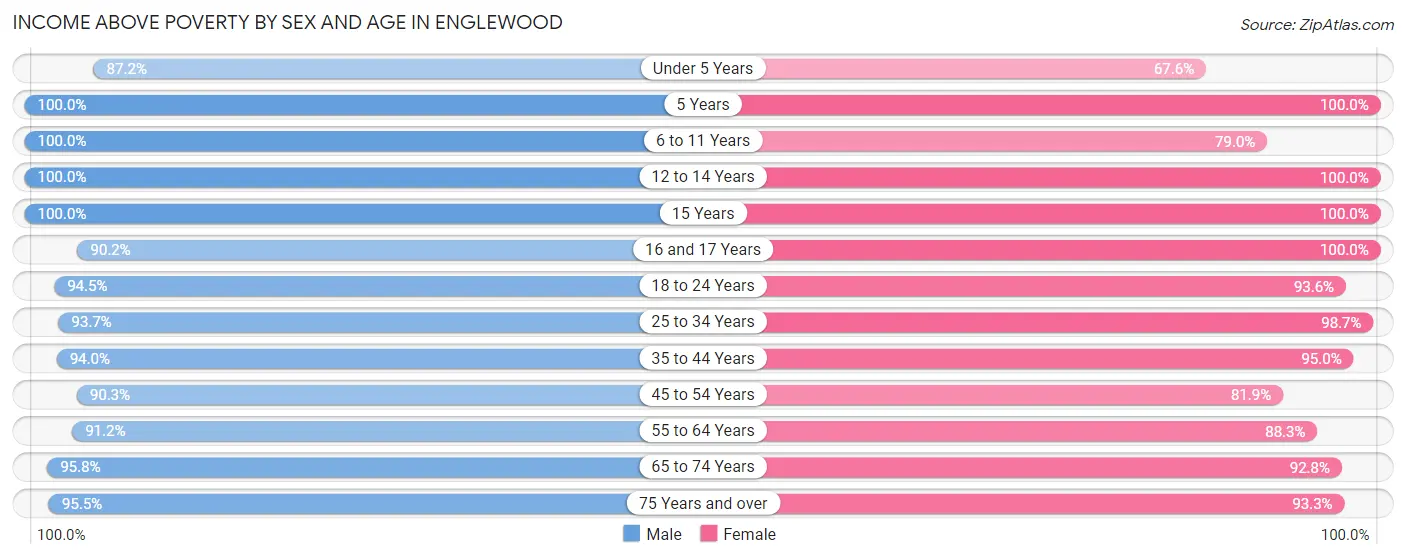
| Age Bracket | Male | Female |
| Under 5 Years | 136 (87.2%) | 73 (67.6%) |
| 5 Years | 59 (100.0%) | 50 (100.0%) |
| 6 to 11 Years | 282 (100.0%) | 105 (78.9%) |
| 12 to 14 Years | 160 (100.0%) | 43 (100.0%) |
| 15 Years | 47 (100.0%) | 8 (100.0%) |
| 16 and 17 Years | 92 (90.2%) | 34 (100.0%) |
| 18 to 24 Years | 395 (94.5%) | 262 (93.6%) |
| 25 to 34 Years | 418 (93.7%) | 368 (98.7%) |
| 35 to 44 Years | 473 (94.0%) | 283 (95.0%) |
| 45 to 54 Years | 530 (90.3%) | 724 (81.9%) |
| 55 to 64 Years | 1,225 (91.1%) | 1,562 (88.2%) |
| 65 to 74 Years | 2,432 (95.8%) | 2,539 (92.8%) |
| 75 Years and over | 2,809 (95.5%) | 2,685 (93.3%) |
| Total | 9,058 (94.5%) | 8,736 (91.0%) |
Income Below Poverty Among Married-Couple Families in Englewood
The poverty statistics for married-couple families in Englewood show that 2.7% or 134 of the total 4,989 families live below the poverty line. Families with 1 or 2 children have the highest poverty rate of 5.5%, comprising of 15 families. On the other hand, families with 3 or 4 children have the lowest poverty rate of 0.0%, which includes 0 families.
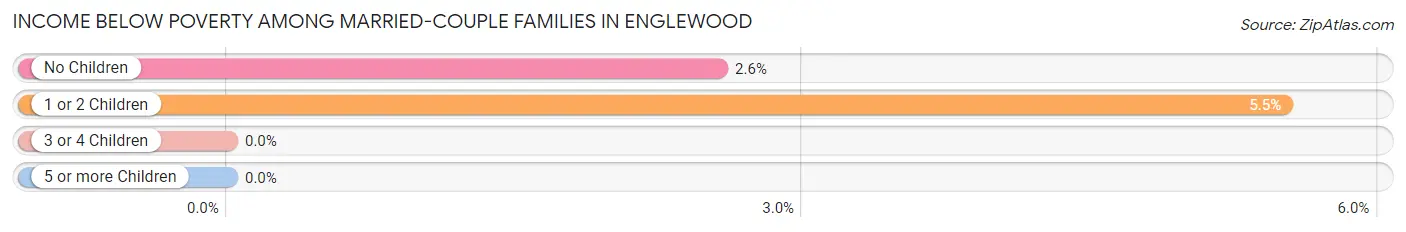
| Children | Above Poverty | Below Poverty |
| No Children | 4,538 (97.4%) | 119 (2.6%) |
| 1 or 2 Children | 257 (94.5%) | 15 (5.5%) |
| 3 or 4 Children | 60 (100.0%) | 0 (0.0%) |
| 5 or more Children | 0 (0.0%) | 0 (0.0%) |
| Total | 4,855 (97.3%) | 134 (2.7%) |
Income Below Poverty Among Single-Parent Households in Englewood
According to the poverty data in Englewood, 3.5% or 10 single-father households and 18.0% or 104 single-mother households are living below the poverty line. Among single-father households, those with no children have the highest poverty rate, with 10 households (6.6%) experiencing poverty. Likewise, among single-mother households, those with 1 or 2 children have the highest poverty rate, with 37 households (24.5%) falling below the poverty line.
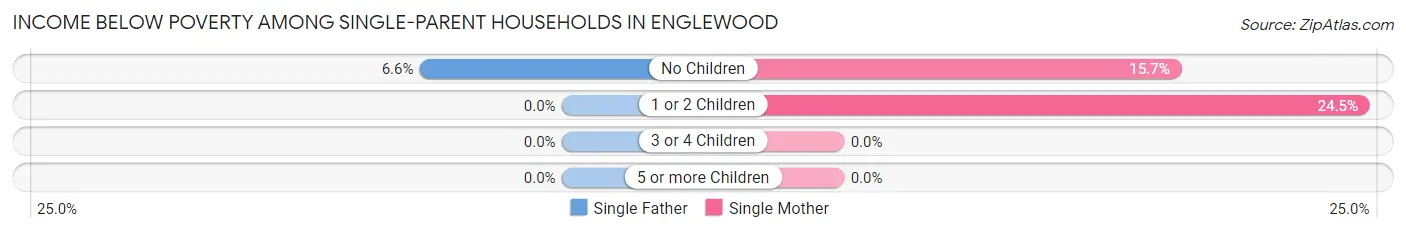
| Children | Single Father | Single Mother |
| No Children | 10 (6.6%) | 67 (15.7%) |
| 1 or 2 Children | 0 (0.0%) | 37 (24.5%) |
| 3 or 4 Children | 0 (0.0%) | 0 (0.0%) |
| 5 or more Children | 0 (0.0%) | 0 (0.0%) |
| Total | 10 (3.5%) | 104 (18.0%) |
Income Below Poverty Among Married-Couple vs Single-Parent Households in Englewood
The poverty data for Englewood shows that 134 of the married-couple family households (2.7%) and 114 of the single-parent households (13.3%) are living below the poverty level. Within the married-couple family households, those with 1 or 2 children have the highest poverty rate, with 15 households (5.5%) falling below the poverty line. Among the single-parent households, those with 1 or 2 children have the highest poverty rate, with 37 household (15.5%) living below poverty.
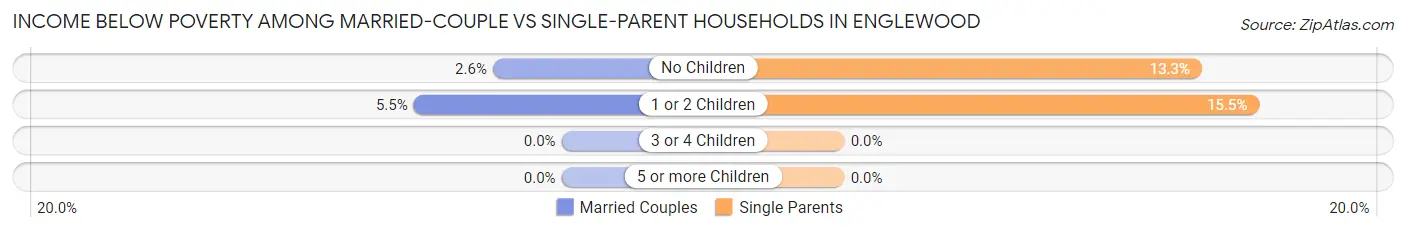
| Children | Married-Couple Families | Single-Parent Households |
| No Children | 119 (2.6%) | 77 (13.3%) |
| 1 or 2 Children | 15 (5.5%) | 37 (15.5%) |
| 3 or 4 Children | 0 (0.0%) | 0 (0.0%) |
| 5 or more Children | 0 (0.0%) | 0 (0.0%) |
| Total | 134 (2.7%) | 114 (13.3%) |
Race in Englewood
The most populous races in Englewood are White / Caucasian (18,159 | 93.7%), Asian (564 | 2.9%), and Two or more Races (543 | 2.8%).
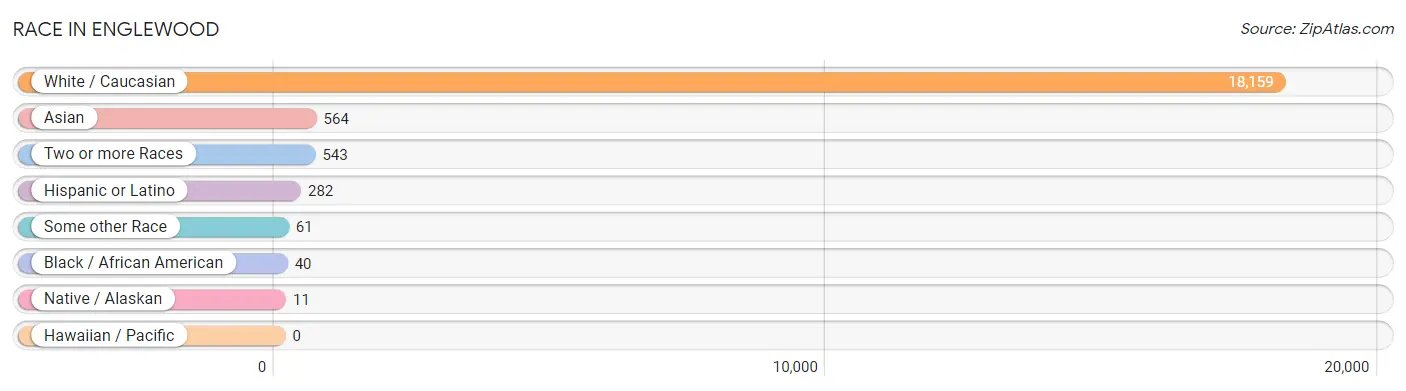
| Race | # Population | % Population |
| Asian | 564 | 2.9% |
| Black / African American | 40 | 0.2% |
| Hawaiian / Pacific | 0 | 0.0% |
| Hispanic or Latino | 282 | 1.5% |
| Native / Alaskan | 11 | 0.1% |
| White / Caucasian | 18,159 | 93.7% |
| Two or more Races | 543 | 2.8% |
| Some other Race | 61 | 0.3% |
| Total | 19,378 | 100.0% |
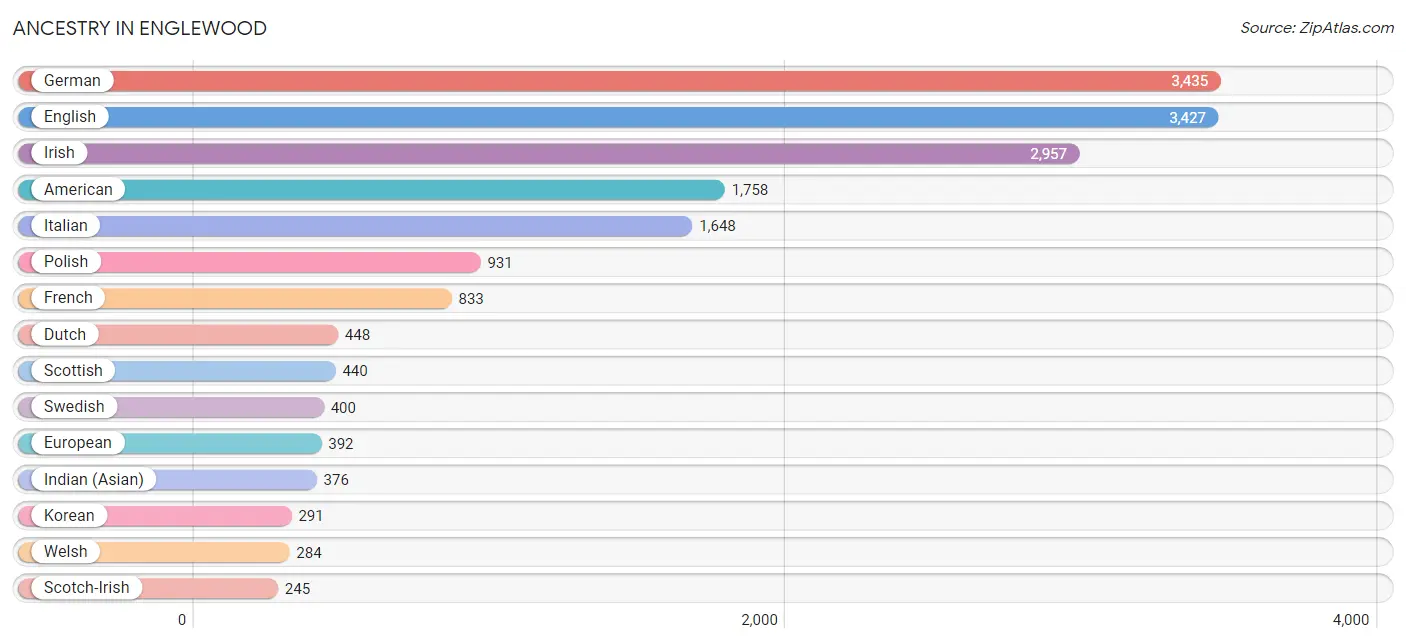
Ancestry in Englewood
The most populous ancestries reported in Englewood are German (3,435 | 17.7%), English (3,427 | 17.7%), Irish (2,957 | 15.3%), American (1,758 | 9.1%), and Italian (1,648 | 8.5%), together accounting for 68.2% of all Englewood residents.
| Ancestry | # Population | % Population |
| African | 16 | 0.1% |
| American | 1,758 | 9.1% |
| Apache | 3 | 0.0% |
| Arab | 23 | 0.1% |
| Armenian | 16 | 0.1% |
| Assyrian / Chaldean / Syriac | 12 | 0.1% |
| Australian | 6 | 0.0% |
| Austrian | 66 | 0.3% |
| Belgian | 13 | 0.1% |
| Bhutanese | 46 | 0.2% |
| Brazilian | 15 | 0.1% |
| British | 232 | 1.2% |
| Bulgarian | 22 | 0.1% |
| Canadian | 80 | 0.4% |
| Celtic | 32 | 0.2% |
| Central American | 21 | 0.1% |
| Cherokee | 38 | 0.2% |
| Chippewa | 2 | 0.0% |
| Colombian | 9 | 0.1% |
| Croatian | 14 | 0.1% |
| Cuban | 77 | 0.4% |
| Czech | 72 | 0.4% |
| Czechoslovakian | 62 | 0.3% |
| Danish | 36 | 0.2% |
| Dominican | 8 | 0.0% |
| Dutch | 448 | 2.3% |
| Eastern European | 55 | 0.3% |
| Ecuadorian | 19 | 0.1% |
| English | 3,427 | 17.7% |
| Estonian | 31 | 0.2% |
| European | 392 | 2.0% |
| Finnish | 69 | 0.4% |
| French | 833 | 4.3% |
| French Canadian | 226 | 1.2% |
| German | 3,435 | 17.7% |
| German Russian | 10 | 0.1% |
| Greek | 85 | 0.4% |
| Guatemalan | 17 | 0.1% |
| Haitian | 7 | 0.0% |
| Hungarian | 144 | 0.7% |
| Indian (Asian) | 376 | 1.9% |
| Iranian | 14 | 0.1% |
| Irish | 2,957 | 15.3% |
| Italian | 1,648 | 8.5% |
| Korean | 291 | 1.5% |
| Latvian | 6 | 0.0% |
| Lithuanian | 102 | 0.5% |
| Macedonian | 25 | 0.1% |
| Malaysian | 3 | 0.0% |
| Mexican | 49 | 0.3% |
| Mongolian | 30 | 0.2% |
| New Zealander | 15 | 0.1% |
| Northern European | 81 | 0.4% |
| Norwegian | 152 | 0.8% |
| Pennsylvania German | 26 | 0.1% |
| Polish | 931 | 4.8% |
| Portuguese | 72 | 0.4% |
| Puerto Rican | 99 | 0.5% |
| Romanian | 8 | 0.0% |
| Russian | 148 | 0.8% |
| Salvadoran | 4 | 0.0% |
| Scandinavian | 50 | 0.3% |
| Scotch-Irish | 245 | 1.3% |
| Scottish | 440 | 2.3% |
| Seminole | 11 | 0.1% |
| Serbian | 10 | 0.1% |
| Slavic | 8 | 0.0% |
| Slovak | 73 | 0.4% |
| Slovene | 22 | 0.1% |
| South American | 28 | 0.1% |
| Subsaharan African | 16 | 0.1% |
| Swedish | 400 | 2.1% |
| Swiss | 87 | 0.4% |
| Syrian | 15 | 0.1% |
| Ukrainian | 35 | 0.2% |
| Welsh | 284 | 1.5% |
| West Indian | 9 | 0.1% |
| Yugoslavian | 43 | 0.2% | View All 78 Rows |
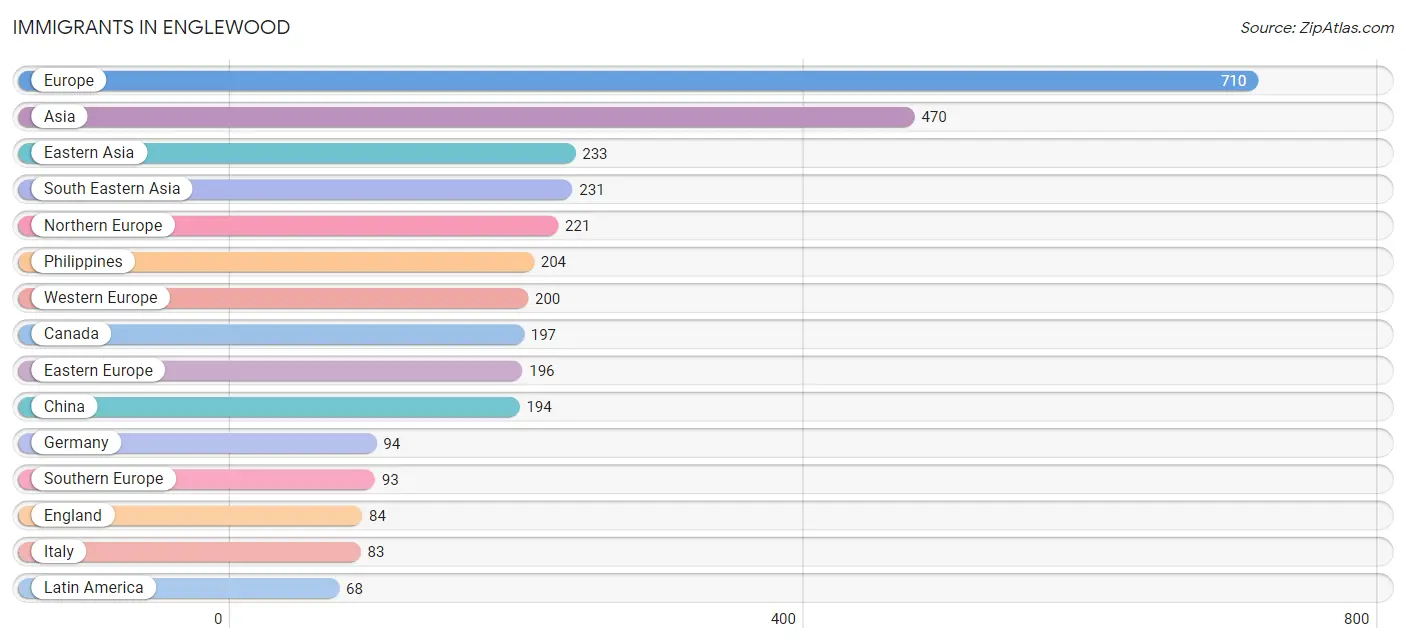
Immigrants in Englewood
The most numerous immigrant groups reported in Englewood came from Europe (710 | 3.7%), Asia (470 | 2.4%), Eastern Asia (233 | 1.2%), South Eastern Asia (231 | 1.2%), and Northern Europe (221 | 1.1%), together accounting for 9.6% of all Englewood residents.
| Immigration Origin | # Population | % Population |
| Africa | 5 | 0.0% |
| Asia | 470 | 2.4% |
| Austria | 49 | 0.3% |
| Brazil | 10 | 0.1% |
| Bulgaria | 57 | 0.3% |
| Canada | 197 | 1.0% |
| Caribbean | 30 | 0.2% |
| China | 194 | 1.0% |
| Colombia | 9 | 0.1% |
| Cuba | 23 | 0.1% |
| Eastern Asia | 233 | 1.2% |
| Eastern Europe | 196 | 1.0% |
| Ecuador | 19 | 0.1% |
| England | 84 | 0.4% |
| Europe | 710 | 3.7% |
| France | 13 | 0.1% |
| Germany | 94 | 0.5% |
| Greece | 10 | 0.1% |
| Haiti | 7 | 0.0% |
| Hong Kong | 8 | 0.0% |
| Hungary | 16 | 0.1% |
| Iran | 6 | 0.0% |
| Italy | 83 | 0.4% |
| Japan | 39 | 0.2% |
| Laos | 3 | 0.0% |
| Latin America | 68 | 0.4% |
| Malaysia | 24 | 0.1% |
| Netherlands | 44 | 0.2% |
| Northern Africa | 5 | 0.0% |
| Northern Europe | 221 | 1.1% |
| Philippines | 204 | 1.1% |
| Poland | 27 | 0.1% |
| Russia | 10 | 0.1% |
| Scotland | 8 | 0.0% |
| South America | 38 | 0.2% |
| South Central Asia | 6 | 0.0% |
| South Eastern Asia | 231 | 1.2% |
| Southern Europe | 93 | 0.5% |
| Sweden | 27 | 0.1% |
| Ukraine | 23 | 0.1% |
| Western Europe | 200 | 1.0% | View All 41 Rows |
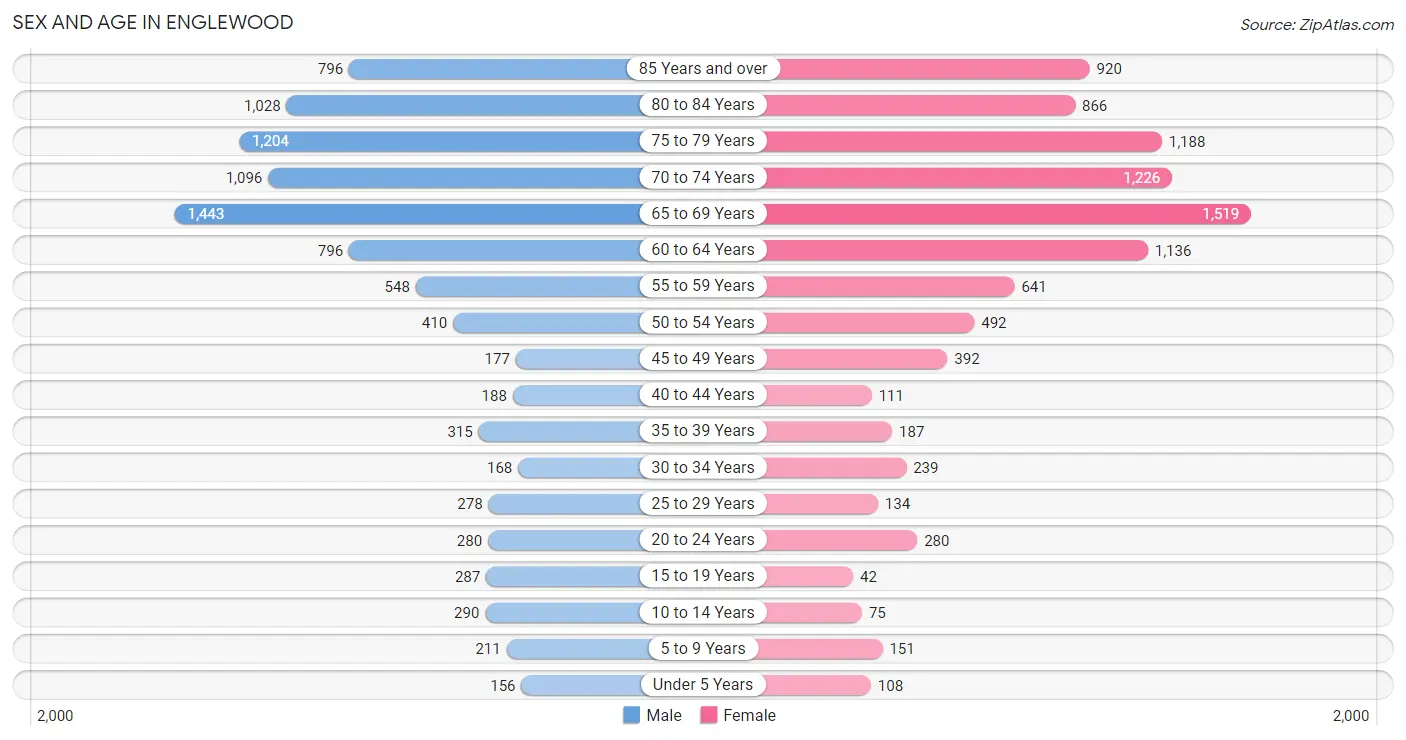
Sex and Age in Englewood
Sex and Age in Englewood
The most populous age groups in Englewood are 65 to 69 Years (1,443 | 14.9%) for men and 65 to 69 Years (1,519 | 15.7%) for women.
| Age Bracket | Male | Female |
| Under 5 Years | 156 (1.6%) | 108 (1.1%) |
| 5 to 9 Years | 211 (2.2%) | 151 (1.6%) |
| 10 to 14 Years | 290 (3.0%) | 75 (0.8%) |
| 15 to 19 Years | 287 (3.0%) | 42 (0.4%) |
| 20 to 24 Years | 280 (2.9%) | 280 (2.9%) |
| 25 to 29 Years | 278 (2.9%) | 134 (1.4%) |
| 30 to 34 Years | 168 (1.7%) | 239 (2.5%) |
| 35 to 39 Years | 315 (3.3%) | 187 (1.9%) |
| 40 to 44 Years | 188 (1.9%) | 111 (1.1%) |
| 45 to 49 Years | 177 (1.8%) | 392 (4.0%) |
| 50 to 54 Years | 410 (4.2%) | 492 (5.1%) |
| 55 to 59 Years | 548 (5.7%) | 641 (6.6%) |
| 60 to 64 Years | 796 (8.2%) | 1,136 (11.7%) |
| 65 to 69 Years | 1,443 (14.9%) | 1,519 (15.7%) |
| 70 to 74 Years | 1,096 (11.3%) | 1,226 (12.6%) |
| 75 to 79 Years | 1,204 (12.4%) | 1,188 (12.2%) |
| 80 to 84 Years | 1,028 (10.6%) | 866 (8.9%) |
| 85 Years and over | 796 (8.2%) | 920 (9.5%) |
| Total | 9,671 (100.0%) | 9,707 (100.0%) |
Families and Households in Englewood
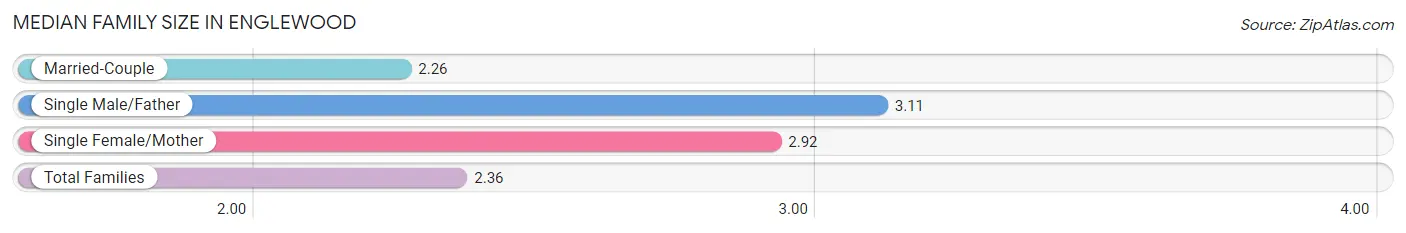
Median Family Size in Englewood
The median family size in Englewood is 2.36 persons per family, with single male/father families (283 | 4.8%) accounting for the largest median family size of 3.11 persons per family. On the other hand, married-couple families (4,989 | 85.3%) represent the smallest median family size with 2.26 persons per family.
| Family Type | # Families | Family Size |
| Married-Couple | 4,989 (85.3%) | 2.26 |
| Single Male/Father | 283 (4.8%) | 3.11 |
| Single Female/Mother | 577 (9.9%) | 2.92 |
| Total Families | 5,849 (100.0%) | 2.36 |
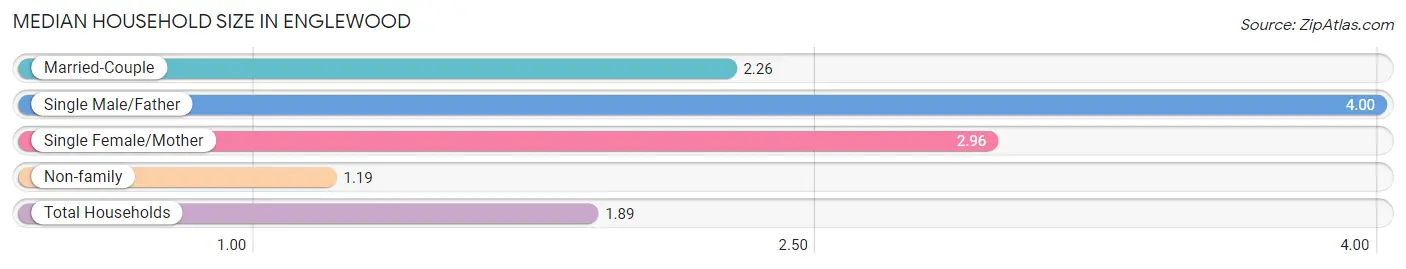
Median Household Size in Englewood
The median household size in Englewood is 1.89 persons per household, with single male/father households (283 | 2.8%) accounting for the largest median household size of 4 persons per household. non-family households (4,283 | 42.3%) represent the smallest median household size with 1.19 persons per household.
| Household Type | # Households | Household Size |
| Married-Couple | 4,989 (49.2%) | 2.26 |
| Single Male/Father | 283 (2.8%) | 4.00 |
| Single Female/Mother | 577 (5.7%) | 2.96 |
| Non-family | 4,283 (42.3%) | 1.19 |
| Total Households | 10,132 (100.0%) | 1.89 |
Household Size by Marriage Status in Englewood
Out of a total of 10,132 households in Englewood, 5,849 (57.7%) are family households, while 4,283 (42.3%) are nonfamily households. The most numerous type of family households are 2-person households, comprising 4,849, and the most common type of nonfamily households are 1-person households, comprising 3,618.
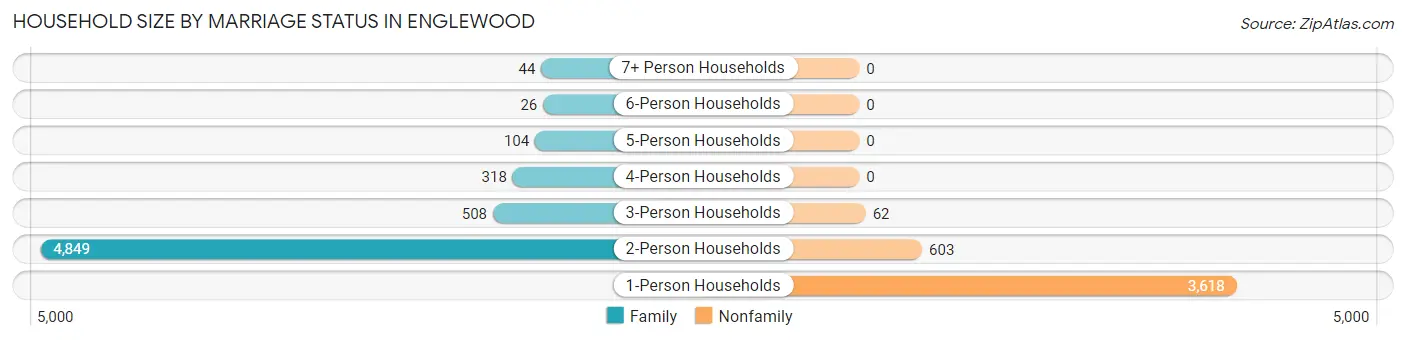
| Household Size | Family Households | Nonfamily Households |
| 1-Person Households | - | 3,618 (35.7%) |
| 2-Person Households | 4,849 (47.9%) | 603 (5.9%) |
| 3-Person Households | 508 (5.0%) | 62 (0.6%) |
| 4-Person Households | 318 (3.1%) | 0 (0.0%) |
| 5-Person Households | 104 (1.0%) | 0 (0.0%) |
| 6-Person Households | 26 (0.3%) | 0 (0.0%) |
| 7+ Person Households | 44 (0.4%) | 0 (0.0%) |
| Total | 5,849 (57.7%) | 4,283 (42.3%) |
Female Fertility in Englewood
Fertility by Age in Englewood
Average fertility rate in Englewood is 50.0 births per 1,000 women. Women in the age bracket of 20 to 34 years have the highest fertility rate with 70.0 births per 1,000 women. Women in the age bracket of 20 to 34 years acount for 62.2% of all women with births.
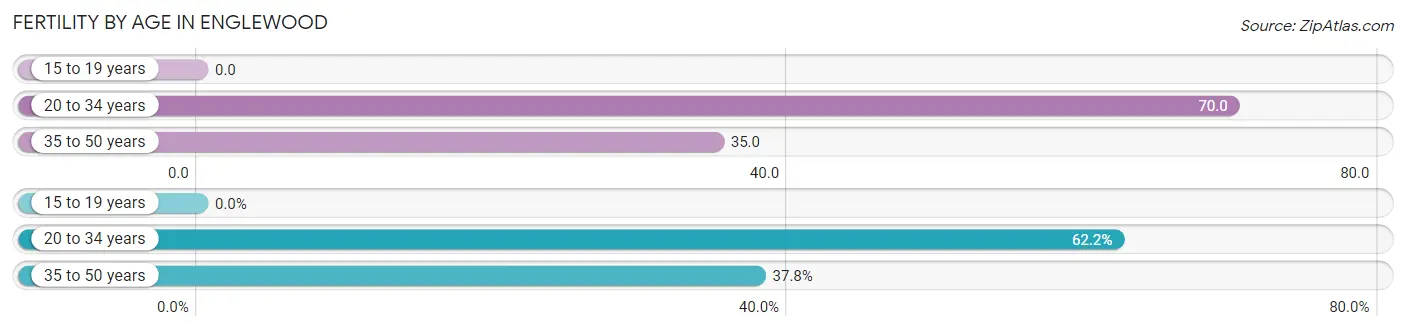
| Age Bracket | Women with Births | Births / 1,000 Women |
| 15 to 19 years | 0 (0.0%) | 0.0 |
| 20 to 34 years | 46 (62.2%) | 70.0 |
| 35 to 50 years | 28 (37.8%) | 35.0 |
| Total | 74 (100.0%) | 50.0 |
Fertility by Age by Marriage Status in Englewood
83.8% of women with births (74) in Englewood are married. The highest percentage of unmarried women with births falls into 35 to 50 years age bracket with 25.0% of them unmarried at the time of birth, while the lowest percentage of unmarried women with births belong to 20 to 34 years age bracket with 10.9% of them unmarried.
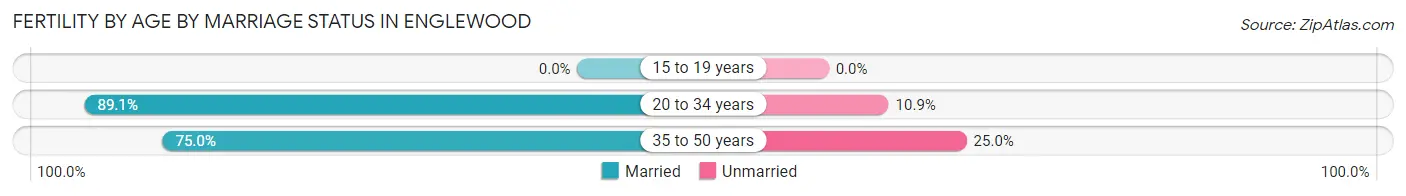
| Age Bracket | Married | Unmarried |
| 15 to 19 years | 0 (0.0%) | 0 (0.0%) |
| 20 to 34 years | 41 (89.1%) | 5 (10.9%) |
| 35 to 50 years | 21 (75.0%) | 7 (25.0%) |
| Total | 62 (83.8%) | 12 (16.2%) |
Fertility by Education in Englewood
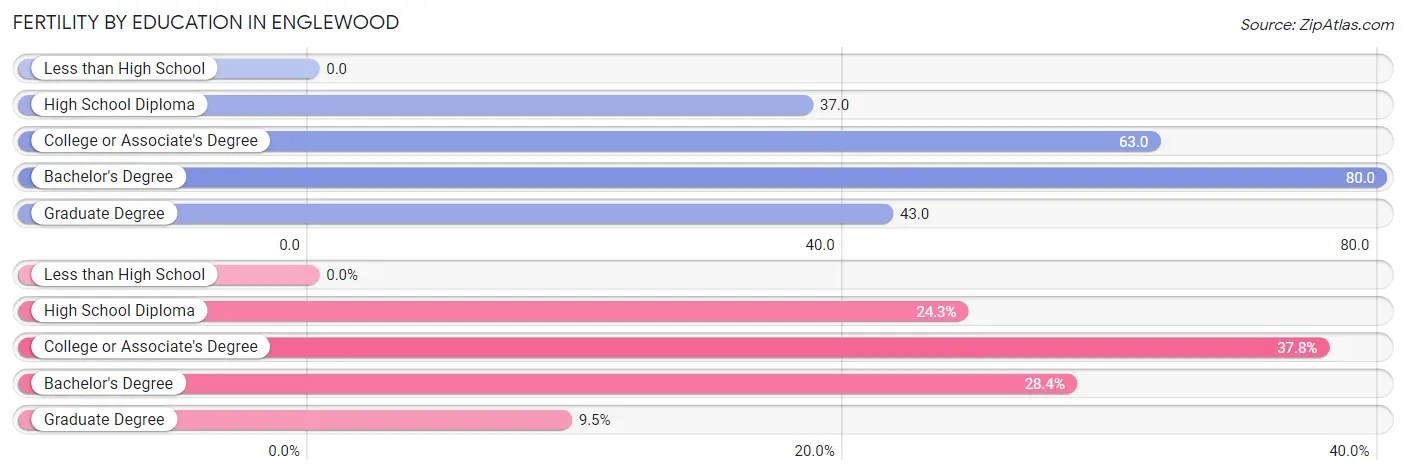
| Educational Attainment | Women with Births | Births / 1,000 Women |
| Less than High School | 0 (0.0%) | 0.0 |
| High School Diploma | 18 (24.3%) | 37.0 |
| College or Associate's Degree | 28 (37.8%) | 63.0 |
| Bachelor's Degree | 21 (28.4%) | 80.0 |
| Graduate Degree | 7 (9.5%) | 43.0 |
| Total | 74 (100.0%) | 50.0 |
Fertility by Education by Marriage Status in Englewood
16.2% of women with births in Englewood are unmarried. Women with the educational attainment of high school diploma are most likely to be married with 100.0% of them married at childbirth, while women with the educational attainment of graduate degree are least likely to be married with 100.0% of them unmarried at childbirth.
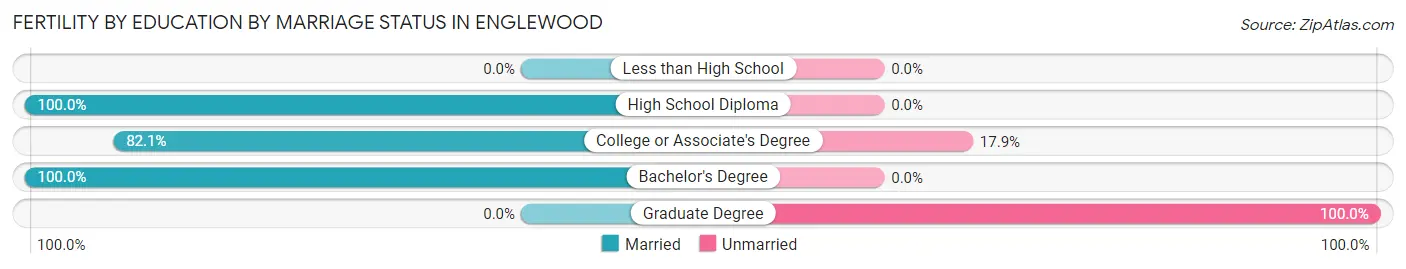
| Educational Attainment | Married | Unmarried |
| Less than High School | 0 (0.0%) | 0 (0.0%) |
| High School Diploma | 18 (100.0%) | 0 (0.0%) |
| College or Associate's Degree | 23 (82.1%) | 5 (17.9%) |
| Bachelor's Degree | 21 (100.0%) | 0 (0.0%) |
| Graduate Degree | 0 (0.0%) | 7 (100.0%) |
| Total | 62 (83.8%) | 12 (16.2%) |
Employment Characteristics in Englewood
Employment by Class of Employer in Englewood
Among the 5,331 employed individuals in Englewood, private company employees (3,523 | 66.1%), self-employed (not incorporated) (608 | 11.4%), and self-employed (incorporated) (441 | 8.3%) make up the most common classes of employment.
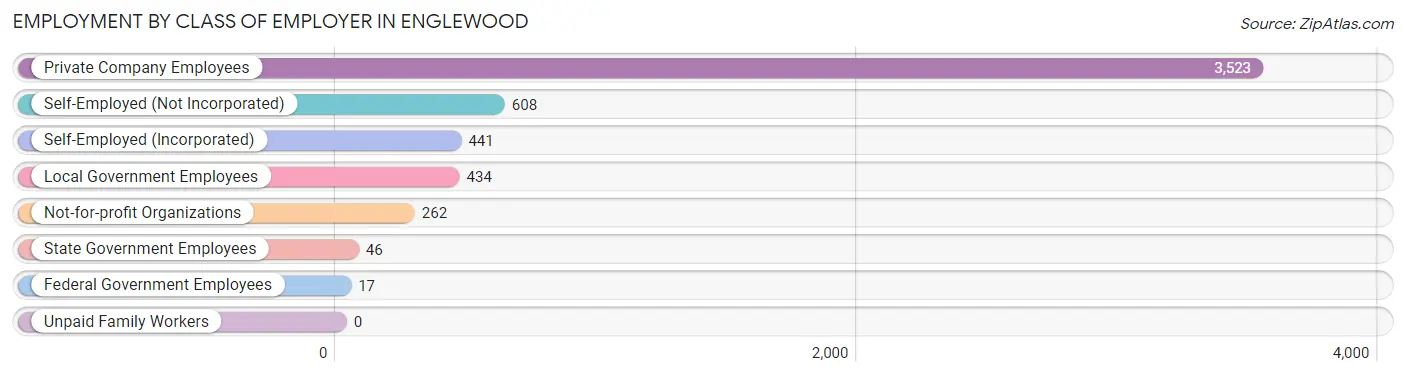
| Employer Class | # Employees | % Employees |
| Private Company Employees | 3,523 | 66.1% |
| Self-Employed (Incorporated) | 441 | 8.3% |
| Self-Employed (Not Incorporated) | 608 | 11.4% |
| Not-for-profit Organizations | 262 | 4.9% |
| Local Government Employees | 434 | 8.1% |
| State Government Employees | 46 | 0.9% |
| Federal Government Employees | 17 | 0.3% |
| Unpaid Family Workers | 0 | 0.0% |
| Total | 5,331 | 100.0% |
Employment Status by Age in Englewood
According to the labor force statistics for Englewood, out of the total population over 16 years of age (18,332), 31.2% or 5,720 individuals are in the labor force, with 4.6% or 263 of them unemployed. The age group with the highest labor force participation rate is 35 to 44 years, with 88.1% or 706 individuals in the labor force. Within the labor force, the 60 to 64 years age range has the highest percentage of unemployed individuals, with 8.3% or 77 of them being unemployed.
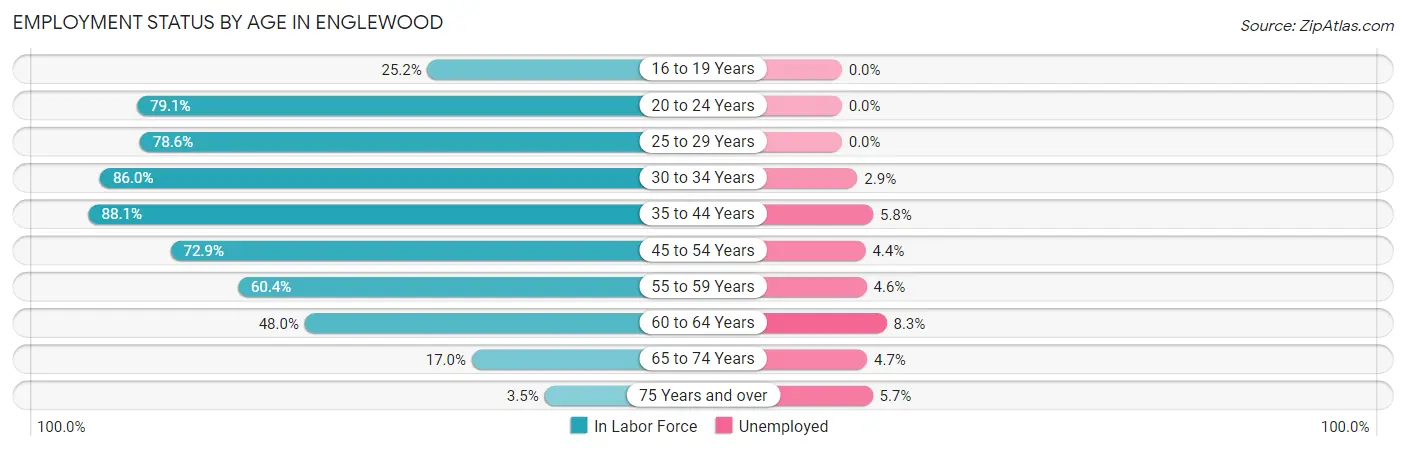
| Age Bracket | In Labor Force | Unemployed |
| 16 to 19 Years | 69 (25.2%) | 0 (0.0%) |
| 20 to 24 Years | 443 (79.1%) | 0 (0.0%) |
| 25 to 29 Years | 324 (78.6%) | 0 (0.0%) |
| 30 to 34 Years | 350 (86.0%) | 10 (2.9%) |
| 35 to 44 Years | 706 (88.1%) | 41 (5.8%) |
| 45 to 54 Years | 1,072 (72.9%) | 47 (4.4%) |
| 55 to 59 Years | 718 (60.4%) | 33 (4.6%) |
| 60 to 64 Years | 927 (48.0%) | 77 (8.3%) |
| 65 to 74 Years | 898 (17.0%) | 42 (4.7%) |
| 75 Years and over | 210 (3.5%) | 12 (5.7%) |
| Total | 5,720 (31.2%) | 263 (4.6%) |
Employment Status by Educational Attainment in Englewood
According to labor force statistics for Englewood, 66.0% of individuals (4,100) out of the total population between 25 and 64 years of age (6,212) are in the labor force, with 5.1% or 209 of them being unemployed. The group with the highest labor force participation rate are those with the educational attainment of bachelor's degree or higher, with 72.1% or 1,584 individuals in the labor force. Within the labor force, individuals with less than high school education have the highest percentage of unemployment, with 21.0% or 42 of them being unemployed.
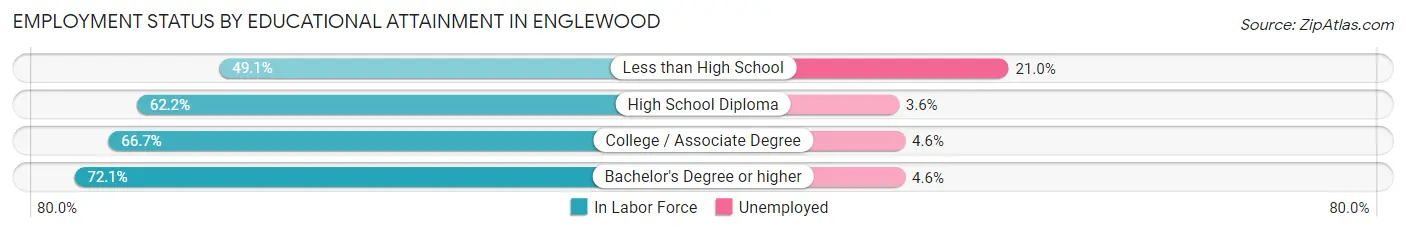
| Educational Attainment | In Labor Force | Unemployed |
| Less than High School | 200 (49.1%) | 85 (21.0%) |
| High School Diploma | 1,274 (62.2%) | 74 (3.6%) |
| College / Associate Degree | 1,041 (66.7%) | 72 (4.6%) |
| Bachelor's Degree or higher | 1,584 (72.1%) | 101 (4.6%) |
| Total | 4,100 (66.0%) | 317 (5.1%) |
Employment Occupations by Sex in Englewood
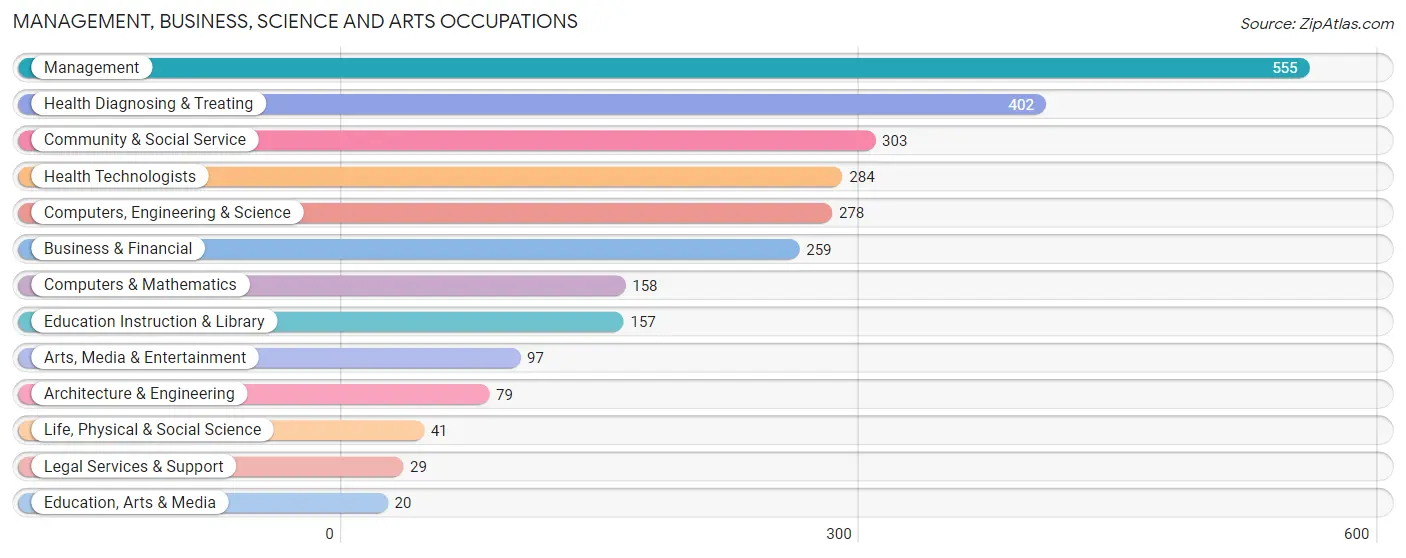
Management, Business, Science and Arts Occupations
The most common Management, Business, Science and Arts occupations in Englewood are Management (555 | 10.2%), Health Diagnosing & Treating (402 | 7.4%), Community & Social Service (303 | 5.6%), Health Technologists (284 | 5.2%), and Computers, Engineering & Science (278 | 5.1%).
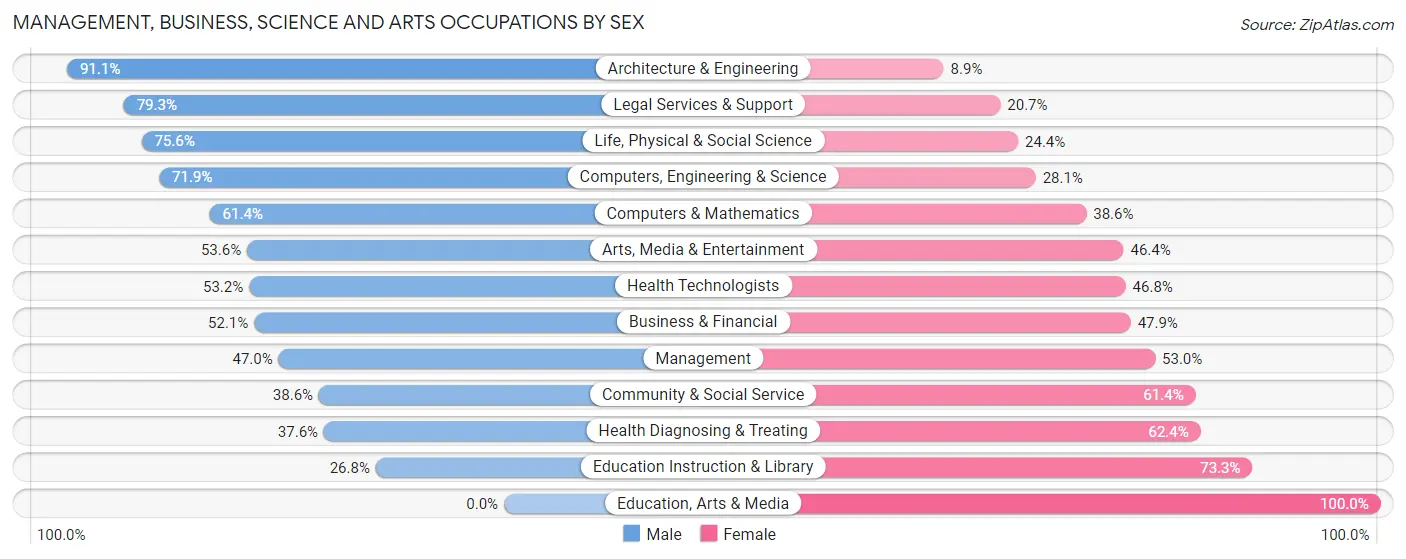
Management, Business, Science and Arts Occupations by Sex
Within the Management, Business, Science and Arts occupations in Englewood, the most male-oriented occupations are Architecture & Engineering (91.1%), Legal Services & Support (79.3%), and Life, Physical & Social Science (75.6%), while the most female-oriented occupations are Education, Arts & Media (100.0%), Education Instruction & Library (73.3%), and Health Diagnosing & Treating (62.4%).
| Occupation | Male | Female |
| Management | 261 (47.0%) | 294 (53.0%) |
| Business & Financial | 135 (52.1%) | 124 (47.9%) |
| Computers, Engineering & Science | 200 (71.9%) | 78 (28.1%) |
| Computers & Mathematics | 97 (61.4%) | 61 (38.6%) |
| Architecture & Engineering | 72 (91.1%) | 7 (8.9%) |
| Life, Physical & Social Science | 31 (75.6%) | 10 (24.4%) |
| Community & Social Service | 117 (38.6%) | 186 (61.4%) |
| Education, Arts & Media | 0 (0.0%) | 20 (100.0%) |
| Legal Services & Support | 23 (79.3%) | 6 (20.7%) |
| Education Instruction & Library | 42 (26.8%) | 115 (73.3%) |
| Arts, Media & Entertainment | 52 (53.6%) | 45 (46.4%) |
| Health Diagnosing & Treating | 151 (37.6%) | 251 (62.4%) |
| Health Technologists | 151 (53.2%) | 133 (46.8%) |
| Total (Category) | 864 (48.1%) | 933 (51.9%) |
| Total (Overall) | 2,884 (53.0%) | 2,558 (47.0%) |
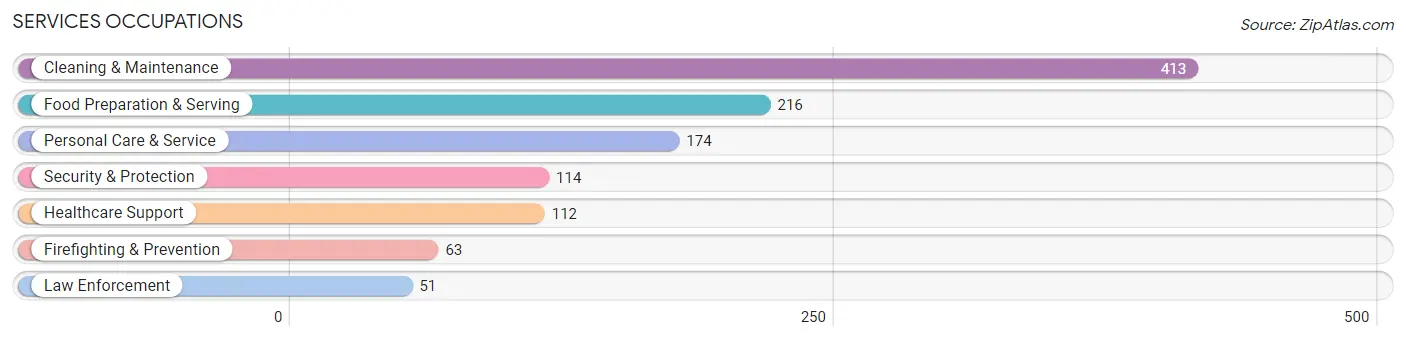
Services Occupations
The most common Services occupations in Englewood are Cleaning & Maintenance (413 | 7.6%), Food Preparation & Serving (216 | 4.0%), Personal Care & Service (174 | 3.2%), Security & Protection (114 | 2.1%), and Healthcare Support (112 | 2.1%).
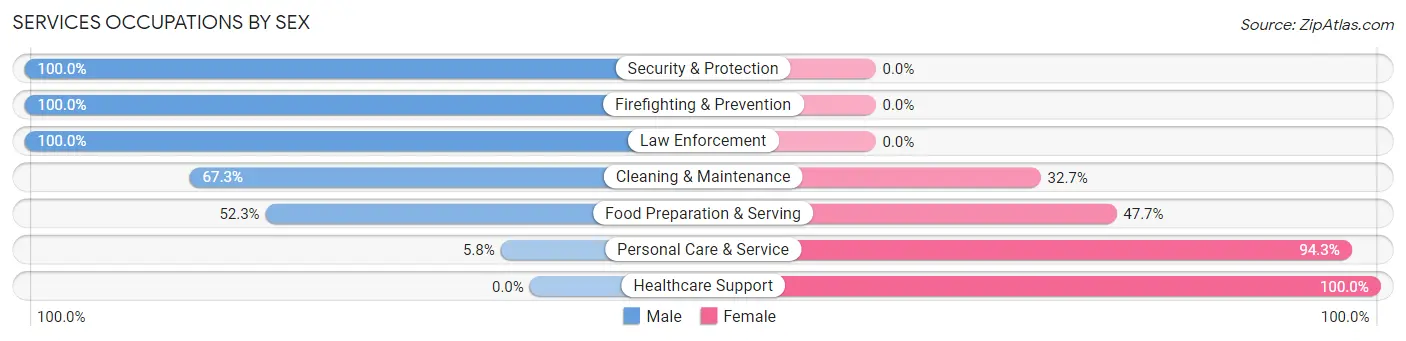
Services Occupations by Sex
Within the Services occupations in Englewood, the most male-oriented occupations are Security & Protection (100.0%), Firefighting & Prevention (100.0%), and Law Enforcement (100.0%), while the most female-oriented occupations are Healthcare Support (100.0%), Personal Care & Service (94.3%), and Food Preparation & Serving (47.7%).
| Occupation | Male | Female |
| Healthcare Support | 0 (0.0%) | 112 (100.0%) |
| Security & Protection | 114 (100.0%) | 0 (0.0%) |
| Firefighting & Prevention | 63 (100.0%) | 0 (0.0%) |
| Law Enforcement | 51 (100.0%) | 0 (0.0%) |
| Food Preparation & Serving | 113 (52.3%) | 103 (47.7%) |
| Cleaning & Maintenance | 278 (67.3%) | 135 (32.7%) |
| Personal Care & Service | 10 (5.8%) | 164 (94.3%) |
| Total (Category) | 515 (50.0%) | 514 (49.9%) |
| Total (Overall) | 2,884 (53.0%) | 2,558 (47.0%) |
Sales and Office Occupations
The most common Sales and Office occupations in Englewood are Sales & Related (857 | 15.8%), and Office & Administration (727 | 13.4%).
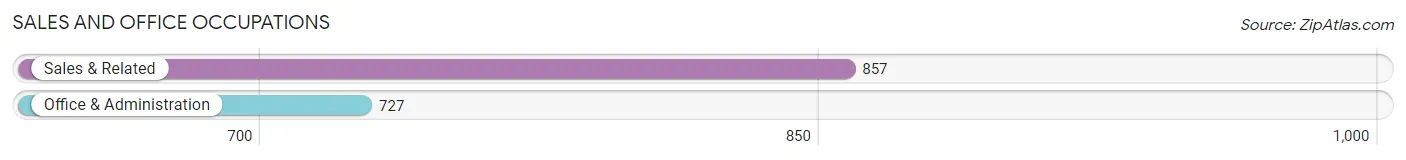
Sales and Office Occupations by Sex
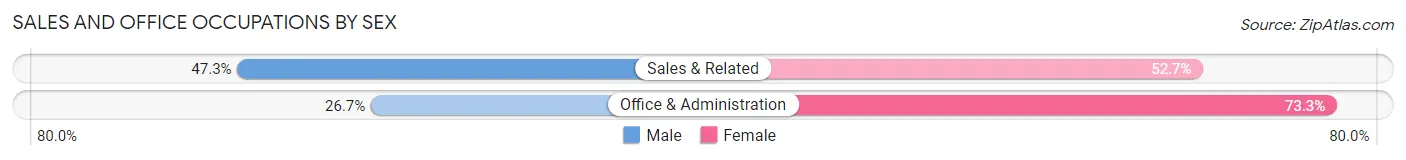
| Occupation | Male | Female |
| Sales & Related | 405 (47.3%) | 452 (52.7%) |
| Office & Administration | 194 (26.7%) | 533 (73.3%) |
| Total (Category) | 599 (37.8%) | 985 (62.2%) |
| Total (Overall) | 2,884 (53.0%) | 2,558 (47.0%) |
Natural Resources, Construction and Maintenance Occupations
The most common Natural Resources, Construction and Maintenance occupations in Englewood are Construction & Extraction (232 | 4.3%), and Installation, Maintenance & Repair (180 | 3.3%).
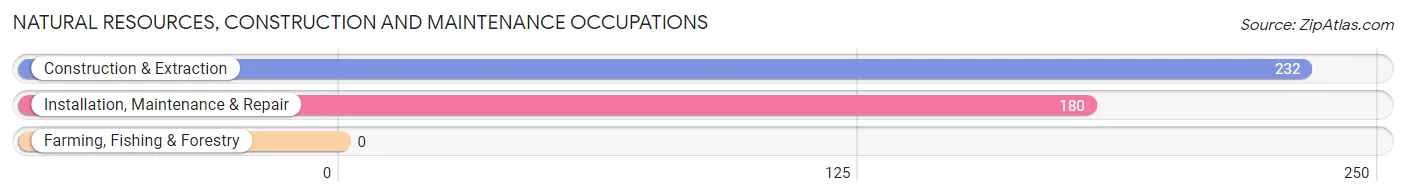
Natural Resources, Construction and Maintenance Occupations by Sex
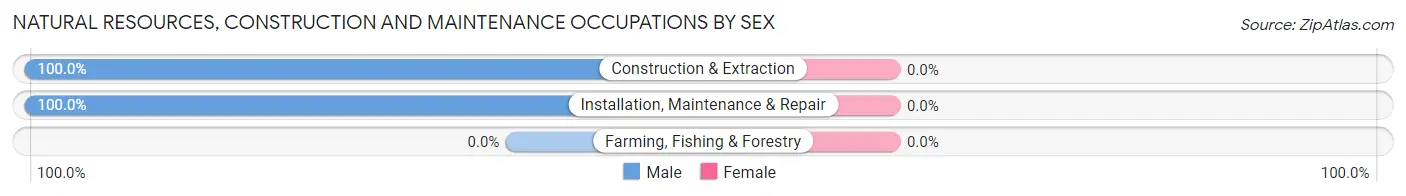
| Occupation | Male | Female |
| Farming, Fishing & Forestry | 0 (0.0%) | 0 (0.0%) |
| Construction & Extraction | 232 (100.0%) | 0 (0.0%) |
| Installation, Maintenance & Repair | 180 (100.0%) | 0 (0.0%) |
| Total (Category) | 412 (100.0%) | 0 (0.0%) |
| Total (Overall) | 2,884 (53.0%) | 2,558 (47.0%) |
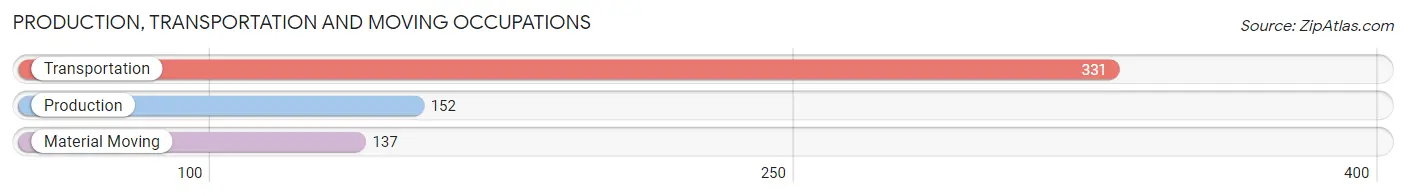
Production, Transportation and Moving Occupations
The most common Production, Transportation and Moving occupations in Englewood are Transportation (331 | 6.1%), Production (152 | 2.8%), and Material Moving (137 | 2.5%).
Production, Transportation and Moving Occupations by Sex
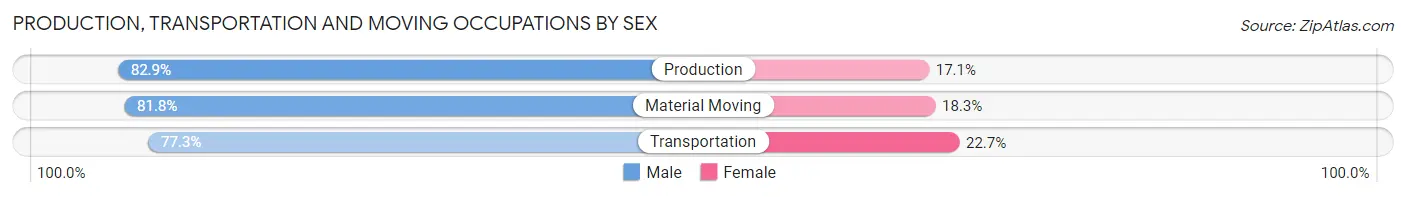
| Occupation | Male | Female |
| Production | 126 (82.9%) | 26 (17.1%) |
| Transportation | 256 (77.3%) | 75 (22.7%) |
| Material Moving | 112 (81.8%) | 25 (18.2%) |
| Total (Category) | 494 (79.7%) | 126 (20.3%) |
| Total (Overall) | 2,884 (53.0%) | 2,558 (47.0%) |
Employment Industries by Sex in Englewood
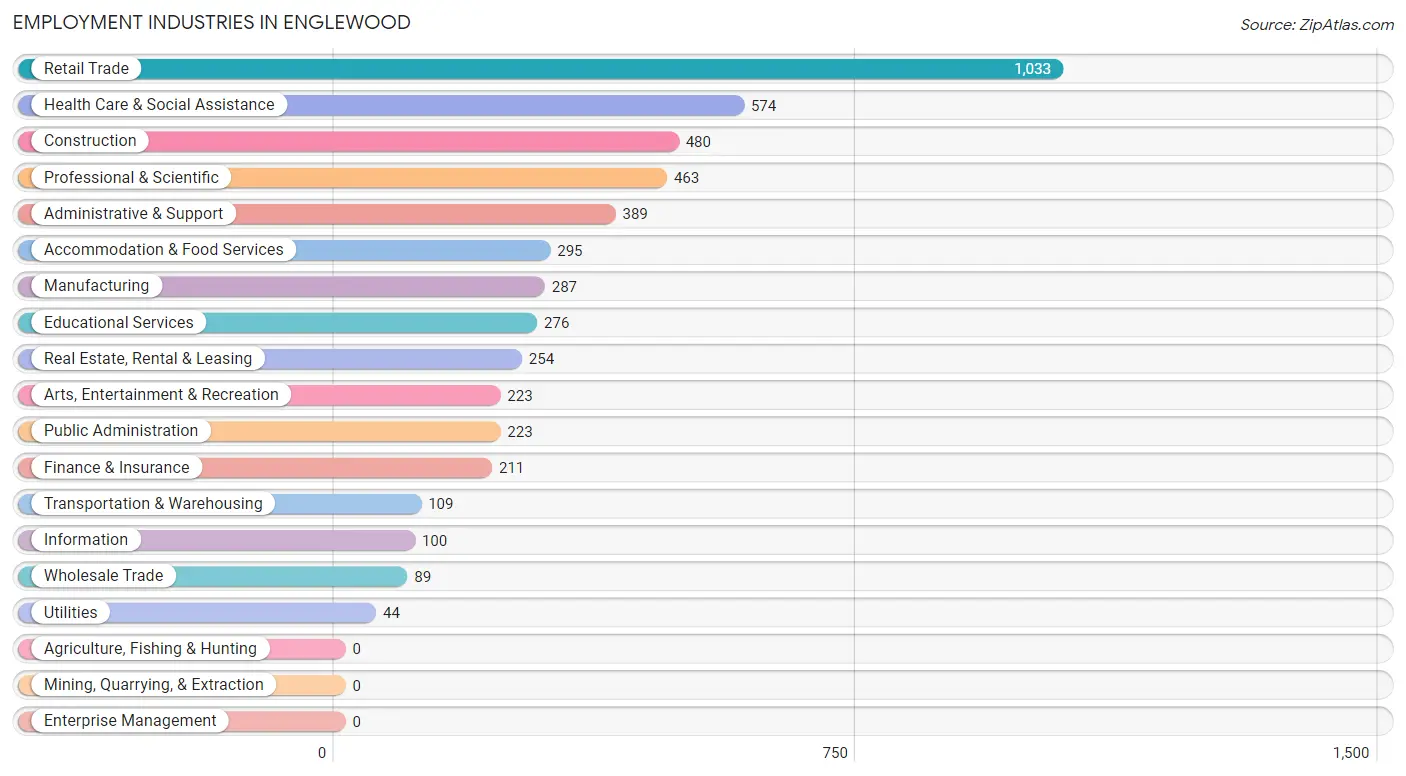
Employment Industries in Englewood
The major employment industries in Englewood include Retail Trade (1,033 | 19.0%), Health Care & Social Assistance (574 | 10.5%), Construction (480 | 8.8%), Professional & Scientific (463 | 8.5%), and Administrative & Support (389 | 7.1%).
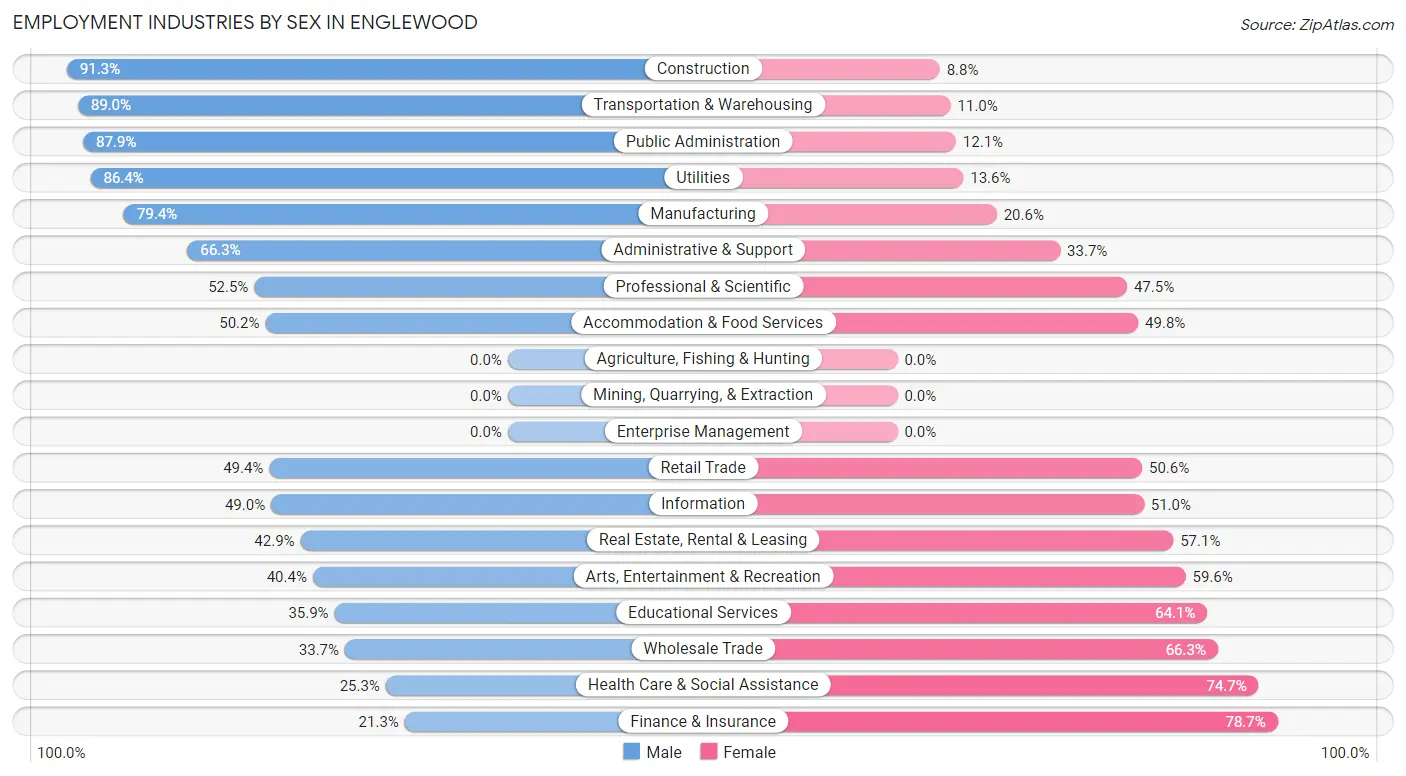
Employment Industries by Sex in Englewood
The Englewood industries that see more men than women are Construction (91.2%), Transportation & Warehousing (89.0%), and Public Administration (87.9%), whereas the industries that tend to have a higher number of women are Finance & Insurance (78.7%), Health Care & Social Assistance (74.7%), and Wholesale Trade (66.3%).
| Industry | Male | Female |
| Agriculture, Fishing & Hunting | 0 (0.0%) | 0 (0.0%) |
| Mining, Quarrying, & Extraction | 0 (0.0%) | 0 (0.0%) |
| Construction | 438 (91.2%) | 42 (8.7%) |
| Manufacturing | 228 (79.4%) | 59 (20.6%) |
| Wholesale Trade | 30 (33.7%) | 59 (66.3%) |
| Retail Trade | 510 (49.4%) | 523 (50.6%) |
| Transportation & Warehousing | 97 (89.0%) | 12 (11.0%) |
| Utilities | 38 (86.4%) | 6 (13.6%) |
| Information | 49 (49.0%) | 51 (51.0%) |
| Finance & Insurance | 45 (21.3%) | 166 (78.7%) |
| Real Estate, Rental & Leasing | 109 (42.9%) | 145 (57.1%) |
| Professional & Scientific | 243 (52.5%) | 220 (47.5%) |
| Enterprise Management | 0 (0.0%) | 0 (0.0%) |
| Administrative & Support | 258 (66.3%) | 131 (33.7%) |
| Educational Services | 99 (35.9%) | 177 (64.1%) |
| Health Care & Social Assistance | 145 (25.3%) | 429 (74.7%) |
| Arts, Entertainment & Recreation | 90 (40.4%) | 133 (59.6%) |
| Accommodation & Food Services | 148 (50.2%) | 147 (49.8%) |
| Public Administration | 196 (87.9%) | 27 (12.1%) |
| Total | 2,884 (53.0%) | 2,558 (47.0%) |
Education in Englewood
School Enrollment in Englewood
The most common levels of schooling among the 1,281 students in Englewood are middle school (318 | 24.8%), elementary school (264 | 20.6%), and college / undergraduate (221 | 17.2%).
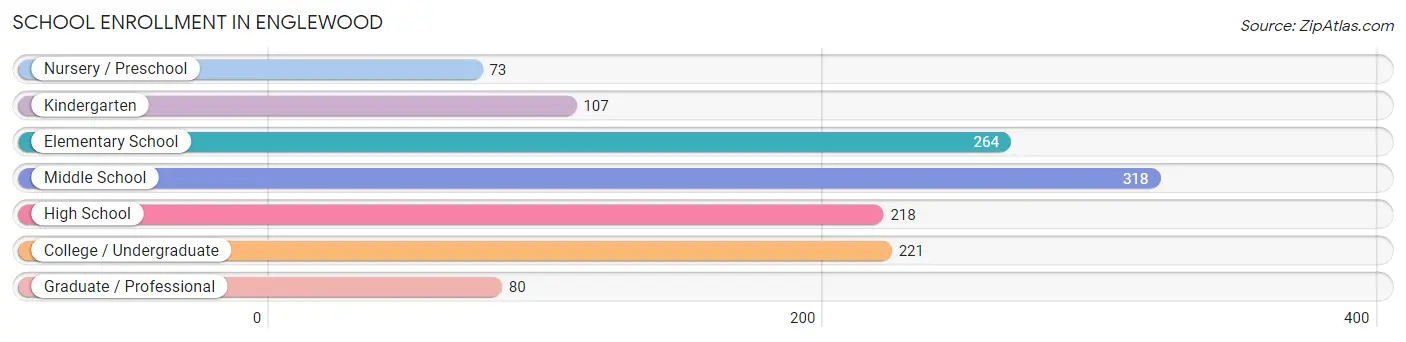
| School Level | # Students | % Students |
| Nursery / Preschool | 73 | 5.7% |
| Kindergarten | 107 | 8.4% |
| Elementary School | 264 | 20.6% |
| Middle School | 318 | 24.8% |
| High School | 218 | 17.0% |
| College / Undergraduate | 221 | 17.2% |
| Graduate / Professional | 80 | 6.2% |
| Total | 1,281 | 100.0% |
School Enrollment by Age by Funding Source in Englewood
Out of a total of 1,281 students who are enrolled in schools in Englewood, 151 (11.8%) attend a private institution, while the remaining 1,130 (88.2%) are enrolled in public schools. The age group of 35 years and over has the highest likelihood of being enrolled in private schools, with 53 (47.7% in the age bracket) enrolled. Conversely, the age group of 15 to 17 year olds has the lowest likelihood of being enrolled in a private school, with 177 (100.0% in the age bracket) attending a public institution.
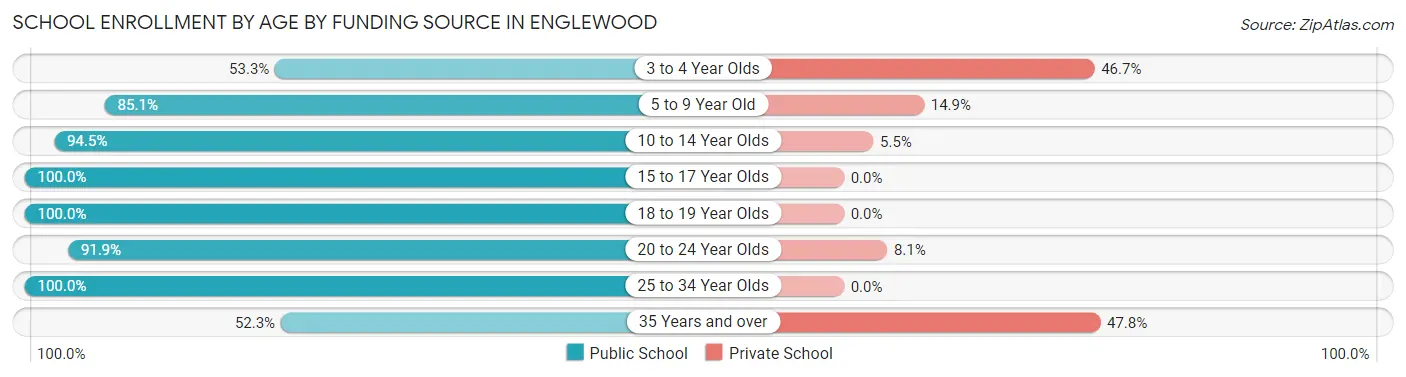
| Age Bracket | Public School | Private School |
| 3 to 4 Year Olds | 16 (53.3%) | 14 (46.7%) |
| 5 to 9 Year Old | 308 (85.1%) | 54 (14.9%) |
| 10 to 14 Year Olds | 345 (94.5%) | 20 (5.5%) |
| 15 to 17 Year Olds | 177 (100.0%) | 0 (0.0%) |
| 18 to 19 Year Olds | 78 (100.0%) | 0 (0.0%) |
| 20 to 24 Year Olds | 114 (91.9%) | 10 (8.1%) |
| 25 to 34 Year Olds | 34 (100.0%) | 0 (0.0%) |
| 35 Years and over | 58 (52.2%) | 53 (47.7%) |
| Total | 1,130 (88.2%) | 151 (11.8%) |
Educational Attainment by Field of Study in Englewood
Education (1,334 | 20.1%), business (1,247 | 18.8%), science & technology (927 | 14.0%), social sciences (482 | 7.3%), and arts & humanities (371 | 5.6%) are the most common fields of study among 6,635 individuals in Englewood who have obtained a bachelor's degree or higher.
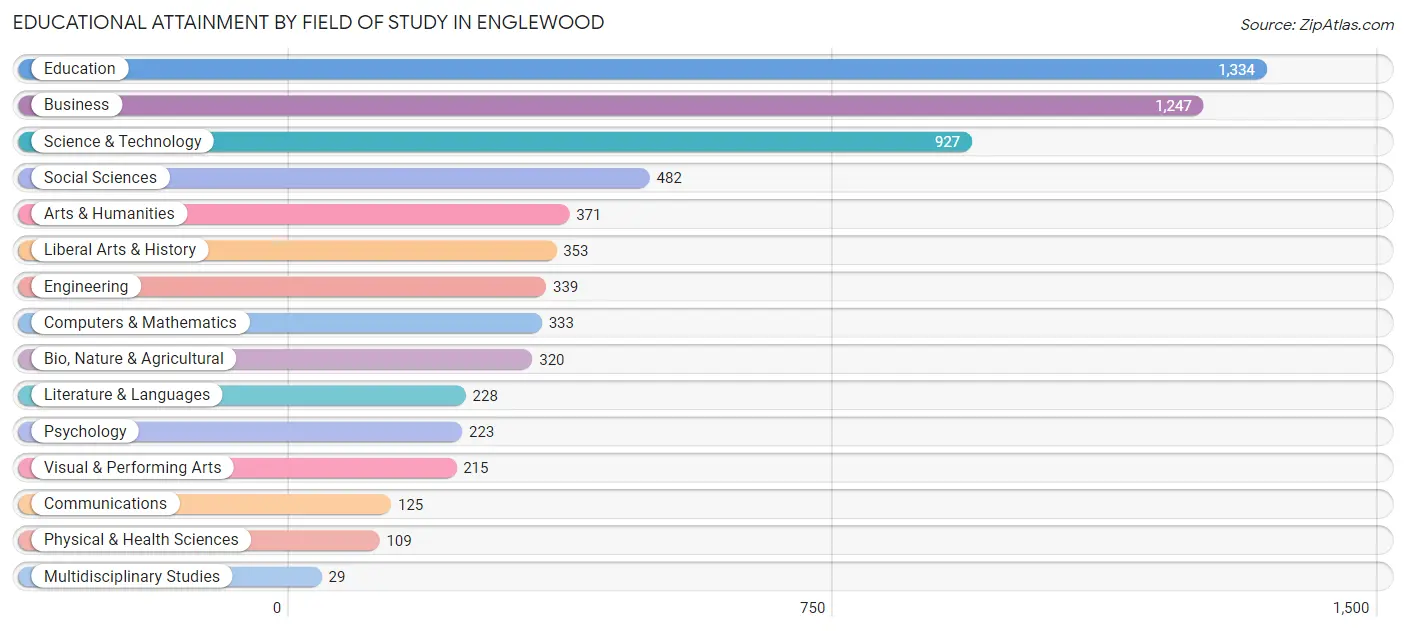
| Field of Study | # Graduates | % Graduates |
| Computers & Mathematics | 333 | 5.0% |
| Bio, Nature & Agricultural | 320 | 4.8% |
| Physical & Health Sciences | 109 | 1.6% |
| Psychology | 223 | 3.4% |
| Social Sciences | 482 | 7.3% |
| Engineering | 339 | 5.1% |
| Multidisciplinary Studies | 29 | 0.4% |
| Science & Technology | 927 | 14.0% |
| Business | 1,247 | 18.8% |
| Education | 1,334 | 20.1% |
| Literature & Languages | 228 | 3.4% |
| Liberal Arts & History | 353 | 5.3% |
| Visual & Performing Arts | 215 | 3.2% |
| Communications | 125 | 1.9% |
| Arts & Humanities | 371 | 5.6% |
| Total | 6,635 | 100.0% |
Transportation & Commute in Englewood
Vehicle Availability by Sex in Englewood
The most prevalent vehicle ownership categories in Englewood are males with 2 vehicles (1,126, accounting for 40.5%) and females with 2 vehicles (1,034, making up 44.2%).
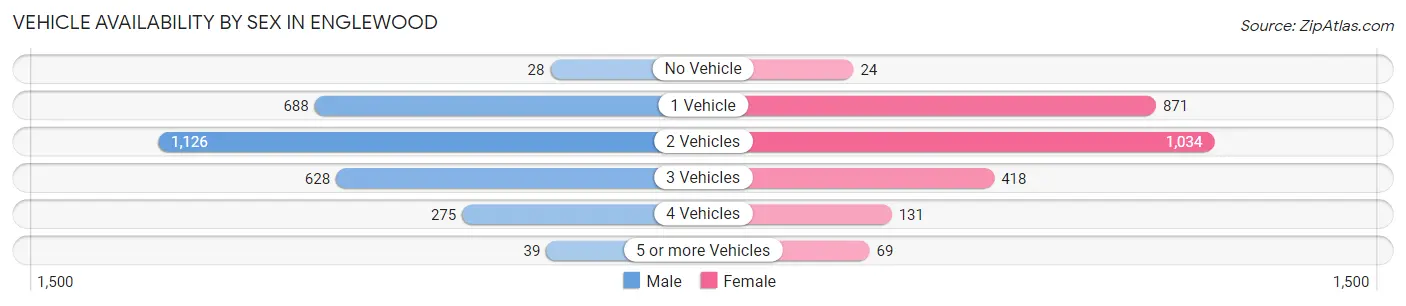
| Vehicles Available | Male | Female |
| No Vehicle | 28 (1.0%) | 24 (0.9%) |
| 1 Vehicle | 688 (24.7%) | 871 (34.2%) |
| 2 Vehicles | 1,126 (40.5%) | 1,034 (40.6%) |
| 3 Vehicles | 628 (22.6%) | 418 (16.4%) |
| 4 Vehicles | 275 (9.9%) | 131 (5.1%) |
| 5 or more Vehicles | 39 (1.4%) | 69 (2.7%) |
| Total | 2,784 (100.0%) | 2,547 (100.0%) |
Commute Time in Englewood
The most frequently occuring commute durations in Englewood are 10 to 14 minutes (682 commuters, 15.2%), 30 to 34 minutes (658 commuters, 14.6%), and 15 to 19 minutes (638 commuters, 14.2%).
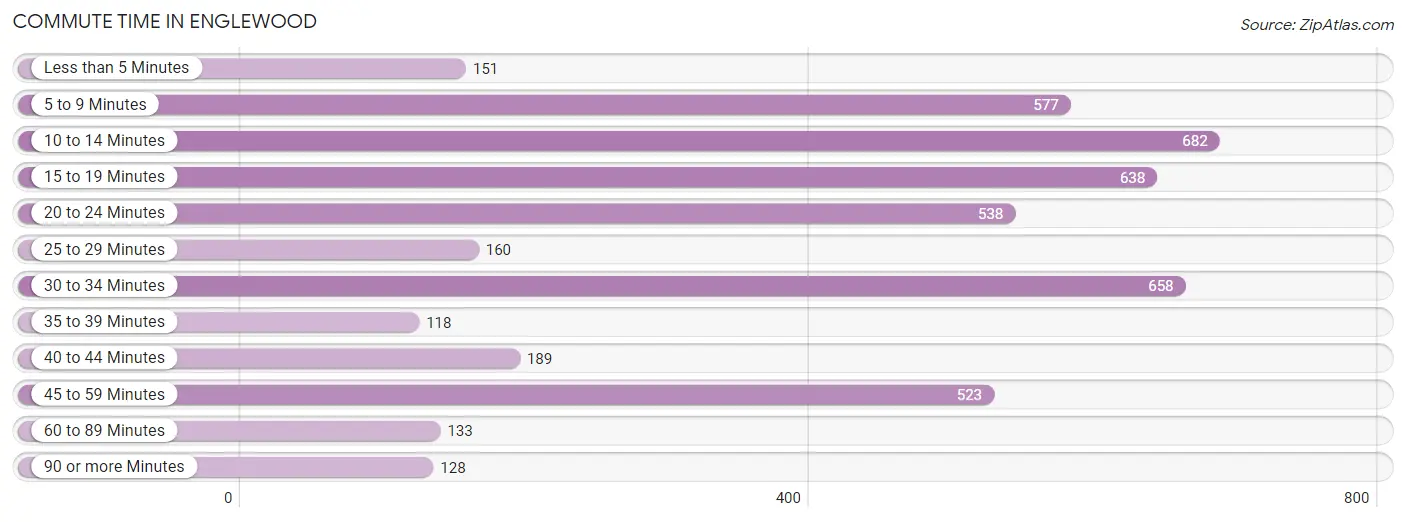
| Commute Time | # Commuters | % Commuters |
| Less than 5 Minutes | 151 | 3.4% |
| 5 to 9 Minutes | 577 | 12.8% |
| 10 to 14 Minutes | 682 | 15.2% |
| 15 to 19 Minutes | 638 | 14.2% |
| 20 to 24 Minutes | 538 | 12.0% |
| 25 to 29 Minutes | 160 | 3.6% |
| 30 to 34 Minutes | 658 | 14.6% |
| 35 to 39 Minutes | 118 | 2.6% |
| 40 to 44 Minutes | 189 | 4.2% |
| 45 to 59 Minutes | 523 | 11.6% |
| 60 to 89 Minutes | 133 | 3.0% |
| 90 or more Minutes | 128 | 2.9% |
Commute Time by Sex in Englewood
The most common commute times in Englewood are 5 to 9 minutes (343 commuters, 14.6%) for males and 15 to 19 minutes (386 commuters, 18.0%) for females.
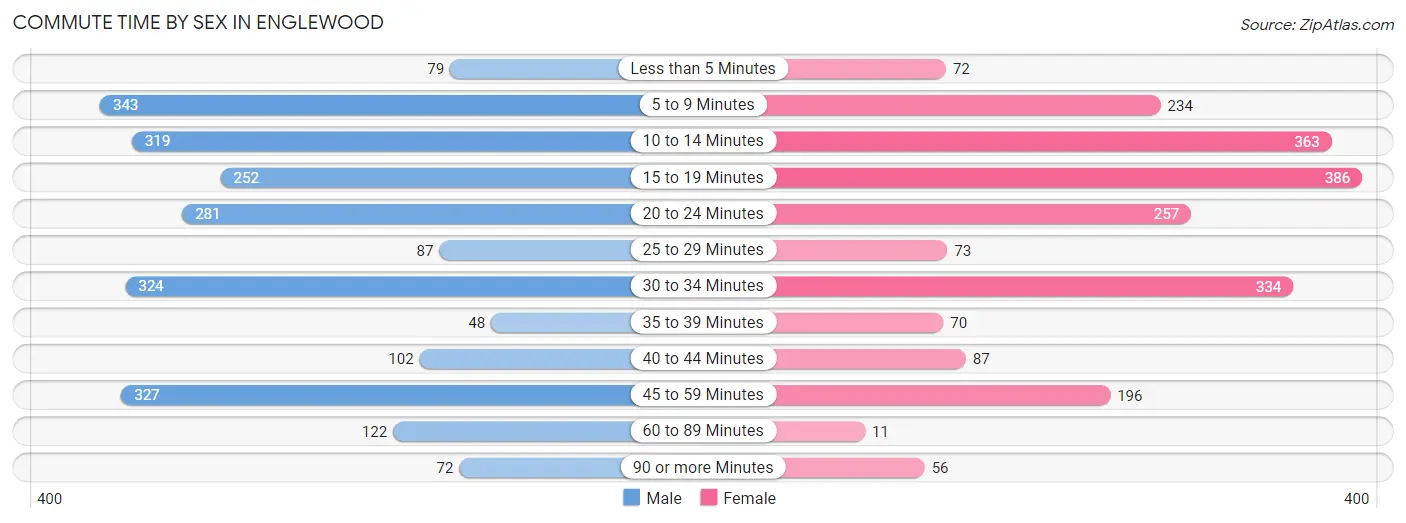
| Commute Time | Male | Female |
| Less than 5 Minutes | 79 (3.4%) | 72 (3.4%) |
| 5 to 9 Minutes | 343 (14.6%) | 234 (10.9%) |
| 10 to 14 Minutes | 319 (13.5%) | 363 (17.0%) |
| 15 to 19 Minutes | 252 (10.7%) | 386 (18.0%) |
| 20 to 24 Minutes | 281 (11.9%) | 257 (12.0%) |
| 25 to 29 Minutes | 87 (3.7%) | 73 (3.4%) |
| 30 to 34 Minutes | 324 (13.8%) | 334 (15.6%) |
| 35 to 39 Minutes | 48 (2.0%) | 70 (3.3%) |
| 40 to 44 Minutes | 102 (4.3%) | 87 (4.1%) |
| 45 to 59 Minutes | 327 (13.9%) | 196 (9.2%) |
| 60 to 89 Minutes | 122 (5.2%) | 11 (0.5%) |
| 90 or more Minutes | 72 (3.1%) | 56 (2.6%) |
Time of Departure to Work by Sex in Englewood
The most frequent times of departure to work in Englewood are 7:30 AM to 7:59 AM (398, 16.9%) for males and 8:30 AM to 8:59 AM (313, 14.6%) for females.
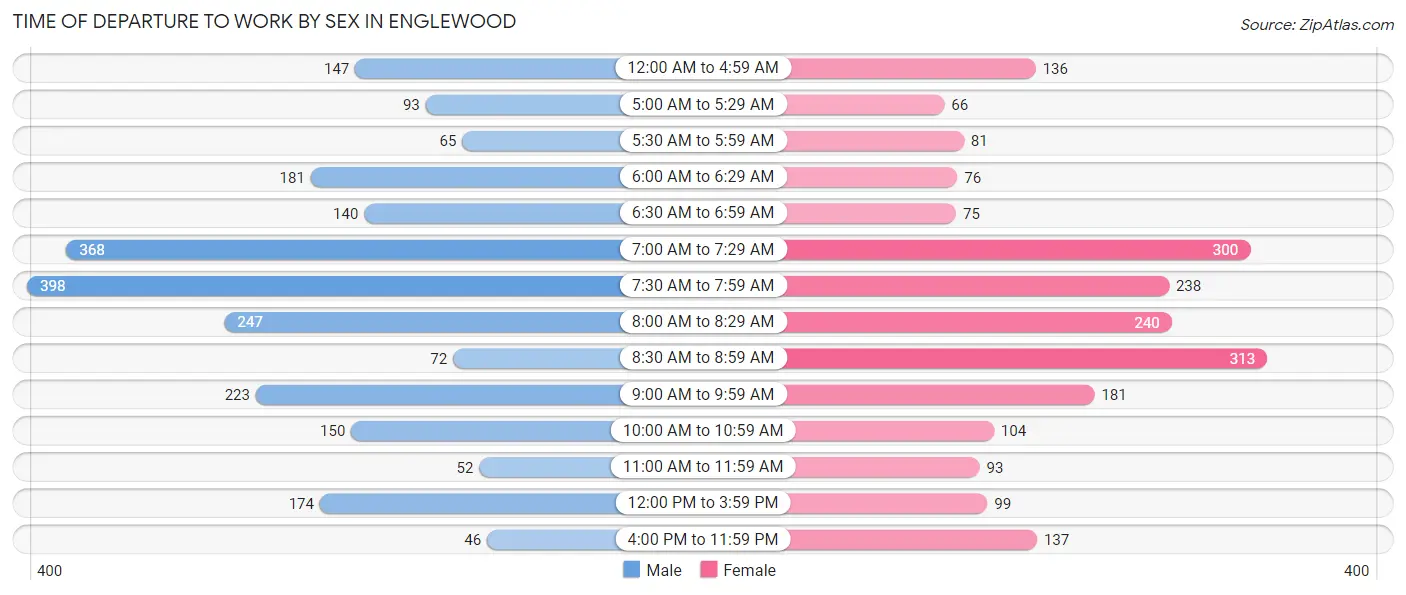
| Time of Departure | Male | Female |
| 12:00 AM to 4:59 AM | 147 (6.2%) | 136 (6.4%) |
| 5:00 AM to 5:29 AM | 93 (4.0%) | 66 (3.1%) |
| 5:30 AM to 5:59 AM | 65 (2.8%) | 81 (3.8%) |
| 6:00 AM to 6:29 AM | 181 (7.7%) | 76 (3.5%) |
| 6:30 AM to 6:59 AM | 140 (5.9%) | 75 (3.5%) |
| 7:00 AM to 7:29 AM | 368 (15.6%) | 300 (14.0%) |
| 7:30 AM to 7:59 AM | 398 (16.9%) | 238 (11.1%) |
| 8:00 AM to 8:29 AM | 247 (10.5%) | 240 (11.2%) |
| 8:30 AM to 8:59 AM | 72 (3.1%) | 313 (14.6%) |
| 9:00 AM to 9:59 AM | 223 (9.5%) | 181 (8.5%) |
| 10:00 AM to 10:59 AM | 150 (6.4%) | 104 (4.9%) |
| 11:00 AM to 11:59 AM | 52 (2.2%) | 93 (4.3%) |
| 12:00 PM to 3:59 PM | 174 (7.4%) | 99 (4.6%) |
| 4:00 PM to 11:59 PM | 46 (1.9%) | 137 (6.4%) |
| Total | 2,356 (100.0%) | 2,139 (100.0%) |
Housing Occupancy in Englewood
Occupancy by Ownership in Englewood
Of the total 10,132 dwellings in Englewood, owner-occupied units account for 8,741 (86.3%), while renter-occupied units make up 1,391 (13.7%).
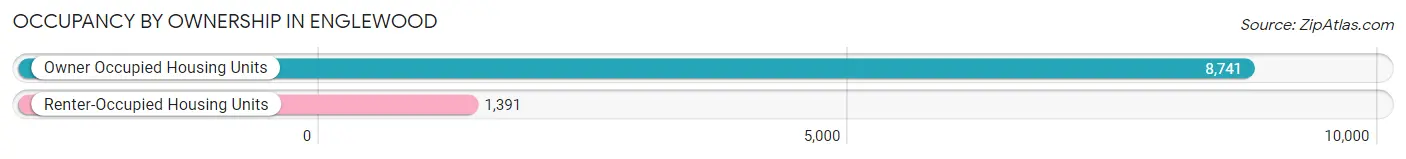
| Occupancy | # Housing Units | % Housing Units |
| Owner Occupied Housing Units | 8,741 | 86.3% |
| Renter-Occupied Housing Units | 1,391 | 13.7% |
| Total Occupied Housing Units | 10,132 | 100.0% |
Occupancy by Household Size in Englewood
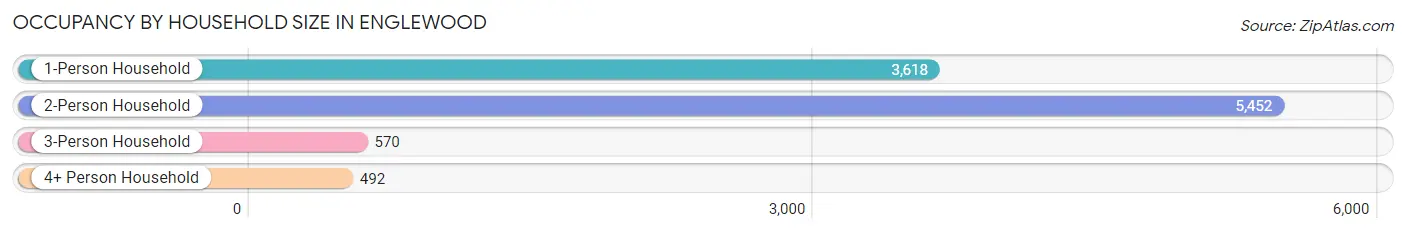
| Household Size | # Housing Units | % Housing Units |
| 1-Person Household | 3,618 | 35.7% |
| 2-Person Household | 5,452 | 53.8% |
| 3-Person Household | 570 | 5.6% |
| 4+ Person Household | 492 | 4.9% |
| Total Housing Units | 10,132 | 100.0% |
Occupancy by Ownership by Household Size in Englewood
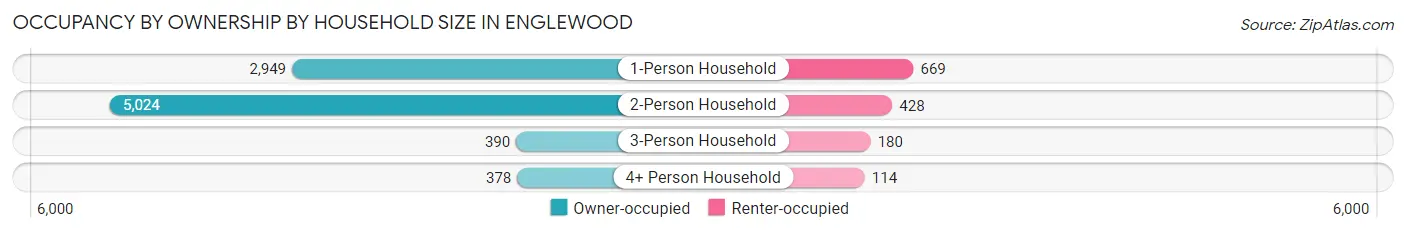
| Household Size | Owner-occupied | Renter-occupied |
| 1-Person Household | 2,949 (81.5%) | 669 (18.5%) |
| 2-Person Household | 5,024 (92.1%) | 428 (7.9%) |
| 3-Person Household | 390 (68.4%) | 180 (31.6%) |
| 4+ Person Household | 378 (76.8%) | 114 (23.2%) |
| Total Housing Units | 8,741 (86.3%) | 1,391 (13.7%) |
Occupancy by Educational Attainment in Englewood
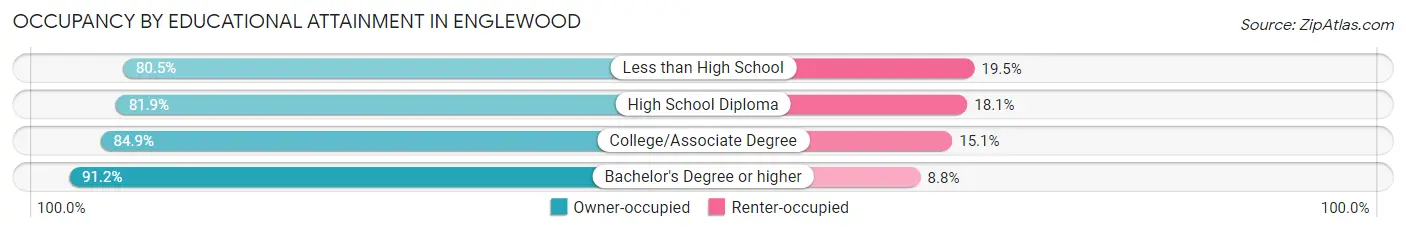
| Household Size | Owner-occupied | Renter-occupied |
| Less than High School | 260 (80.5%) | 63 (19.5%) |
| High School Diploma | 2,402 (81.9%) | 530 (18.1%) |
| College/Associate Degree | 2,595 (84.9%) | 461 (15.1%) |
| Bachelor's Degree or higher | 3,484 (91.2%) | 337 (8.8%) |
Occupancy by Age of Householder in Englewood
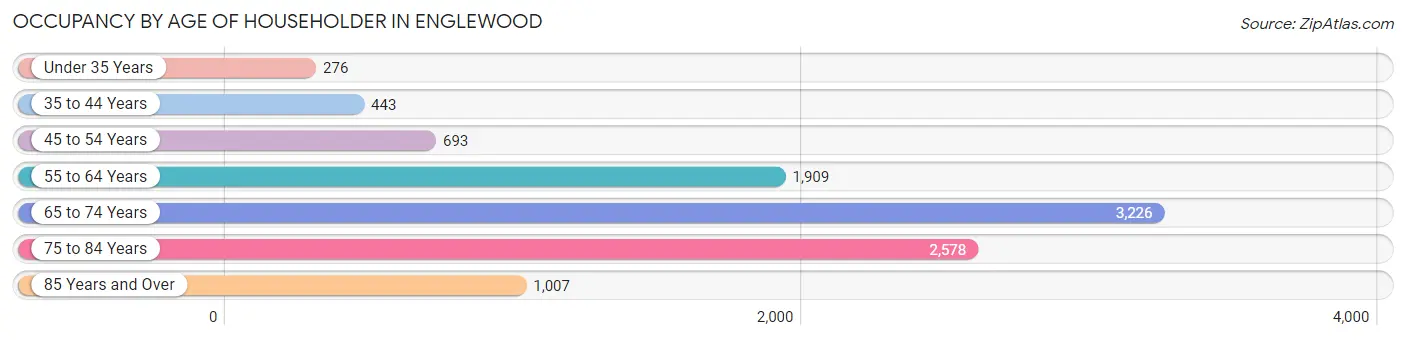
| Age Bracket | # Households | % Households |
| Under 35 Years | 276 | 2.7% |
| 35 to 44 Years | 443 | 4.4% |
| 45 to 54 Years | 693 | 6.8% |
| 55 to 64 Years | 1,909 | 18.8% |
| 65 to 74 Years | 3,226 | 31.8% |
| 75 to 84 Years | 2,578 | 25.4% |
| 85 Years and Over | 1,007 | 9.9% |
| Total | 10,132 | 100.0% |
Housing Finances in Englewood
Median Income by Occupancy in Englewood
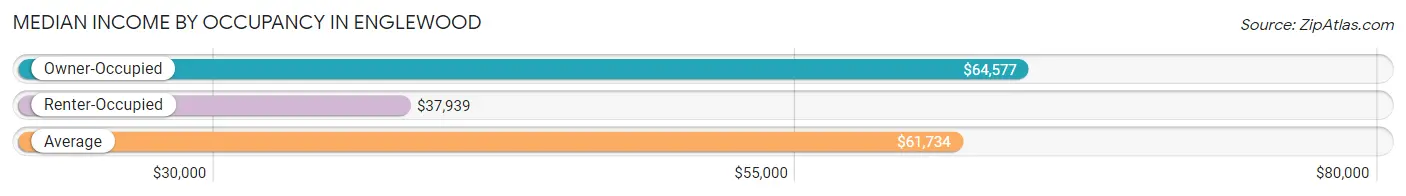
| Occupancy Type | # Households | Median Income |
| Owner-Occupied | 8,741 (86.3%) | $64,577 |
| Renter-Occupied | 1,391 (13.7%) | $37,939 |
| Average | 10,132 (100.0%) | $61,734 |
Occupancy by Householder Income Bracket in Englewood
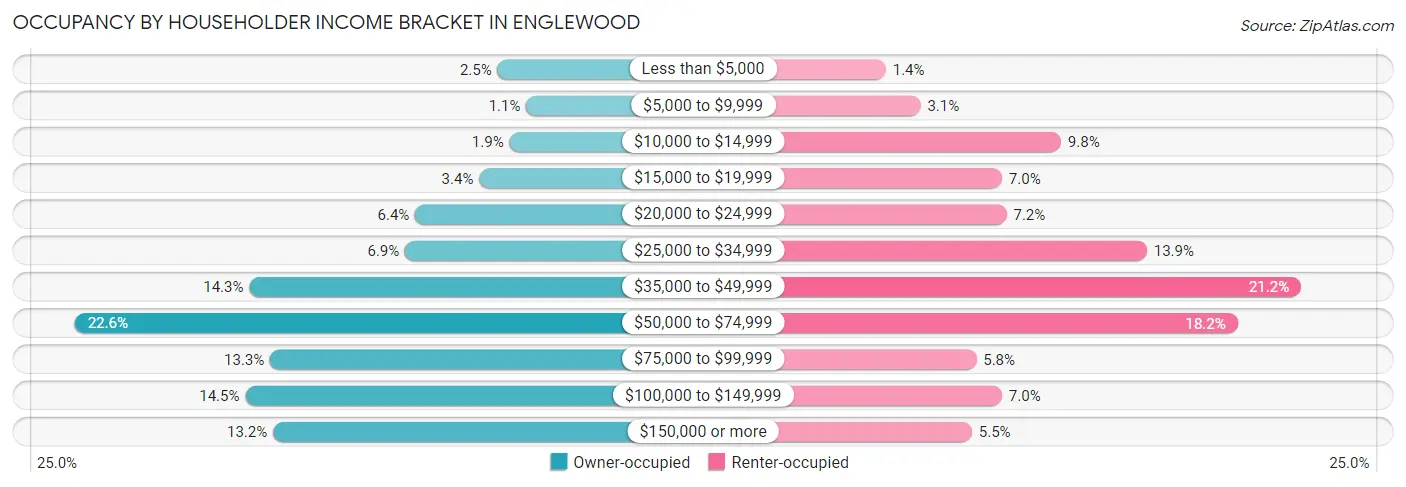
| Income Bracket | Owner-occupied | Renter-occupied |
| Less than $5,000 | 217 (2.5%) | 20 (1.4%) |
| $5,000 to $9,999 | 97 (1.1%) | 43 (3.1%) |
| $10,000 to $14,999 | 167 (1.9%) | 136 (9.8%) |
| $15,000 to $19,999 | 293 (3.4%) | 97 (7.0%) |
| $20,000 to $24,999 | 559 (6.4%) | 100 (7.2%) |
| $25,000 to $34,999 | 601 (6.9%) | 193 (13.9%) |
| $35,000 to $49,999 | 1,250 (14.3%) | 295 (21.2%) |
| $50,000 to $74,999 | 1,976 (22.6%) | 253 (18.2%) |
| $75,000 to $99,999 | 1,163 (13.3%) | 80 (5.8%) |
| $100,000 to $149,999 | 1,267 (14.5%) | 97 (7.0%) |
| $150,000 or more | 1,151 (13.2%) | 77 (5.5%) |
| Total | 8,741 (100.0%) | 1,391 (100.0%) |
Monthly Housing Cost Tiers in Englewood
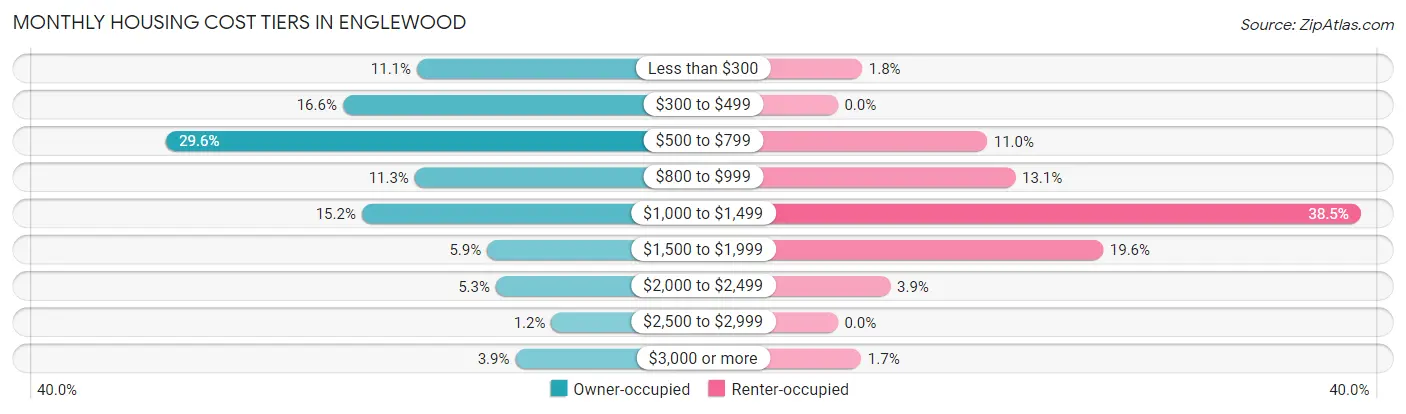
| Monthly Cost | Owner-occupied | Renter-occupied |
| Less than $300 | 971 (11.1%) | 25 (1.8%) |
| $300 to $499 | 1,448 (16.6%) | 0 (0.0%) |
| $500 to $799 | 2,586 (29.6%) | 153 (11.0%) |
| $800 to $999 | 985 (11.3%) | 182 (13.1%) |
| $1,000 to $1,499 | 1,326 (15.2%) | 536 (38.5%) |
| $1,500 to $1,999 | 519 (5.9%) | 272 (19.6%) |
| $2,000 to $2,499 | 463 (5.3%) | 54 (3.9%) |
| $2,500 to $2,999 | 106 (1.2%) | 0 (0.0%) |
| $3,000 or more | 337 (3.9%) | 24 (1.7%) |
| Total | 8,741 (100.0%) | 1,391 (100.0%) |
Physical Housing Characteristics in Englewood
Housing Structures in Englewood
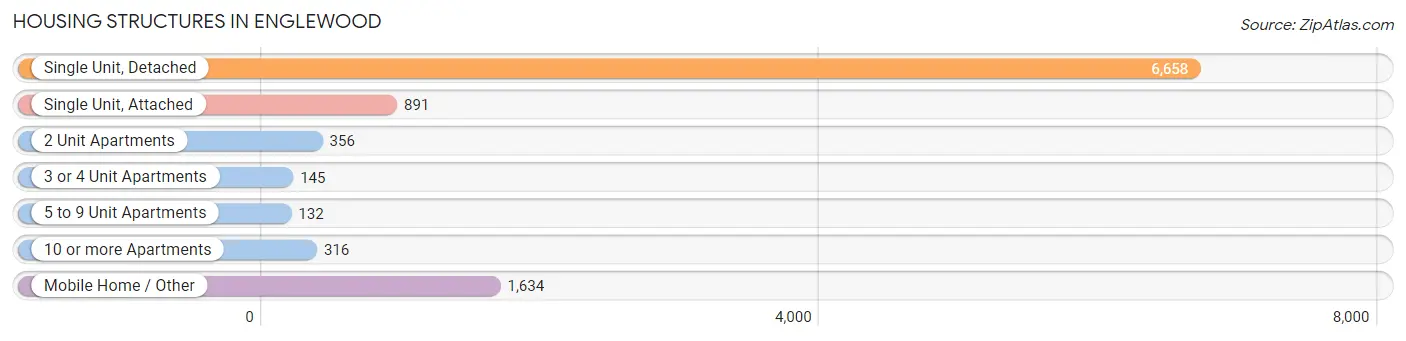
| Structure Type | # Housing Units | % Housing Units |
| Single Unit, Detached | 6,658 | 65.7% |
| Single Unit, Attached | 891 | 8.8% |
| 2 Unit Apartments | 356 | 3.5% |
| 3 or 4 Unit Apartments | 145 | 1.4% |
| 5 to 9 Unit Apartments | 132 | 1.3% |
| 10 or more Apartments | 316 | 3.1% |
| Mobile Home / Other | 1,634 | 16.1% |
| Total | 10,132 | 100.0% |
Housing Structures by Occupancy in Englewood
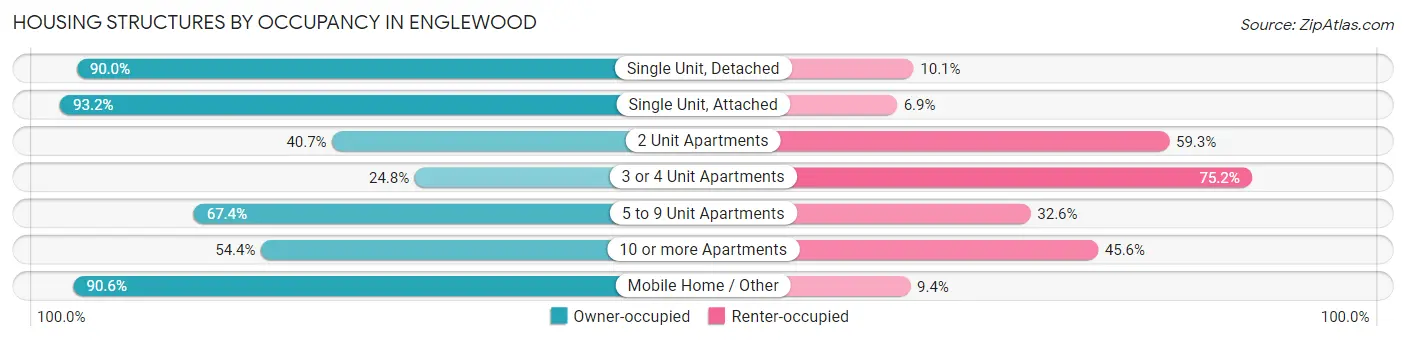
| Structure Type | Owner-occupied | Renter-occupied |
| Single Unit, Detached | 5,989 (89.9%) | 669 (10.1%) |
| Single Unit, Attached | 830 (93.1%) | 61 (6.9%) |
| 2 Unit Apartments | 145 (40.7%) | 211 (59.3%) |
| 3 or 4 Unit Apartments | 36 (24.8%) | 109 (75.2%) |
| 5 to 9 Unit Apartments | 89 (67.4%) | 43 (32.6%) |
| 10 or more Apartments | 172 (54.4%) | 144 (45.6%) |
| Mobile Home / Other | 1,480 (90.6%) | 154 (9.4%) |
| Total | 8,741 (86.3%) | 1,391 (13.7%) |
Housing Structures by Number of Rooms in Englewood
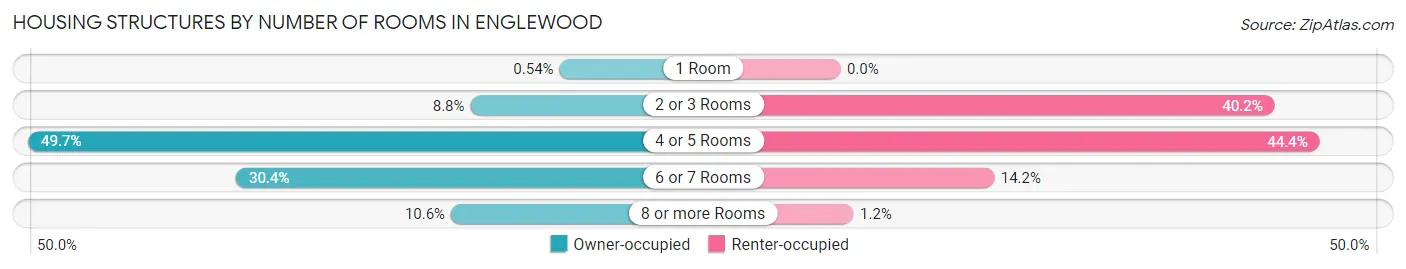
| Number of Rooms | Owner-occupied | Renter-occupied |
| 1 Room | 47 (0.5%) | 0 (0.0%) |
| 2 or 3 Rooms | 767 (8.8%) | 559 (40.2%) |
| 4 or 5 Rooms | 4,342 (49.7%) | 617 (44.4%) |
| 6 or 7 Rooms | 2,661 (30.4%) | 198 (14.2%) |
| 8 or more Rooms | 924 (10.6%) | 17 (1.2%) |
| Total | 8,741 (100.0%) | 1,391 (100.0%) |
Housing Structure by Heating Type in Englewood
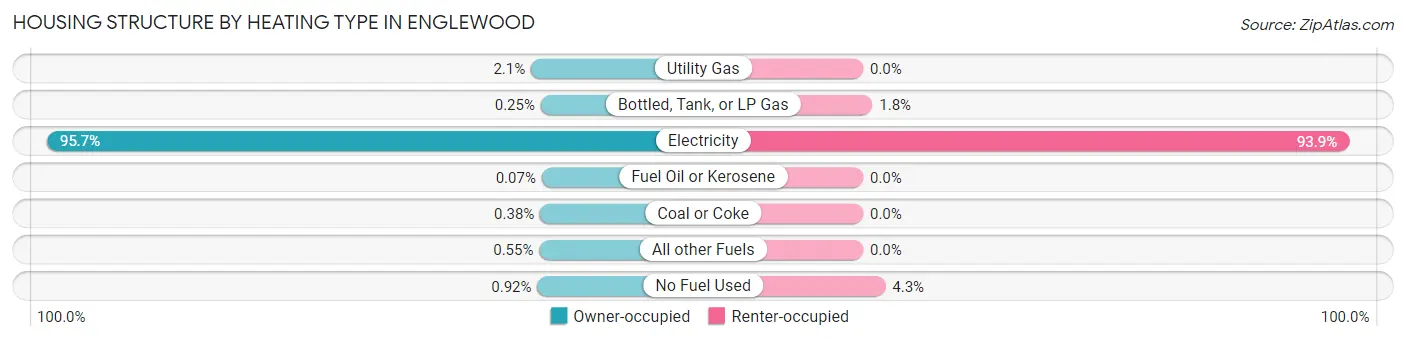
| Heating Type | Owner-occupied | Renter-occupied |
| Utility Gas | 186 (2.1%) | 0 (0.0%) |
| Bottled, Tank, or LP Gas | 22 (0.3%) | 25 (1.8%) |
| Electricity | 8,366 (95.7%) | 1,306 (93.9%) |
| Fuel Oil or Kerosene | 6 (0.1%) | 0 (0.0%) |
| Coal or Coke | 33 (0.4%) | 0 (0.0%) |
| All other Fuels | 48 (0.5%) | 0 (0.0%) |
| No Fuel Used | 80 (0.9%) | 60 (4.3%) |
| Total | 8,741 (100.0%) | 1,391 (100.0%) |
Household Vehicle Usage in Englewood
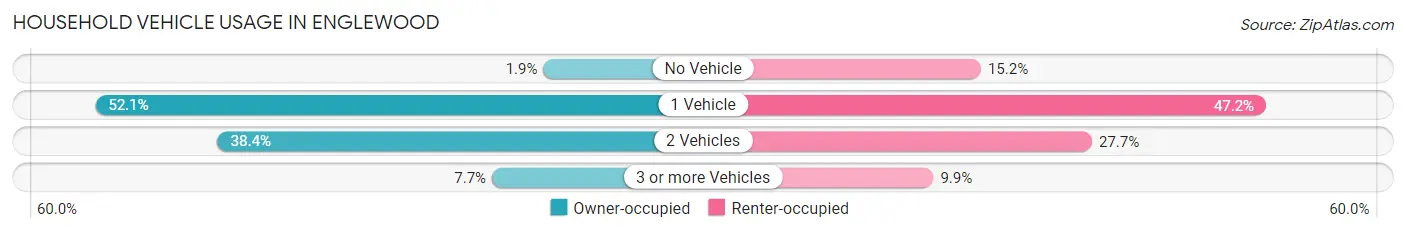
| Vehicles per Household | Owner-occupied | Renter-occupied |
| No Vehicle | 166 (1.9%) | 212 (15.2%) |
| 1 Vehicle | 4,552 (52.1%) | 656 (47.2%) |
| 2 Vehicles | 3,354 (38.4%) | 385 (27.7%) |
| 3 or more Vehicles | 669 (7.6%) | 138 (9.9%) |
| Total | 8,741 (100.0%) | 1,391 (100.0%) |
Real Estate & Mortgages in Englewood
Real Estate and Mortgage Overview in Englewood
| Characteristic | Without Mortgage | With Mortgage |
| Housing Units | 6,120 | 2,621 |
| Median Property Value | $259,800 | $319,400 |
| Median Household Income | $61,860 | $418 |
| Monthly Housing Costs | $577 | $291 |
| Real Estate Taxes | $1,905 | $48 |
Property Value by Mortgage Status in Englewood
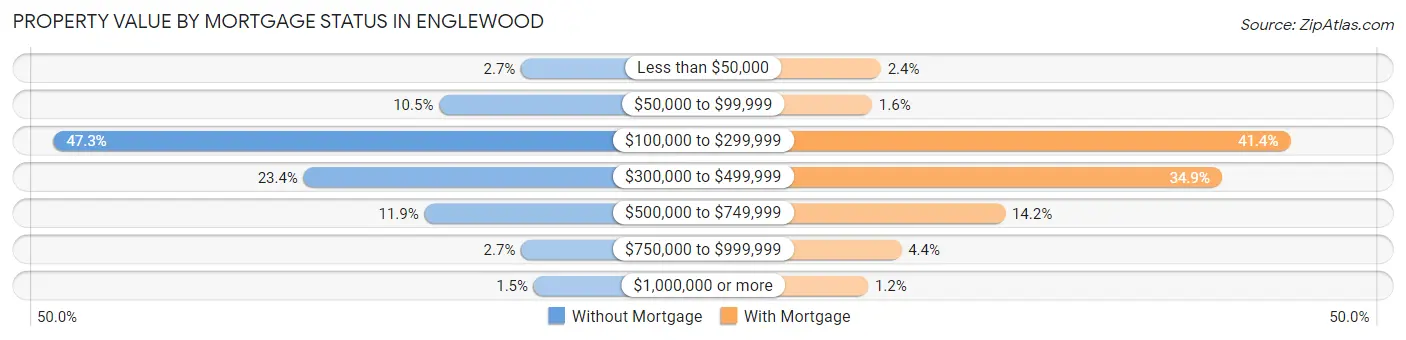
| Property Value | Without Mortgage | With Mortgage |
| Less than $50,000 | 166 (2.7%) | 63 (2.4%) |
| $50,000 to $99,999 | 643 (10.5%) | 41 (1.6%) |
| $100,000 to $299,999 | 2,892 (47.2%) | 1,085 (41.4%) |
| $300,000 to $499,999 | 1,433 (23.4%) | 914 (34.9%) |
| $500,000 to $749,999 | 729 (11.9%) | 373 (14.2%) |
| $750,000 to $999,999 | 165 (2.7%) | 114 (4.3%) |
| $1,000,000 or more | 92 (1.5%) | 31 (1.2%) |
| Total | 6,120 (100.0%) | 2,621 (100.0%) |
Household Income by Mortgage Status in Englewood
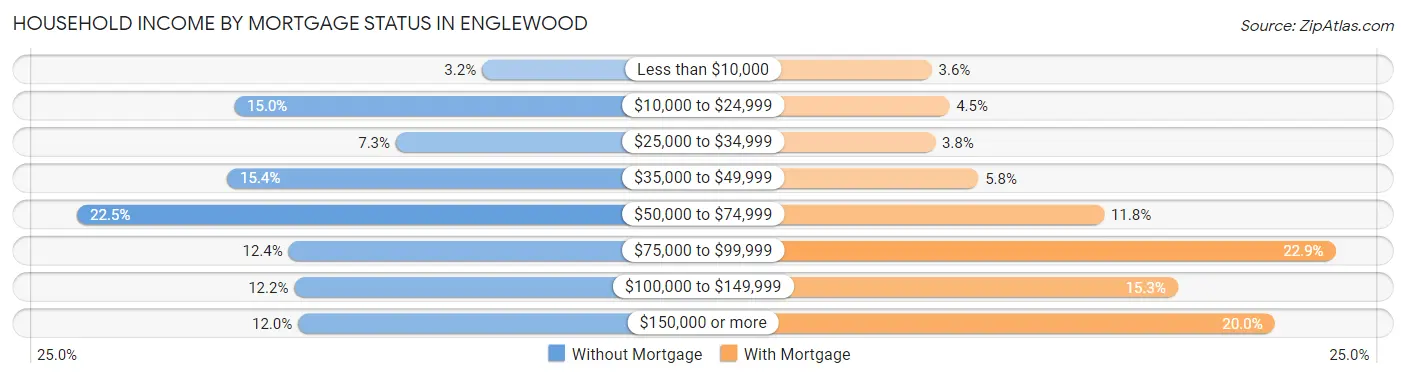
| Household Income | Without Mortgage | With Mortgage |
| Less than $10,000 | 197 (3.2%) | 95 (3.6%) |
| $10,000 to $24,999 | 920 (15.0%) | 117 (4.5%) |
| $25,000 to $34,999 | 448 (7.3%) | 99 (3.8%) |
| $35,000 to $49,999 | 940 (15.4%) | 153 (5.8%) |
| $50,000 to $74,999 | 1,377 (22.5%) | 310 (11.8%) |
| $75,000 to $99,999 | 761 (12.4%) | 599 (22.9%) |
| $100,000 to $149,999 | 744 (12.2%) | 402 (15.3%) |
| $150,000 or more | 733 (12.0%) | 523 (20.0%) |
| Total | 6,120 (100.0%) | 2,621 (100.0%) |
Property Value to Household Income Ratio in Englewood
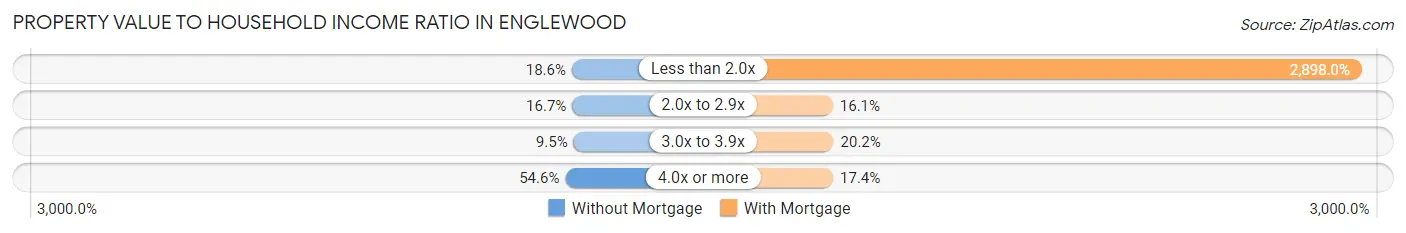
| Value-to-Income Ratio | Without Mortgage | With Mortgage |
| Less than 2.0x | 1,137 (18.6%) | 75,956 (2,898.0%) |
| 2.0x to 2.9x | 1,021 (16.7%) | 422 (16.1%) |
| 3.0x to 3.9x | 583 (9.5%) | 529 (20.2%) |
| 4.0x or more | 3,339 (54.6%) | 456 (17.4%) |
| Total | 6,120 (100.0%) | 2,621 (100.0%) |
Real Estate Taxes by Mortgage Status in Englewood
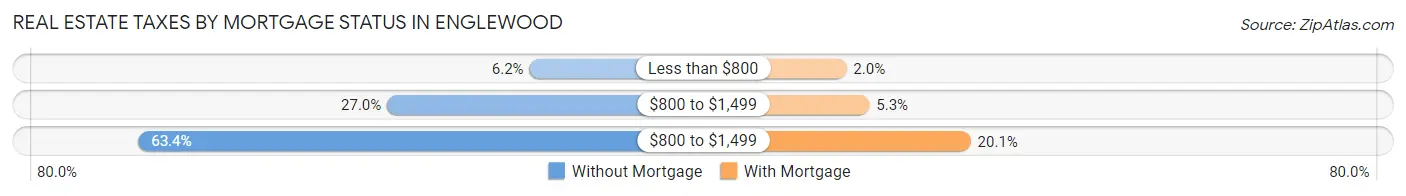
| Property Taxes | Without Mortgage | With Mortgage |
| Less than $800 | 382 (6.2%) | 51 (1.9%) |
| $800 to $1,499 | 1,654 (27.0%) | 139 (5.3%) |
| $800 to $1,499 | 3,879 (63.4%) | 527 (20.1%) |
| Total | 6,120 (100.0%) | 2,621 (100.0%) |
Health & Disability in Englewood
Health Insurance Coverage by Age in Englewood
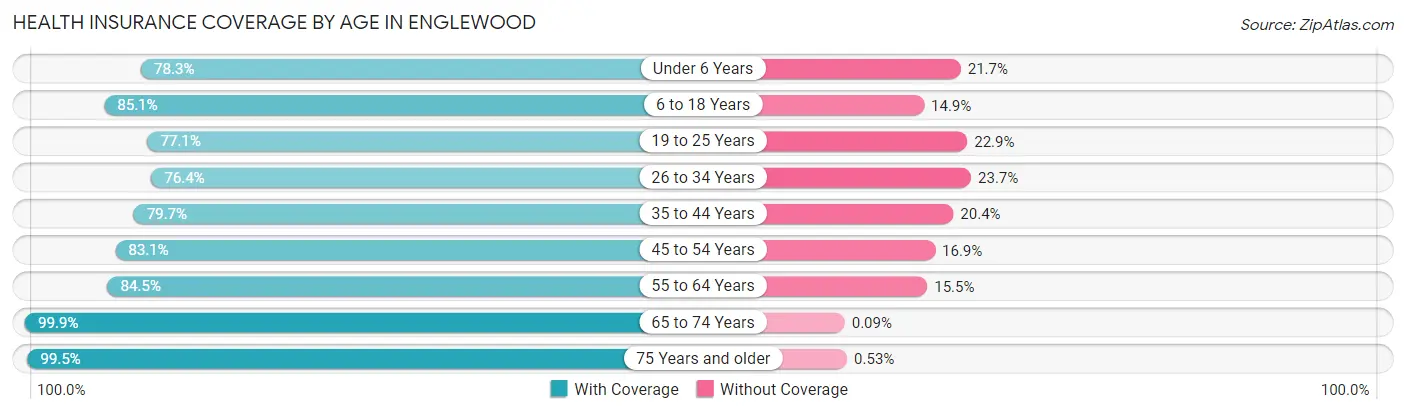
| Age Bracket | With Coverage | Without Coverage |
| Under 6 Years | 292 (78.3%) | 81 (21.7%) |
| 6 to 18 Years | 772 (85.1%) | 135 (14.9%) |
| 19 to 25 Years | 608 (77.1%) | 181 (22.9%) |
| 26 to 34 Years | 481 (76.3%) | 149 (23.6%) |
| 35 to 44 Years | 638 (79.6%) | 163 (20.3%) |
| 45 to 54 Years | 1,212 (83.1%) | 247 (16.9%) |
| 55 to 64 Years | 2,632 (84.5%) | 482 (15.5%) |
| 65 to 74 Years | 5,270 (99.9%) | 5 (0.1%) |
| 75 Years and older | 5,789 (99.5%) | 31 (0.5%) |
| Total | 17,694 (92.3%) | 1,474 (7.7%) |
Health Insurance Coverage by Citizenship Status in Englewood
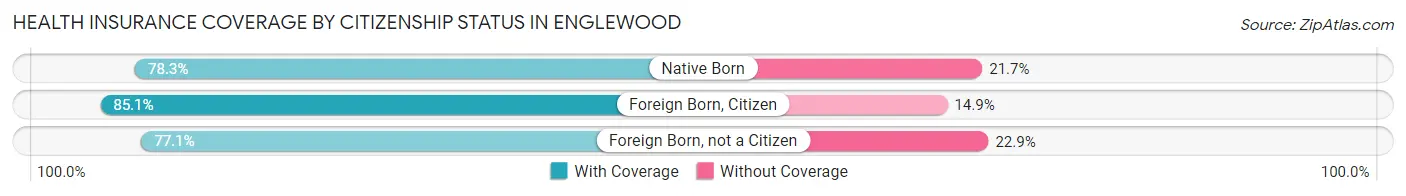
| Citizenship Status | With Coverage | Without Coverage |
| Native Born | 292 (78.3%) | 81 (21.7%) |
| Foreign Born, Citizen | 772 (85.1%) | 135 (14.9%) |
| Foreign Born, not a Citizen | 608 (77.1%) | 181 (22.9%) |
Health Insurance Coverage by Household Income in Englewood
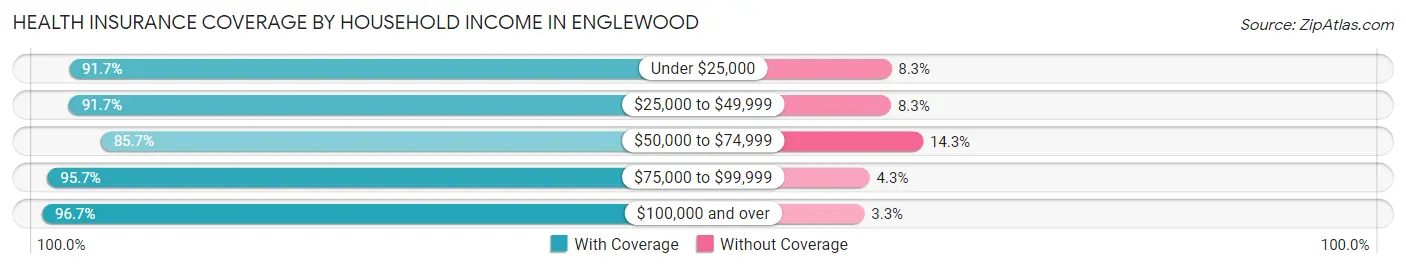
| Household Income | With Coverage | Without Coverage |
| Under $25,000 | 2,267 (91.7%) | 206 (8.3%) |
| $25,000 to $49,999 | 3,571 (91.7%) | 322 (8.3%) |
| $50,000 to $74,999 | 3,916 (85.7%) | 652 (14.3%) |
| $75,000 to $99,999 | 2,236 (95.7%) | 100 (4.3%) |
| $100,000 and over | 5,704 (96.7%) | 194 (3.3%) |
Public vs Private Health Insurance Coverage by Age in Englewood
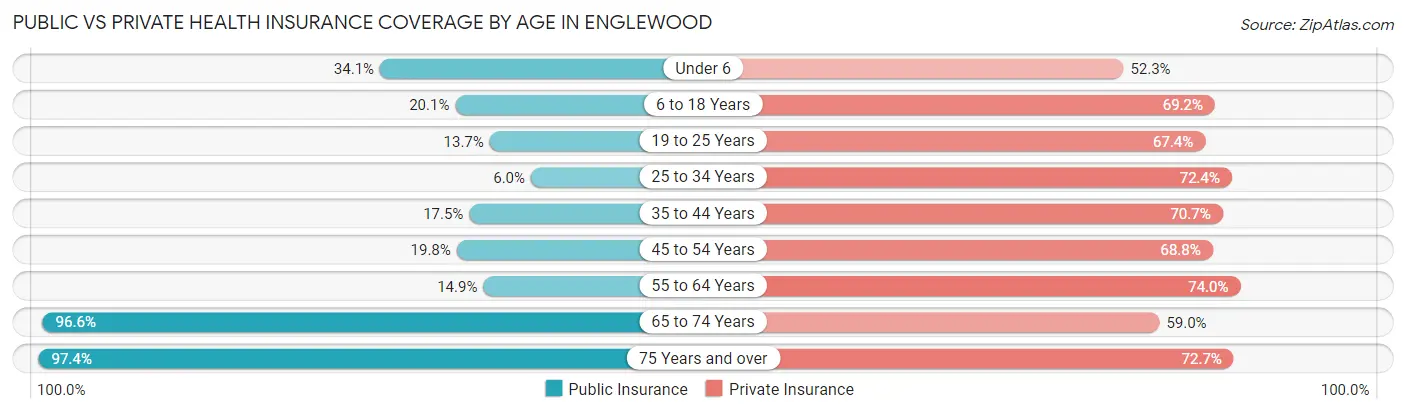
| Age Bracket | Public Insurance | Private Insurance |
| Under 6 | 127 (34.1%) | 195 (52.3%) |
| 6 to 18 Years | 182 (20.1%) | 628 (69.2%) |
| 19 to 25 Years | 108 (13.7%) | 532 (67.4%) |
| 25 to 34 Years | 38 (6.0%) | 456 (72.4%) |
| 35 to 44 Years | 140 (17.5%) | 566 (70.7%) |
| 45 to 54 Years | 289 (19.8%) | 1,004 (68.8%) |
| 55 to 64 Years | 463 (14.9%) | 2,303 (74.0%) |
| 65 to 74 Years | 5,098 (96.6%) | 3,110 (59.0%) |
| 75 Years and over | 5,669 (97.4%) | 4,233 (72.7%) |
| Total | 12,114 (63.2%) | 13,027 (68.0%) |
Disability Status by Sex by Age in Englewood
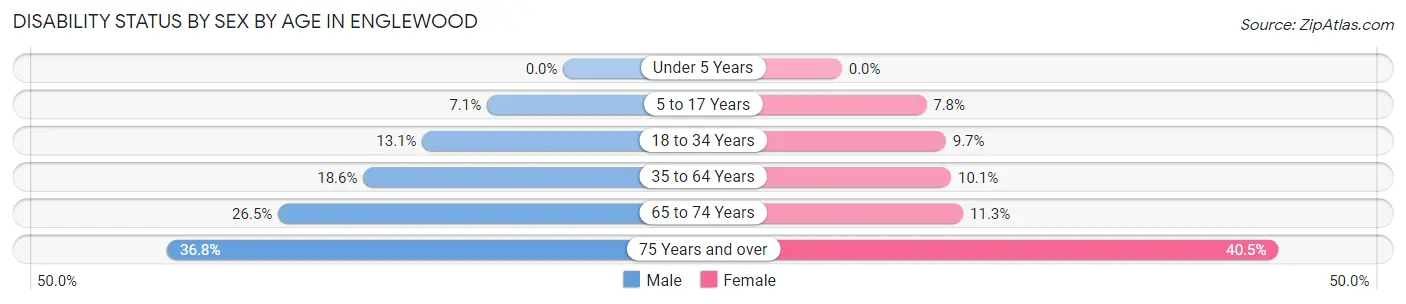
| Age Bracket | Male | Female |
| Under 5 Years | 0 (0.0%) | 0 (0.0%) |
| 5 to 17 Years | 46 (7.1%) | 21 (7.8%) |
| 18 to 34 Years | 113 (13.1%) | 63 (9.7%) |
| 35 to 64 Years | 452 (18.6%) | 298 (10.1%) |
| 65 to 74 Years | 672 (26.5%) | 308 (11.3%) |
| 75 Years and over | 1,082 (36.8%) | 1,166 (40.5%) |
Disability Class by Sex by Age in Englewood
Disability Class: Hearing Difficulty
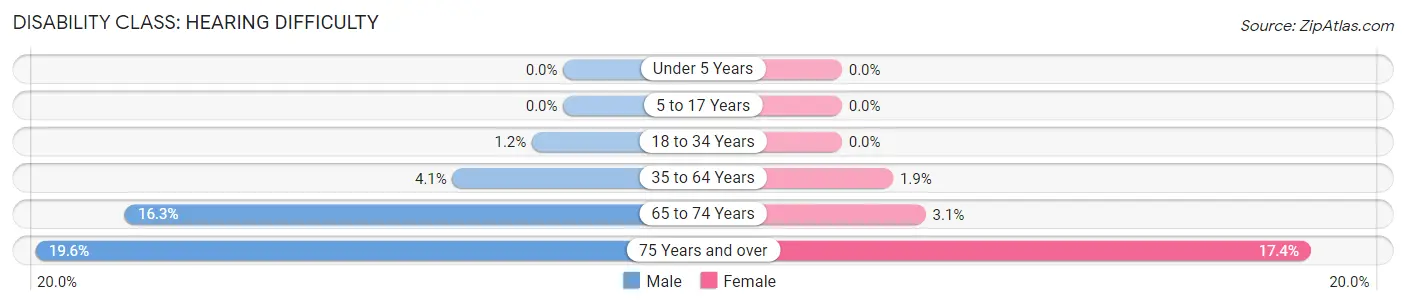
| Age Bracket | Male | Female |
| Under 5 Years | 0 (0.0%) | 0 (0.0%) |
| 5 to 17 Years | 0 (0.0%) | 0 (0.0%) |
| 18 to 34 Years | 10 (1.2%) | 0 (0.0%) |
| 35 to 64 Years | 100 (4.1%) | 56 (1.9%) |
| 65 to 74 Years | 413 (16.3%) | 85 (3.1%) |
| 75 Years and over | 576 (19.6%) | 501 (17.4%) |
Disability Class: Vision Difficulty
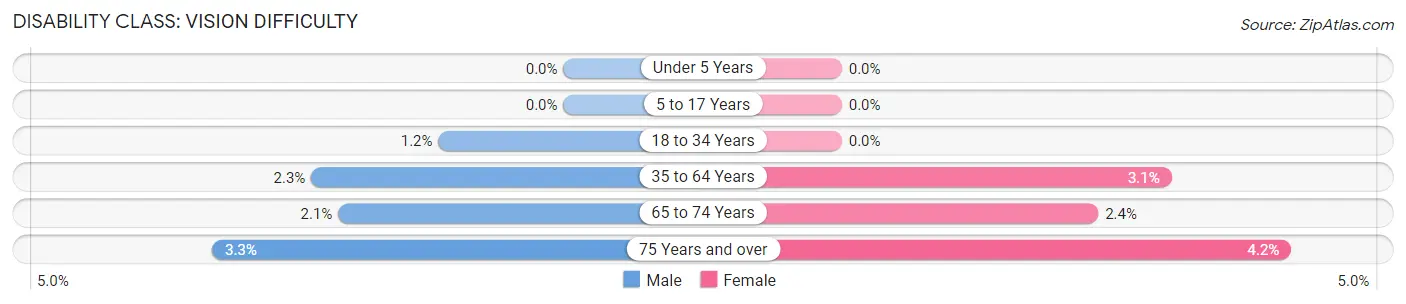
| Age Bracket | Male | Female |
| Under 5 Years | 0 (0.0%) | 0 (0.0%) |
| 5 to 17 Years | 0 (0.0%) | 0 (0.0%) |
| 18 to 34 Years | 10 (1.2%) | 0 (0.0%) |
| 35 to 64 Years | 57 (2.3%) | 90 (3.1%) |
| 65 to 74 Years | 53 (2.1%) | 65 (2.4%) |
| 75 Years and over | 96 (3.3%) | 120 (4.2%) |
Disability Class: Cognitive Difficulty
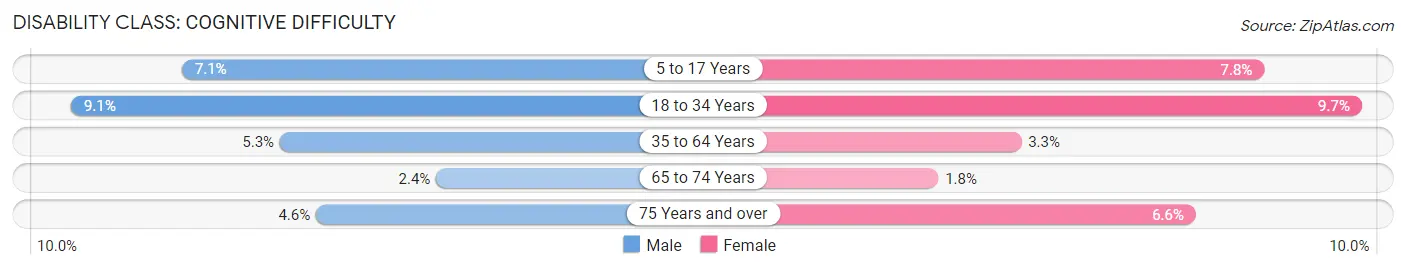
| Age Bracket | Male | Female |
| 5 to 17 Years | 46 (7.1%) | 21 (7.8%) |
| 18 to 34 Years | 79 (9.1%) | 63 (9.7%) |
| 35 to 64 Years | 128 (5.3%) | 98 (3.3%) |
| 65 to 74 Years | 60 (2.4%) | 49 (1.8%) |
| 75 Years and over | 135 (4.6%) | 189 (6.6%) |
Disability Class: Ambulatory Difficulty
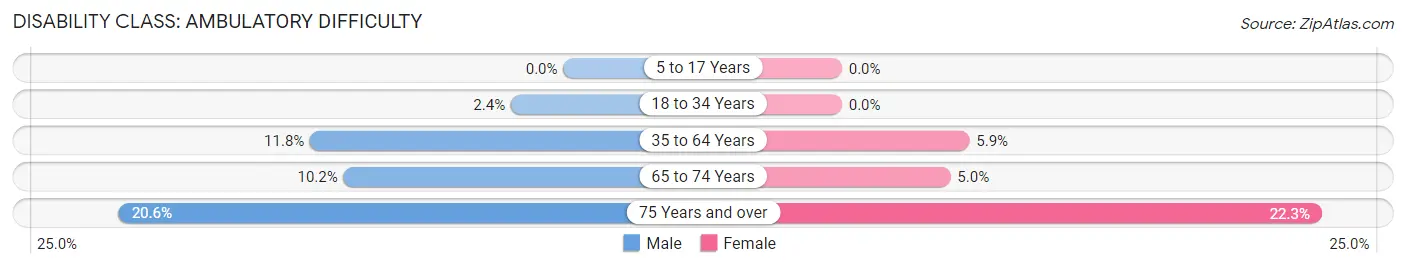
| Age Bracket | Male | Female |
| 5 to 17 Years | 0 (0.0%) | 0 (0.0%) |
| 18 to 34 Years | 21 (2.4%) | 0 (0.0%) |
| 35 to 64 Years | 286 (11.7%) | 174 (5.9%) |
| 65 to 74 Years | 259 (10.2%) | 138 (5.0%) |
| 75 Years and over | 607 (20.6%) | 641 (22.3%) |
Disability Class: Self-Care Difficulty
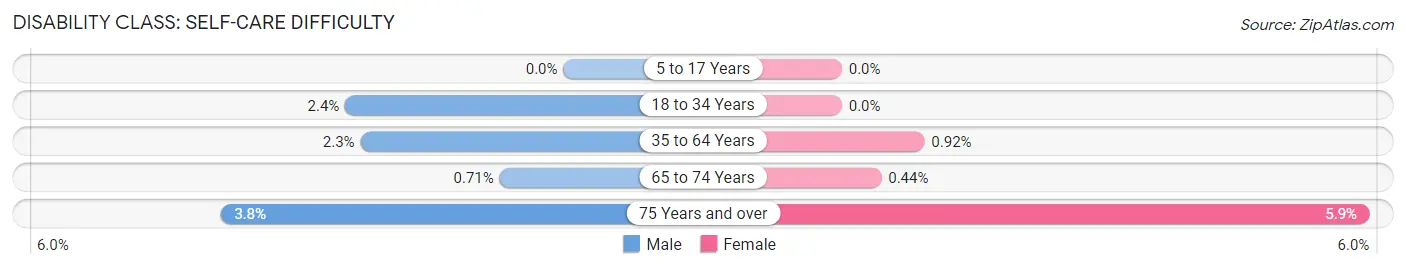
| Age Bracket | Male | Female |
| 5 to 17 Years | 0 (0.0%) | 0 (0.0%) |
| 18 to 34 Years | 21 (2.4%) | 0 (0.0%) |
| 35 to 64 Years | 55 (2.3%) | 27 (0.9%) |
| 65 to 74 Years | 18 (0.7%) | 12 (0.4%) |
| 75 Years and over | 112 (3.8%) | 169 (5.9%) |
Technology Access in Englewood
Computing Device Access in Englewood
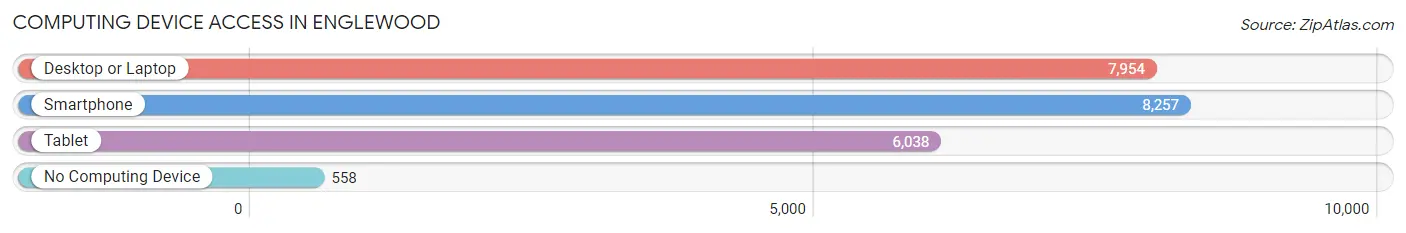
| Device Type | # Households | % Households |
| Desktop or Laptop | 7,954 | 78.5% |
| Smartphone | 8,257 | 81.5% |
| Tablet | 6,038 | 59.6% |
| No Computing Device | 558 | 5.5% |
| Total | 10,132 | 100.0% |
Internet Access in Englewood
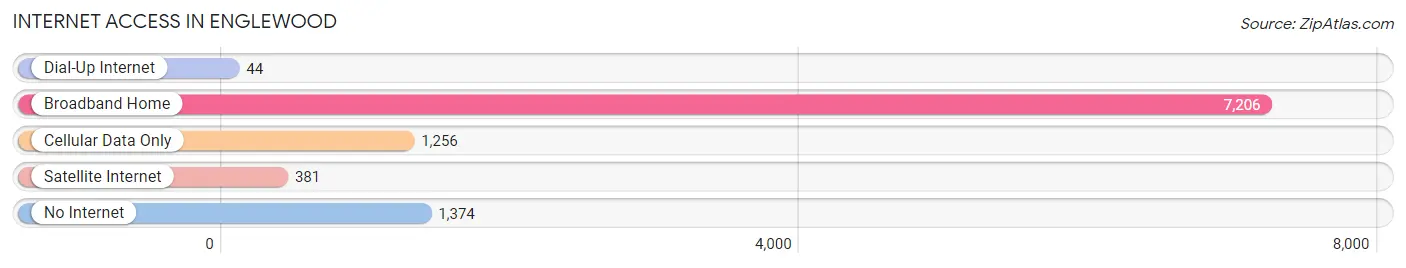
| Internet Type | # Households | % Households |
| Dial-Up Internet | 44 | 0.4% |
| Broadband Home | 7,206 | 71.1% |
| Cellular Data Only | 1,256 | 12.4% |
| Satellite Internet | 381 | 3.8% |
| No Internet | 1,374 | 13.6% |
| Total | 10,132 | 100.0% |
Englewood Summary
Englewood is a census-designated place (CDP) located in Charlotte and Sarasota counties in the U.S. state of Florida. It is part of the North Port–Sarasota–Bradenton Metropolitan Statistical Area. As of the 2010 census, the population was 14,863.
History
Englewood was first settled in the late 1800s by homesteaders from Ohio and Pennsylvania. The town was originally called “Curryville” after a local family, but the name was changed to Englewood in 1911. The name was chosen to honor the Engle family, who had moved to the area from Ohio.
The town was incorporated in 1925 and grew rapidly in the 1950s and 1960s. It was a popular destination for retirees and vacationers, and the population peaked at around 20,000 in the 1970s.
Geography
Englewood is located at the southern tip of Charlotte County, on the Gulf of Mexico. It is bordered to the north by the city of North Port and to the south by Sarasota County. The CDP has a total area of 11.2 square miles, of which 10.7 square miles is land and 0.5 square miles is water.
The terrain is mostly flat, with some low hills in the northern part of the CDP. The climate is humid subtropical, with hot, humid summers and mild winters.
Economy
Englewood’s economy is largely based on tourism and retirement. The town is home to several resorts and golf courses, as well as a number of restaurants and shops. The town also has a large fishing industry, with several marinas and boat ramps.
Demographics
As of the 2010 census, there were 14,863 people, 6,845 households, and 4,092 families residing in the CDP. The population density was 1,385.3 people per square mile. There were 8,845 housing units at an average density of 825.3 per square mile.
The racial makeup of the CDP was 94.2% White, 2.2% African American, 0.3% Native American, 0.9% Asian, 0.1% Pacific Islander, 1.2% from other races, and 1.1% from two or more races. Hispanic or Latino of any race were 5.2% of the population.
The median income for a household in the CDP was $37,945, and the median income for a family was $45,945. Males had a median income of $31,945 versus $25,945 for females. The per capita income for the CDP was $20,945. About 8.2% of families and 11.2% of the population were below the poverty line, including 16.2% of those under age 18 and 6.2% of those age 65 or over.
Common Questions
What is Per Capita Income in Englewood?
Per Capita income in Englewood is $45,531.
What is the Median Family Income in Englewood?
Median Family Income in Englewood is $72,695.
What is the Median Household income in Englewood?
Median Household Income in Englewood is $61,734.
What is Income or Wage Gap in Englewood?
Income or Wage Gap in Englewood is 0.6%.
Women in Englewood earn 99.4 cents for every dollar earned by a man.
What is Inequality or Gini Index in Englewood?
Inequality or Gini Index in Englewood is 0.46.
What is the Total Population of Englewood?
Total Population of Englewood is 19,378.
What is the Total Male Population of Englewood?
Total Male Population of Englewood is 9,671.
What is the Total Female Population of Englewood?
Total Female Population of Englewood is 9,707.
What is the Ratio of Males per 100 Females in Englewood?
There are 99.63 Males per 100 Females in Englewood.
What is the Ratio of Females per 100 Males in Englewood?
There are 100.37 Females per 100 Males in Englewood.
What is the Median Population Age in Englewood?
Median Population Age in Englewood is 67.8 Years.
What is the Average Family Size in Englewood
Average Family Size in Englewood is 2.4 People.
What is the Average Household Size in Englewood
Average Household Size in Englewood is 1.9 People.
How Large is the Labor Force in Englewood?
There are 5,720 People in the Labor Forcein in Englewood.
What is the Percentage of People in the Labor Force in Englewood?
31.2% of People are in the Labor Force in Englewood.
What is the Unemployment Rate in Englewood?
Unemployment Rate in Englewood is 4.6%.