North Palm Beach, FL Map & Demographics
North Palm Beach Map
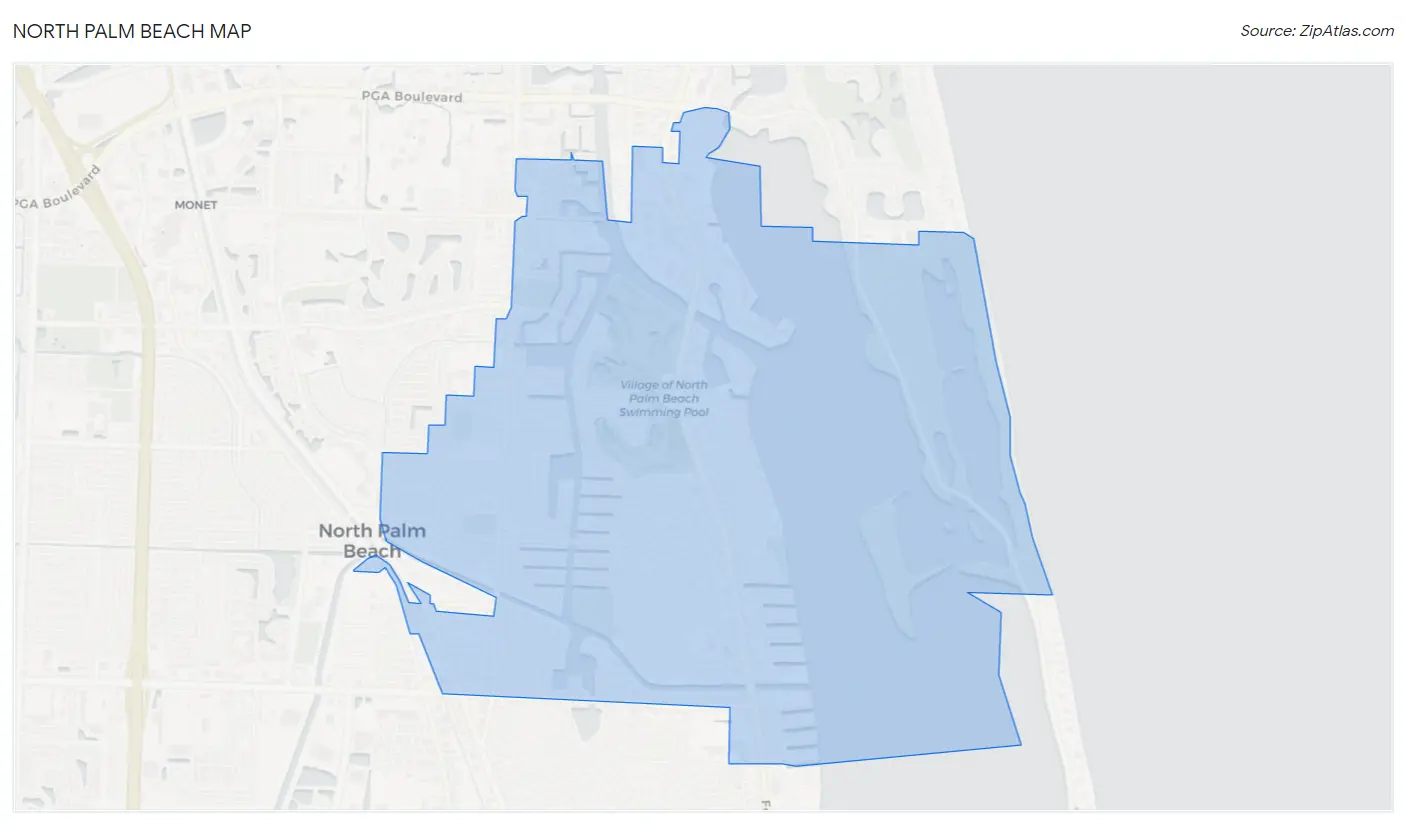
North Palm Beach Overview
$65,939
PER CAPITA INCOME
$127,204
AVG FAMILY INCOME
$89,175
AVG HOUSEHOLD INCOME
28.0%
WAGE / INCOME GAP [ % ]
72.0¢/ $1
WAGE / INCOME GAP [ $ ]
0.49
INEQUALITY / GINI INDEX
13,092
TOTAL POPULATION
6,516
MALE POPULATION
6,576
FEMALE POPULATION
99.09
MALES / 100 FEMALES
100.92
FEMALES / 100 MALES
56.1
MEDIAN AGE
2.8
AVG FAMILY SIZE
2.0
AVG HOUSEHOLD SIZE
6,186
LABOR FORCE [ PEOPLE ]
53.0%
PERCENT IN LABOR FORCE
1.9%
UNEMPLOYMENT RATE
North Palm Beach Zip Codes
North Palm Beach Area Codes
Income in North Palm Beach
Income Overview in North Palm Beach
Per Capita Income in North Palm Beach is $65,939, while median incomes of families and households are $127,204 and $89,175 respectively.
| Characteristic | Number | Measure |
| Per Capita Income | 13,092 | $65,939 |
| Median Family Income | 3,433 | $127,204 |
| Mean Family Income | 3,433 | $160,533 |
| Median Household Income | 6,363 | $89,175 |
| Mean Household Income | 6,363 | $132,537 |
| Income Deficit | 3,433 | $0 |
| Wage / Income Gap (%) | 13,092 | 27.96% |
| Wage / Income Gap ($) | 13,092 | 72.04¢ per $1 |
| Gini / Inequality Index | 13,092 | 0.49 |
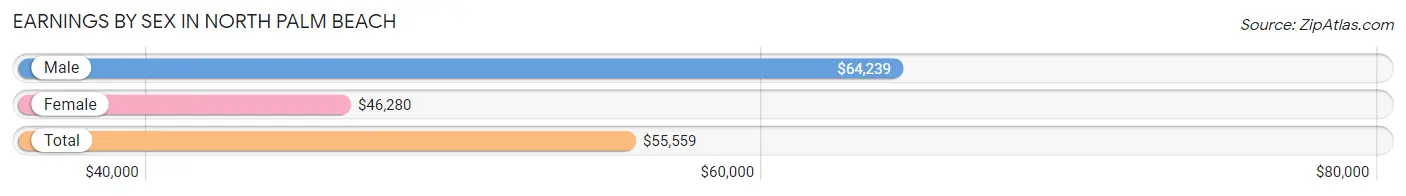
Earnings by Sex in North Palm Beach
Average Earnings in North Palm Beach are $55,559, $64,239 for men and $46,280 for women, a difference of 28.0%.
| Sex | Number | Average Earnings |
| Male | 3,470 (53.3%) | $64,239 |
| Female | 3,041 (46.7%) | $46,280 |
| Total | 6,511 (100.0%) | $55,559 |
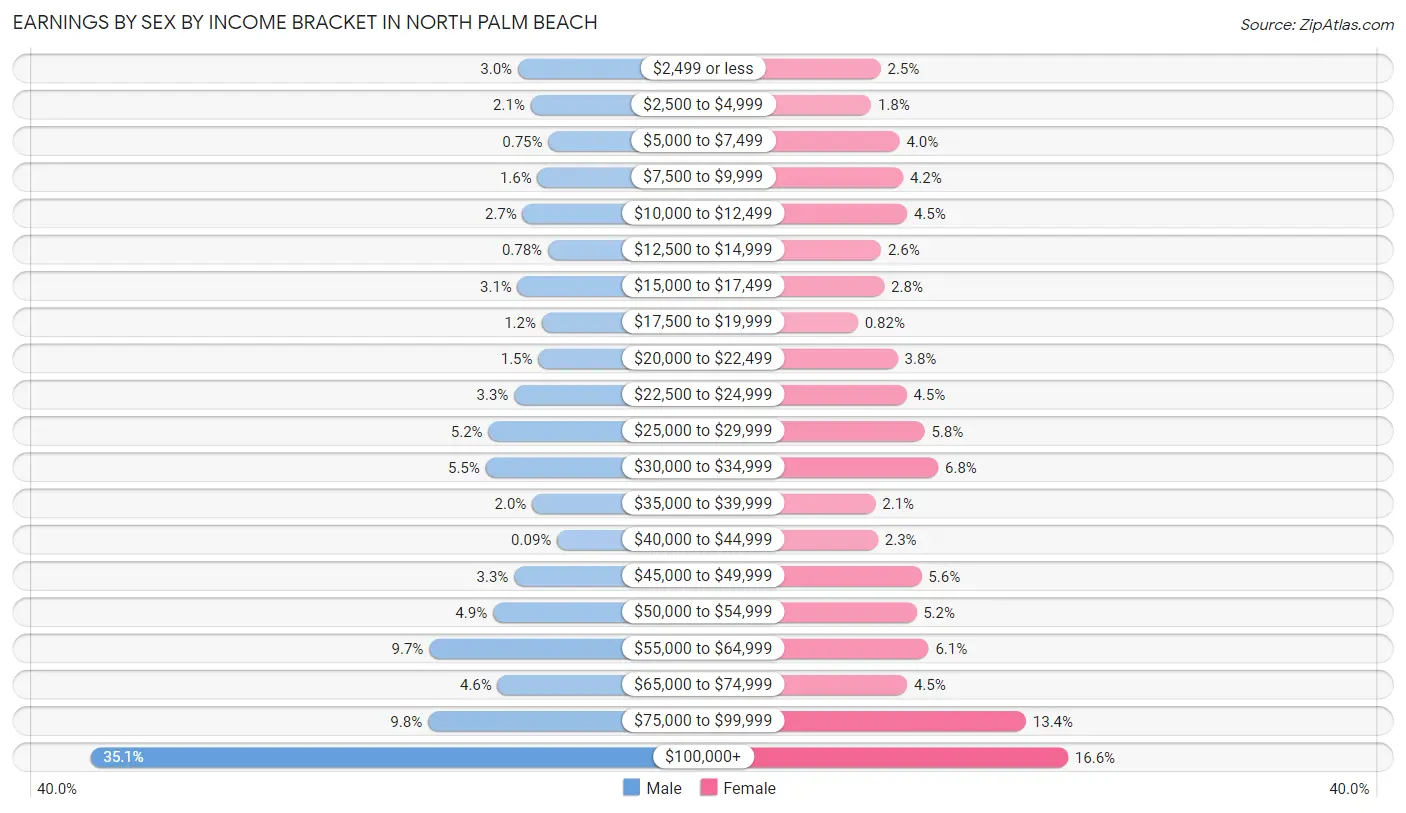
Earnings by Sex by Income Bracket in North Palm Beach
The most common earnings brackets in North Palm Beach are $100,000+ for men (1,217 | 35.1%) and $100,000+ for women (504 | 16.6%).
| Income | Male | Female |
| $2,499 or less | 105 (3.0%) | 77 (2.5%) |
| $2,500 to $4,999 | 72 (2.1%) | 55 (1.8%) |
| $5,000 to $7,499 | 26 (0.7%) | 120 (4.0%) |
| $7,500 to $9,999 | 54 (1.6%) | 128 (4.2%) |
| $10,000 to $12,499 | 93 (2.7%) | 137 (4.5%) |
| $12,500 to $14,999 | 27 (0.8%) | 78 (2.6%) |
| $15,000 to $17,499 | 106 (3.0%) | 85 (2.8%) |
| $17,500 to $19,999 | 43 (1.2%) | 25 (0.8%) |
| $20,000 to $22,499 | 52 (1.5%) | 116 (3.8%) |
| $22,500 to $24,999 | 115 (3.3%) | 136 (4.5%) |
| $25,000 to $29,999 | 182 (5.2%) | 177 (5.8%) |
| $30,000 to $34,999 | 189 (5.4%) | 208 (6.8%) |
| $35,000 to $39,999 | 68 (2.0%) | 65 (2.1%) |
| $40,000 to $44,999 | 3 (0.1%) | 71 (2.3%) |
| $45,000 to $49,999 | 115 (3.3%) | 170 (5.6%) |
| $50,000 to $54,999 | 170 (4.9%) | 158 (5.2%) |
| $55,000 to $64,999 | 336 (9.7%) | 186 (6.1%) |
| $65,000 to $74,999 | 158 (4.5%) | 137 (4.5%) |
| $75,000 to $99,999 | 339 (9.8%) | 408 (13.4%) |
| $100,000+ | 1,217 (35.1%) | 504 (16.6%) |
| Total | 3,470 (100.0%) | 3,041 (100.0%) |
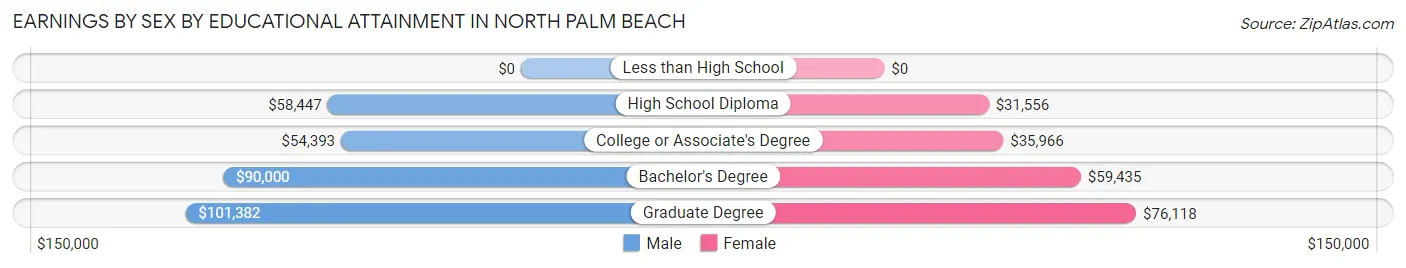
Earnings by Sex by Educational Attainment in North Palm Beach
Average earnings in North Palm Beach are $71,354 for men and $51,768 for women, a difference of 27.5%. Men with an educational attainment of graduate degree enjoy the highest average annual earnings of $101,382, while those with college or associate's degree education earn the least with $54,393. Women with an educational attainment of graduate degree earn the most with the average annual earnings of $76,118, while those with high school diploma education have the smallest earnings of $31,556.
| Educational Attainment | Male Income | Female Income |
| Less than High School | - | - |
| High School Diploma | $58,447 | $31,556 |
| College or Associate's Degree | $54,393 | $35,966 |
| Bachelor's Degree | $90,000 | $59,435 |
| Graduate Degree | $101,382 | $76,118 |
| Total | $71,354 | $51,768 |
Family Income in North Palm Beach
Family Income Brackets in North Palm Beach
According to the North Palm Beach family income data, there are 748 families falling into the $100,000 to $149,999 income range, which is the most common income bracket and makes up 21.8% of all families. Conversely, the $10,000 to $14,999 income bracket is the least frequent group with only 45 families (1.3%) belonging to this category.
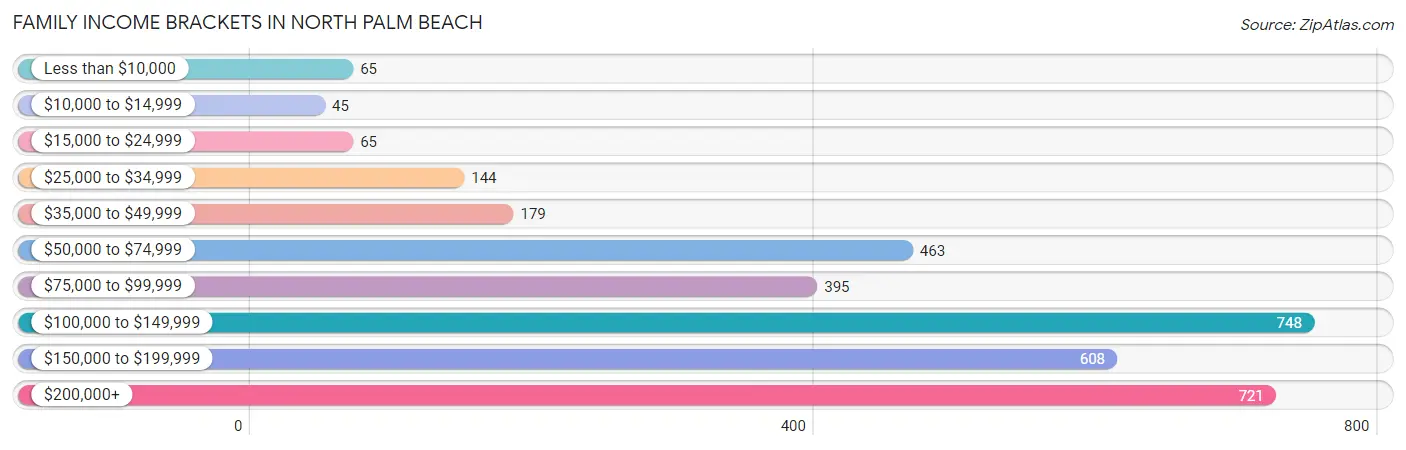
| Income Bracket | # Families | % Families |
| Less than $10,000 | 65 | 1.9% |
| $10,000 to $14,999 | 45 | 1.3% |
| $15,000 to $24,999 | 65 | 1.9% |
| $25,000 to $34,999 | 144 | 4.2% |
| $35,000 to $49,999 | 179 | 5.2% |
| $50,000 to $74,999 | 463 | 13.5% |
| $75,000 to $99,999 | 395 | 11.5% |
| $100,000 to $149,999 | 748 | 21.8% |
| $150,000 to $199,999 | 608 | 17.7% |
| $200,000+ | 721 | 21.0% |
Family Income by Famaliy Size in North Palm Beach
4-person families (309 | 9.0%) account for the highest median family income in North Palm Beach with $180,729 per family, while 2-person families (2,234 | 65.1%) have the highest median income of $54,688 per family member.
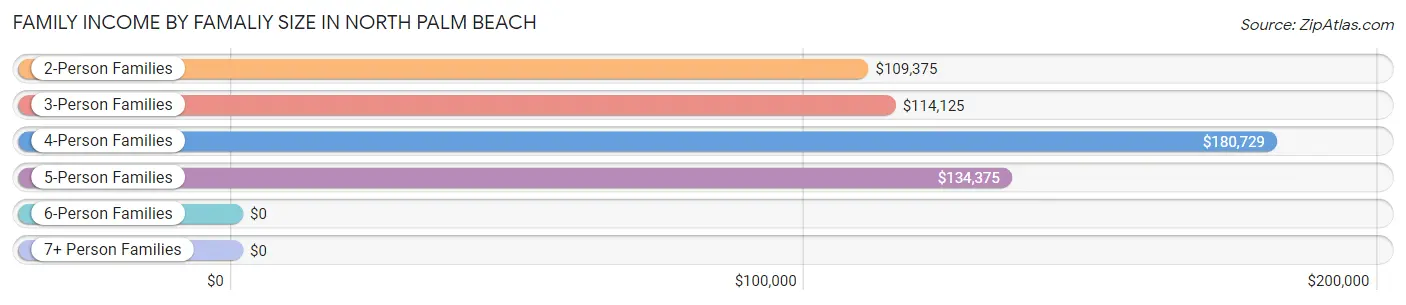
| Income Bracket | # Families | Median Income |
| 2-Person Families | 2,234 (65.1%) | $109,375 |
| 3-Person Families | 655 (19.1%) | $114,125 |
| 4-Person Families | 309 (9.0%) | $180,729 |
| 5-Person Families | 231 (6.7%) | $134,375 |
| 6-Person Families | 4 (0.1%) | $0 |
| 7+ Person Families | 0 (0.0%) | $0 |
| Total | 3,433 (100.0%) | $127,204 |
Family Income by Number of Earners in North Palm Beach
The median family income in North Palm Beach is $127,204, with families comprising 2 earners (1,406) having the highest median family income of $160,938, while families with no earners (1,051) have the lowest median family income of $87,664, accounting for 41.0% and 30.6% of families, respectively.
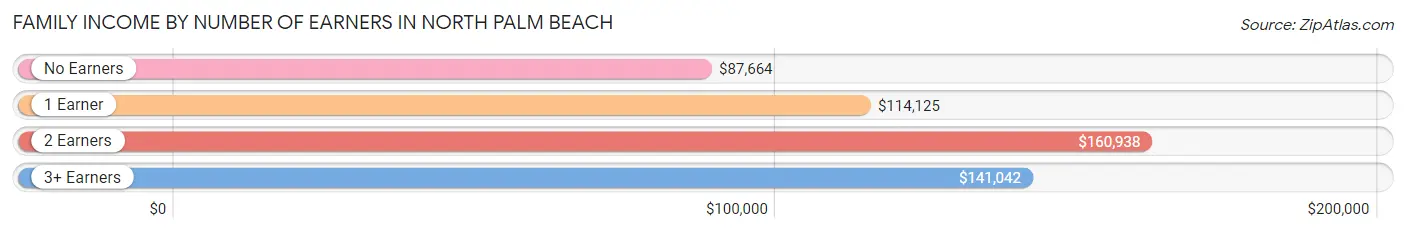
| Number of Earners | # Families | Median Income |
| No Earners | 1,051 (30.6%) | $87,664 |
| 1 Earner | 797 (23.2%) | $114,125 |
| 2 Earners | 1,406 (41.0%) | $160,938 |
| 3+ Earners | 179 (5.2%) | $141,042 |
| Total | 3,433 (100.0%) | $127,204 |
Household Income in North Palm Beach
Household Income Brackets in North Palm Beach
With 1,203 households falling in the category, the $100,000 to $149,999 income range is the most frequent in North Palm Beach, accounting for 18.9% of all households. In contrast, only 89 households (1.4%) fall into the $10,000 to $14,999 income bracket, making it the least populous group.
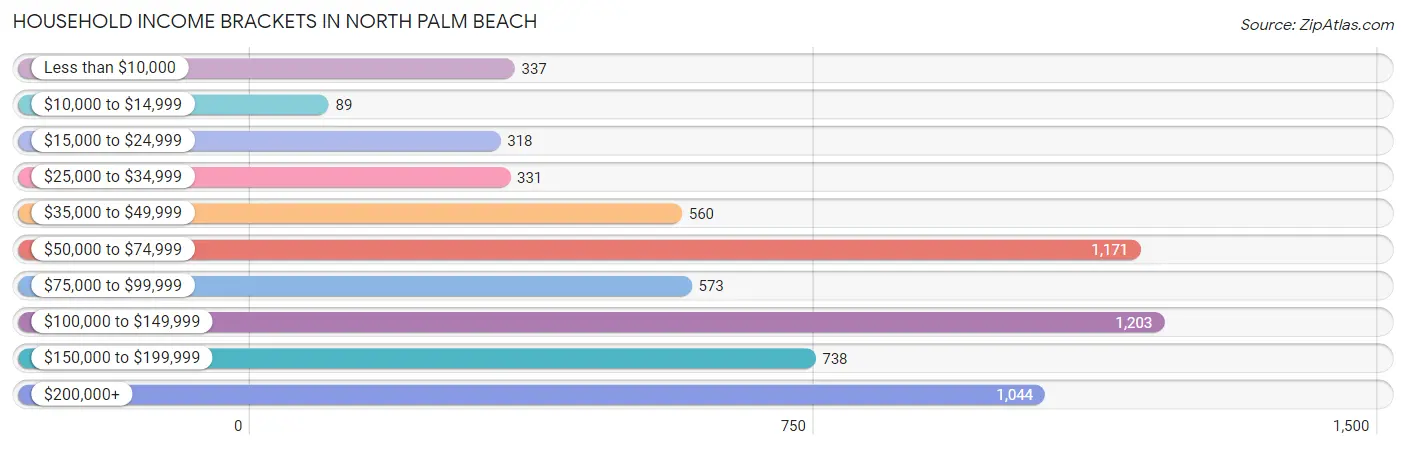
| Income Bracket | # Households | % Households |
| Less than $10,000 | 337 | 5.3% |
| $10,000 to $14,999 | 89 | 1.4% |
| $15,000 to $24,999 | 318 | 5.0% |
| $25,000 to $34,999 | 331 | 5.2% |
| $35,000 to $49,999 | 560 | 8.8% |
| $50,000 to $74,999 | 1,171 | 18.4% |
| $75,000 to $99,999 | 573 | 9.0% |
| $100,000 to $149,999 | 1,203 | 18.9% |
| $150,000 to $199,999 | 738 | 11.6% |
| $200,000+ | 1,044 | 16.4% |
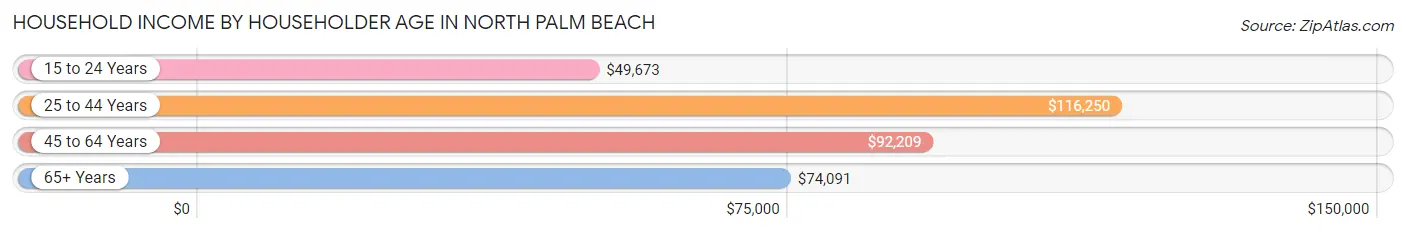
Household Income by Householder Age in North Palm Beach
The median household income in North Palm Beach is $89,175, with the highest median household income of $116,250 found in the 25 to 44 years age bracket for the primary householder. A total of 1,172 households (18.4%) fall into this category. Meanwhile, the 15 to 24 years age bracket for the primary householder has the lowest median household income of $49,673, with 141 households (2.2%) in this group.
| Income Bracket | # Households | Median Income |
| 15 to 24 Years | 141 (2.2%) | $49,673 |
| 25 to 44 Years | 1,172 (18.4%) | $116,250 |
| 45 to 64 Years | 2,318 (36.4%) | $92,209 |
| 65+ Years | 2,732 (42.9%) | $74,091 |
| Total | 6,363 (100.0%) | $89,175 |
Poverty in North Palm Beach
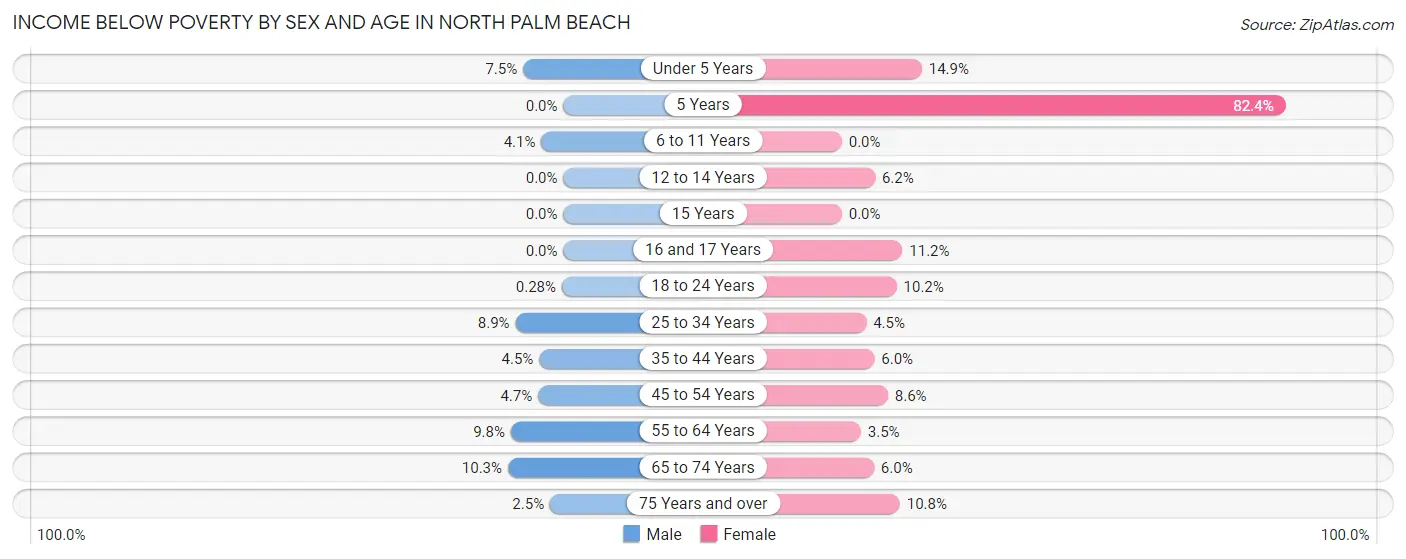
Income Below Poverty by Sex and Age in North Palm Beach
With 5.8% poverty level for males and 7.0% for females among the residents of North Palm Beach, 65 to 74 year old males and 5 year old females are the most vulnerable to poverty, with 95 males (10.3%) and 14 females (82.4%) in their respective age groups living below the poverty level.
| Age Bracket | Male | Female |
| Under 5 Years | 11 (7.5%) | 34 (14.8%) |
| 5 Years | 0 (0.0%) | 14 (82.4%) |
| 6 to 11 Years | 9 (4.1%) | 0 (0.0%) |
| 12 to 14 Years | 0 (0.0%) | 9 (6.2%) |
| 15 Years | 0 (0.0%) | 0 (0.0%) |
| 16 and 17 Years | 0 (0.0%) | 20 (11.2%) |
| 18 to 24 Years | 1 (0.3%) | 41 (10.2%) |
| 25 to 34 Years | 53 (8.9%) | 27 (4.5%) |
| 35 to 44 Years | 29 (4.5%) | 32 (6.0%) |
| 45 to 54 Years | 38 (4.7%) | 65 (8.6%) |
| 55 to 64 Years | 105 (9.8%) | 47 (3.5%) |
| 65 to 74 Years | 95 (10.3%) | 55 (6.0%) |
| 75 Years and over | 34 (2.5%) | 115 (10.8%) |
| Total | 375 (5.8%) | 459 (7.0%) |
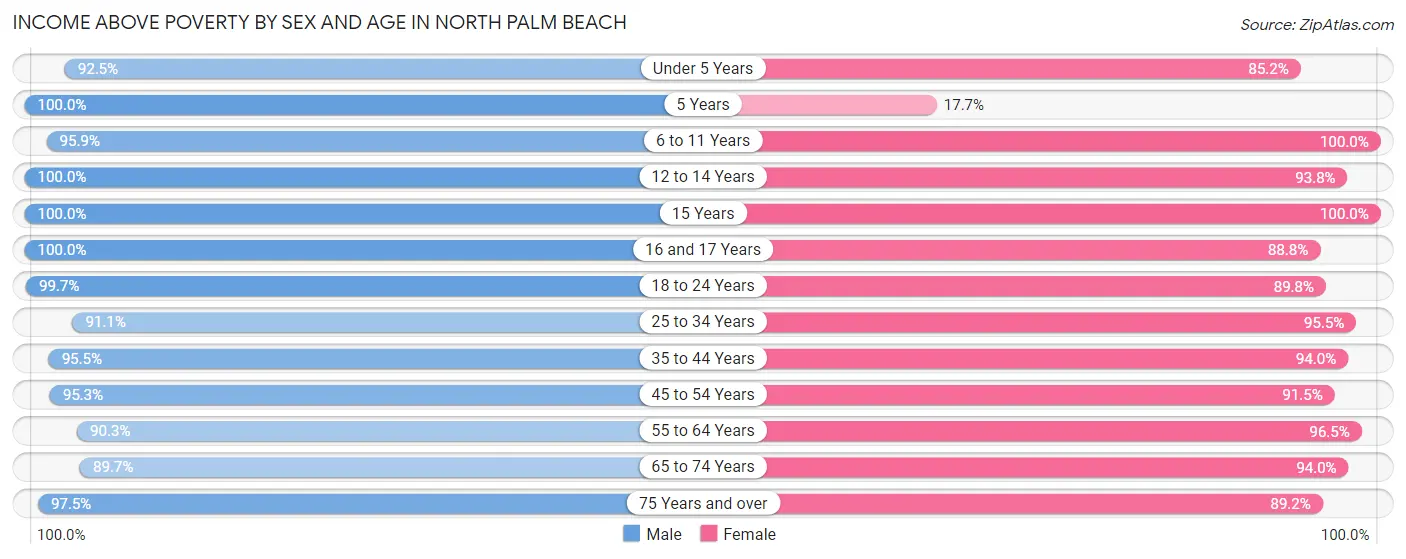
Income Above Poverty by Sex and Age in North Palm Beach
According to the poverty statistics in North Palm Beach, males aged 5 years and females aged 6 to 11 years are the age groups that are most secure financially, with 100.0% of males and 100.0% of females in these age groups living above the poverty line.
| Age Bracket | Male | Female |
| Under 5 Years | 136 (92.5%) | 195 (85.2%) |
| 5 Years | 62 (100.0%) | 3 (17.6%) |
| 6 to 11 Years | 211 (95.9%) | 373 (100.0%) |
| 12 to 14 Years | 147 (100.0%) | 137 (93.8%) |
| 15 Years | 56 (100.0%) | 23 (100.0%) |
| 16 and 17 Years | 96 (100.0%) | 158 (88.8%) |
| 18 to 24 Years | 360 (99.7%) | 362 (89.8%) |
| 25 to 34 Years | 543 (91.1%) | 569 (95.5%) |
| 35 to 44 Years | 617 (95.5%) | 498 (94.0%) |
| 45 to 54 Years | 773 (95.3%) | 695 (91.4%) |
| 55 to 64 Years | 972 (90.2%) | 1,282 (96.5%) |
| 65 to 74 Years | 827 (89.7%) | 868 (94.0%) |
| 75 Years and over | 1,339 (97.5%) | 953 (89.2%) |
| Total | 6,139 (94.2%) | 6,116 (93.0%) |
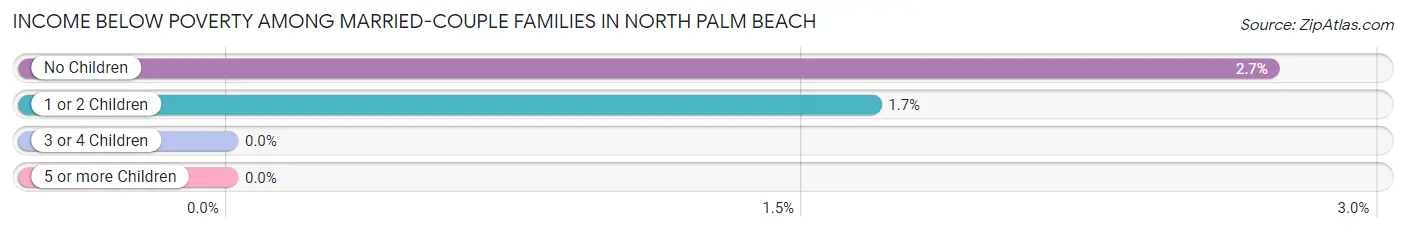
Income Below Poverty Among Married-Couple Families in North Palm Beach
The poverty statistics for married-couple families in North Palm Beach show that 2.4% or 67 of the total 2,818 families live below the poverty line. Families with no children have the highest poverty rate of 2.7%, comprising of 57 families. On the other hand, families with 3 or 4 children have the lowest poverty rate of 0.0%, which includes 0 families.
| Children | Above Poverty | Below Poverty |
| No Children | 2,035 (97.3%) | 57 (2.7%) |
| 1 or 2 Children | 585 (98.3%) | 10 (1.7%) |
| 3 or 4 Children | 131 (100.0%) | 0 (0.0%) |
| 5 or more Children | 0 (0.0%) | 0 (0.0%) |
| Total | 2,751 (97.6%) | 67 (2.4%) |
Income Below Poverty Among Single-Parent Households in North Palm Beach
According to the poverty data in North Palm Beach, 3.5% or 6 single-father households and 15.7% or 70 single-mother households are living below the poverty line. Among single-father households, those with no children have the highest poverty rate, with 6 households (7.1%) experiencing poverty. Likewise, among single-mother households, those with 1 or 2 children have the highest poverty rate, with 58 households (36.2%) falling below the poverty line.
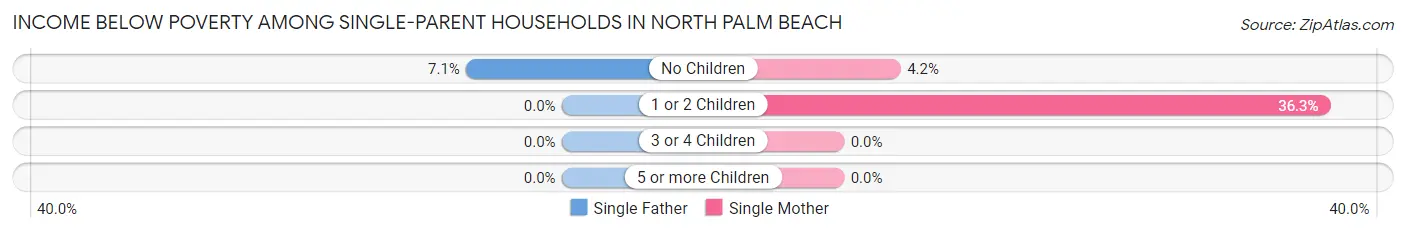
| Children | Single Father | Single Mother |
| No Children | 6 (7.1%) | 12 (4.2%) |
| 1 or 2 Children | 0 (0.0%) | 58 (36.2%) |
| 3 or 4 Children | 0 (0.0%) | 0 (0.0%) |
| 5 or more Children | 0 (0.0%) | 0 (0.0%) |
| Total | 6 (3.5%) | 70 (15.7%) |
Income Below Poverty Among Married-Couple vs Single-Parent Households in North Palm Beach
The poverty data for North Palm Beach shows that 67 of the married-couple family households (2.4%) and 76 of the single-parent households (12.4%) are living below the poverty level. Within the married-couple family households, those with no children have the highest poverty rate, with 57 households (2.7%) falling below the poverty line. Among the single-parent households, those with 1 or 2 children have the highest poverty rate, with 58 household (26.2%) living below poverty.
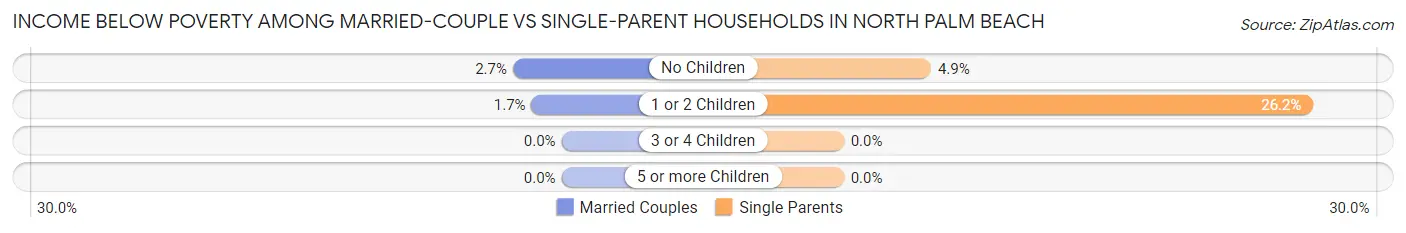
| Children | Married-Couple Families | Single-Parent Households |
| No Children | 57 (2.7%) | 18 (4.9%) |
| 1 or 2 Children | 10 (1.7%) | 58 (26.2%) |
| 3 or 4 Children | 0 (0.0%) | 0 (0.0%) |
| 5 or more Children | 0 (0.0%) | 0 (0.0%) |
| Total | 67 (2.4%) | 76 (12.4%) |
Race in North Palm Beach
The most populous races in North Palm Beach are White / Caucasian (11,578 | 88.4%), Hispanic or Latino (1,338 | 10.2%), and Two or more Races (926 | 7.1%).
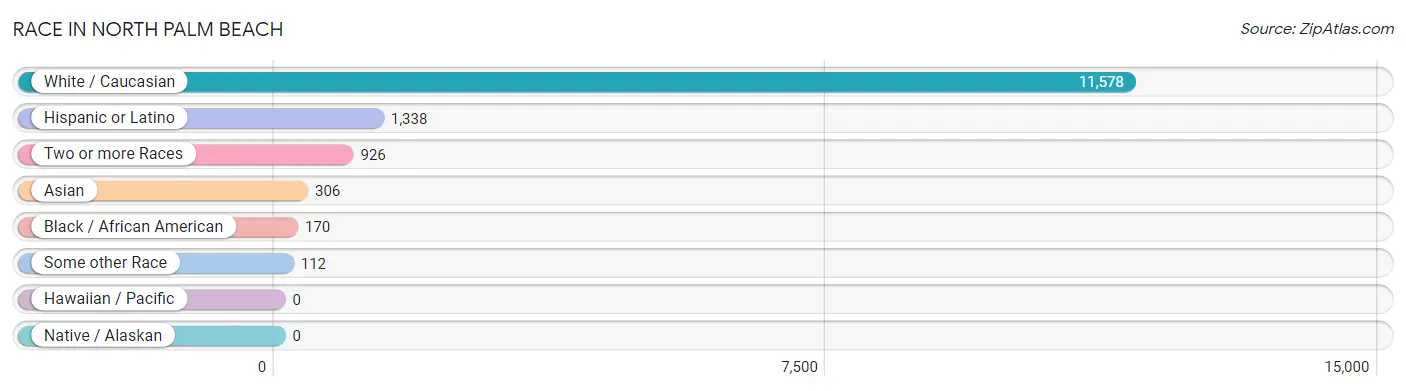
| Race | # Population | % Population |
| Asian | 306 | 2.3% |
| Black / African American | 170 | 1.3% |
| Hawaiian / Pacific | 0 | 0.0% |
| Hispanic or Latino | 1,338 | 10.2% |
| Native / Alaskan | 0 | 0.0% |
| White / Caucasian | 11,578 | 88.4% |
| Two or more Races | 926 | 7.1% |
| Some other Race | 112 | 0.9% |
| Total | 13,092 | 100.0% |
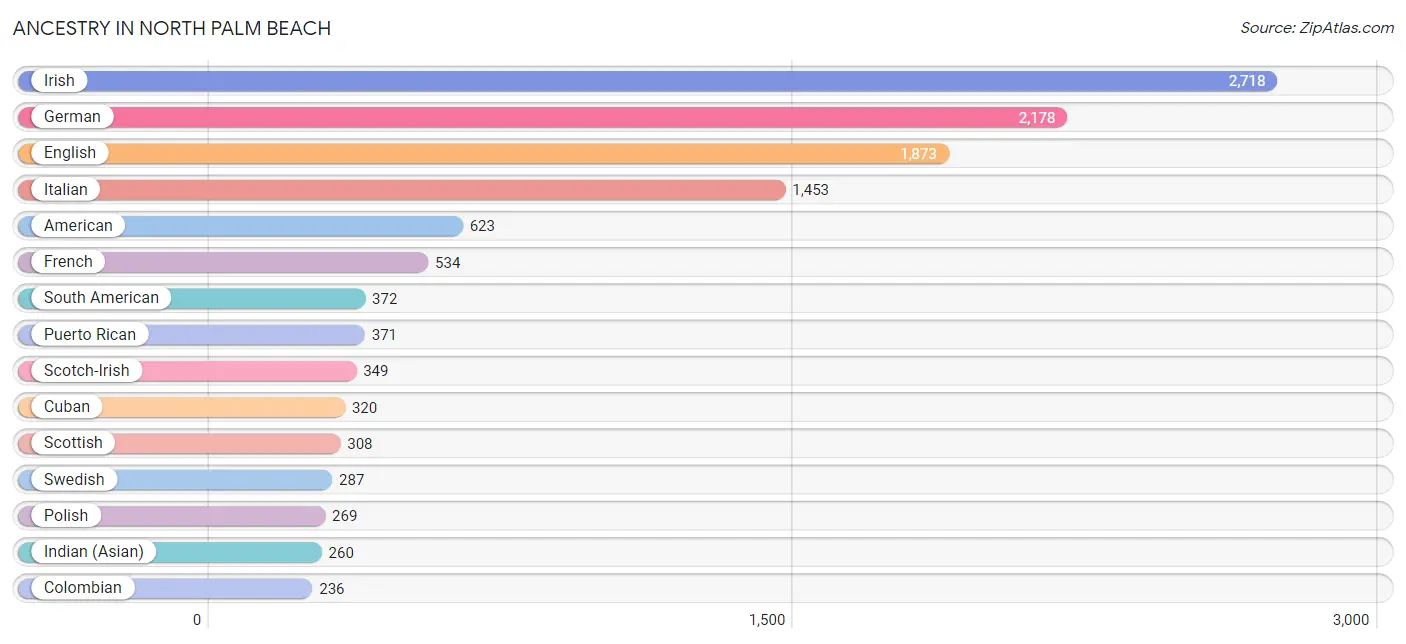
Ancestry in North Palm Beach
The most populous ancestries reported in North Palm Beach are Irish (2,718 | 20.8%), German (2,178 | 16.6%), English (1,873 | 14.3%), Italian (1,453 | 11.1%), and American (623 | 4.8%), together accounting for 67.6% of all North Palm Beach residents.
| Ancestry | # Population | % Population |
| American | 623 | 4.8% |
| Arab | 69 | 0.5% |
| Australian | 24 | 0.2% |
| Austrian | 13 | 0.1% |
| Barbadian | 50 | 0.4% |
| Brazilian | 32 | 0.2% |
| British | 172 | 1.3% |
| Canadian | 28 | 0.2% |
| Central American | 165 | 1.3% |
| Colombian | 236 | 1.8% |
| Costa Rican | 119 | 0.9% |
| Croatian | 39 | 0.3% |
| Cuban | 320 | 2.4% |
| Czech | 32 | 0.2% |
| Danish | 9 | 0.1% |
| Dutch | 216 | 1.7% |
| Eastern European | 217 | 1.7% |
| Ecuadorian | 15 | 0.1% |
| English | 1,873 | 14.3% |
| European | 216 | 1.7% |
| Filipino | 11 | 0.1% |
| Finnish | 120 | 0.9% |
| French | 534 | 4.1% |
| French Canadian | 113 | 0.9% |
| German | 2,178 | 16.6% |
| Greek | 118 | 0.9% |
| Guatemalan | 17 | 0.1% |
| Hungarian | 83 | 0.6% |
| Indian (Asian) | 260 | 2.0% |
| Irish | 2,718 | 20.8% |
| Italian | 1,453 | 11.1% |
| Jamaican | 36 | 0.3% |
| Korean | 13 | 0.1% |
| Lebanese | 56 | 0.4% |
| Lithuanian | 25 | 0.2% |
| Mexican | 83 | 0.6% |
| Moroccan | 13 | 0.1% |
| Native Hawaiian | 37 | 0.3% |
| Northern European | 9 | 0.1% |
| Norwegian | 217 | 1.7% |
| Panamanian | 29 | 0.2% |
| Peruvian | 72 | 0.5% |
| Polish | 269 | 2.1% |
| Portuguese | 117 | 0.9% |
| Puerto Rican | 371 | 2.8% |
| Romanian | 9 | 0.1% |
| Russian | 182 | 1.4% |
| Scandinavian | 36 | 0.3% |
| Scotch-Irish | 349 | 2.7% |
| Scottish | 308 | 2.4% |
| Slavic | 27 | 0.2% |
| Slovak | 23 | 0.2% |
| Slovene | 8 | 0.1% |
| South African | 105 | 0.8% |
| South American | 372 | 2.8% |
| Spanish | 27 | 0.2% |
| Sri Lankan | 88 | 0.7% |
| Subsaharan African | 115 | 0.9% |
| Swedish | 287 | 2.2% |
| Swiss | 29 | 0.2% |
| Thai | 33 | 0.3% |
| Turkish | 101 | 0.8% |
| Ukrainian | 29 | 0.2% |
| Venezuelan | 49 | 0.4% |
| Welsh | 135 | 1.0% |
| West Indian | 16 | 0.1% | View All 66 Rows |
Immigrants in North Palm Beach
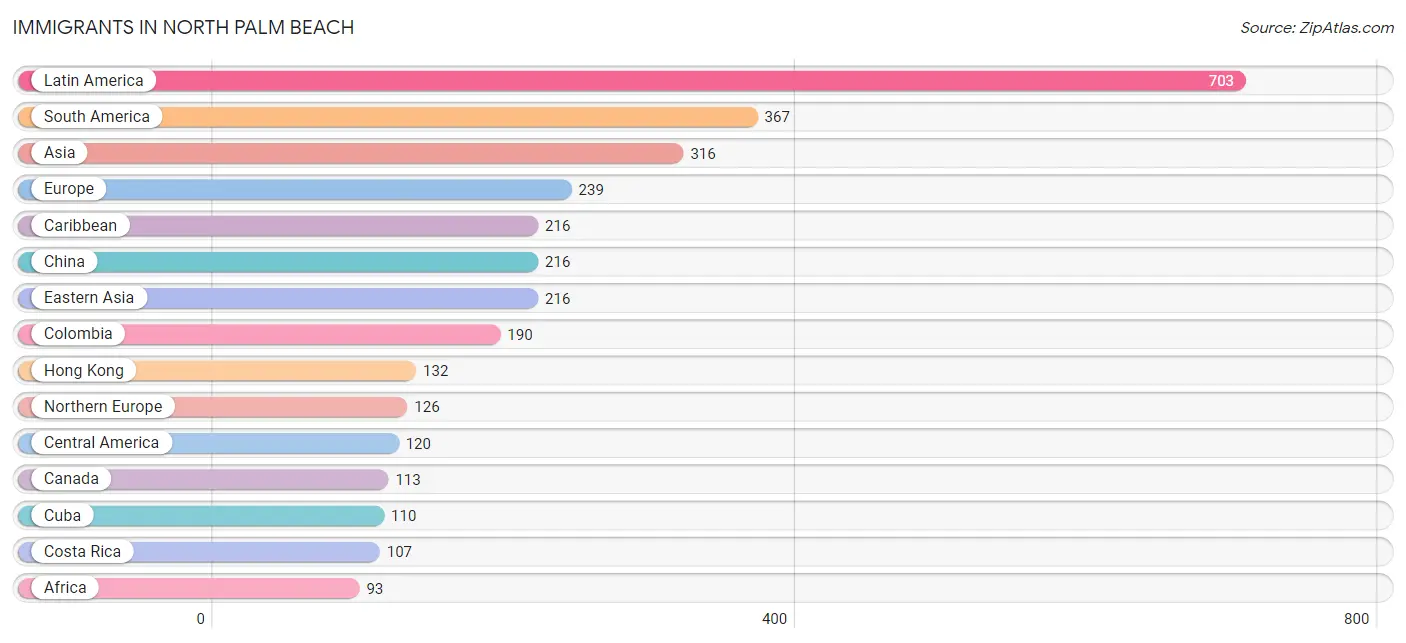
The most numerous immigrant groups reported in North Palm Beach came from Latin America (703 | 5.4%), South America (367 | 2.8%), Asia (316 | 2.4%), Europe (239 | 1.8%), and Caribbean (216 | 1.7%), together accounting for 14.1% of all North Palm Beach residents.
| Immigration Origin | # Population | % Population |
| Afghanistan | 4 | 0.0% |
| Africa | 93 | 0.7% |
| Asia | 316 | 2.4% |
| Australia | 24 | 0.2% |
| Barbados | 50 | 0.4% |
| Brazil | 65 | 0.5% |
| Canada | 113 | 0.9% |
| Caribbean | 216 | 1.7% |
| Central America | 120 | 0.9% |
| China | 216 | 1.7% |
| Colombia | 190 | 1.5% |
| Costa Rica | 107 | 0.8% |
| Cuba | 110 | 0.8% |
| Eastern Asia | 216 | 1.7% |
| Eastern Europe | 50 | 0.4% |
| Egypt | 15 | 0.1% |
| England | 73 | 0.6% |
| Europe | 239 | 1.8% |
| France | 12 | 0.1% |
| Germany | 19 | 0.2% |
| Hong Kong | 132 | 1.0% |
| Hungary | 11 | 0.1% |
| India | 12 | 0.1% |
| Ireland | 35 | 0.3% |
| Italy | 20 | 0.2% |
| Latin America | 703 | 5.4% |
| Mexico | 1 | 0.0% |
| North Macedonia | 19 | 0.2% |
| Northern Africa | 24 | 0.2% |
| Northern Europe | 126 | 1.0% |
| Oceania | 24 | 0.2% |
| Panama | 12 | 0.1% |
| Peru | 72 | 0.5% |
| Philippines | 13 | 0.1% |
| Portugal | 12 | 0.1% |
| Russia | 20 | 0.2% |
| South Africa | 61 | 0.5% |
| South America | 367 | 2.8% |
| South Central Asia | 16 | 0.1% |
| South Eastern Asia | 51 | 0.4% |
| Southern Europe | 32 | 0.2% |
| Taiwan | 19 | 0.2% |
| Turkey | 33 | 0.3% |
| Venezuela | 40 | 0.3% |
| Vietnam | 38 | 0.3% |
| Western Asia | 33 | 0.3% |
| Western Europe | 31 | 0.2% | View All 47 Rows |
Sex and Age in North Palm Beach
Sex and Age in North Palm Beach
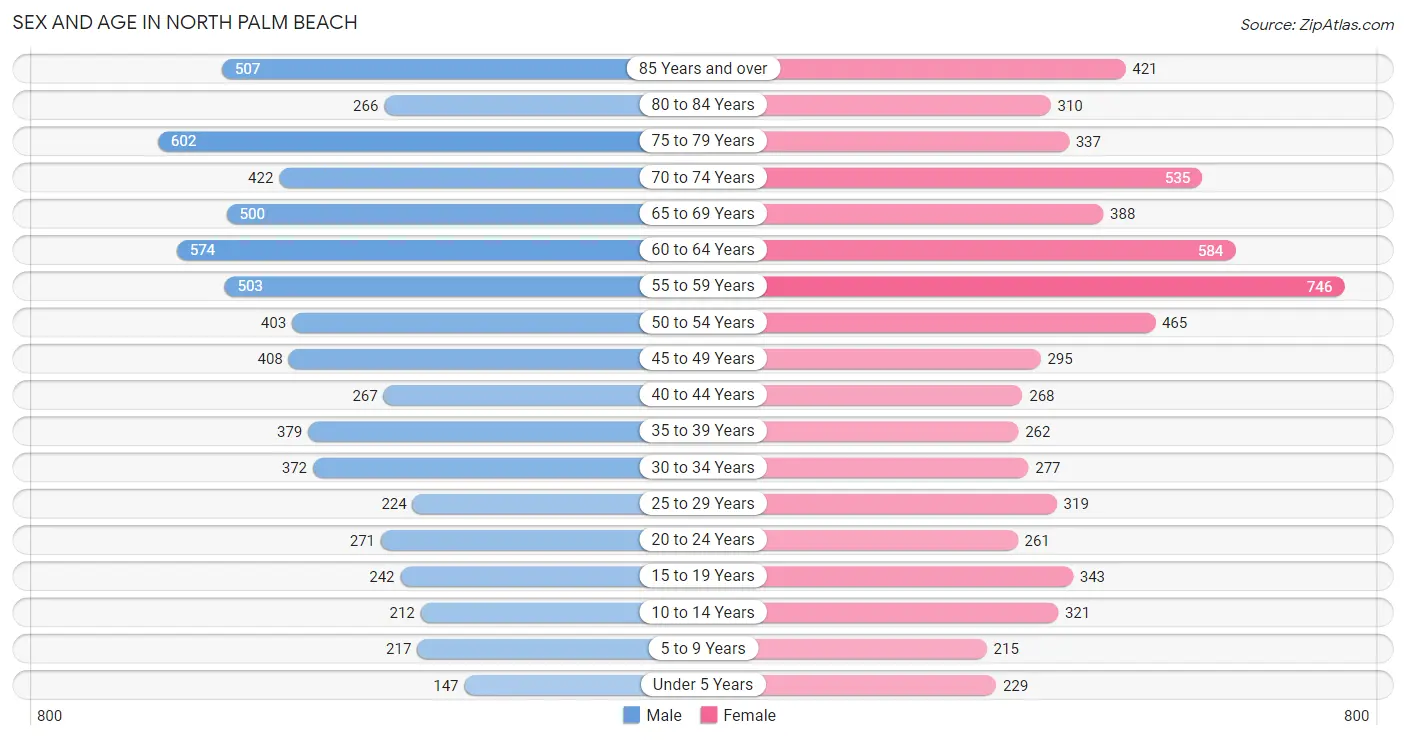
The most populous age groups in North Palm Beach are 75 to 79 Years (602 | 9.2%) for men and 55 to 59 Years (746 | 11.3%) for women.
| Age Bracket | Male | Female |
| Under 5 Years | 147 (2.3%) | 229 (3.5%) |
| 5 to 9 Years | 217 (3.3%) | 215 (3.3%) |
| 10 to 14 Years | 212 (3.3%) | 321 (4.9%) |
| 15 to 19 Years | 242 (3.7%) | 343 (5.2%) |
| 20 to 24 Years | 271 (4.2%) | 261 (4.0%) |
| 25 to 29 Years | 224 (3.4%) | 319 (4.9%) |
| 30 to 34 Years | 372 (5.7%) | 277 (4.2%) |
| 35 to 39 Years | 379 (5.8%) | 262 (4.0%) |
| 40 to 44 Years | 267 (4.1%) | 268 (4.1%) |
| 45 to 49 Years | 408 (6.3%) | 295 (4.5%) |
| 50 to 54 Years | 403 (6.2%) | 465 (7.1%) |
| 55 to 59 Years | 503 (7.7%) | 746 (11.3%) |
| 60 to 64 Years | 574 (8.8%) | 584 (8.9%) |
| 65 to 69 Years | 500 (7.7%) | 388 (5.9%) |
| 70 to 74 Years | 422 (6.5%) | 535 (8.1%) |
| 75 to 79 Years | 602 (9.2%) | 337 (5.1%) |
| 80 to 84 Years | 266 (4.1%) | 310 (4.7%) |
| 85 Years and over | 507 (7.8%) | 421 (6.4%) |
| Total | 6,516 (100.0%) | 6,576 (100.0%) |
Families and Households in North Palm Beach
Median Family Size in North Palm Beach
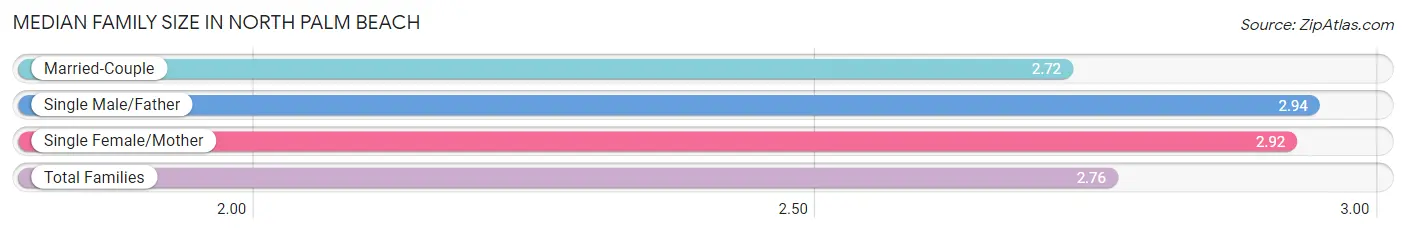
The median family size in North Palm Beach is 2.76 persons per family, with single male/father families (170 | 5.0%) accounting for the largest median family size of 2.94 persons per family. On the other hand, married-couple families (2,818 | 82.1%) represent the smallest median family size with 2.72 persons per family.
| Family Type | # Families | Family Size |
| Married-Couple | 2,818 (82.1%) | 2.72 |
| Single Male/Father | 170 (5.0%) | 2.94 |
| Single Female/Mother | 445 (13.0%) | 2.92 |
| Total Families | 3,433 (100.0%) | 2.76 |
Median Household Size in North Palm Beach
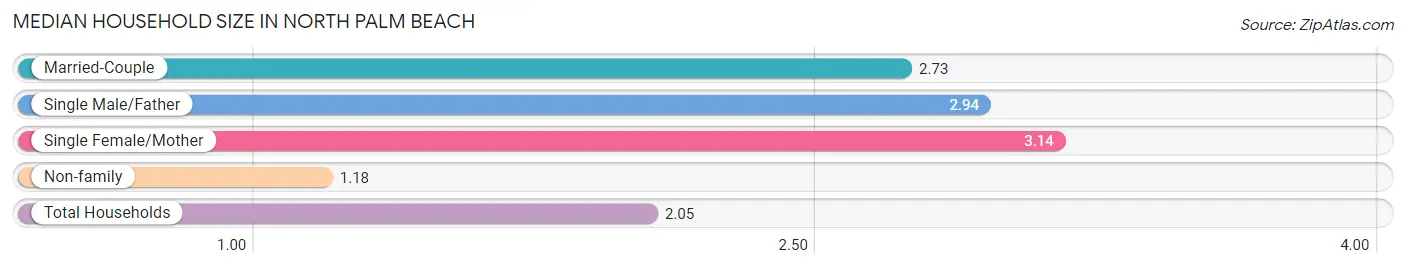
The median household size in North Palm Beach is 2.05 persons per household, with single female/mother households (445 | 7.0%) accounting for the largest median household size of 3.14 persons per household. non-family households (2,930 | 46.1%) represent the smallest median household size with 1.18 persons per household.
| Household Type | # Households | Household Size |
| Married-Couple | 2,818 (44.3%) | 2.73 |
| Single Male/Father | 170 (2.7%) | 2.94 |
| Single Female/Mother | 445 (7.0%) | 3.14 |
| Non-family | 2,930 (46.1%) | 1.18 |
| Total Households | 6,363 (100.0%) | 2.05 |
Household Size by Marriage Status in North Palm Beach
Out of a total of 6,363 households in North Palm Beach, 3,433 (53.9%) are family households, while 2,930 (46.1%) are nonfamily households. The most numerous type of family households are 2-person households, comprising 2,196, and the most common type of nonfamily households are 1-person households, comprising 2,442.
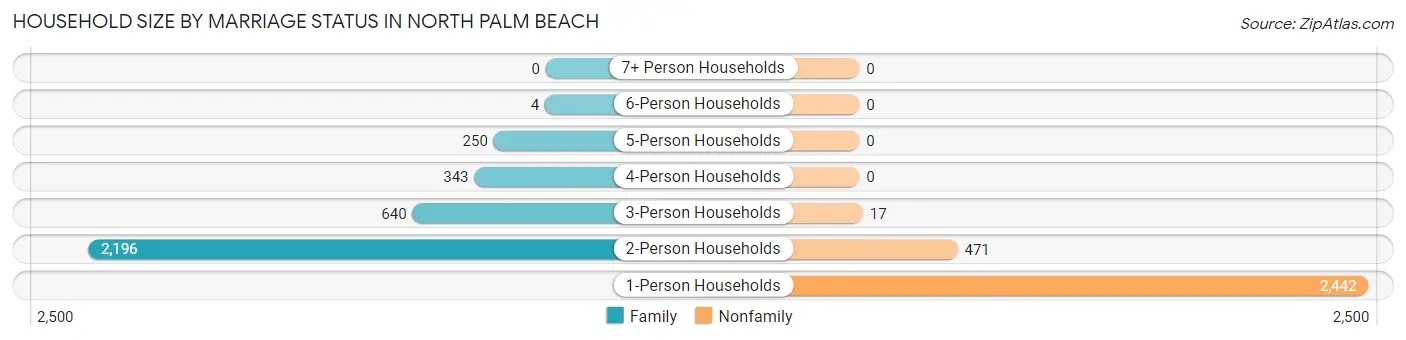
| Household Size | Family Households | Nonfamily Households |
| 1-Person Households | - | 2,442 (38.4%) |
| 2-Person Households | 2,196 (34.5%) | 471 (7.4%) |
| 3-Person Households | 640 (10.1%) | 17 (0.3%) |
| 4-Person Households | 343 (5.4%) | 0 (0.0%) |
| 5-Person Households | 250 (3.9%) | 0 (0.0%) |
| 6-Person Households | 4 (0.1%) | 0 (0.0%) |
| 7+ Person Households | 0 (0.0%) | 0 (0.0%) |
| Total | 3,433 (53.9%) | 2,930 (46.1%) |
Female Fertility in North Palm Beach
Fertility by Age in North Palm Beach
Average fertility rate in North Palm Beach is 37.0 births per 1,000 women. Women in the age bracket of 20 to 34 years have the highest fertility rate with 81.0 births per 1,000 women. Women in the age bracket of 20 to 34 years acount for 89.6% of all women with births.
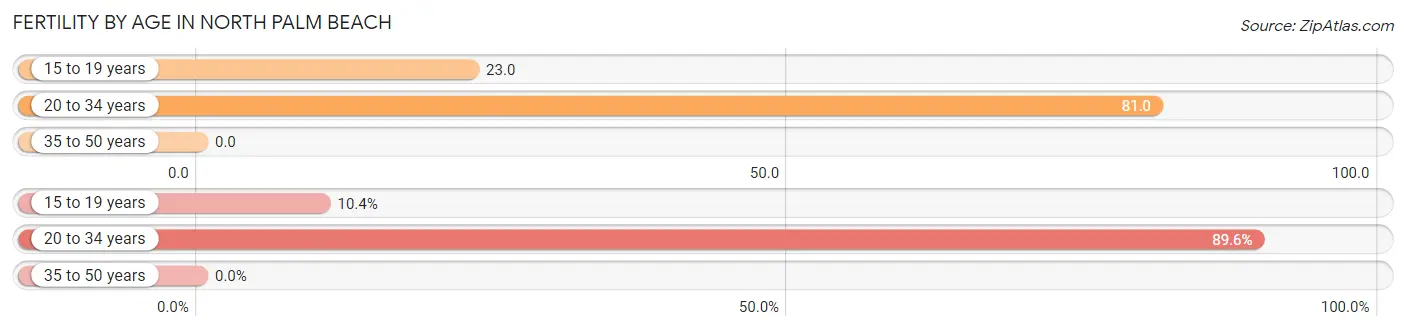
| Age Bracket | Women with Births | Births / 1,000 Women |
| 15 to 19 years | 8 (10.4%) | 23.0 |
| 20 to 34 years | 69 (89.6%) | 81.0 |
| 35 to 50 years | 0 (0.0%) | 0.0 |
| Total | 77 (100.0%) | 37.0 |
Fertility by Age by Marriage Status in North Palm Beach
68.8% of women with births (77) in North Palm Beach are married. The highest percentage of unmarried women with births falls into 15 to 19 years age bracket with 100.0% of them unmarried at the time of birth, while the lowest percentage of unmarried women with births belong to 20 to 34 years age bracket with 23.2% of them unmarried.
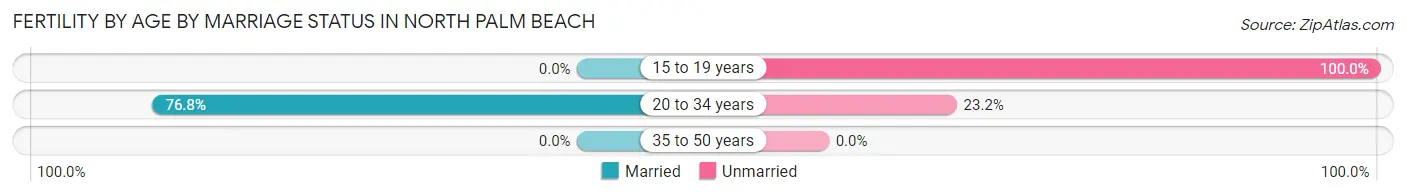
| Age Bracket | Married | Unmarried |
| 15 to 19 years | 0 (0.0%) | 8 (100.0%) |
| 20 to 34 years | 53 (76.8%) | 16 (23.2%) |
| 35 to 50 years | 0 (0.0%) | 0 (0.0%) |
| Total | 53 (68.8%) | 24 (31.2%) |
Fertility by Education in North Palm Beach
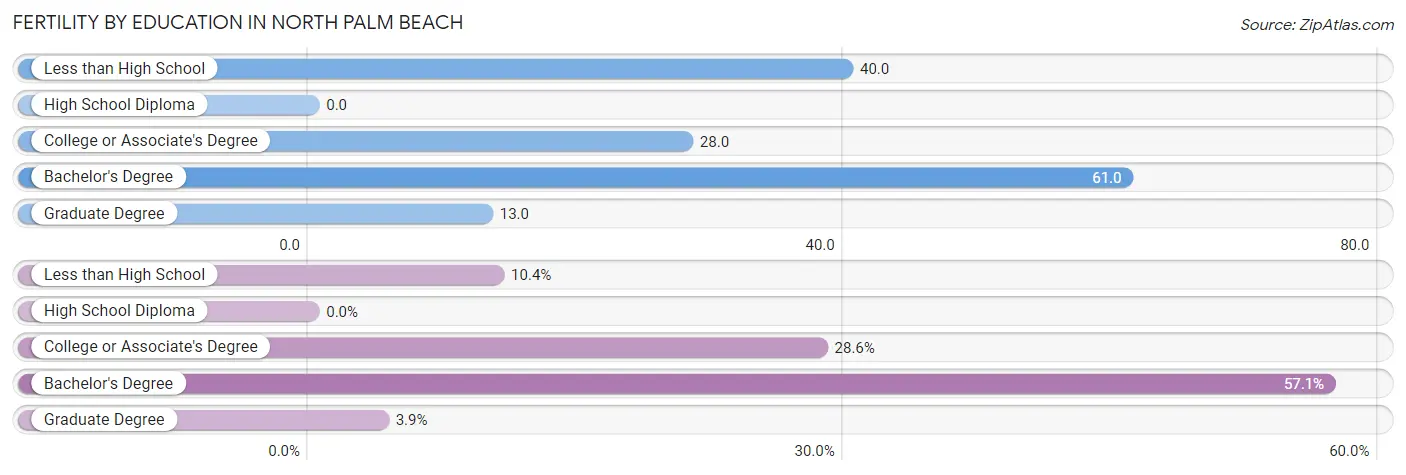
| Educational Attainment | Women with Births | Births / 1,000 Women |
| Less than High School | 8 (10.4%) | 40.0 |
| High School Diploma | 0 (0.0%) | 0.0 |
| College or Associate's Degree | 22 (28.6%) | 28.0 |
| Bachelor's Degree | 44 (57.1%) | 61.0 |
| Graduate Degree | 3 (3.9%) | 13.0 |
| Total | 77 (100.0%) | 37.0 |
Fertility by Education by Marriage Status in North Palm Beach
31.2% of women with births in North Palm Beach are unmarried. Women with the educational attainment of bachelor's degree are most likely to be married with 100.0% of them married at childbirth, while women with the educational attainment of less than high school are least likely to be married with 100.0% of them unmarried at childbirth.
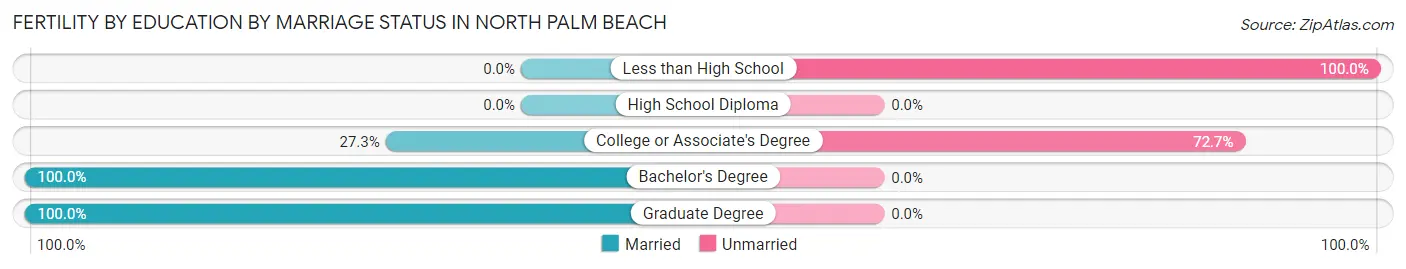
| Educational Attainment | Married | Unmarried |
| Less than High School | 0 (0.0%) | 8 (100.0%) |
| High School Diploma | 0 (0.0%) | 0 (0.0%) |
| College or Associate's Degree | 6 (27.3%) | 16 (72.7%) |
| Bachelor's Degree | 44 (100.0%) | 0 (0.0%) |
| Graduate Degree | 3 (100.0%) | 0 (0.0%) |
| Total | 53 (68.8%) | 24 (31.2%) |
Employment Characteristics in North Palm Beach
Employment by Class of Employer in North Palm Beach
Among the 5,962 employed individuals in North Palm Beach, private company employees (3,861 | 64.8%), self-employed (incorporated) (778 | 13.1%), and local government employees (444 | 7.4%) make up the most common classes of employment.
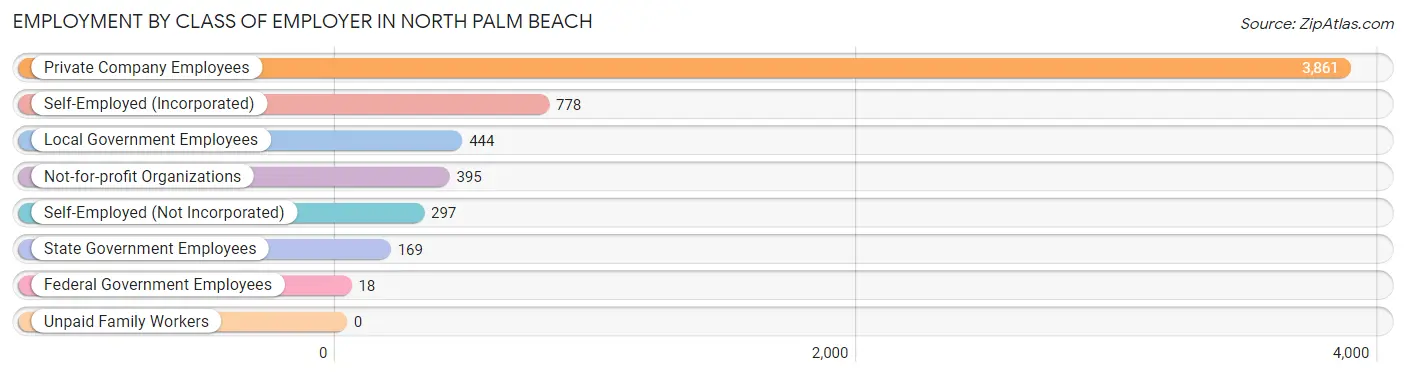
| Employer Class | # Employees | % Employees |
| Private Company Employees | 3,861 | 64.8% |
| Self-Employed (Incorporated) | 778 | 13.1% |
| Self-Employed (Not Incorporated) | 297 | 5.0% |
| Not-for-profit Organizations | 395 | 6.6% |
| Local Government Employees | 444 | 7.4% |
| State Government Employees | 169 | 2.8% |
| Federal Government Employees | 18 | 0.3% |
| Unpaid Family Workers | 0 | 0.0% |
| Total | 5,962 | 100.0% |
Employment Status by Age in North Palm Beach
According to the labor force statistics for North Palm Beach, out of the total population over 16 years of age (11,672), 53.0% or 6,186 individuals are in the labor force, with 1.9% or 118 of them unemployed. The age group with the highest labor force participation rate is 35 to 44 years, with 86.6% or 1,018 individuals in the labor force. Within the labor force, the 75 years and over age range has the highest percentage of unemployed individuals, with 9.3% or 10 of them being unemployed.
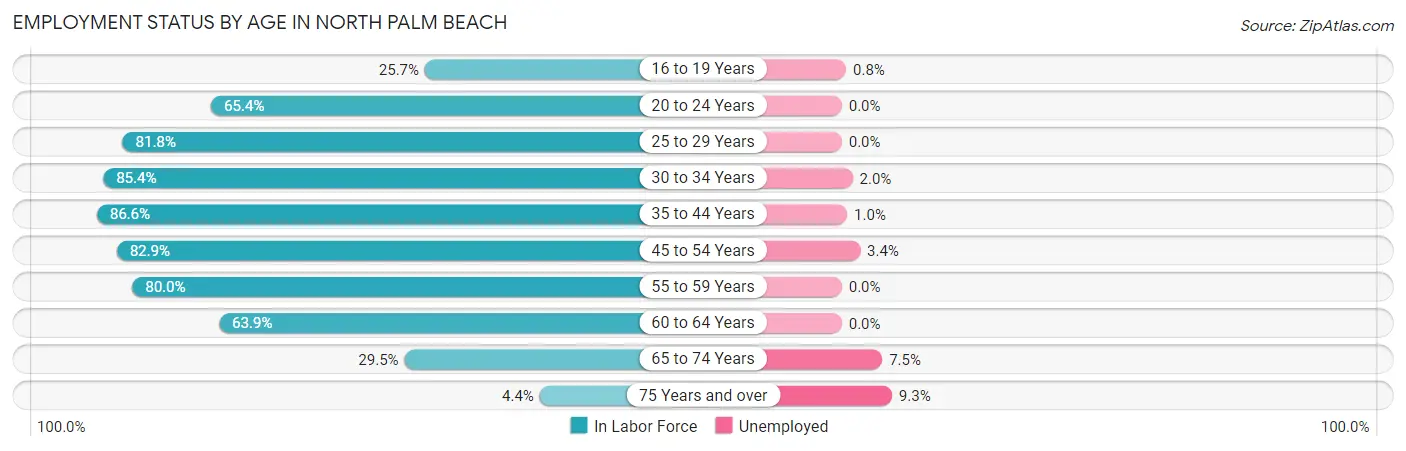
| Age Bracket | In Labor Force | Unemployed |
| 16 to 19 Years | 130 (25.7%) | 1 (0.8%) |
| 20 to 24 Years | 348 (65.4%) | 0 (0.0%) |
| 25 to 29 Years | 444 (81.8%) | 0 (0.0%) |
| 30 to 34 Years | 554 (85.4%) | 11 (2.0%) |
| 35 to 44 Years | 1,018 (86.6%) | 10 (1.0%) |
| 45 to 54 Years | 1,302 (82.9%) | 44 (3.4%) |
| 55 to 59 Years | 999 (80.0%) | 0 (0.0%) |
| 60 to 64 Years | 740 (63.9%) | 0 (0.0%) |
| 65 to 74 Years | 544 (29.5%) | 41 (7.5%) |
| 75 Years and over | 107 (4.4%) | 10 (9.3%) |
| Total | 6,186 (53.0%) | 118 (1.9%) |
Employment Status by Educational Attainment in North Palm Beach
According to labor force statistics for North Palm Beach, 79.7% of individuals (5,058) out of the total population between 25 and 64 years of age (6,346) are in the labor force, with 1.3% or 66 of them being unemployed. The group with the highest labor force participation rate are those with the educational attainment of less than high school, with 99.5% or 188 individuals in the labor force. Within the labor force, individuals with high school diploma education have the highest percentage of unemployment, with 5.1% or 35 of them being unemployed.
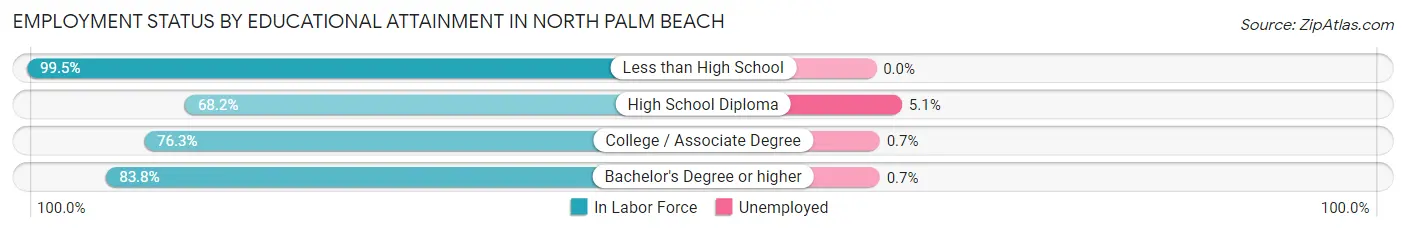
| Educational Attainment | In Labor Force | Unemployed |
| Less than High School | 188 (99.5%) | 0 (0.0%) |
| High School Diploma | 680 (68.2%) | 51 (5.1%) |
| College / Associate Degree | 1,344 (76.3%) | 12 (0.7%) |
| Bachelor's Degree or higher | 2,848 (83.8%) | 24 (0.7%) |
| Total | 5,058 (79.7%) | 82 (1.3%) |
Employment Occupations by Sex in North Palm Beach
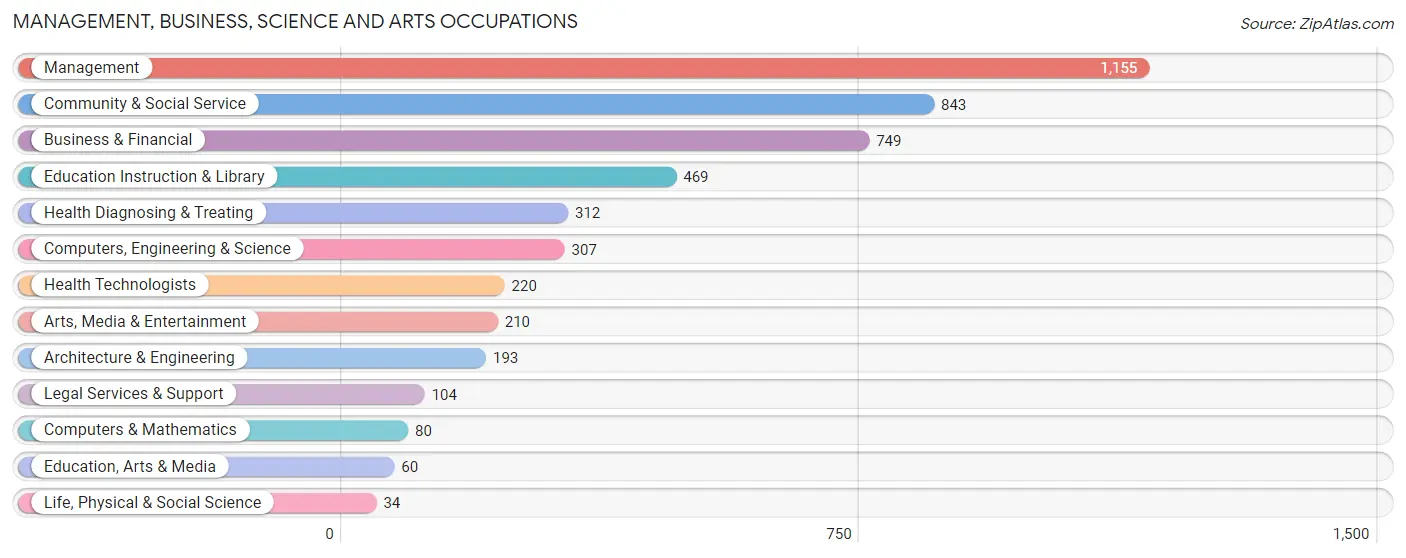
Management, Business, Science and Arts Occupations
The most common Management, Business, Science and Arts occupations in North Palm Beach are Management (1,155 | 19.0%), Community & Social Service (843 | 13.9%), Business & Financial (749 | 12.3%), Education Instruction & Library (469 | 7.7%), and Health Diagnosing & Treating (312 | 5.1%).
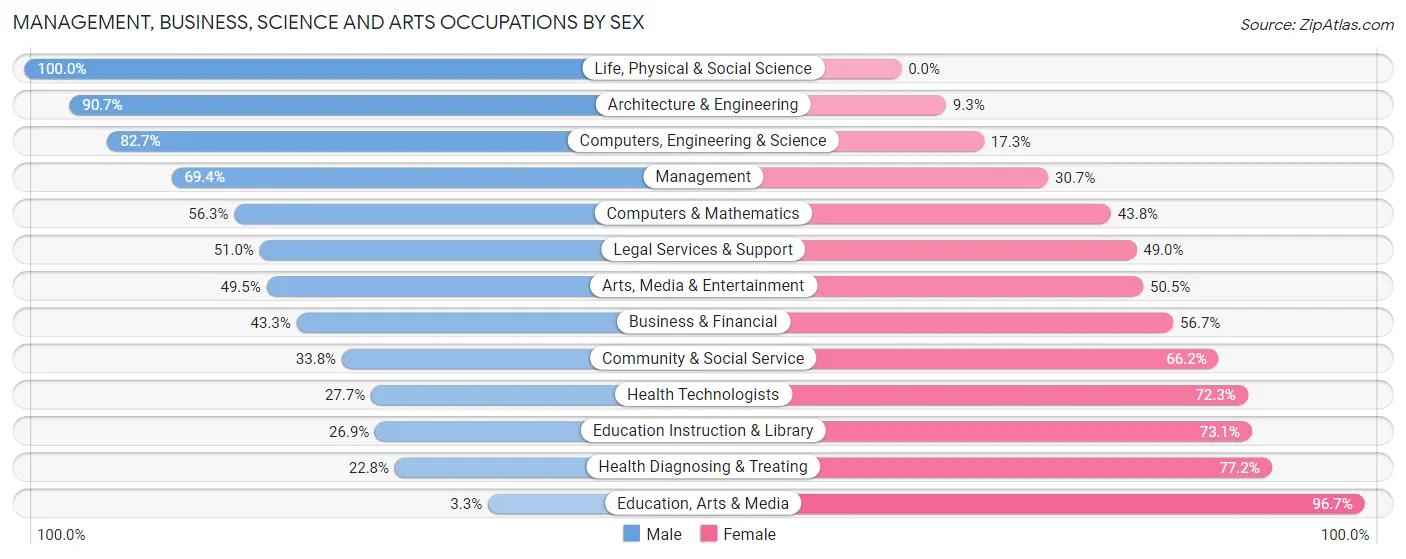
Management, Business, Science and Arts Occupations by Sex
Within the Management, Business, Science and Arts occupations in North Palm Beach, the most male-oriented occupations are Life, Physical & Social Science (100.0%), Architecture & Engineering (90.7%), and Computers, Engineering & Science (82.7%), while the most female-oriented occupations are Education, Arts & Media (96.7%), Health Diagnosing & Treating (77.2%), and Education Instruction & Library (73.1%).
| Occupation | Male | Female |
| Management | 801 (69.4%) | 354 (30.6%) |
| Business & Financial | 324 (43.3%) | 425 (56.7%) |
| Computers, Engineering & Science | 254 (82.7%) | 53 (17.3%) |
| Computers & Mathematics | 45 (56.2%) | 35 (43.8%) |
| Architecture & Engineering | 175 (90.7%) | 18 (9.3%) |
| Life, Physical & Social Science | 34 (100.0%) | 0 (0.0%) |
| Community & Social Service | 285 (33.8%) | 558 (66.2%) |
| Education, Arts & Media | 2 (3.3%) | 58 (96.7%) |
| Legal Services & Support | 53 (51.0%) | 51 (49.0%) |
| Education Instruction & Library | 126 (26.9%) | 343 (73.1%) |
| Arts, Media & Entertainment | 104 (49.5%) | 106 (50.5%) |
| Health Diagnosing & Treating | 71 (22.8%) | 241 (77.2%) |
| Health Technologists | 61 (27.7%) | 159 (72.3%) |
| Total (Category) | 1,735 (51.5%) | 1,631 (48.5%) |
| Total (Overall) | 3,203 (52.7%) | 2,869 (47.2%) |
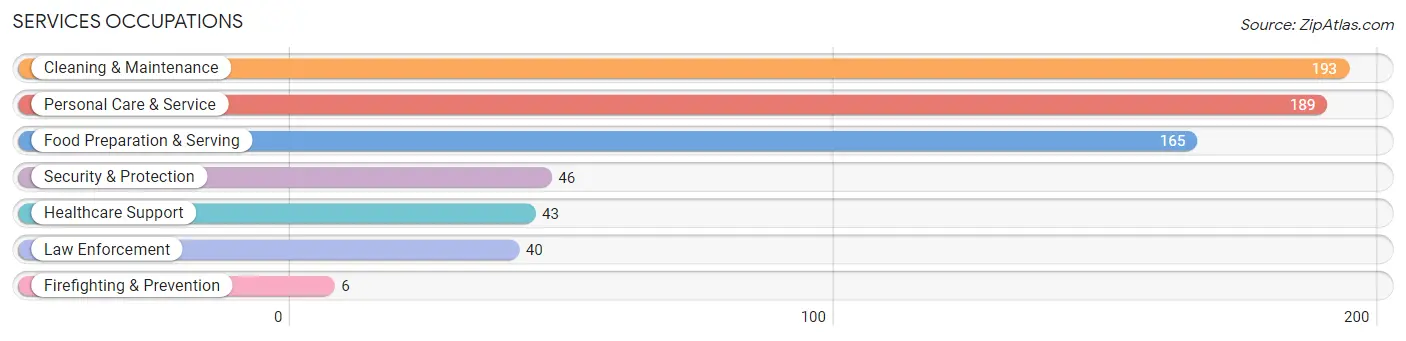
Services Occupations
The most common Services occupations in North Palm Beach are Cleaning & Maintenance (193 | 3.2%), Personal Care & Service (189 | 3.1%), Food Preparation & Serving (165 | 2.7%), Security & Protection (46 | 0.8%), and Healthcare Support (43 | 0.7%).
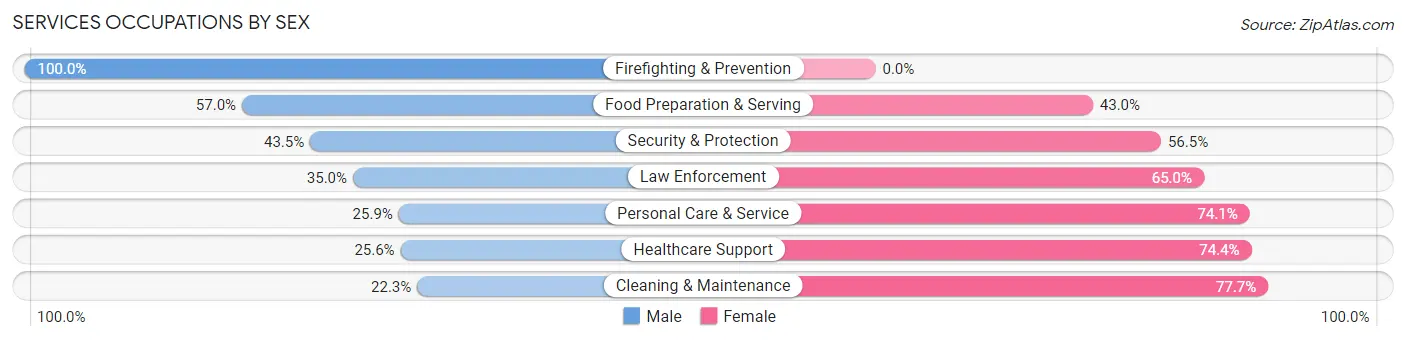
Services Occupations by Sex
Within the Services occupations in North Palm Beach, the most male-oriented occupations are Firefighting & Prevention (100.0%), Food Preparation & Serving (57.0%), and Security & Protection (43.5%), while the most female-oriented occupations are Cleaning & Maintenance (77.7%), Healthcare Support (74.4%), and Personal Care & Service (74.1%).
| Occupation | Male | Female |
| Healthcare Support | 11 (25.6%) | 32 (74.4%) |
| Security & Protection | 20 (43.5%) | 26 (56.5%) |
| Firefighting & Prevention | 6 (100.0%) | 0 (0.0%) |
| Law Enforcement | 14 (35.0%) | 26 (65.0%) |
| Food Preparation & Serving | 94 (57.0%) | 71 (43.0%) |
| Cleaning & Maintenance | 43 (22.3%) | 150 (77.7%) |
| Personal Care & Service | 49 (25.9%) | 140 (74.1%) |
| Total (Category) | 217 (34.1%) | 419 (65.9%) |
| Total (Overall) | 3,203 (52.7%) | 2,869 (47.2%) |
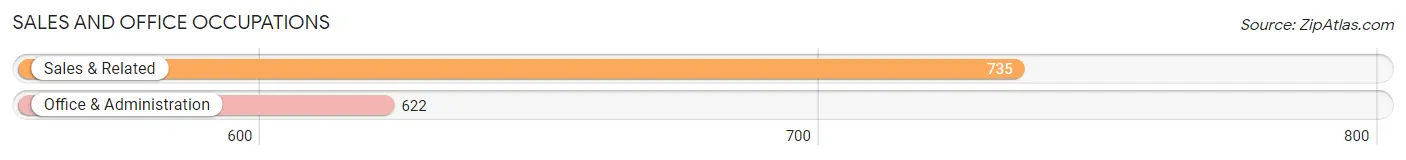
Sales and Office Occupations
The most common Sales and Office occupations in North Palm Beach are Sales & Related (735 | 12.1%), and Office & Administration (622 | 10.2%).
Sales and Office Occupations by Sex
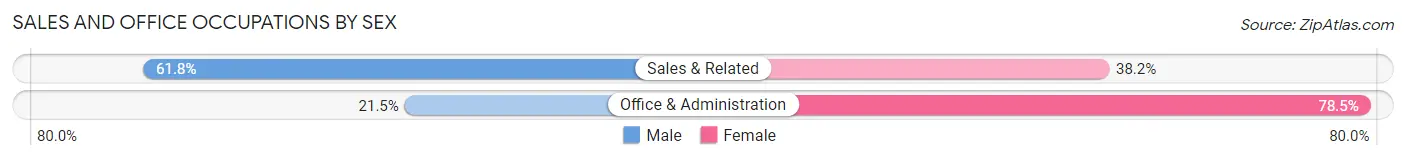
| Occupation | Male | Female |
| Sales & Related | 454 (61.8%) | 281 (38.2%) |
| Office & Administration | 134 (21.5%) | 488 (78.5%) |
| Total (Category) | 588 (43.3%) | 769 (56.7%) |
| Total (Overall) | 3,203 (52.7%) | 2,869 (47.2%) |
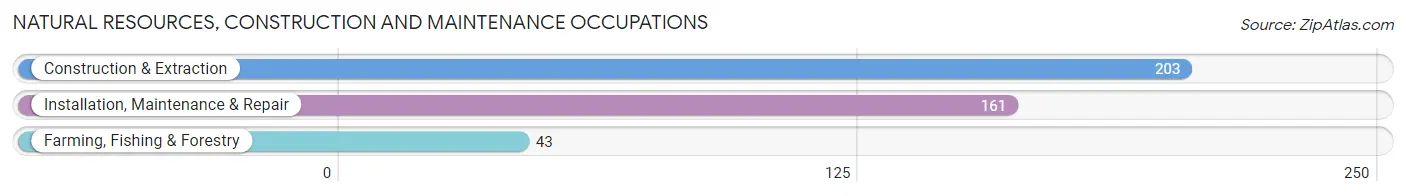
Natural Resources, Construction and Maintenance Occupations
The most common Natural Resources, Construction and Maintenance occupations in North Palm Beach are Construction & Extraction (203 | 3.3%), Installation, Maintenance & Repair (161 | 2.6%), and Farming, Fishing & Forestry (43 | 0.7%).
Natural Resources, Construction and Maintenance Occupations by Sex
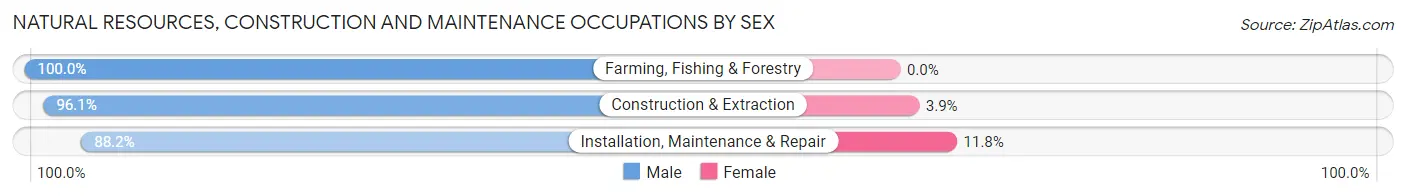
| Occupation | Male | Female |
| Farming, Fishing & Forestry | 43 (100.0%) | 0 (0.0%) |
| Construction & Extraction | 195 (96.1%) | 8 (3.9%) |
| Installation, Maintenance & Repair | 142 (88.2%) | 19 (11.8%) |
| Total (Category) | 380 (93.4%) | 27 (6.6%) |
| Total (Overall) | 3,203 (52.7%) | 2,869 (47.2%) |
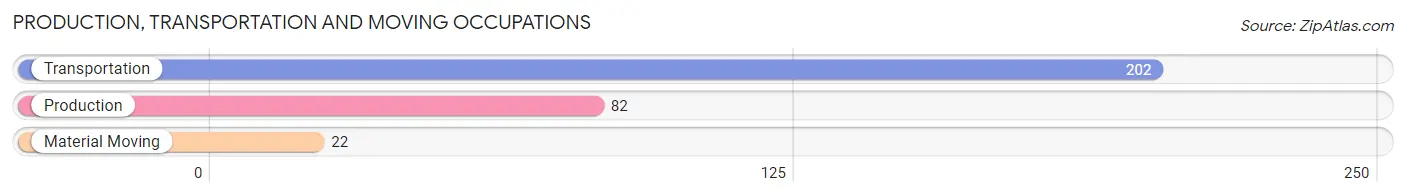
Production, Transportation and Moving Occupations
The most common Production, Transportation and Moving occupations in North Palm Beach are Transportation (202 | 3.3%), Production (82 | 1.3%), and Material Moving (22 | 0.4%).
Production, Transportation and Moving Occupations by Sex
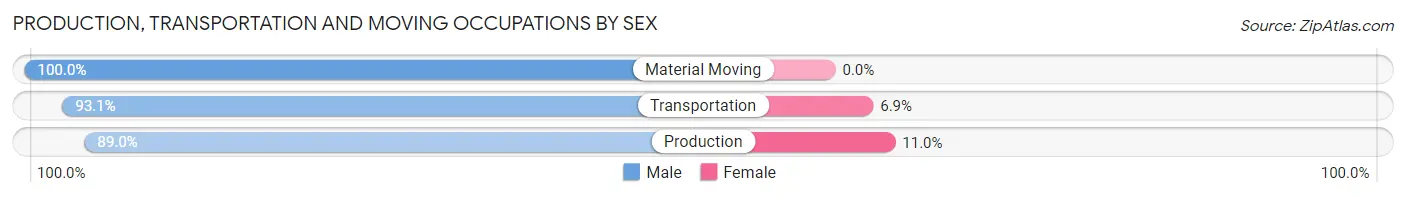
| Occupation | Male | Female |
| Production | 73 (89.0%) | 9 (11.0%) |
| Transportation | 188 (93.1%) | 14 (6.9%) |
| Material Moving | 22 (100.0%) | 0 (0.0%) |
| Total (Category) | 283 (92.5%) | 23 (7.5%) |
| Total (Overall) | 3,203 (52.7%) | 2,869 (47.2%) |
Employment Industries by Sex in North Palm Beach
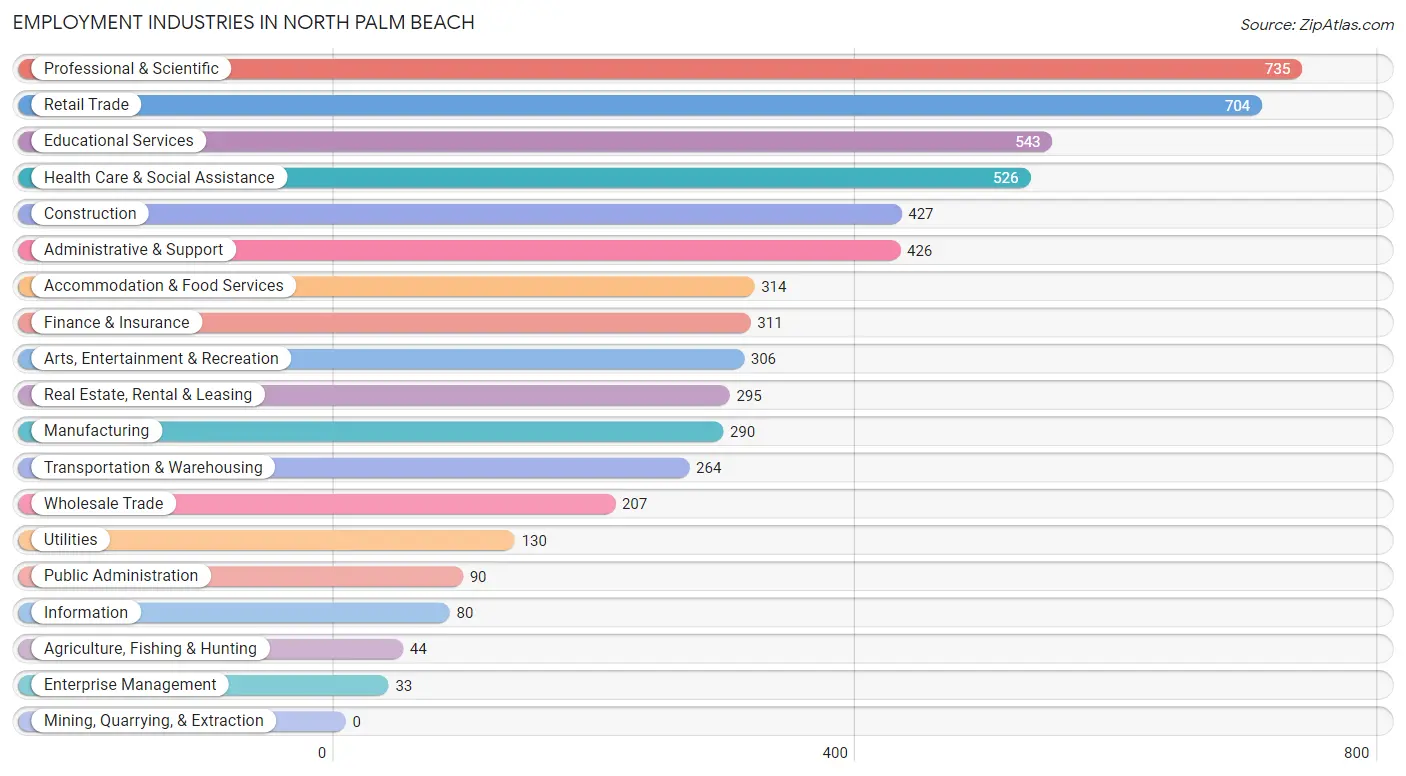
Employment Industries in North Palm Beach
The major employment industries in North Palm Beach include Professional & Scientific (735 | 12.1%), Retail Trade (704 | 11.6%), Educational Services (543 | 8.9%), Health Care & Social Assistance (526 | 8.7%), and Construction (427 | 7.0%).
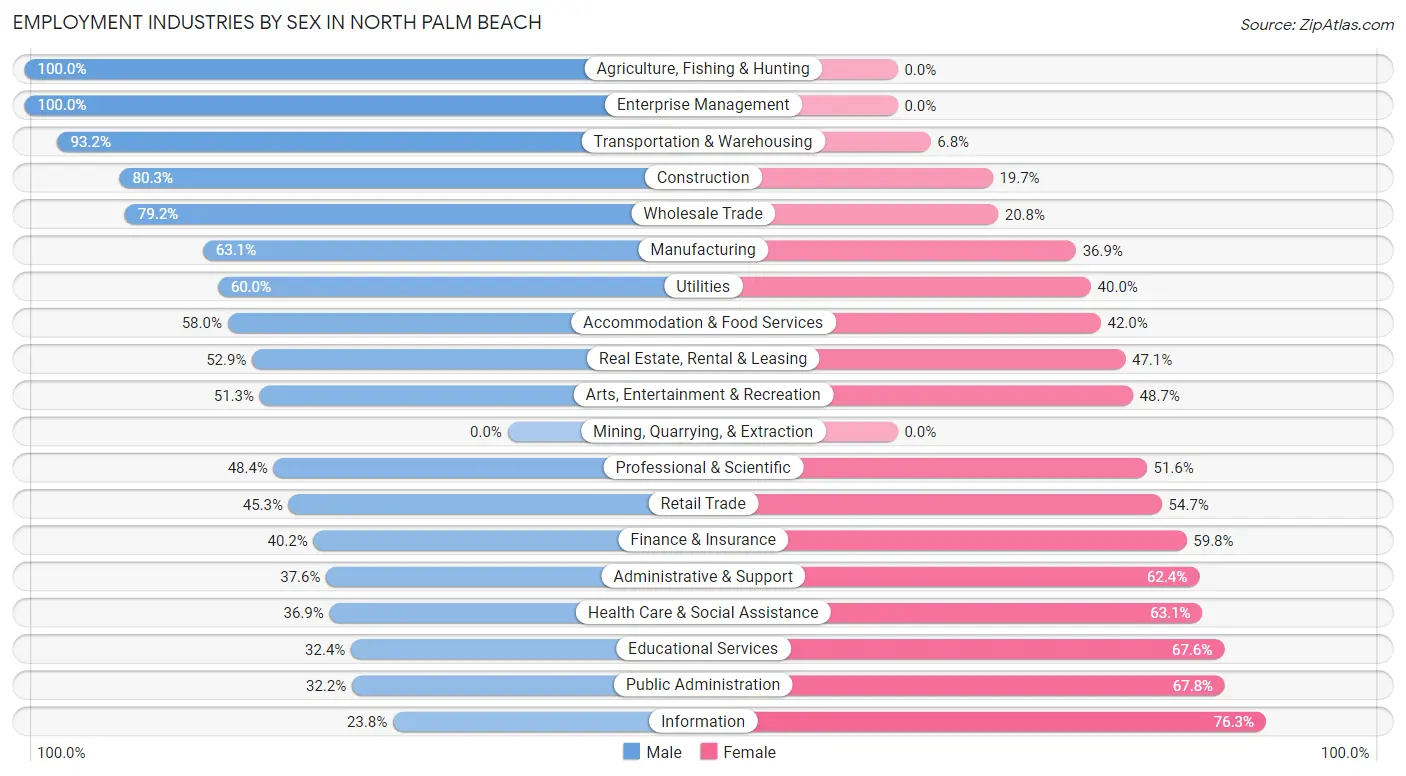
Employment Industries by Sex in North Palm Beach
The North Palm Beach industries that see more men than women are Agriculture, Fishing & Hunting (100.0%), Enterprise Management (100.0%), and Transportation & Warehousing (93.2%), whereas the industries that tend to have a higher number of women are Information (76.2%), Public Administration (67.8%), and Educational Services (67.6%).
| Industry | Male | Female |
| Agriculture, Fishing & Hunting | 44 (100.0%) | 0 (0.0%) |
| Mining, Quarrying, & Extraction | 0 (0.0%) | 0 (0.0%) |
| Construction | 343 (80.3%) | 84 (19.7%) |
| Manufacturing | 183 (63.1%) | 107 (36.9%) |
| Wholesale Trade | 164 (79.2%) | 43 (20.8%) |
| Retail Trade | 319 (45.3%) | 385 (54.7%) |
| Transportation & Warehousing | 246 (93.2%) | 18 (6.8%) |
| Utilities | 78 (60.0%) | 52 (40.0%) |
| Information | 19 (23.7%) | 61 (76.2%) |
| Finance & Insurance | 125 (40.2%) | 186 (59.8%) |
| Real Estate, Rental & Leasing | 156 (52.9%) | 139 (47.1%) |
| Professional & Scientific | 356 (48.4%) | 379 (51.6%) |
| Enterprise Management | 33 (100.0%) | 0 (0.0%) |
| Administrative & Support | 160 (37.6%) | 266 (62.4%) |
| Educational Services | 176 (32.4%) | 367 (67.6%) |
| Health Care & Social Assistance | 194 (36.9%) | 332 (63.1%) |
| Arts, Entertainment & Recreation | 157 (51.3%) | 149 (48.7%) |
| Accommodation & Food Services | 182 (58.0%) | 132 (42.0%) |
| Public Administration | 29 (32.2%) | 61 (67.8%) |
| Total | 3,203 (52.7%) | 2,869 (47.2%) |
Education in North Palm Beach
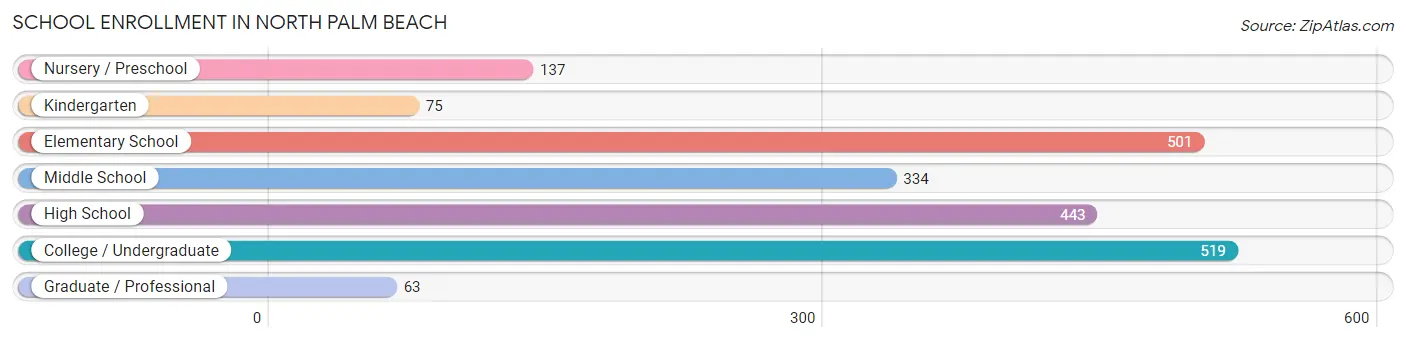
School Enrollment in North Palm Beach
The most common levels of schooling among the 2,072 students in North Palm Beach are college / undergraduate (519 | 25.1%), elementary school (501 | 24.2%), and high school (443 | 21.4%).
| School Level | # Students | % Students |
| Nursery / Preschool | 137 | 6.6% |
| Kindergarten | 75 | 3.6% |
| Elementary School | 501 | 24.2% |
| Middle School | 334 | 16.1% |
| High School | 443 | 21.4% |
| College / Undergraduate | 519 | 25.1% |
| Graduate / Professional | 63 | 3.0% |
| Total | 2,072 | 100.0% |
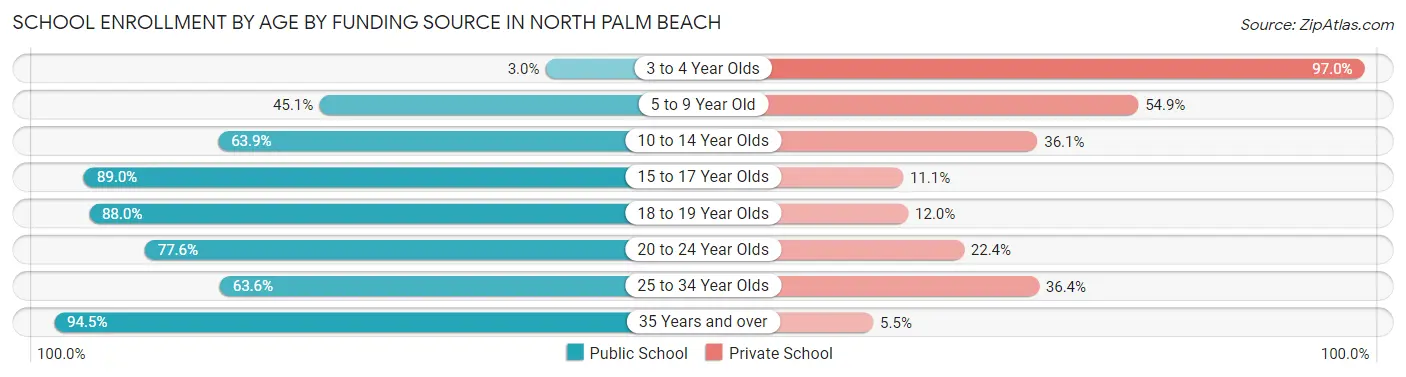
School Enrollment by Age by Funding Source in North Palm Beach
Out of a total of 2,072 students who are enrolled in schools in North Palm Beach, 721 (34.8%) attend a private institution, while the remaining 1,351 (65.2%) are enrolled in public schools. The age group of 3 to 4 year olds has the highest likelihood of being enrolled in private schools, with 129 (97.0% in the age bracket) enrolled. Conversely, the age group of 35 years and over has the lowest likelihood of being enrolled in a private school, with 86 (94.5% in the age bracket) attending a public institution.
| Age Bracket | Public School | Private School |
| 3 to 4 Year Olds | 4 (3.0%) | 129 (97.0%) |
| 5 to 9 Year Old | 195 (45.1%) | 237 (54.9%) |
| 10 to 14 Year Olds | 335 (63.9%) | 189 (36.1%) |
| 15 to 17 Year Olds | 314 (88.9%) | 39 (11.1%) |
| 18 to 19 Year Olds | 132 (88.0%) | 18 (12.0%) |
| 20 to 24 Year Olds | 208 (77.6%) | 60 (22.4%) |
| 25 to 34 Year Olds | 77 (63.6%) | 44 (36.4%) |
| 35 Years and over | 86 (94.5%) | 5 (5.5%) |
| Total | 1,351 (65.2%) | 721 (34.8%) |
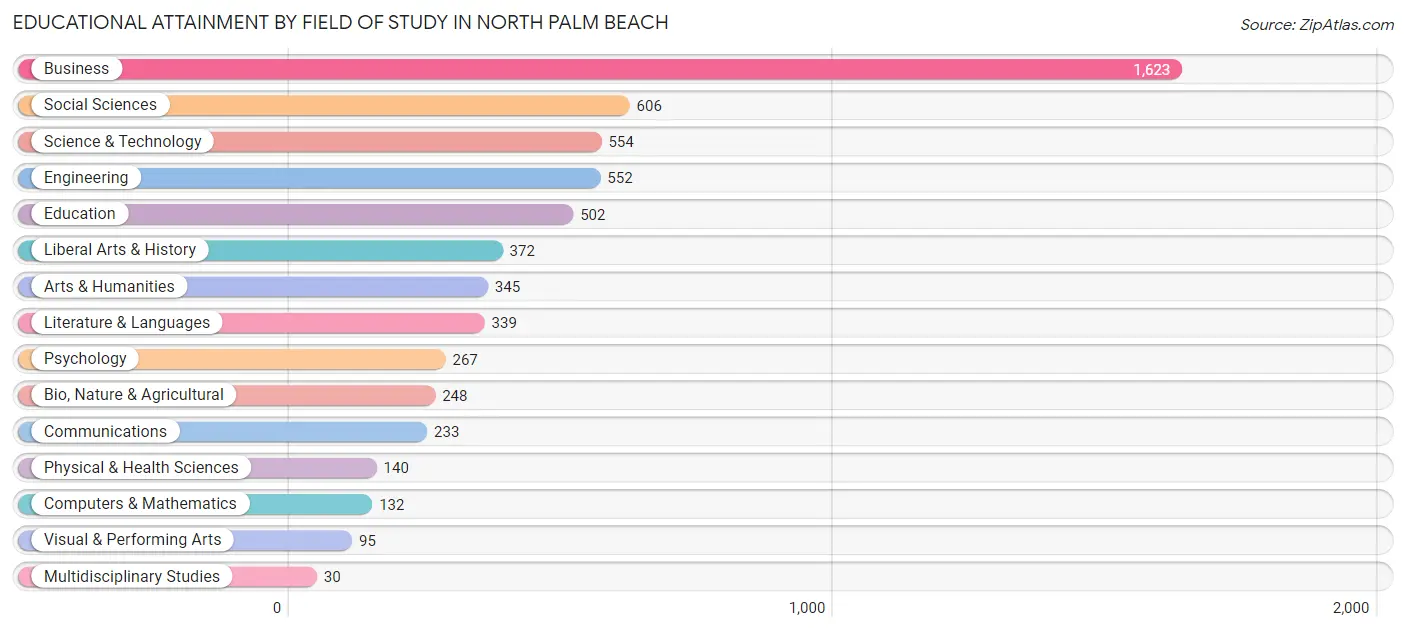
Educational Attainment by Field of Study in North Palm Beach
Business (1,623 | 26.9%), social sciences (606 | 10.0%), science & technology (554 | 9.2%), engineering (552 | 9.1%), and education (502 | 8.3%) are the most common fields of study among 6,038 individuals in North Palm Beach who have obtained a bachelor's degree or higher.
| Field of Study | # Graduates | % Graduates |
| Computers & Mathematics | 132 | 2.2% |
| Bio, Nature & Agricultural | 248 | 4.1% |
| Physical & Health Sciences | 140 | 2.3% |
| Psychology | 267 | 4.4% |
| Social Sciences | 606 | 10.0% |
| Engineering | 552 | 9.1% |
| Multidisciplinary Studies | 30 | 0.5% |
| Science & Technology | 554 | 9.2% |
| Business | 1,623 | 26.9% |
| Education | 502 | 8.3% |
| Literature & Languages | 339 | 5.6% |
| Liberal Arts & History | 372 | 6.2% |
| Visual & Performing Arts | 95 | 1.6% |
| Communications | 233 | 3.9% |
| Arts & Humanities | 345 | 5.7% |
| Total | 6,038 | 100.0% |
Transportation & Commute in North Palm Beach
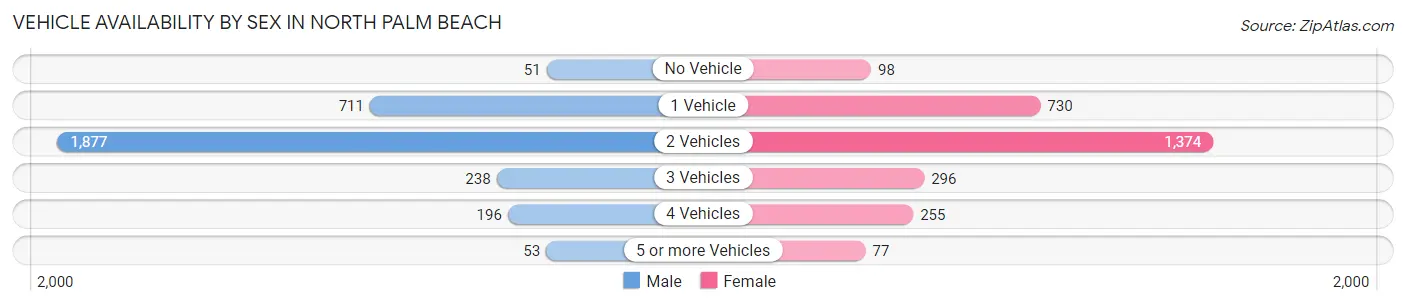
Vehicle Availability by Sex in North Palm Beach
The most prevalent vehicle ownership categories in North Palm Beach are males with 2 vehicles (1,877, accounting for 60.0%) and females with 2 vehicles (1,374, making up 66.3%).
| Vehicles Available | Male | Female |
| No Vehicle | 51 (1.6%) | 98 (3.5%) |
| 1 Vehicle | 711 (22.7%) | 730 (25.8%) |
| 2 Vehicles | 1,877 (60.0%) | 1,374 (48.5%) |
| 3 Vehicles | 238 (7.6%) | 296 (10.5%) |
| 4 Vehicles | 196 (6.3%) | 255 (9.0%) |
| 5 or more Vehicles | 53 (1.7%) | 77 (2.7%) |
| Total | 3,126 (100.0%) | 2,830 (100.0%) |
Commute Time in North Palm Beach
The most frequently occuring commute durations in North Palm Beach are 10 to 14 minutes (1,008 commuters, 20.3%), 20 to 24 minutes (906 commuters, 18.3%), and 15 to 19 minutes (792 commuters, 16.0%).
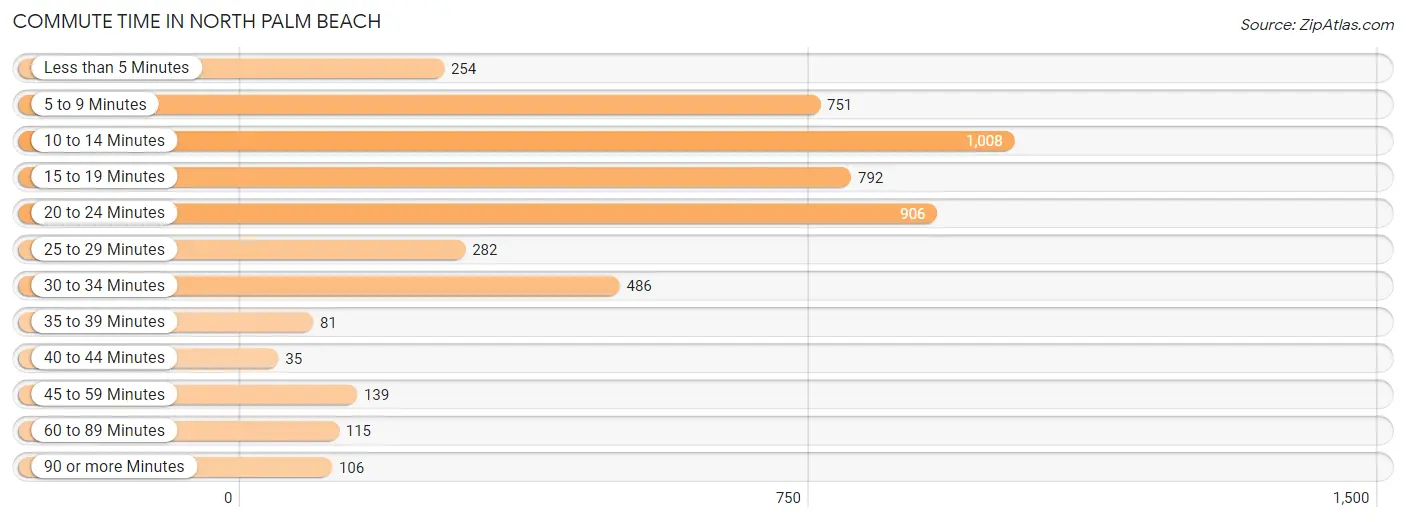
| Commute Time | # Commuters | % Commuters |
| Less than 5 Minutes | 254 | 5.1% |
| 5 to 9 Minutes | 751 | 15.2% |
| 10 to 14 Minutes | 1,008 | 20.3% |
| 15 to 19 Minutes | 792 | 16.0% |
| 20 to 24 Minutes | 906 | 18.3% |
| 25 to 29 Minutes | 282 | 5.7% |
| 30 to 34 Minutes | 486 | 9.8% |
| 35 to 39 Minutes | 81 | 1.6% |
| 40 to 44 Minutes | 35 | 0.7% |
| 45 to 59 Minutes | 139 | 2.8% |
| 60 to 89 Minutes | 115 | 2.3% |
| 90 or more Minutes | 106 | 2.1% |
Commute Time by Sex in North Palm Beach
The most common commute times in North Palm Beach are 10 to 14 minutes (574 commuters, 21.4%) for males and 20 to 24 minutes (452 commuters, 19.9%) for females.
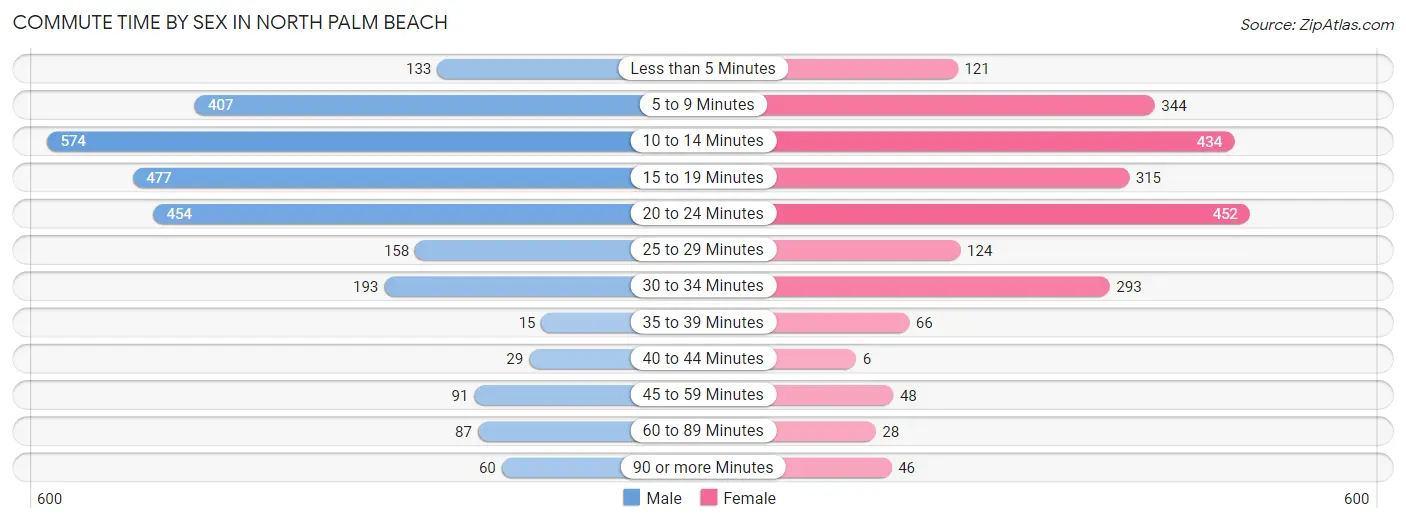
| Commute Time | Male | Female |
| Less than 5 Minutes | 133 (5.0%) | 121 (5.3%) |
| 5 to 9 Minutes | 407 (15.2%) | 344 (15.1%) |
| 10 to 14 Minutes | 574 (21.4%) | 434 (19.1%) |
| 15 to 19 Minutes | 477 (17.8%) | 315 (13.8%) |
| 20 to 24 Minutes | 454 (17.0%) | 452 (19.9%) |
| 25 to 29 Minutes | 158 (5.9%) | 124 (5.4%) |
| 30 to 34 Minutes | 193 (7.2%) | 293 (12.9%) |
| 35 to 39 Minutes | 15 (0.6%) | 66 (2.9%) |
| 40 to 44 Minutes | 29 (1.1%) | 6 (0.3%) |
| 45 to 59 Minutes | 91 (3.4%) | 48 (2.1%) |
| 60 to 89 Minutes | 87 (3.3%) | 28 (1.2%) |
| 90 or more Minutes | 60 (2.2%) | 46 (2.0%) |
Time of Departure to Work by Sex in North Palm Beach
The most frequent times of departure to work in North Palm Beach are 8:00 AM to 8:29 AM (517, 19.3%) for males and 8:00 AM to 8:29 AM (490, 21.5%) for females.
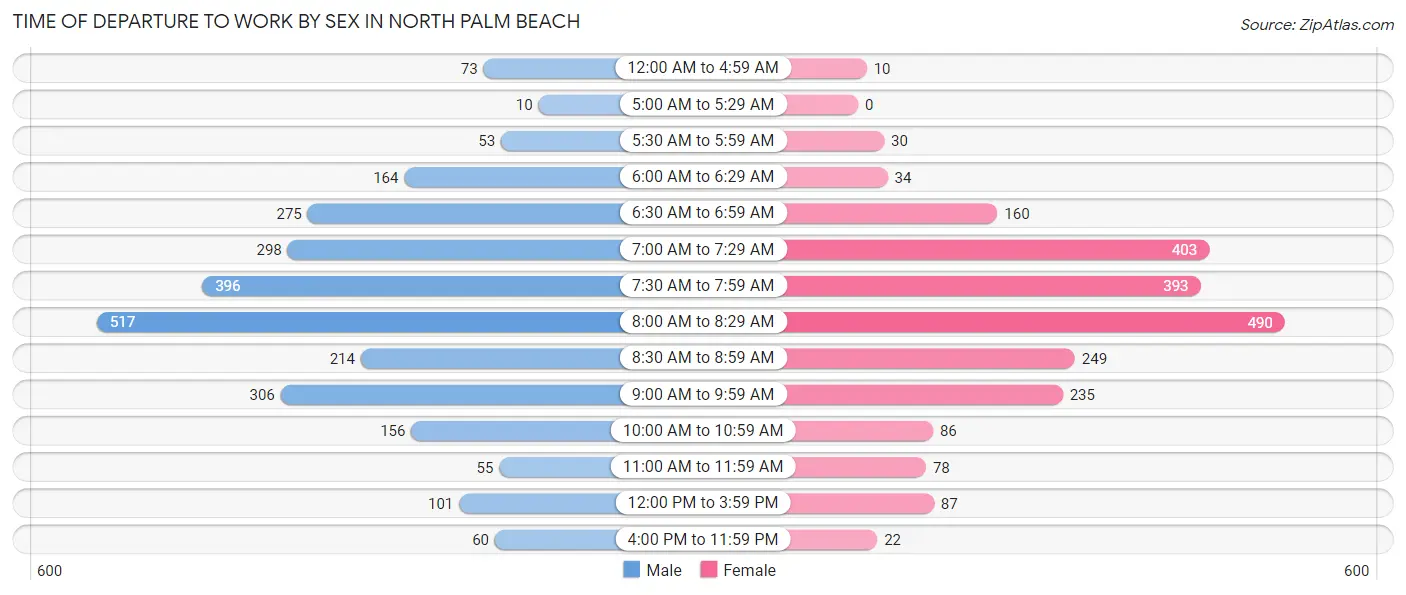
| Time of Departure | Male | Female |
| 12:00 AM to 4:59 AM | 73 (2.7%) | 10 (0.4%) |
| 5:00 AM to 5:29 AM | 10 (0.4%) | 0 (0.0%) |
| 5:30 AM to 5:59 AM | 53 (2.0%) | 30 (1.3%) |
| 6:00 AM to 6:29 AM | 164 (6.1%) | 34 (1.5%) |
| 6:30 AM to 6:59 AM | 275 (10.3%) | 160 (7.0%) |
| 7:00 AM to 7:29 AM | 298 (11.1%) | 403 (17.7%) |
| 7:30 AM to 7:59 AM | 396 (14.8%) | 393 (17.3%) |
| 8:00 AM to 8:29 AM | 517 (19.3%) | 490 (21.5%) |
| 8:30 AM to 8:59 AM | 214 (8.0%) | 249 (10.9%) |
| 9:00 AM to 9:59 AM | 306 (11.4%) | 235 (10.3%) |
| 10:00 AM to 10:59 AM | 156 (5.8%) | 86 (3.8%) |
| 11:00 AM to 11:59 AM | 55 (2.1%) | 78 (3.4%) |
| 12:00 PM to 3:59 PM | 101 (3.8%) | 87 (3.8%) |
| 4:00 PM to 11:59 PM | 60 (2.2%) | 22 (1.0%) |
| Total | 2,678 (100.0%) | 2,277 (100.0%) |
Housing Occupancy in North Palm Beach
Occupancy by Ownership in North Palm Beach
Of the total 6,363 dwellings in North Palm Beach, owner-occupied units account for 4,938 (77.6%), while renter-occupied units make up 1,425 (22.4%).
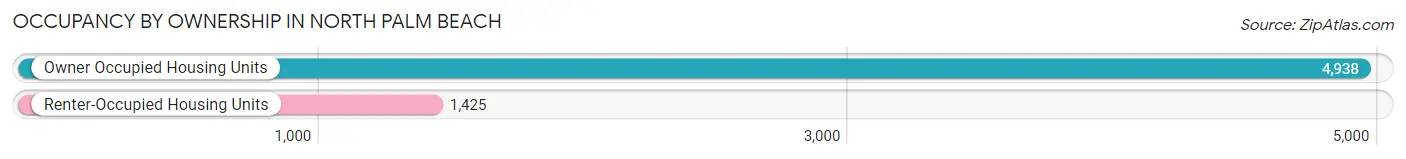
| Occupancy | # Housing Units | % Housing Units |
| Owner Occupied Housing Units | 4,938 | 77.6% |
| Renter-Occupied Housing Units | 1,425 | 22.4% |
| Total Occupied Housing Units | 6,363 | 100.0% |
Occupancy by Household Size in North Palm Beach

| Household Size | # Housing Units | % Housing Units |
| 1-Person Household | 2,442 | 38.4% |
| 2-Person Household | 2,667 | 41.9% |
| 3-Person Household | 657 | 10.3% |
| 4+ Person Household | 597 | 9.4% |
| Total Housing Units | 6,363 | 100.0% |
Occupancy by Ownership by Household Size in North Palm Beach
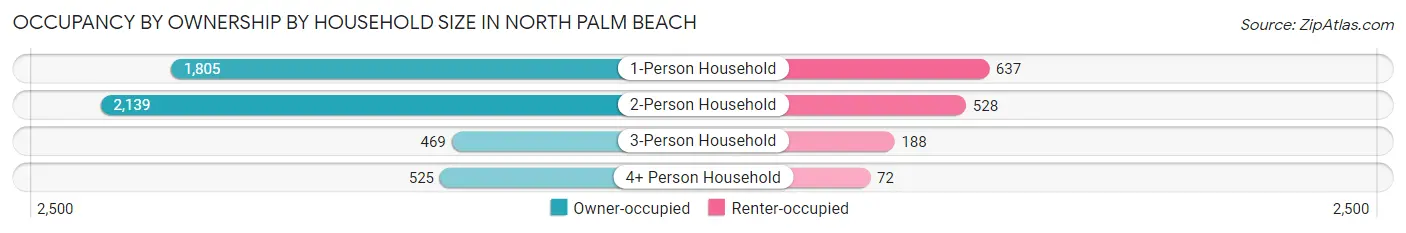
| Household Size | Owner-occupied | Renter-occupied |
| 1-Person Household | 1,805 (73.9%) | 637 (26.1%) |
| 2-Person Household | 2,139 (80.2%) | 528 (19.8%) |
| 3-Person Household | 469 (71.4%) | 188 (28.6%) |
| 4+ Person Household | 525 (87.9%) | 72 (12.1%) |
| Total Housing Units | 4,938 (77.6%) | 1,425 (22.4%) |
Occupancy by Educational Attainment in North Palm Beach
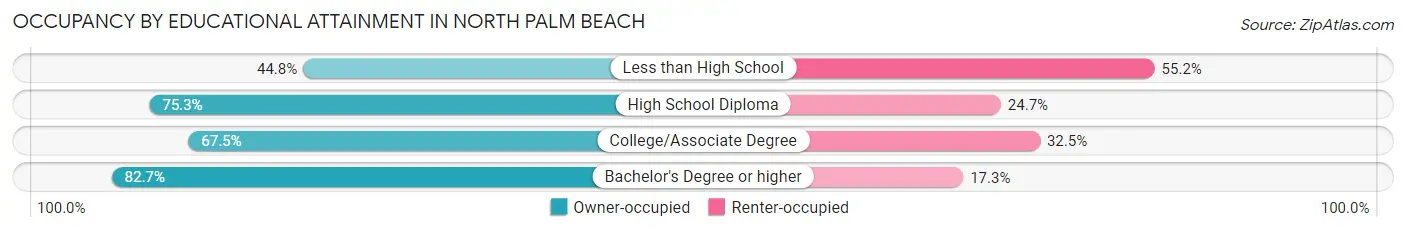
| Household Size | Owner-occupied | Renter-occupied |
| Less than High School | 43 (44.8%) | 53 (55.2%) |
| High School Diploma | 837 (75.3%) | 275 (24.7%) |
| College/Associate Degree | 919 (67.5%) | 442 (32.5%) |
| Bachelor's Degree or higher | 3,139 (82.7%) | 655 (17.3%) |
Occupancy by Age of Householder in North Palm Beach
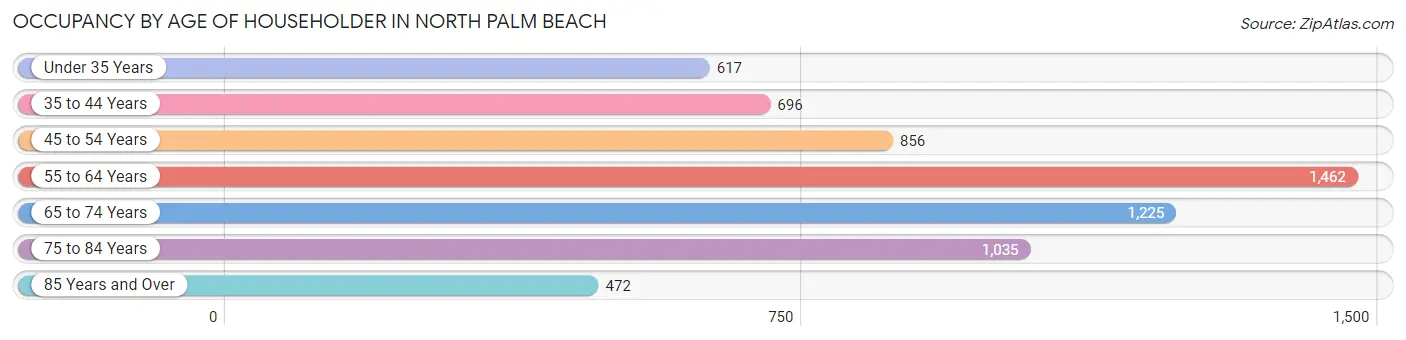
| Age Bracket | # Households | % Households |
| Under 35 Years | 617 | 9.7% |
| 35 to 44 Years | 696 | 10.9% |
| 45 to 54 Years | 856 | 13.5% |
| 55 to 64 Years | 1,462 | 23.0% |
| 65 to 74 Years | 1,225 | 19.3% |
| 75 to 84 Years | 1,035 | 16.3% |
| 85 Years and Over | 472 | 7.4% |
| Total | 6,363 | 100.0% |
Housing Finances in North Palm Beach
Median Income by Occupancy in North Palm Beach
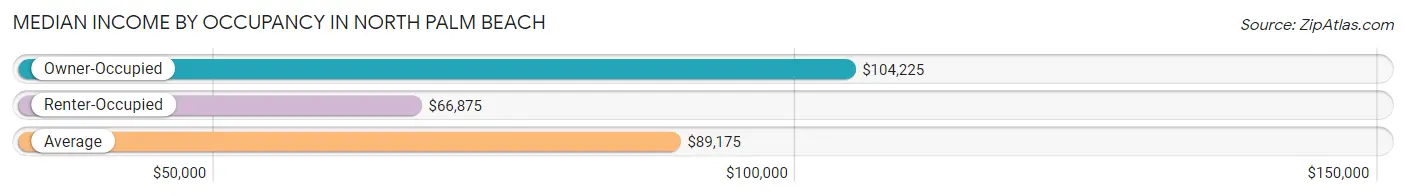
| Occupancy Type | # Households | Median Income |
| Owner-Occupied | 4,938 (77.6%) | $104,225 |
| Renter-Occupied | 1,425 (22.4%) | $66,875 |
| Average | 6,363 (100.0%) | $89,175 |
Occupancy by Householder Income Bracket in North Palm Beach
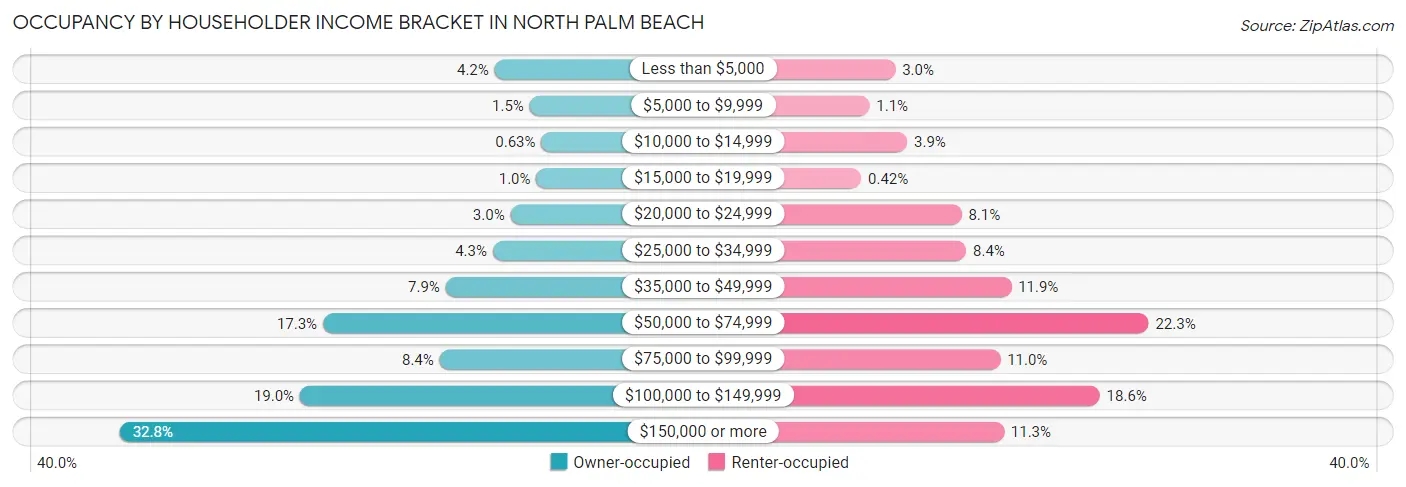
| Income Bracket | Owner-occupied | Renter-occupied |
| Less than $5,000 | 207 (4.2%) | 43 (3.0%) |
| $5,000 to $9,999 | 75 (1.5%) | 15 (1.1%) |
| $10,000 to $14,999 | 31 (0.6%) | 56 (3.9%) |
| $15,000 to $19,999 | 50 (1.0%) | 6 (0.4%) |
| $20,000 to $24,999 | 147 (3.0%) | 115 (8.1%) |
| $25,000 to $34,999 | 214 (4.3%) | 120 (8.4%) |
| $35,000 to $49,999 | 391 (7.9%) | 169 (11.9%) |
| $50,000 to $74,999 | 853 (17.3%) | 318 (22.3%) |
| $75,000 to $99,999 | 414 (8.4%) | 157 (11.0%) |
| $100,000 to $149,999 | 939 (19.0%) | 265 (18.6%) |
| $150,000 or more | 1,617 (32.8%) | 161 (11.3%) |
| Total | 4,938 (100.0%) | 1,425 (100.0%) |
Monthly Housing Cost Tiers in North Palm Beach
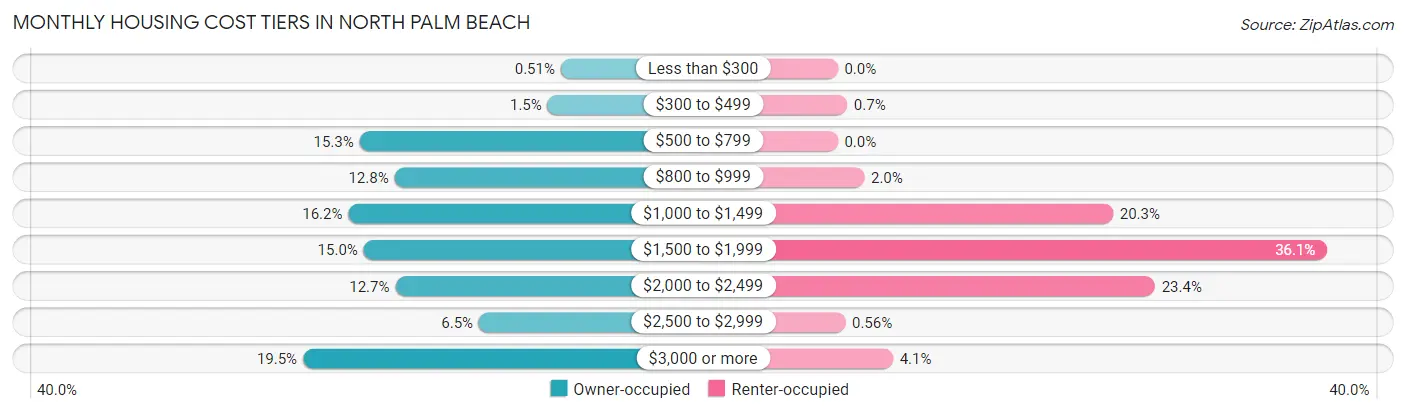
| Monthly Cost | Owner-occupied | Renter-occupied |
| Less than $300 | 25 (0.5%) | 0 (0.0%) |
| $300 to $499 | 73 (1.5%) | 10 (0.7%) |
| $500 to $799 | 757 (15.3%) | 0 (0.0%) |
| $800 to $999 | 630 (12.8%) | 28 (2.0%) |
| $1,000 to $1,499 | 798 (16.2%) | 289 (20.3%) |
| $1,500 to $1,999 | 742 (15.0%) | 514 (36.1%) |
| $2,000 to $2,499 | 627 (12.7%) | 333 (23.4%) |
| $2,500 to $2,999 | 323 (6.5%) | 8 (0.6%) |
| $3,000 or more | 963 (19.5%) | 58 (4.1%) |
| Total | 4,938 (100.0%) | 1,425 (100.0%) |
Physical Housing Characteristics in North Palm Beach
Housing Structures in North Palm Beach
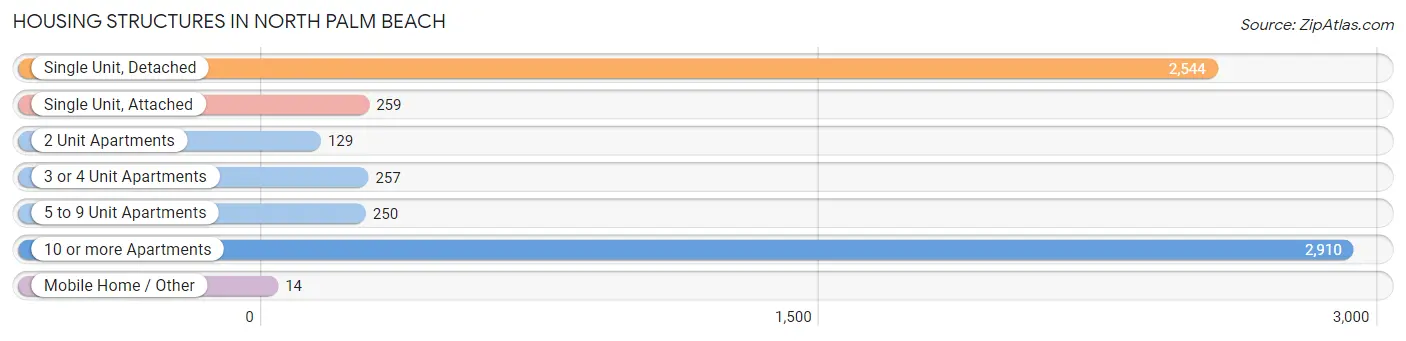
| Structure Type | # Housing Units | % Housing Units |
| Single Unit, Detached | 2,544 | 40.0% |
| Single Unit, Attached | 259 | 4.1% |
| 2 Unit Apartments | 129 | 2.0% |
| 3 or 4 Unit Apartments | 257 | 4.0% |
| 5 to 9 Unit Apartments | 250 | 3.9% |
| 10 or more Apartments | 2,910 | 45.7% |
| Mobile Home / Other | 14 | 0.2% |
| Total | 6,363 | 100.0% |
Housing Structures by Occupancy in North Palm Beach
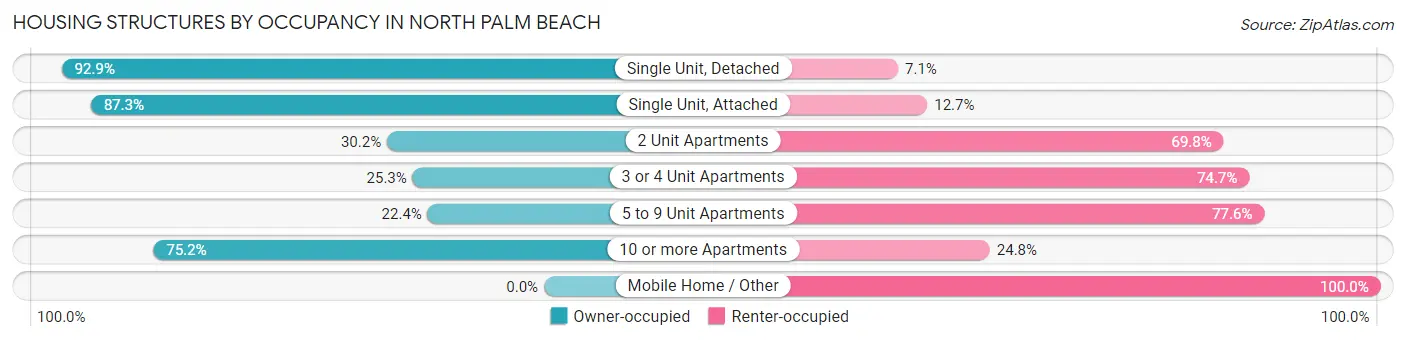
| Structure Type | Owner-occupied | Renter-occupied |
| Single Unit, Detached | 2,363 (92.9%) | 181 (7.1%) |
| Single Unit, Attached | 226 (87.3%) | 33 (12.7%) |
| 2 Unit Apartments | 39 (30.2%) | 90 (69.8%) |
| 3 or 4 Unit Apartments | 65 (25.3%) | 192 (74.7%) |
| 5 to 9 Unit Apartments | 56 (22.4%) | 194 (77.6%) |
| 10 or more Apartments | 2,189 (75.2%) | 721 (24.8%) |
| Mobile Home / Other | 0 (0.0%) | 14 (100.0%) |
| Total | 4,938 (77.6%) | 1,425 (22.4%) |
Housing Structures by Number of Rooms in North Palm Beach
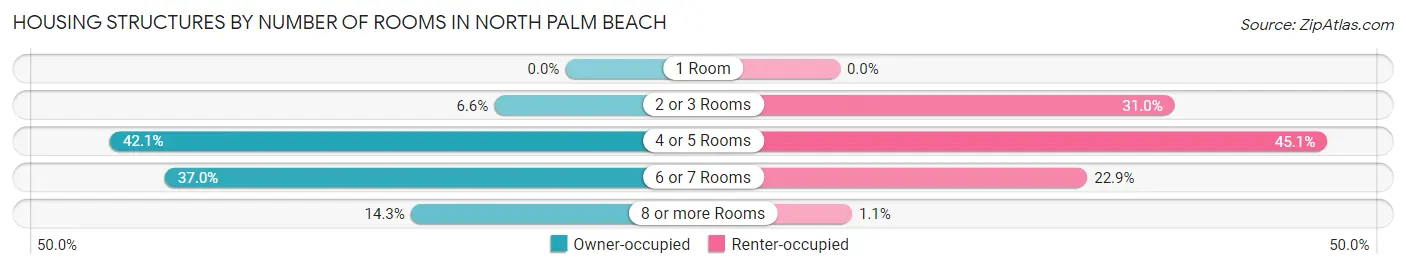
| Number of Rooms | Owner-occupied | Renter-occupied |
| 1 Room | 0 (0.0%) | 0 (0.0%) |
| 2 or 3 Rooms | 325 (6.6%) | 441 (30.9%) |
| 4 or 5 Rooms | 2,079 (42.1%) | 642 (45.1%) |
| 6 or 7 Rooms | 1,828 (37.0%) | 326 (22.9%) |
| 8 or more Rooms | 706 (14.3%) | 16 (1.1%) |
| Total | 4,938 (100.0%) | 1,425 (100.0%) |
Housing Structure by Heating Type in North Palm Beach
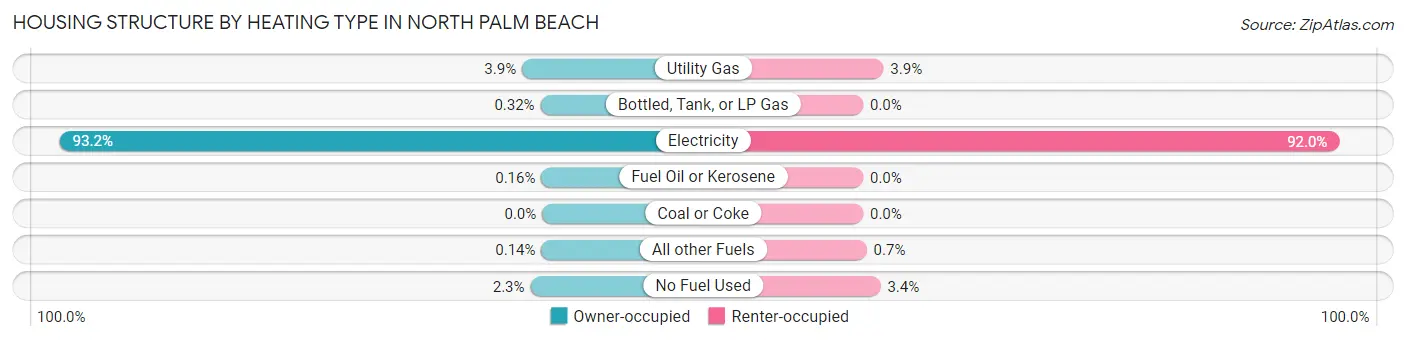
| Heating Type | Owner-occupied | Renter-occupied |
| Utility Gas | 192 (3.9%) | 56 (3.9%) |
| Bottled, Tank, or LP Gas | 16 (0.3%) | 0 (0.0%) |
| Electricity | 4,603 (93.2%) | 1,311 (92.0%) |
| Fuel Oil or Kerosene | 8 (0.2%) | 0 (0.0%) |
| Coal or Coke | 0 (0.0%) | 0 (0.0%) |
| All other Fuels | 7 (0.1%) | 10 (0.7%) |
| No Fuel Used | 112 (2.3%) | 48 (3.4%) |
| Total | 4,938 (100.0%) | 1,425 (100.0%) |
Household Vehicle Usage in North Palm Beach
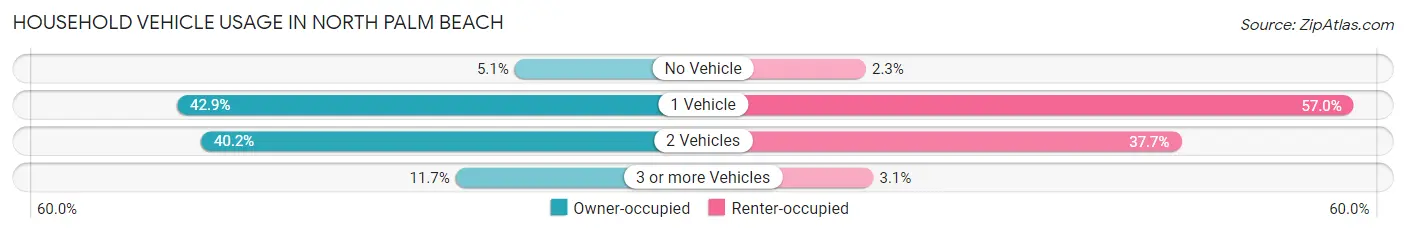
| Vehicles per Household | Owner-occupied | Renter-occupied |
| No Vehicle | 253 (5.1%) | 32 (2.2%) |
| 1 Vehicle | 2,119 (42.9%) | 812 (57.0%) |
| 2 Vehicles | 1,987 (40.2%) | 537 (37.7%) |
| 3 or more Vehicles | 579 (11.7%) | 44 (3.1%) |
| Total | 4,938 (100.0%) | 1,425 (100.0%) |
Real Estate & Mortgages in North Palm Beach
Real Estate and Mortgage Overview in North Palm Beach
| Characteristic | Without Mortgage | With Mortgage |
| Housing Units | 2,475 | 2,463 |
| Median Property Value | $407,800 | $426,900 |
| Median Household Income | $84,315 | $950 |
| Monthly Housing Costs | $952 | $846 |
| Real Estate Taxes | $4,119 | $9 |
Property Value by Mortgage Status in North Palm Beach
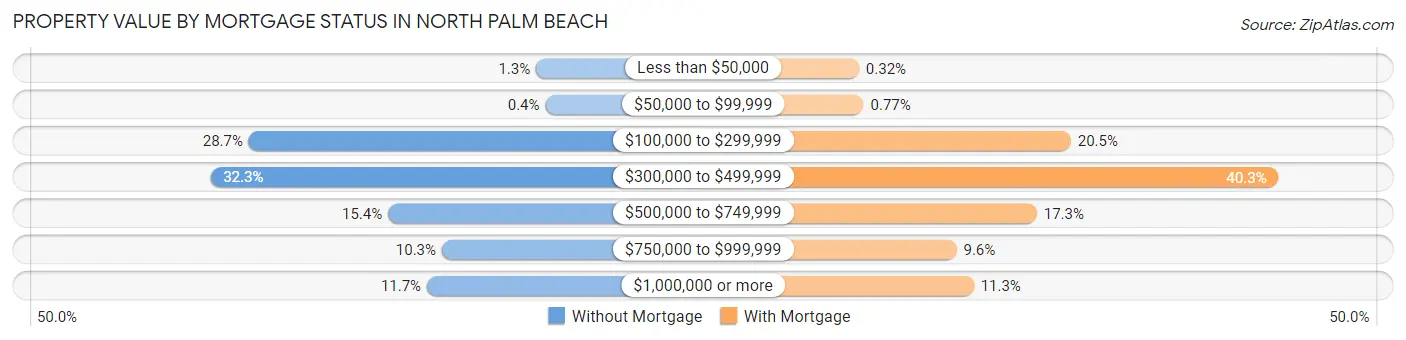
| Property Value | Without Mortgage | With Mortgage |
| Less than $50,000 | 32 (1.3%) | 8 (0.3%) |
| $50,000 to $99,999 | 10 (0.4%) | 19 (0.8%) |
| $100,000 to $299,999 | 709 (28.6%) | 505 (20.5%) |
| $300,000 to $499,999 | 800 (32.3%) | 992 (40.3%) |
| $500,000 to $749,999 | 381 (15.4%) | 425 (17.3%) |
| $750,000 to $999,999 | 254 (10.3%) | 237 (9.6%) |
| $1,000,000 or more | 289 (11.7%) | 277 (11.3%) |
| Total | 2,475 (100.0%) | 2,463 (100.0%) |
Household Income by Mortgage Status in North Palm Beach
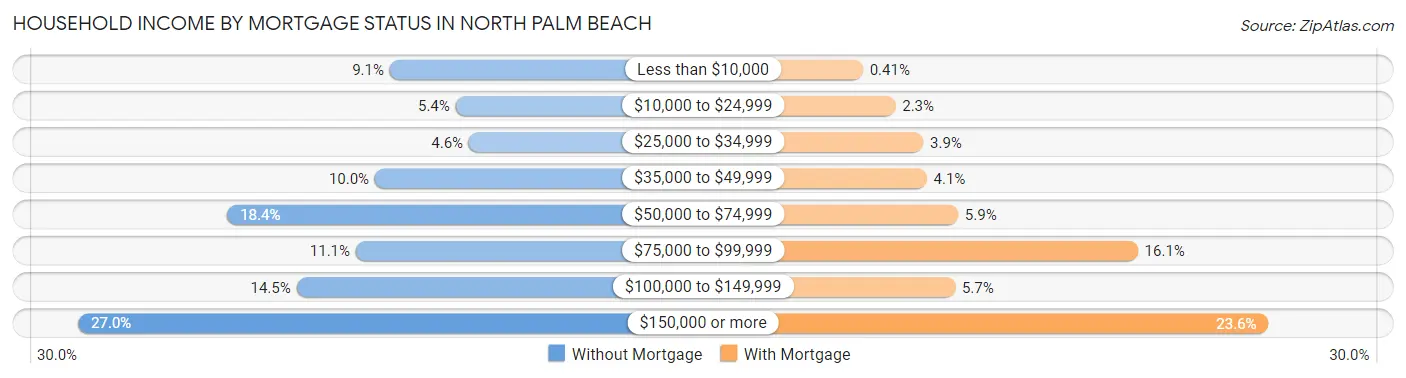
| Household Income | Without Mortgage | With Mortgage |
| Less than $10,000 | 226 (9.1%) | 10 (0.4%) |
| $10,000 to $24,999 | 133 (5.4%) | 56 (2.3%) |
| $25,000 to $34,999 | 114 (4.6%) | 95 (3.9%) |
| $35,000 to $49,999 | 247 (10.0%) | 100 (4.1%) |
| $50,000 to $74,999 | 456 (18.4%) | 144 (5.9%) |
| $75,000 to $99,999 | 274 (11.1%) | 397 (16.1%) |
| $100,000 to $149,999 | 358 (14.5%) | 140 (5.7%) |
| $150,000 or more | 667 (27.0%) | 581 (23.6%) |
| Total | 2,475 (100.0%) | 2,463 (100.0%) |
Property Value to Household Income Ratio in North Palm Beach
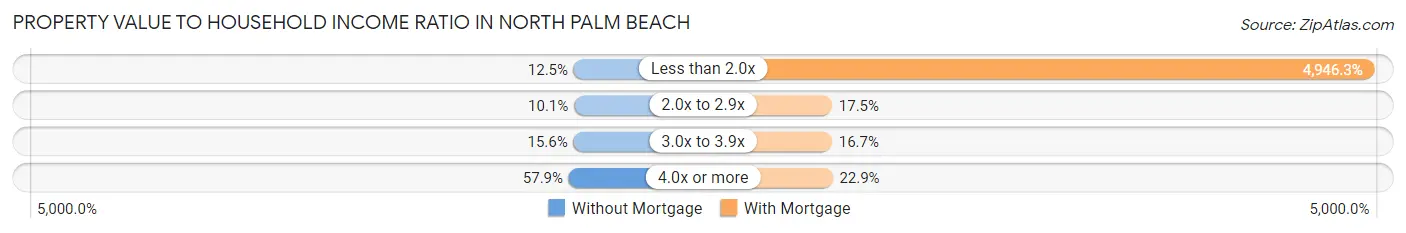
| Value-to-Income Ratio | Without Mortgage | With Mortgage |
| Less than 2.0x | 310 (12.5%) | 121,827 (4,946.3%) |
| 2.0x to 2.9x | 251 (10.1%) | 431 (17.5%) |
| 3.0x to 3.9x | 386 (15.6%) | 412 (16.7%) |
| 4.0x or more | 1,433 (57.9%) | 563 (22.9%) |
| Total | 2,475 (100.0%) | 2,463 (100.0%) |
Real Estate Taxes by Mortgage Status in North Palm Beach
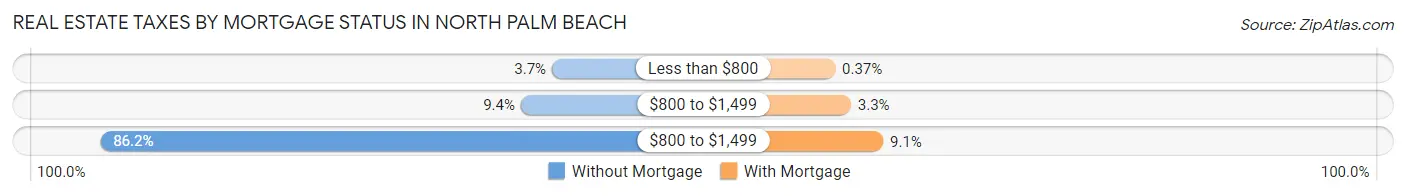
| Property Taxes | Without Mortgage | With Mortgage |
| Less than $800 | 91 (3.7%) | 9 (0.4%) |
| $800 to $1,499 | 232 (9.4%) | 80 (3.3%) |
| $800 to $1,499 | 2,133 (86.2%) | 225 (9.1%) |
| Total | 2,475 (100.0%) | 2,463 (100.0%) |
Health & Disability in North Palm Beach
Health Insurance Coverage by Age in North Palm Beach
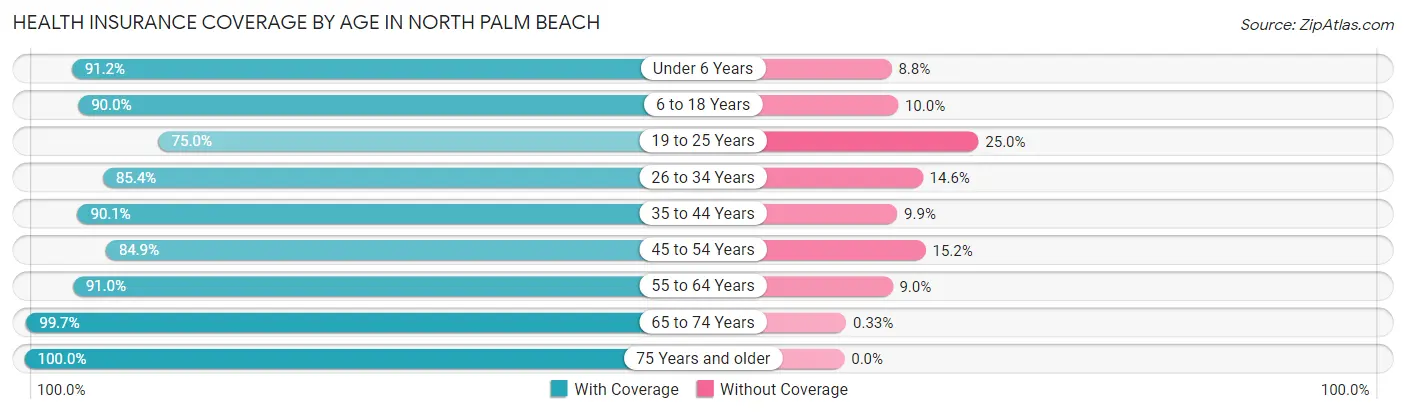
| Age Bracket | With Coverage | Without Coverage |
| Under 6 Years | 415 (91.2%) | 40 (8.8%) |
| 6 to 18 Years | 1,187 (90.0%) | 132 (10.0%) |
| 19 to 25 Years | 642 (75.0%) | 214 (25.0%) |
| 26 to 34 Years | 871 (85.4%) | 149 (14.6%) |
| 35 to 44 Years | 1,060 (90.1%) | 116 (9.9%) |
| 45 to 54 Years | 1,333 (84.9%) | 238 (15.1%) |
| 55 to 64 Years | 2,190 (91.0%) | 216 (9.0%) |
| 65 to 74 Years | 1,839 (99.7%) | 6 (0.3%) |
| 75 Years and older | 2,441 (100.0%) | 0 (0.0%) |
| Total | 11,978 (91.5%) | 1,111 (8.5%) |
Health Insurance Coverage by Citizenship Status in North Palm Beach
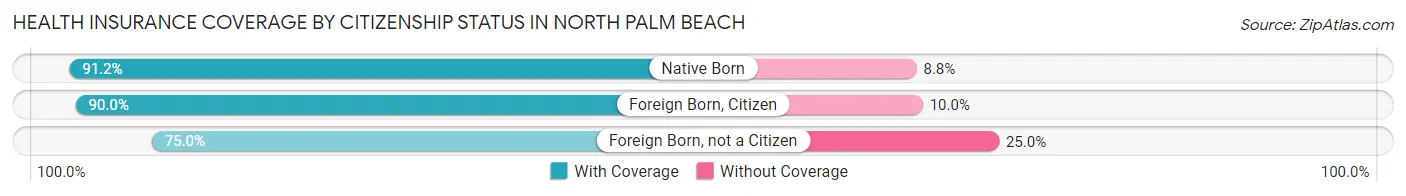
| Citizenship Status | With Coverage | Without Coverage |
| Native Born | 415 (91.2%) | 40 (8.8%) |
| Foreign Born, Citizen | 1,187 (90.0%) | 132 (10.0%) |
| Foreign Born, not a Citizen | 642 (75.0%) | 214 (25.0%) |
Health Insurance Coverage by Household Income in North Palm Beach
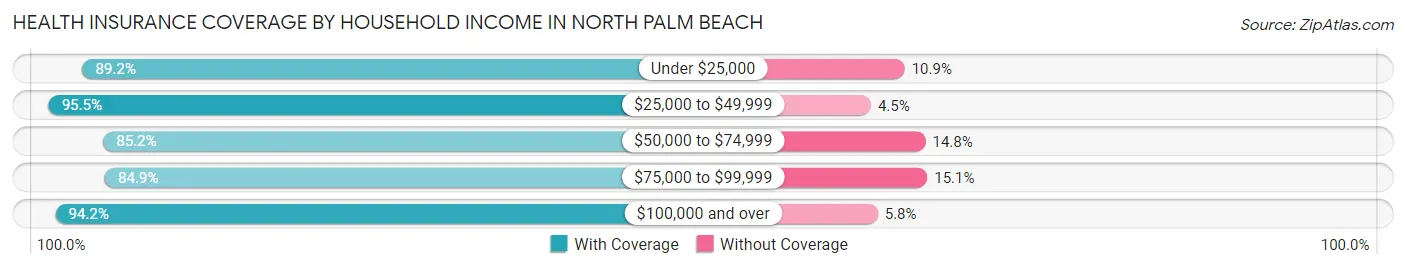
| Household Income | With Coverage | Without Coverage |
| Under $25,000 | 838 (89.1%) | 102 (10.8%) |
| $25,000 to $49,999 | 1,433 (95.5%) | 68 (4.5%) |
| $50,000 to $74,999 | 1,859 (85.2%) | 322 (14.8%) |
| $75,000 to $99,999 | 1,059 (84.9%) | 188 (15.1%) |
| $100,000 and over | 6,776 (94.2%) | 418 (5.8%) |
Public vs Private Health Insurance Coverage by Age in North Palm Beach
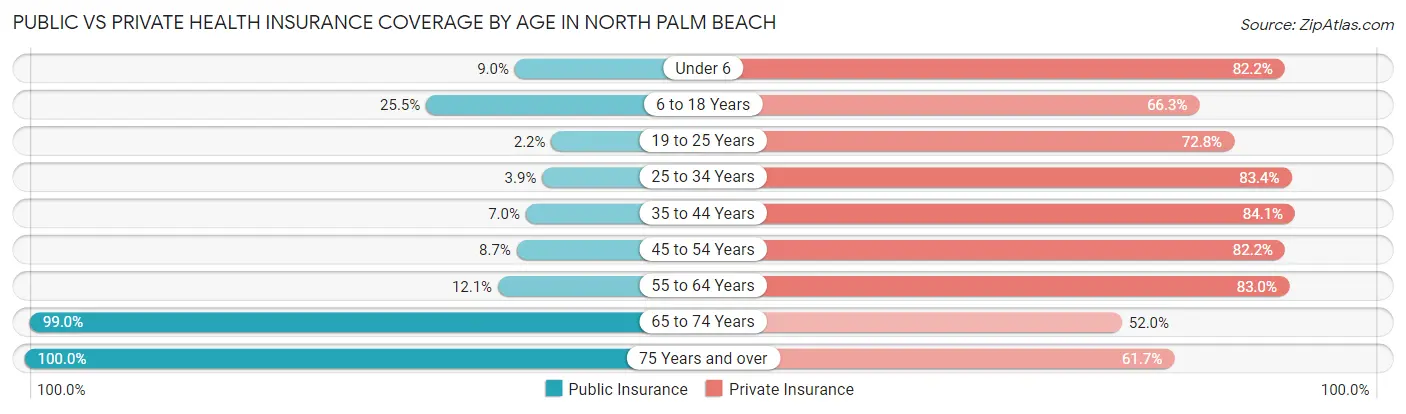
| Age Bracket | Public Insurance | Private Insurance |
| Under 6 | 41 (9.0%) | 374 (82.2%) |
| 6 to 18 Years | 336 (25.5%) | 875 (66.3%) |
| 19 to 25 Years | 19 (2.2%) | 623 (72.8%) |
| 25 to 34 Years | 40 (3.9%) | 851 (83.4%) |
| 35 to 44 Years | 82 (7.0%) | 989 (84.1%) |
| 45 to 54 Years | 136 (8.7%) | 1,292 (82.2%) |
| 55 to 64 Years | 292 (12.1%) | 1,996 (83.0%) |
| 65 to 74 Years | 1,827 (99.0%) | 959 (52.0%) |
| 75 Years and over | 2,441 (100.0%) | 1,505 (61.7%) |
| Total | 5,214 (39.8%) | 9,464 (72.3%) |
Disability Status by Sex by Age in North Palm Beach
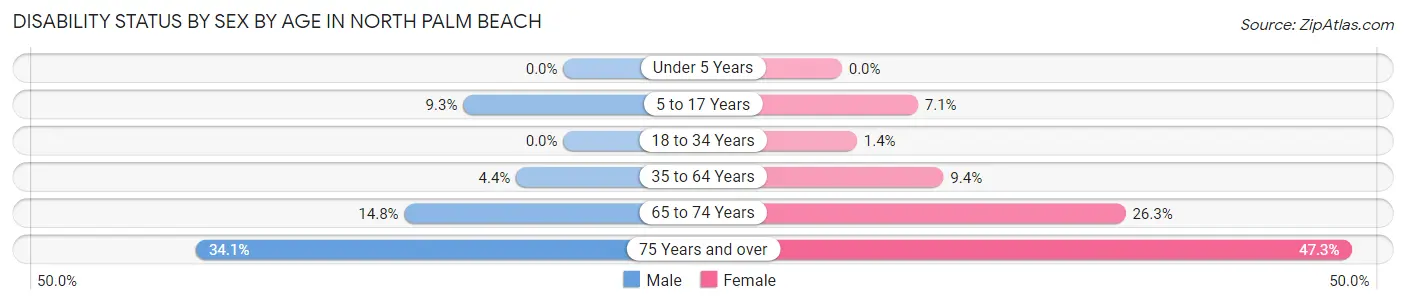
| Age Bracket | Male | Female |
| Under 5 Years | 0 (0.0%) | 0 (0.0%) |
| 5 to 17 Years | 54 (9.3%) | 52 (7.1%) |
| 18 to 34 Years | 0 (0.0%) | 14 (1.4%) |
| 35 to 64 Years | 111 (4.4%) | 247 (9.4%) |
| 65 to 74 Years | 136 (14.7%) | 243 (26.3%) |
| 75 Years and over | 468 (34.1%) | 505 (47.3%) |
Disability Class by Sex by Age in North Palm Beach
Disability Class: Hearing Difficulty
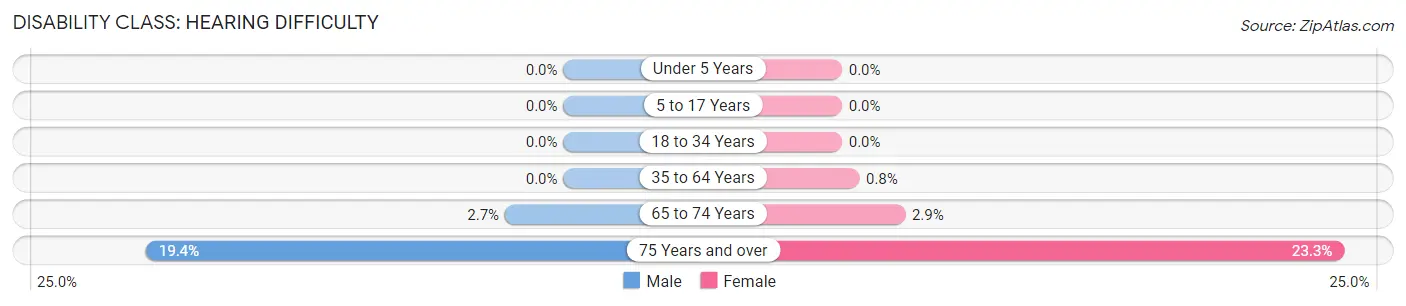
| Age Bracket | Male | Female |
| Under 5 Years | 0 (0.0%) | 0 (0.0%) |
| 5 to 17 Years | 0 (0.0%) | 0 (0.0%) |
| 18 to 34 Years | 0 (0.0%) | 0 (0.0%) |
| 35 to 64 Years | 0 (0.0%) | 21 (0.8%) |
| 65 to 74 Years | 25 (2.7%) | 27 (2.9%) |
| 75 Years and over | 266 (19.4%) | 249 (23.3%) |
Disability Class: Vision Difficulty
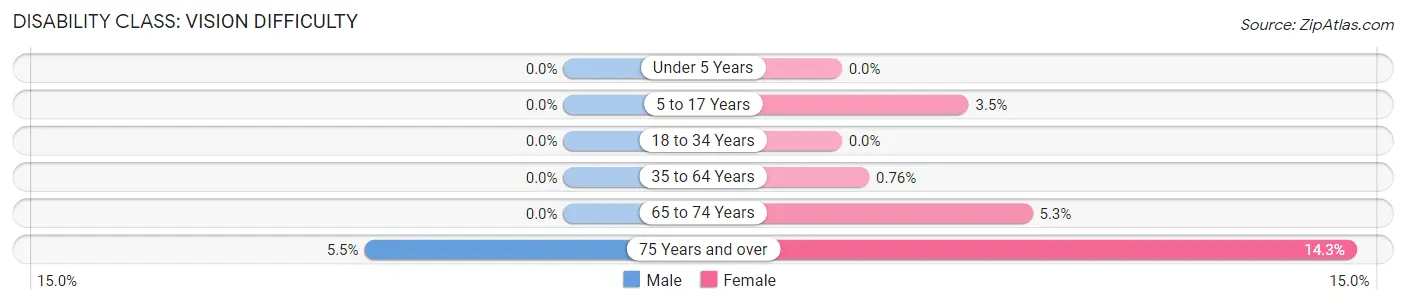
| Age Bracket | Male | Female |
| Under 5 Years | 0 (0.0%) | 0 (0.0%) |
| 5 to 17 Years | 0 (0.0%) | 26 (3.5%) |
| 18 to 34 Years | 0 (0.0%) | 0 (0.0%) |
| 35 to 64 Years | 0 (0.0%) | 20 (0.8%) |
| 65 to 74 Years | 0 (0.0%) | 49 (5.3%) |
| 75 Years and over | 76 (5.5%) | 153 (14.3%) |
Disability Class: Cognitive Difficulty
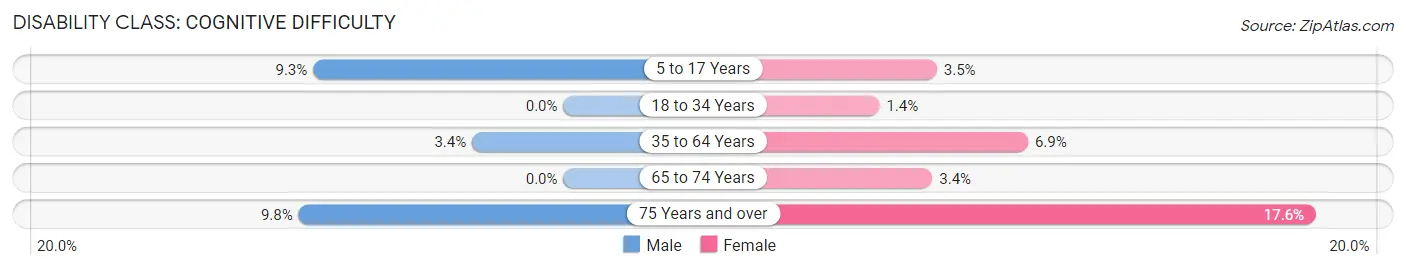
| Age Bracket | Male | Female |
| 5 to 17 Years | 54 (9.3%) | 26 (3.5%) |
| 18 to 34 Years | 0 (0.0%) | 14 (1.4%) |
| 35 to 64 Years | 86 (3.4%) | 181 (6.9%) |
| 65 to 74 Years | 0 (0.0%) | 31 (3.4%) |
| 75 Years and over | 135 (9.8%) | 188 (17.6%) |
Disability Class: Ambulatory Difficulty
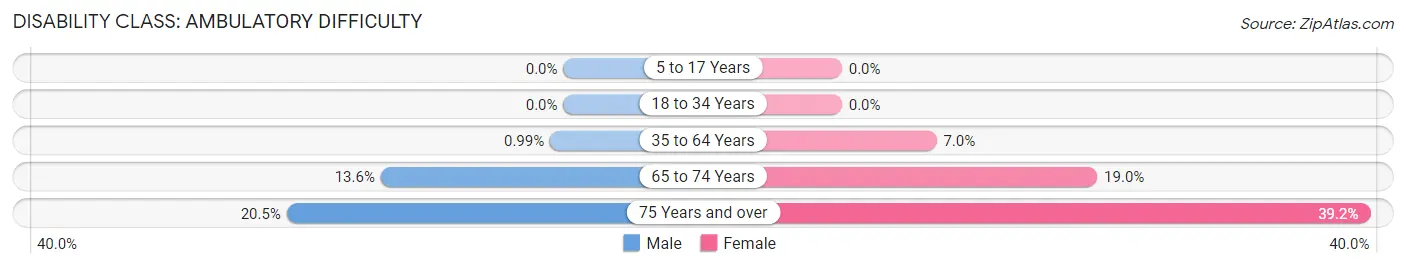
| Age Bracket | Male | Female |
| 5 to 17 Years | 0 (0.0%) | 0 (0.0%) |
| 18 to 34 Years | 0 (0.0%) | 0 (0.0%) |
| 35 to 64 Years | 25 (1.0%) | 184 (7.0%) |
| 65 to 74 Years | 125 (13.6%) | 175 (19.0%) |
| 75 Years and over | 282 (20.5%) | 419 (39.2%) |
Disability Class: Self-Care Difficulty
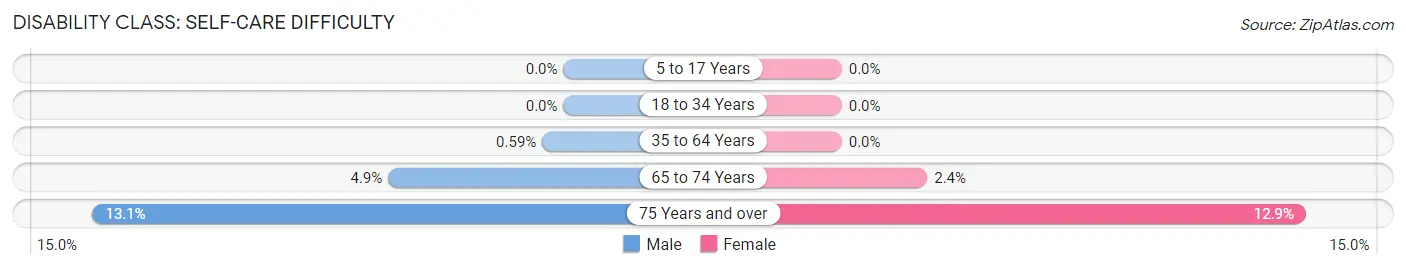
| Age Bracket | Male | Female |
| 5 to 17 Years | 0 (0.0%) | 0 (0.0%) |
| 18 to 34 Years | 0 (0.0%) | 0 (0.0%) |
| 35 to 64 Years | 15 (0.6%) | 0 (0.0%) |
| 65 to 74 Years | 45 (4.9%) | 22 (2.4%) |
| 75 Years and over | 180 (13.1%) | 138 (12.9%) |
Technology Access in North Palm Beach
Computing Device Access in North Palm Beach
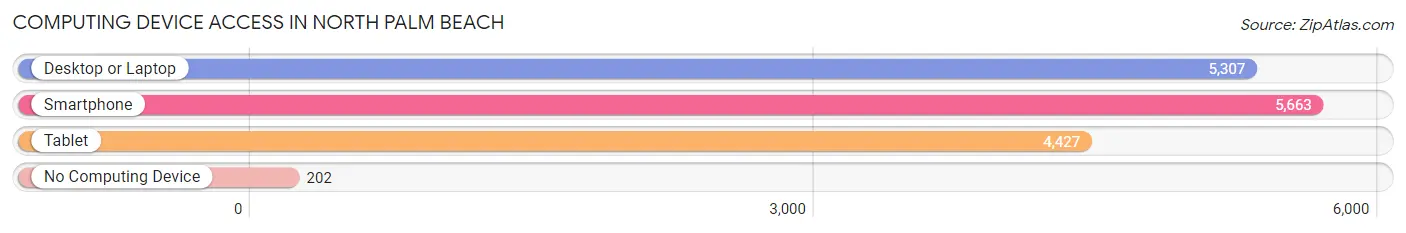
| Device Type | # Households | % Households |
| Desktop or Laptop | 5,307 | 83.4% |
| Smartphone | 5,663 | 89.0% |
| Tablet | 4,427 | 69.6% |
| No Computing Device | 202 | 3.2% |
| Total | 6,363 | 100.0% |
Internet Access in North Palm Beach
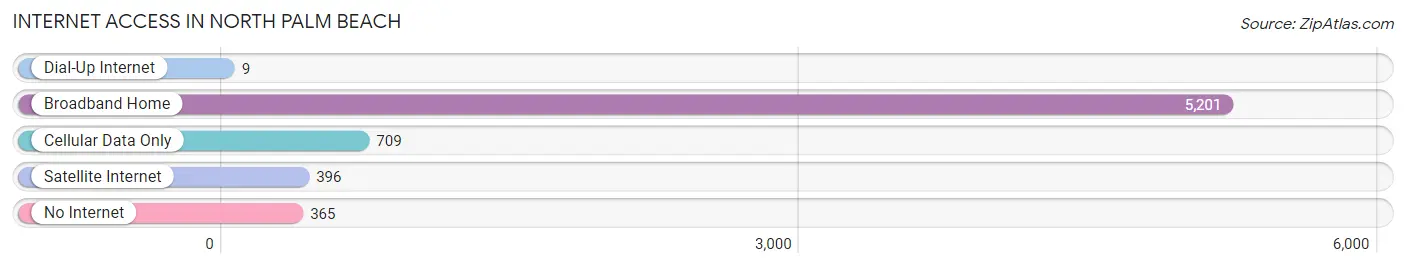
| Internet Type | # Households | % Households |
| Dial-Up Internet | 9 | 0.1% |
| Broadband Home | 5,201 | 81.7% |
| Cellular Data Only | 709 | 11.1% |
| Satellite Internet | 396 | 6.2% |
| No Internet | 365 | 5.7% |
| Total | 6,363 | 100.0% |
North Palm Beach Summary
Palm Beach County is located in the southeastern part of the state of Florida, and is home to the city of North Palm Beach. North Palm Beach is a small city located on the northern tip of Palm Beach County, and is bordered by the Atlantic Ocean to the east, the Intracoastal Waterway to the west, and the cities of Juno Beach and Palm Beach Gardens to the south. The city has a population of 12,015 as of the 2010 census, and is part of the Miami metropolitan area.
History
North Palm Beach was first settled in the late 19th century by settlers from the Bahamas. The area was originally known as Seminole Landing, and was a popular spot for fishing and hunting. In the early 20th century, the area was developed as a resort community, and the first hotel was built in the area in 1925. The city was officially incorporated in 1956, and the population has grown steadily since then.
Geography
North Palm Beach is located at 26°51'N 80°3'W, and has an area of 4.2 square miles. The city is located on the northern tip of Palm Beach County, and is bordered by the Atlantic Ocean to the east, the Intracoastal Waterway to the west, and the cities of Juno Beach and Palm Beach Gardens to the south. The city is located on a barrier island, and is connected to the mainland by the Northlake Boulevard Bridge.
Economy
North Palm Beach is a primarily residential community, and the economy is largely based on tourism and real estate. The city is home to several marinas, and is a popular destination for boaters and fishermen. The city is also home to several golf courses, and is a popular destination for golfers. The city is also home to several restaurants and shops, and is a popular destination for shopping and dining.
Demographics
As of the 2010 census, North Palm Beach had a population of 12,015. The racial makeup of the city was 87.3% White, 5.2% African American, 0.4% Native American, 2.2% Asian, 0.1% Pacific Islander, 2.2% from other races, and 2.7% from two or more races. Hispanic or Latino of any race were 8.7% of the population. The median household income was $60,945, and the median family income was $68,945. The per capita income was $35,945.
Conclusion
North Palm Beach is a small city located on the northern tip of Palm Beach County, Florida. The city has a population of 12,015 as of the 2010 census, and is part of the Miami metropolitan area. The economy of North Palm Beach is largely based on tourism and real estate, and the city is home to several marinas, golf courses, restaurants, and shops. The racial makeup of the city is predominantly white, with a significant Hispanic or Latino population. The median household income is $60,945, and the median family income is $68,945.
Common Questions
What is Per Capita Income in North Palm Beach?
Per Capita income in North Palm Beach is $65,939.
What is the Median Family Income in North Palm Beach?
Median Family Income in North Palm Beach is $127,204.
What is the Median Household income in North Palm Beach?
Median Household Income in North Palm Beach is $89,175.
What is Income or Wage Gap in North Palm Beach?
Income or Wage Gap in North Palm Beach is 28.0%.
Women in North Palm Beach earn 72.0 cents for every dollar earned by a man.
What is Inequality or Gini Index in North Palm Beach?
Inequality or Gini Index in North Palm Beach is 0.49.
What is the Total Population of North Palm Beach?
Total Population of North Palm Beach is 13,092.
What is the Total Male Population of North Palm Beach?
Total Male Population of North Palm Beach is 6,516.
What is the Total Female Population of North Palm Beach?
Total Female Population of North Palm Beach is 6,576.
What is the Ratio of Males per 100 Females in North Palm Beach?
There are 99.09 Males per 100 Females in North Palm Beach.
What is the Ratio of Females per 100 Males in North Palm Beach?
There are 100.92 Females per 100 Males in North Palm Beach.
What is the Median Population Age in North Palm Beach?
Median Population Age in North Palm Beach is 56.1 Years.
What is the Average Family Size in North Palm Beach
Average Family Size in North Palm Beach is 2.8 People.
What is the Average Household Size in North Palm Beach
Average Household Size in North Palm Beach is 2.0 People.
How Large is the Labor Force in North Palm Beach?
There are 6,186 People in the Labor Forcein in North Palm Beach.
What is the Percentage of People in the Labor Force in North Palm Beach?
53.0% of People are in the Labor Force in North Palm Beach.
What is the Unemployment Rate in North Palm Beach?
Unemployment Rate in North Palm Beach is 1.9%.