Oldsmar, FL Map & Demographics
Oldsmar Map
Oldsmar Overview
$37,469
PER CAPITA INCOME
$88,317
AVG FAMILY INCOME
$73,984
AVG HOUSEHOLD INCOME
16.0%
WAGE / INCOME GAP [ % ]
84.0¢/ $1
WAGE / INCOME GAP [ $ ]
0.44
INEQUALITY / GINI INDEX
14,877
TOTAL POPULATION
7,308
MALE POPULATION
7,569
FEMALE POPULATION
96.55
MALES / 100 FEMALES
103.57
FEMALES / 100 MALES
38.7
MEDIAN AGE
3.2
AVG FAMILY SIZE
2.8
AVG HOUSEHOLD SIZE
7,819
LABOR FORCE [ PEOPLE ]
65.2%
PERCENT IN LABOR FORCE
5.3%
UNEMPLOYMENT RATE
Oldsmar Zip Codes
Oldsmar Area Codes
Income in Oldsmar
Income Overview in Oldsmar
Per Capita Income in Oldsmar is $37,469, while median incomes of families and households are $88,317 and $73,984 respectively.
| Characteristic | Number | Measure |
| Per Capita Income | 14,877 | $37,469 |
| Median Family Income | 3,747 | $88,317 |
| Mean Family Income | 3,747 | $112,212 |
| Median Household Income | 5,326 | $73,984 |
| Mean Household Income | 5,326 | $100,048 |
| Income Deficit | 3,747 | $0 |
| Wage / Income Gap (%) | 14,877 | 15.97% |
| Wage / Income Gap ($) | 14,877 | 84.03¢ per $1 |
| Gini / Inequality Index | 14,877 | 0.44 |
Earnings by Sex in Oldsmar
Average Earnings in Oldsmar are $41,358, $47,296 for men and $39,745 for women, a difference of 16.0%.
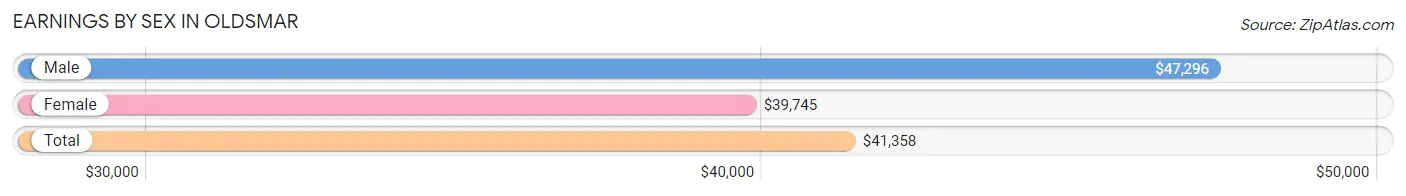
| Sex | Number | Average Earnings |
| Male | 4,149 (52.7%) | $47,296 |
| Female | 3,727 (47.3%) | $39,745 |
| Total | 7,876 (100.0%) | $41,358 |
Earnings by Sex by Income Bracket in Oldsmar
The most common earnings brackets in Oldsmar are $100,000+ for men (908 | 21.9%) and $40,000 to $44,999 for women (394 | 10.6%).
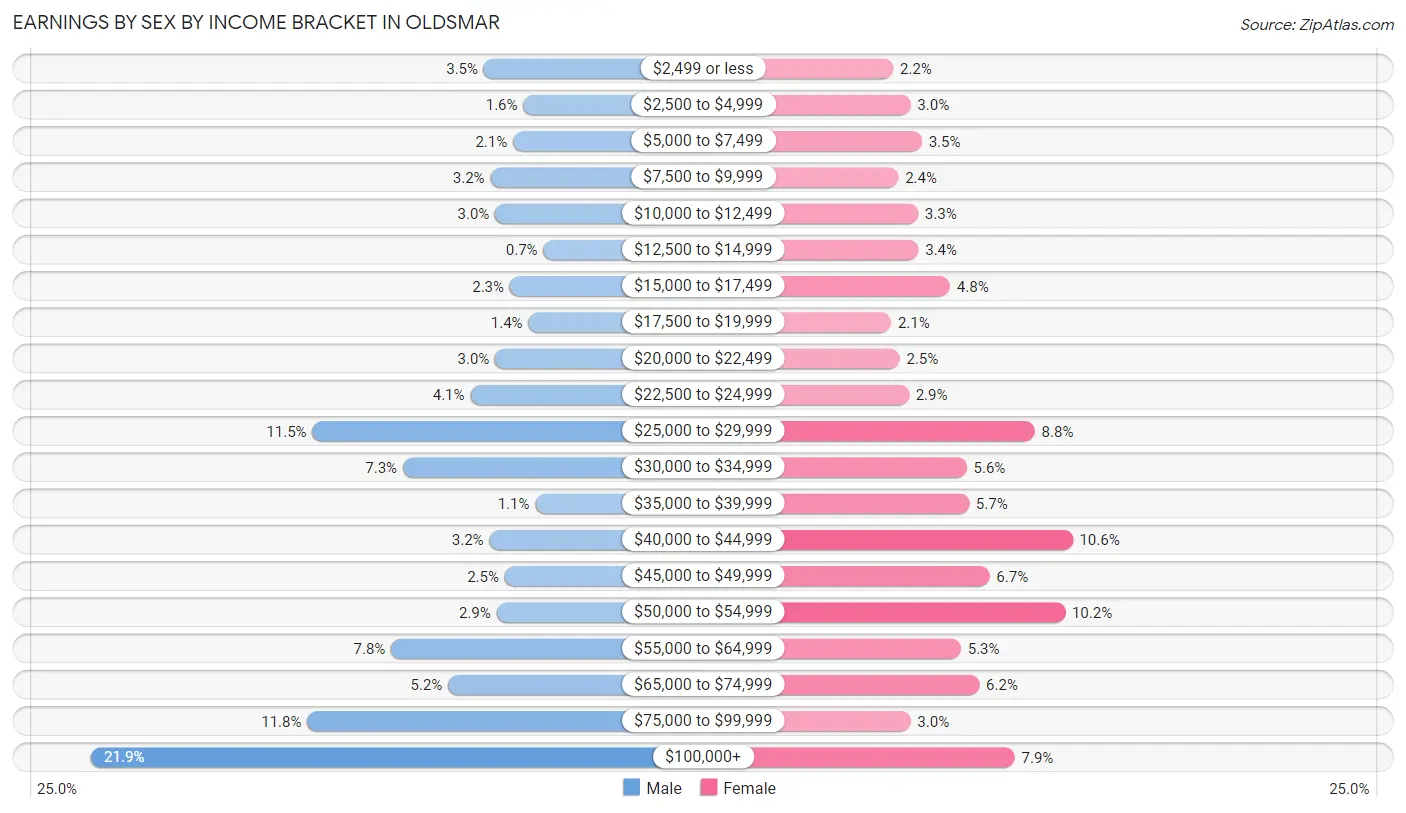
| Income | Male | Female |
| $2,499 or less | 145 (3.5%) | 81 (2.2%) |
| $2,500 to $4,999 | 68 (1.6%) | 111 (3.0%) |
| $5,000 to $7,499 | 88 (2.1%) | 131 (3.5%) |
| $7,500 to $9,999 | 132 (3.2%) | 90 (2.4%) |
| $10,000 to $12,499 | 123 (3.0%) | 124 (3.3%) |
| $12,500 to $14,999 | 29 (0.7%) | 125 (3.4%) |
| $15,000 to $17,499 | 94 (2.3%) | 180 (4.8%) |
| $17,500 to $19,999 | 58 (1.4%) | 77 (2.1%) |
| $20,000 to $22,499 | 123 (3.0%) | 92 (2.5%) |
| $22,500 to $24,999 | 171 (4.1%) | 108 (2.9%) |
| $25,000 to $29,999 | 478 (11.5%) | 328 (8.8%) |
| $30,000 to $34,999 | 302 (7.3%) | 209 (5.6%) |
| $35,000 to $39,999 | 45 (1.1%) | 213 (5.7%) |
| $40,000 to $44,999 | 134 (3.2%) | 394 (10.6%) |
| $45,000 to $49,999 | 104 (2.5%) | 249 (6.7%) |
| $50,000 to $54,999 | 120 (2.9%) | 381 (10.2%) |
| $55,000 to $64,999 | 325 (7.8%) | 199 (5.3%) |
| $65,000 to $74,999 | 214 (5.2%) | 231 (6.2%) |
| $75,000 to $99,999 | 488 (11.8%) | 111 (3.0%) |
| $100,000+ | 908 (21.9%) | 293 (7.9%) |
| Total | 4,149 (100.0%) | 3,727 (100.0%) |
Earnings by Sex by Educational Attainment in Oldsmar
Average earnings in Oldsmar are $58,659 for men and $41,798 for women, a difference of 28.7%. Men with an educational attainment of graduate degree enjoy the highest average annual earnings of $133,470, while those with high school diploma education earn the least with $35,417. Women with an educational attainment of graduate degree earn the most with the average annual earnings of $52,336, while those with high school diploma education have the smallest earnings of $32,604.
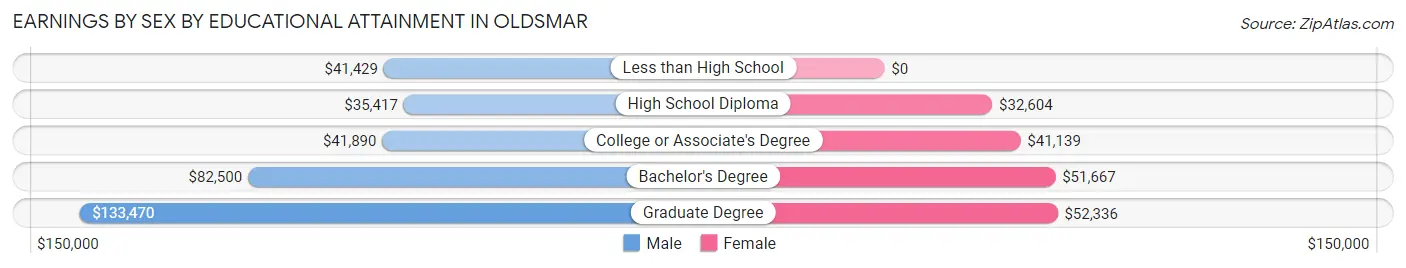
| Educational Attainment | Male Income | Female Income |
| Less than High School | $41,429 | $0 |
| High School Diploma | $35,417 | $32,604 |
| College or Associate's Degree | $41,890 | $41,139 |
| Bachelor's Degree | $82,500 | $51,667 |
| Graduate Degree | $133,470 | $52,336 |
| Total | $58,659 | $41,798 |
Family Income in Oldsmar
Family Income Brackets in Oldsmar
According to the Oldsmar family income data, there are 776 families falling into the $100,000 to $149,999 income range, which is the most common income bracket and makes up 20.7% of all families. Conversely, the $10,000 to $14,999 income bracket is the least frequent group with only 71 families (1.9%) belonging to this category.
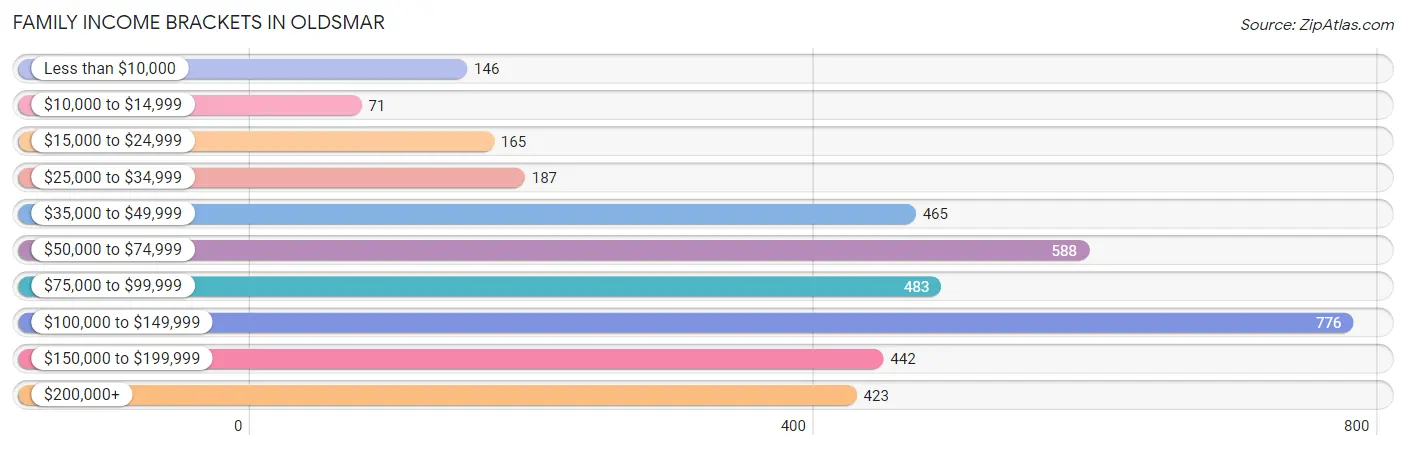
| Income Bracket | # Families | % Families |
| Less than $10,000 | 146 | 3.9% |
| $10,000 to $14,999 | 71 | 1.9% |
| $15,000 to $24,999 | 165 | 4.4% |
| $25,000 to $34,999 | 187 | 5.0% |
| $35,000 to $49,999 | 465 | 12.4% |
| $50,000 to $74,999 | 588 | 15.7% |
| $75,000 to $99,999 | 483 | 12.9% |
| $100,000 to $149,999 | 776 | 20.7% |
| $150,000 to $199,999 | 442 | 11.8% |
| $200,000+ | 423 | 11.3% |
Family Income by Famaliy Size in Oldsmar
3-person families (867 | 23.1%) account for the highest median family income in Oldsmar with $115,875 per family, while 2-person families (1,718 | 45.9%) have the highest median income of $39,730 per family member.
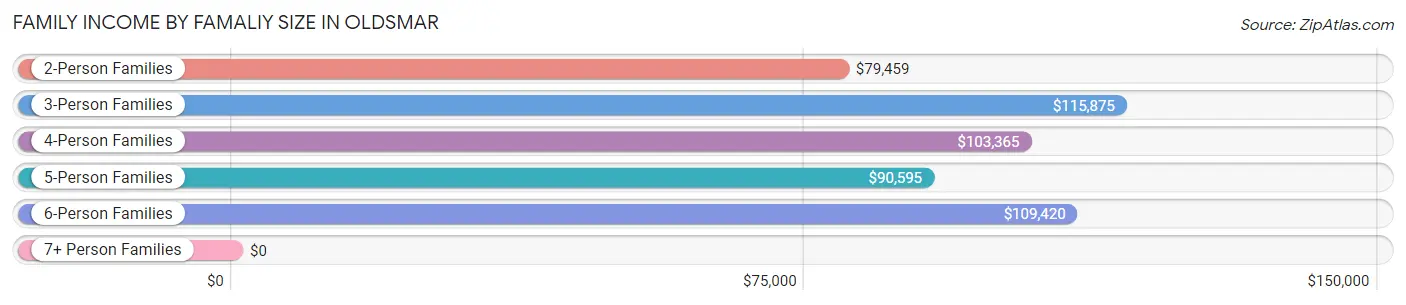
| Income Bracket | # Families | Median Income |
| 2-Person Families | 1,718 (45.9%) | $79,459 |
| 3-Person Families | 867 (23.1%) | $115,875 |
| 4-Person Families | 857 (22.9%) | $103,365 |
| 5-Person Families | 248 (6.6%) | $90,595 |
| 6-Person Families | 57 (1.5%) | $109,420 |
| 7+ Person Families | 0 (0.0%) | $0 |
| Total | 3,747 (100.0%) | $88,317 |
Family Income by Number of Earners in Oldsmar
The median family income in Oldsmar is $88,317, with families comprising 3+ earners (418) having the highest median family income of $153,333, while families with no earners (620) have the lowest median family income of $30,250, accounting for 11.2% and 16.6% of families, respectively.
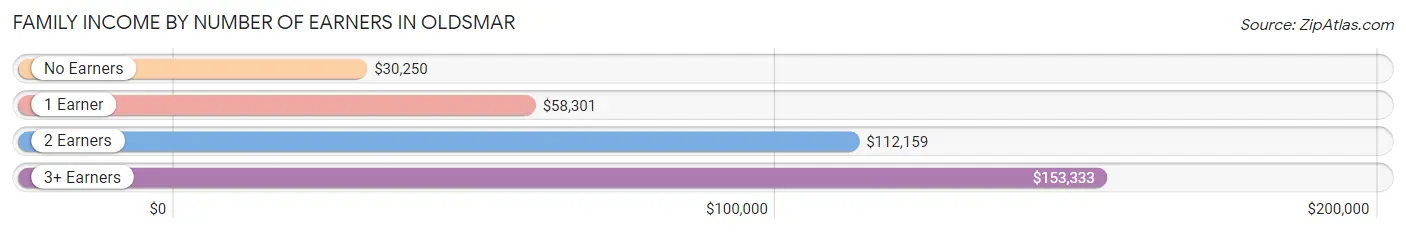
| Number of Earners | # Families | Median Income |
| No Earners | 620 (16.6%) | $30,250 |
| 1 Earner | 1,043 (27.8%) | $58,301 |
| 2 Earners | 1,666 (44.5%) | $112,159 |
| 3+ Earners | 418 (11.2%) | $153,333 |
| Total | 3,747 (100.0%) | $88,317 |
Household Income in Oldsmar
Household Income Brackets in Oldsmar
With 932 households falling in the category, the $100,000 to $149,999 income range is the most frequent in Oldsmar, accounting for 17.5% of all households. In contrast, only 85 households (1.6%) fall into the $10,000 to $14,999 income bracket, making it the least populous group.
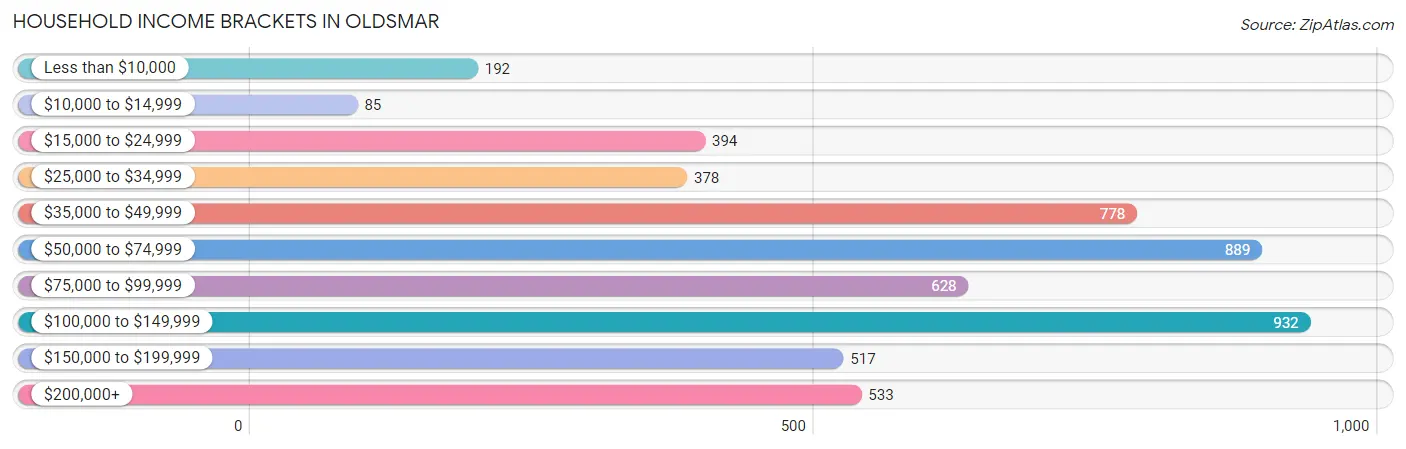
| Income Bracket | # Households | % Households |
| Less than $10,000 | 192 | 3.6% |
| $10,000 to $14,999 | 85 | 1.6% |
| $15,000 to $24,999 | 394 | 7.4% |
| $25,000 to $34,999 | 378 | 7.1% |
| $35,000 to $49,999 | 778 | 14.6% |
| $50,000 to $74,999 | 889 | 16.7% |
| $75,000 to $99,999 | 628 | 11.8% |
| $100,000 to $149,999 | 932 | 17.5% |
| $150,000 to $199,999 | 517 | 9.7% |
| $200,000+ | 533 | 10.0% |
Household Income by Householder Age in Oldsmar
The median household income in Oldsmar is $73,984, with the highest median household income of $103,010 found in the 45 to 64 years age bracket for the primary householder. A total of 2,213 households (41.5%) fall into this category. Meanwhile, the 15 to 24 years age bracket for the primary householder has the lowest median household income of $0, with 80 households (1.5%) in this group.
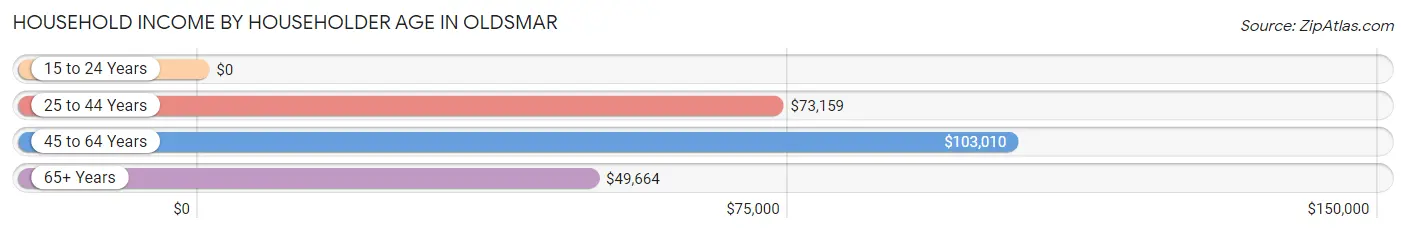
| Income Bracket | # Households | Median Income |
| 15 to 24 Years | 80 (1.5%) | $0 |
| 25 to 44 Years | 1,681 (31.6%) | $73,159 |
| 45 to 64 Years | 2,213 (41.5%) | $103,010 |
| 65+ Years | 1,352 (25.4%) | $49,664 |
| Total | 5,326 (100.0%) | $73,984 |
Poverty in Oldsmar
Income Below Poverty by Sex and Age in Oldsmar
With 15.4% poverty level for males and 12.4% for females among the residents of Oldsmar, 5 year old males and 16 and 17 year old females are the most vulnerable to poverty, with 38 males (73.1%) and 36 females (38.7%) in their respective age groups living below the poverty level.
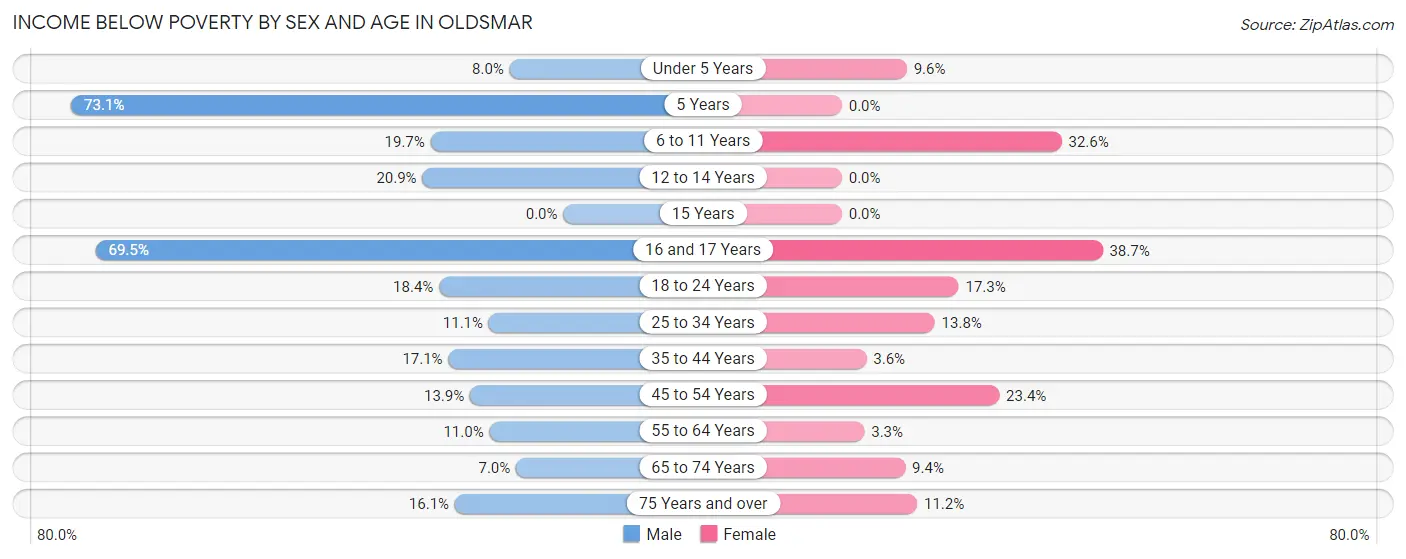
| Age Bracket | Male | Female |
| Under 5 Years | 31 (8.0%) | 45 (9.6%) |
| 5 Years | 38 (73.1%) | 0 (0.0%) |
| 6 to 11 Years | 135 (19.7%) | 154 (32.6%) |
| 12 to 14 Years | 77 (20.9%) | 0 (0.0%) |
| 15 Years | 0 (0.0%) | 0 (0.0%) |
| 16 and 17 Years | 116 (69.5%) | 36 (38.7%) |
| 18 to 24 Years | 109 (18.4%) | 111 (17.3%) |
| 25 to 34 Years | 121 (11.1%) | 147 (13.8%) |
| 35 to 44 Years | 160 (17.1%) | 32 (3.6%) |
| 45 to 54 Years | 128 (13.9%) | 240 (23.4%) |
| 55 to 64 Years | 114 (11.0%) | 43 (3.3%) |
| 65 to 74 Years | 44 (7.0%) | 78 (9.4%) |
| 75 Years and over | 43 (16.1%) | 41 (11.2%) |
| Total | 1,116 (15.4%) | 927 (12.4%) |
Income Above Poverty by Sex and Age in Oldsmar
According to the poverty statistics in Oldsmar, males aged 15 years and females aged 5 years are the age groups that are most secure financially, with 100.0% of males and 100.0% of females in these age groups living above the poverty line.
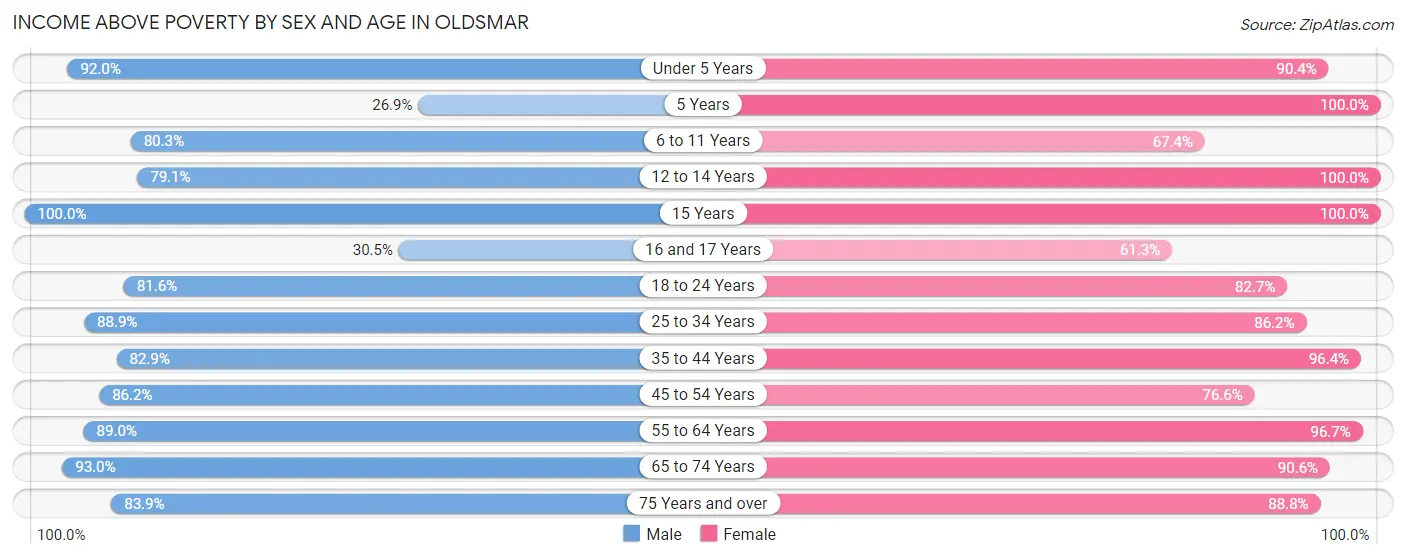
| Age Bracket | Male | Female |
| Under 5 Years | 358 (92.0%) | 422 (90.4%) |
| 5 Years | 14 (26.9%) | 17 (100.0%) |
| 6 to 11 Years | 550 (80.3%) | 318 (67.4%) |
| 12 to 14 Years | 291 (79.1%) | 245 (100.0%) |
| 15 Years | 81 (100.0%) | 84 (100.0%) |
| 16 and 17 Years | 51 (30.5%) | 57 (61.3%) |
| 18 to 24 Years | 482 (81.6%) | 529 (82.7%) |
| 25 to 34 Years | 973 (88.9%) | 919 (86.2%) |
| 35 to 44 Years | 778 (82.9%) | 847 (96.4%) |
| 45 to 54 Years | 796 (86.2%) | 787 (76.6%) |
| 55 to 64 Years | 925 (89.0%) | 1,245 (96.7%) |
| 65 to 74 Years | 584 (93.0%) | 751 (90.6%) |
| 75 Years and over | 224 (83.9%) | 326 (88.8%) |
| Total | 6,107 (84.6%) | 6,547 (87.6%) |
Income Below Poverty Among Married-Couple Families in Oldsmar
The poverty statistics for married-couple families in Oldsmar show that 11.1% or 294 of the total 2,653 families live below the poverty line. Families with 3 or 4 children have the highest poverty rate of 38.4%, comprising of 88 families. On the other hand, families with no children have the lowest poverty rate of 2.9%, which includes 47 families.
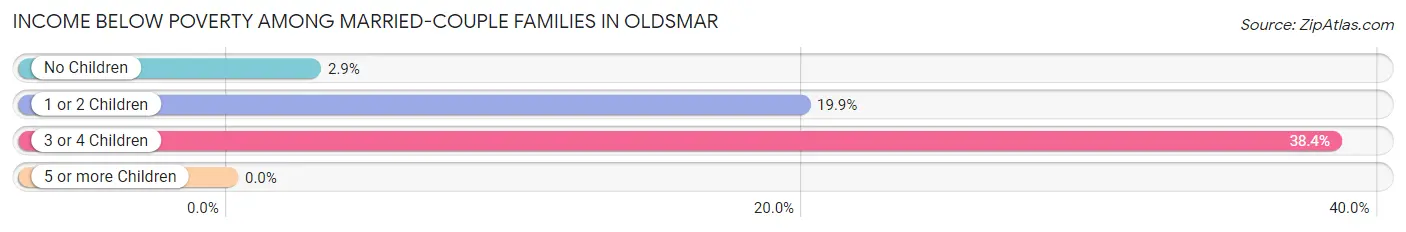
| Children | Above Poverty | Below Poverty |
| No Children | 1,579 (97.1%) | 47 (2.9%) |
| 1 or 2 Children | 639 (80.1%) | 159 (19.9%) |
| 3 or 4 Children | 141 (61.6%) | 88 (38.4%) |
| 5 or more Children | 0 (0.0%) | 0 (0.0%) |
| Total | 2,359 (88.9%) | 294 (11.1%) |
Income Below Poverty Among Single-Parent Households in Oldsmar
According to the poverty data in Oldsmar, 27.1% or 80 single-father households and 4.8% or 38 single-mother households are living below the poverty line. Among single-father households, those with 3 or 4 children have the highest poverty rate, with 63 households (100.0%) experiencing poverty. Likewise, among single-mother households, those with no children have the highest poverty rate, with 18 households (7.2%) falling below the poverty line.
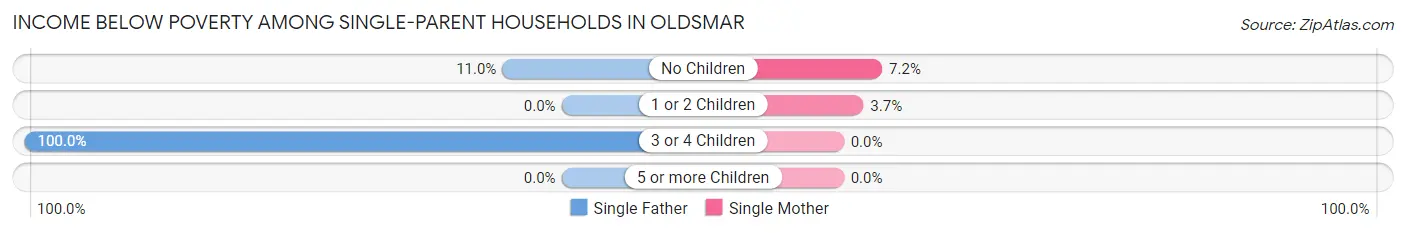
| Children | Single Father | Single Mother |
| No Children | 17 (11.0%) | 18 (7.2%) |
| 1 or 2 Children | 0 (0.0%) | 20 (3.7%) |
| 3 or 4 Children | 63 (100.0%) | 0 (0.0%) |
| 5 or more Children | 0 (0.0%) | 0 (0.0%) |
| Total | 80 (27.1%) | 38 (4.8%) |
Income Below Poverty Among Married-Couple vs Single-Parent Households in Oldsmar
The poverty data for Oldsmar shows that 294 of the married-couple family households (11.1%) and 118 of the single-parent households (10.8%) are living below the poverty level. Within the married-couple family households, those with 3 or 4 children have the highest poverty rate, with 88 households (38.4%) falling below the poverty line. Among the single-parent households, those with 3 or 4 children have the highest poverty rate, with 63 household (92.6%) living below poverty.
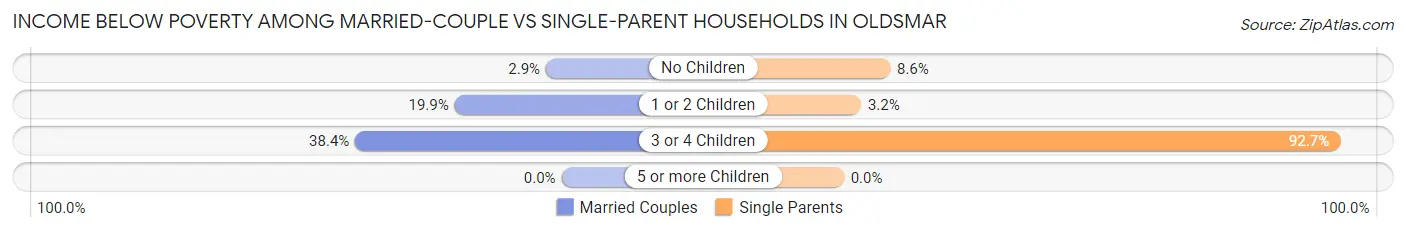
| Children | Married-Couple Families | Single-Parent Households |
| No Children | 47 (2.9%) | 35 (8.6%) |
| 1 or 2 Children | 159 (19.9%) | 20 (3.2%) |
| 3 or 4 Children | 88 (38.4%) | 63 (92.6%) |
| 5 or more Children | 0 (0.0%) | 0 (0.0%) |
| Total | 294 (11.1%) | 118 (10.8%) |
Race in Oldsmar
The most populous races in Oldsmar are White / Caucasian (11,111 | 74.7%), Hispanic or Latino (2,617 | 17.6%), and Two or more Races (1,840 | 12.4%).
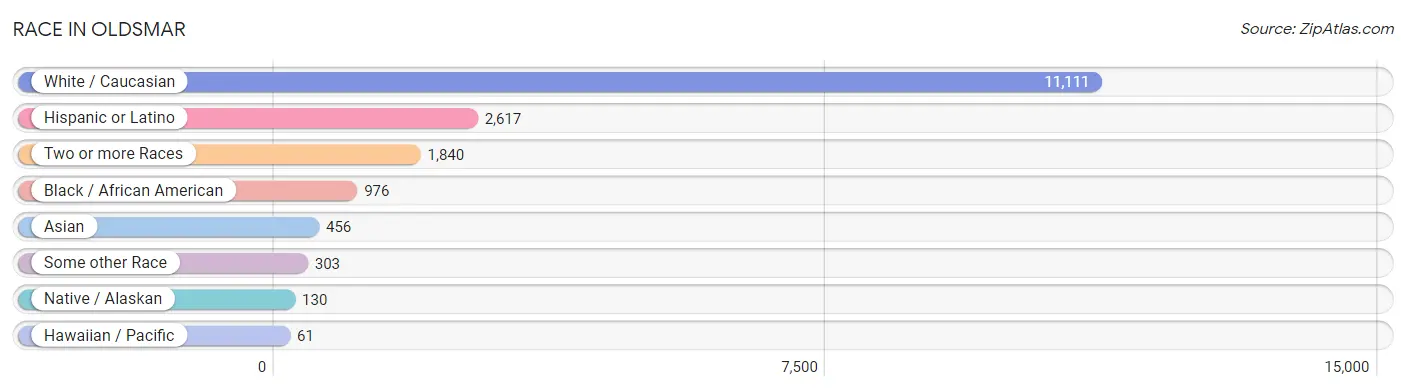
| Race | # Population | % Population |
| Asian | 456 | 3.1% |
| Black / African American | 976 | 6.6% |
| Hawaiian / Pacific | 61 | 0.4% |
| Hispanic or Latino | 2,617 | 17.6% |
| Native / Alaskan | 130 | 0.9% |
| White / Caucasian | 11,111 | 74.7% |
| Two or more Races | 1,840 | 12.4% |
| Some other Race | 303 | 2.0% |
| Total | 14,877 | 100.0% |
Ancestry in Oldsmar
The most populous ancestries reported in Oldsmar are Irish (2,024 | 13.6%), German (1,887 | 12.7%), English (1,674 | 11.3%), American (1,386 | 9.3%), and Italian (1,229 | 8.3%), together accounting for 55.1% of all Oldsmar residents.
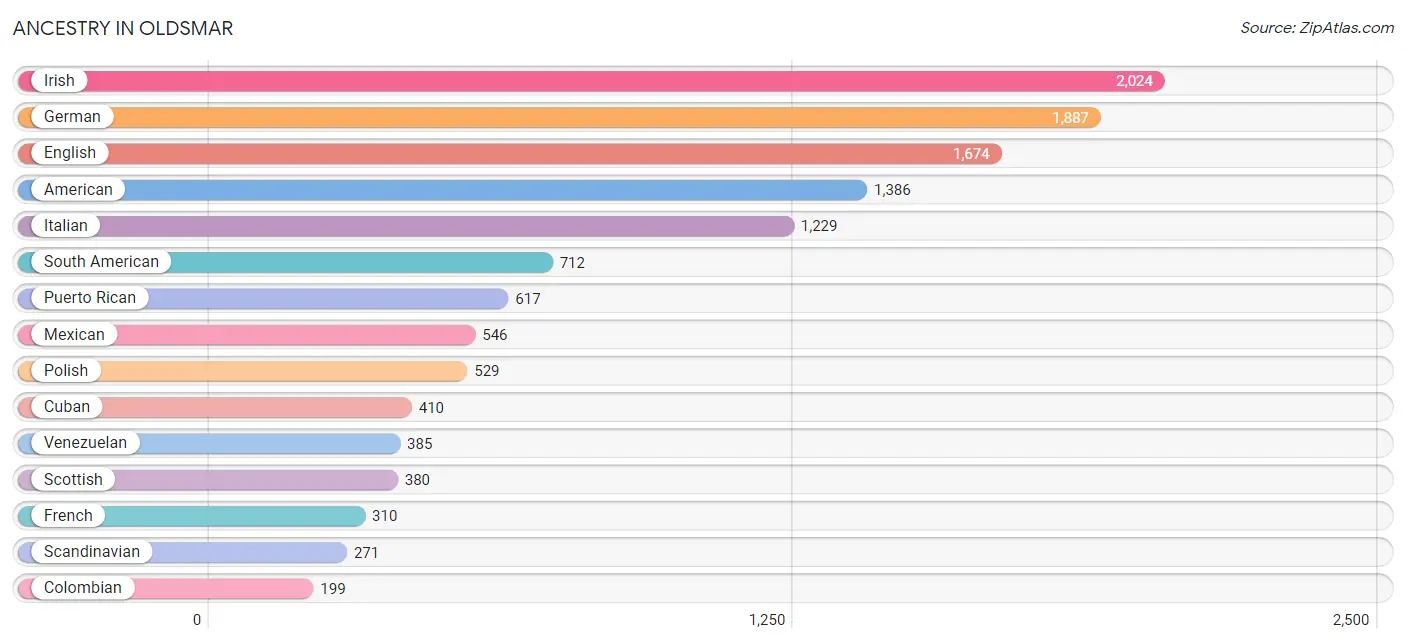
| Ancestry | # Population | % Population |
| African | 37 | 0.3% |
| American | 1,386 | 9.3% |
| Arab | 112 | 0.7% |
| Australian | 13 | 0.1% |
| Austrian | 65 | 0.4% |
| British | 39 | 0.3% |
| Bulgarian | 72 | 0.5% |
| Burmese | 24 | 0.2% |
| Canadian | 19 | 0.1% |
| Celtic | 29 | 0.2% |
| Central American | 120 | 0.8% |
| Cherokee | 6 | 0.0% |
| Chilean | 21 | 0.1% |
| Choctaw | 37 | 0.3% |
| Colombian | 199 | 1.3% |
| Croatian | 15 | 0.1% |
| Cuban | 410 | 2.8% |
| Czech | 28 | 0.2% |
| Danish | 65 | 0.4% |
| Dominican | 91 | 0.6% |
| Dutch | 114 | 0.8% |
| Ecuadorian | 40 | 0.3% |
| Egyptian | 14 | 0.1% |
| English | 1,674 | 11.3% |
| Estonian | 16 | 0.1% |
| European | 69 | 0.5% |
| Finnish | 67 | 0.4% |
| French | 310 | 2.1% |
| French Canadian | 98 | 0.7% |
| German | 1,887 | 12.7% |
| Greek | 178 | 1.2% |
| Guatemalan | 56 | 0.4% |
| Haitian | 11 | 0.1% |
| Hungarian | 92 | 0.6% |
| Indian (Asian) | 180 | 1.2% |
| Iranian | 11 | 0.1% |
| Irish | 2,024 | 13.6% |
| Italian | 1,229 | 8.3% |
| Jamaican | 21 | 0.1% |
| Korean | 165 | 1.1% |
| Lebanese | 22 | 0.2% |
| Lithuanian | 6 | 0.0% |
| Mexican | 546 | 3.7% |
| Northern European | 14 | 0.1% |
| Norwegian | 26 | 0.2% |
| Pakistani | 41 | 0.3% |
| Palestinian | 56 | 0.4% |
| Panamanian | 8 | 0.1% |
| Peruvian | 67 | 0.4% |
| Polish | 529 | 3.6% |
| Portuguese | 47 | 0.3% |
| Puerto Rican | 617 | 4.2% |
| Romanian | 56 | 0.4% |
| Russian | 40 | 0.3% |
| Salvadoran | 56 | 0.4% |
| Samoan | 32 | 0.2% |
| Scandinavian | 271 | 1.8% |
| Scotch-Irish | 191 | 1.3% |
| Scottish | 380 | 2.5% |
| Sioux | 130 | 0.9% |
| Slovak | 34 | 0.2% |
| South American | 712 | 4.8% |
| Spaniard | 9 | 0.1% |
| Sri Lankan | 139 | 0.9% |
| Subsaharan African | 37 | 0.3% |
| Swedish | 196 | 1.3% |
| Swiss | 7 | 0.1% |
| Syrian | 20 | 0.1% |
| Thai | 132 | 0.9% |
| Turkish | 5 | 0.0% |
| Ukrainian | 19 | 0.1% |
| Venezuelan | 385 | 2.6% |
| Welsh | 41 | 0.3% | View All 73 Rows |
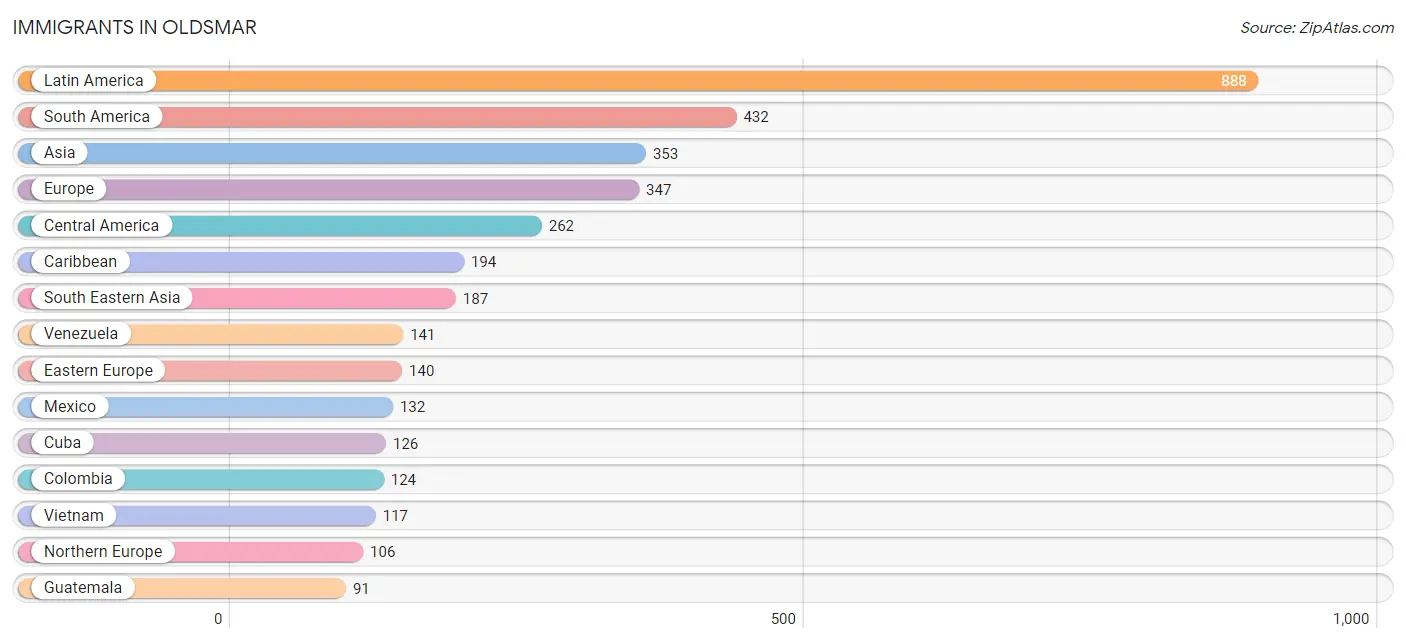
Immigrants in Oldsmar
The most numerous immigrant groups reported in Oldsmar came from Latin America (888 | 6.0%), South America (432 | 2.9%), Asia (353 | 2.4%), Europe (347 | 2.3%), and Central America (262 | 1.8%), together accounting for 15.3% of all Oldsmar residents.
| Immigration Origin | # Population | % Population |
| Africa | 15 | 0.1% |
| Asia | 353 | 2.4% |
| Australia | 13 | 0.1% |
| Brazil | 36 | 0.2% |
| Bulgaria | 29 | 0.2% |
| Canada | 45 | 0.3% |
| Caribbean | 194 | 1.3% |
| Central America | 262 | 1.8% |
| China | 69 | 0.5% |
| Colombia | 124 | 0.8% |
| Croatia | 15 | 0.1% |
| Cuba | 126 | 0.9% |
| Eastern Africa | 15 | 0.1% |
| Eastern Asia | 81 | 0.5% |
| Eastern Europe | 140 | 0.9% |
| Ecuador | 21 | 0.1% |
| El Salvador | 15 | 0.1% |
| England | 58 | 0.4% |
| Europe | 347 | 2.3% |
| France | 25 | 0.2% |
| Greece | 76 | 0.5% |
| Grenada | 12 | 0.1% |
| Guatemala | 91 | 0.6% |
| Guyana | 57 | 0.4% |
| Haiti | 11 | 0.1% |
| Hong Kong | 13 | 0.1% |
| India | 60 | 0.4% |
| Iran | 11 | 0.1% |
| Jamaica | 21 | 0.1% |
| Korea | 12 | 0.1% |
| Kuwait | 14 | 0.1% |
| Latin America | 888 | 6.0% |
| Mexico | 132 | 0.9% |
| Northern Europe | 106 | 0.7% |
| Oceania | 49 | 0.3% |
| Panama | 24 | 0.2% |
| Peru | 53 | 0.4% |
| Philippines | 61 | 0.4% |
| Poland | 48 | 0.3% |
| Romania | 43 | 0.3% |
| South America | 432 | 2.9% |
| South Central Asia | 71 | 0.5% |
| South Eastern Asia | 187 | 1.3% |
| Southern Europe | 76 | 0.5% |
| Thailand | 9 | 0.1% |
| Trinidad and Tobago | 24 | 0.2% |
| Ukraine | 5 | 0.0% |
| Venezuela | 141 | 0.9% |
| Vietnam | 117 | 0.8% |
| Western Asia | 14 | 0.1% |
| Western Europe | 25 | 0.2% | View All 51 Rows |
Sex and Age in Oldsmar
Sex and Age in Oldsmar
The most populous age groups in Oldsmar are 10 to 14 Years (718 | 9.8%) for men and 25 to 29 Years (684 | 9.0%) for women.
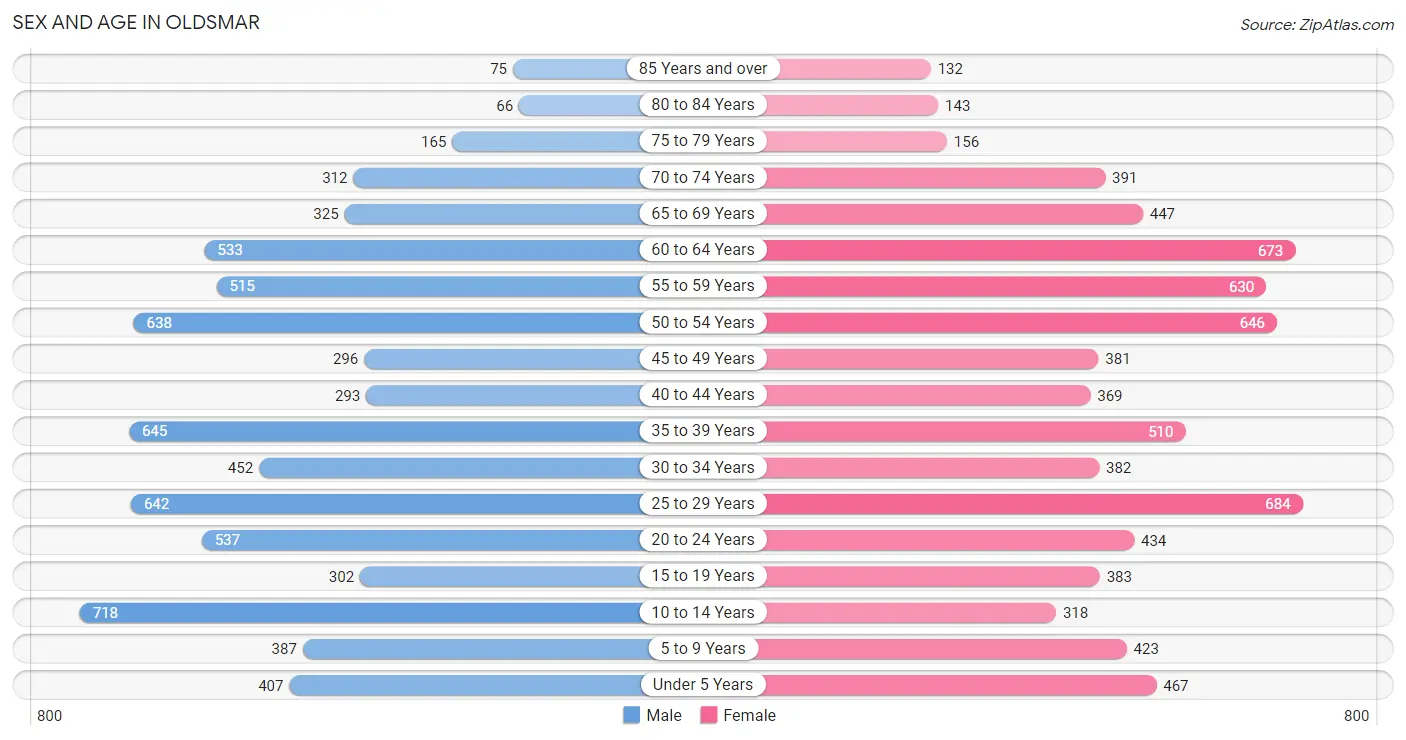
| Age Bracket | Male | Female |
| Under 5 Years | 407 (5.6%) | 467 (6.2%) |
| 5 to 9 Years | 387 (5.3%) | 423 (5.6%) |
| 10 to 14 Years | 718 (9.8%) | 318 (4.2%) |
| 15 to 19 Years | 302 (4.1%) | 383 (5.1%) |
| 20 to 24 Years | 537 (7.3%) | 434 (5.7%) |
| 25 to 29 Years | 642 (8.8%) | 684 (9.0%) |
| 30 to 34 Years | 452 (6.2%) | 382 (5.1%) |
| 35 to 39 Years | 645 (8.8%) | 510 (6.7%) |
| 40 to 44 Years | 293 (4.0%) | 369 (4.9%) |
| 45 to 49 Years | 296 (4.1%) | 381 (5.0%) |
| 50 to 54 Years | 638 (8.7%) | 646 (8.5%) |
| 55 to 59 Years | 515 (7.0%) | 630 (8.3%) |
| 60 to 64 Years | 533 (7.3%) | 673 (8.9%) |
| 65 to 69 Years | 325 (4.4%) | 447 (5.9%) |
| 70 to 74 Years | 312 (4.3%) | 391 (5.2%) |
| 75 to 79 Years | 165 (2.3%) | 156 (2.1%) |
| 80 to 84 Years | 66 (0.9%) | 143 (1.9%) |
| 85 Years and over | 75 (1.0%) | 132 (1.7%) |
| Total | 7,308 (100.0%) | 7,569 (100.0%) |
Families and Households in Oldsmar
Median Family Size in Oldsmar
The median family size in Oldsmar is 3.25 persons per family, with single female/mother families (799 | 21.3%) accounting for the largest median family size of 3.28 persons per family. On the other hand, single male/father families (295 | 7.9%) represent the smallest median family size with 3.13 persons per family.
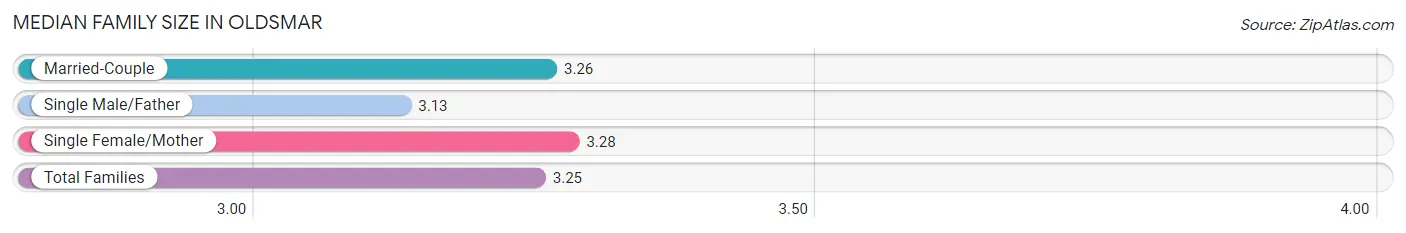
| Family Type | # Families | Family Size |
| Married-Couple | 2,653 (70.8%) | 3.26 |
| Single Male/Father | 295 (7.9%) | 3.13 |
| Single Female/Mother | 799 (21.3%) | 3.28 |
| Total Families | 3,747 (100.0%) | 3.25 |
Median Household Size in Oldsmar
The median household size in Oldsmar is 2.76 persons per household, with single male/father households (295 | 5.5%) accounting for the largest median household size of 3.6 persons per household. non-family households (1,579 | 29.6%) represent the smallest median household size with 1.39 persons per household.
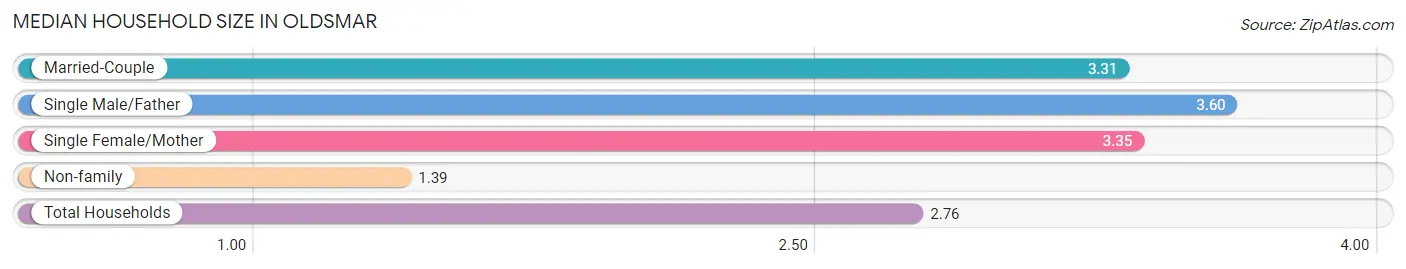
| Household Type | # Households | Household Size |
| Married-Couple | 2,653 (49.8%) | 3.31 |
| Single Male/Father | 295 (5.5%) | 3.60 |
| Single Female/Mother | 799 (15.0%) | 3.35 |
| Non-family | 1,579 (29.6%) | 1.39 |
| Total Households | 5,326 (100.0%) | 2.76 |
Household Size by Marriage Status in Oldsmar
Out of a total of 5,326 households in Oldsmar, 3,747 (70.4%) are family households, while 1,579 (29.6%) are nonfamily households. The most numerous type of family households are 2-person households, comprising 1,666, and the most common type of nonfamily households are 1-person households, comprising 1,211.
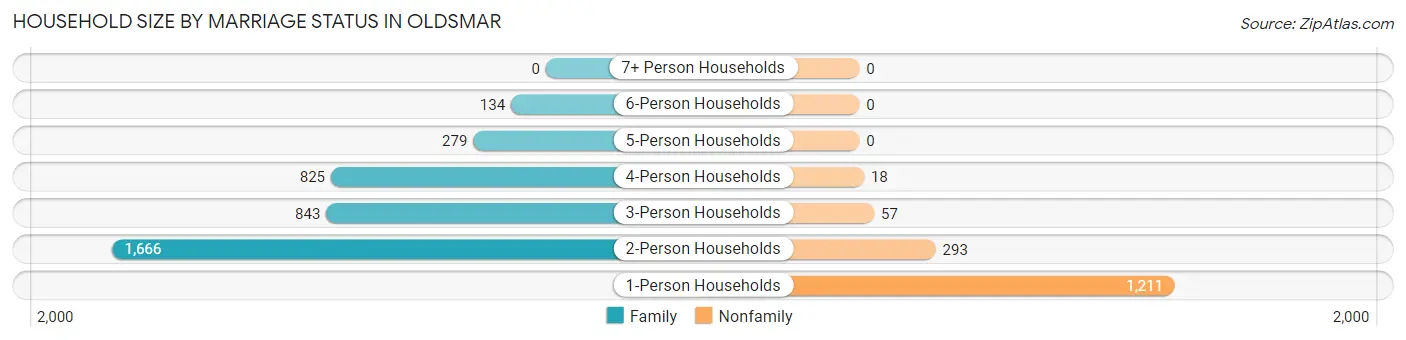
| Household Size | Family Households | Nonfamily Households |
| 1-Person Households | - | 1,211 (22.7%) |
| 2-Person Households | 1,666 (31.3%) | 293 (5.5%) |
| 3-Person Households | 843 (15.8%) | 57 (1.1%) |
| 4-Person Households | 825 (15.5%) | 18 (0.3%) |
| 5-Person Households | 279 (5.2%) | 0 (0.0%) |
| 6-Person Households | 134 (2.5%) | 0 (0.0%) |
| 7+ Person Households | 0 (0.0%) | 0 (0.0%) |
| Total | 3,747 (70.4%) | 1,579 (29.6%) |
Female Fertility in Oldsmar
Fertility by Age in Oldsmar
Average fertility rate in Oldsmar is 34.0 births per 1,000 women. Women in the age bracket of 35 to 50 years have the highest fertility rate with 42.0 births per 1,000 women. Women in the age bracket of 35 to 50 years acount for 54.9% of all women with births.
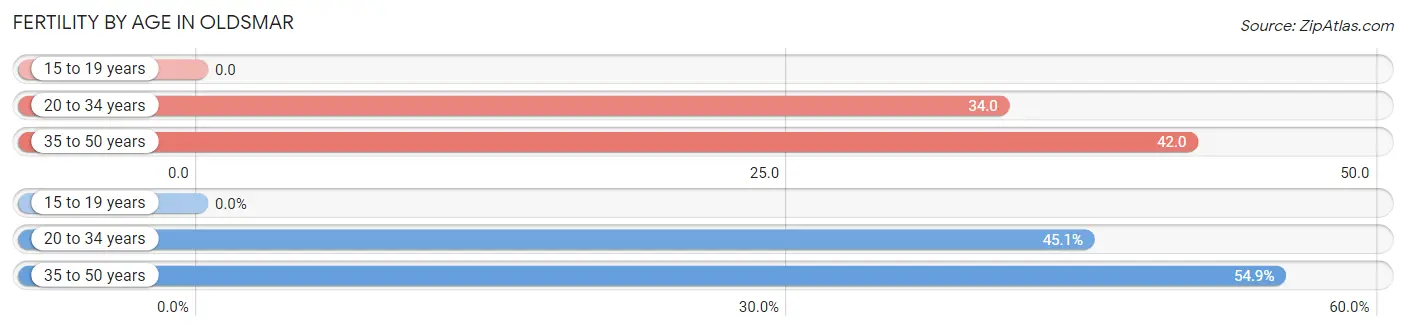
| Age Bracket | Women with Births | Births / 1,000 Women |
| 15 to 19 years | 0 (0.0%) | 0.0 |
| 20 to 34 years | 51 (45.1%) | 34.0 |
| 35 to 50 years | 62 (54.9%) | 42.0 |
| Total | 113 (100.0%) | 34.0 |
Fertility by Age by Marriage Status in Oldsmar
81.4% of women with births (113) in Oldsmar are married. The highest percentage of unmarried women with births falls into 20 to 34 years age bracket with 41.2% of them unmarried at the time of birth, while the lowest percentage of unmarried women with births belong to 35 to 50 years age bracket with 0.0% of them unmarried.
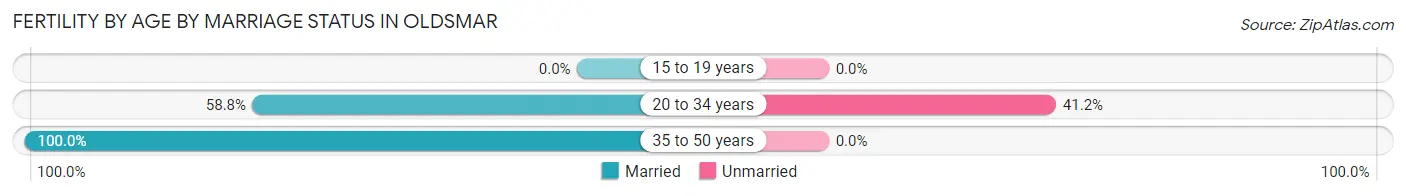
| Age Bracket | Married | Unmarried |
| 15 to 19 years | 0 (0.0%) | 0 (0.0%) |
| 20 to 34 years | 30 (58.8%) | 21 (41.2%) |
| 35 to 50 years | 62 (100.0%) | 0 (0.0%) |
| Total | 92 (81.4%) | 21 (18.6%) |
Fertility by Education in Oldsmar
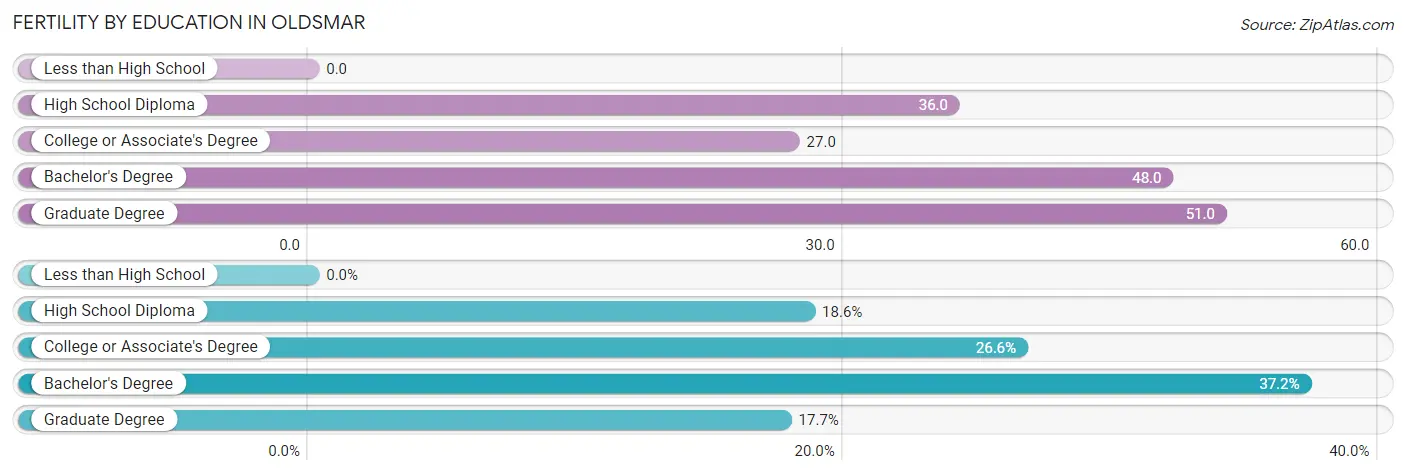
| Educational Attainment | Women with Births | Births / 1,000 Women |
| Less than High School | 0 (0.0%) | 0.0 |
| High School Diploma | 21 (18.6%) | 36.0 |
| College or Associate's Degree | 30 (26.6%) | 27.0 |
| Bachelor's Degree | 42 (37.2%) | 48.0 |
| Graduate Degree | 20 (17.7%) | 51.0 |
| Total | 113 (100.0%) | 34.0 |
Fertility by Education by Marriage Status in Oldsmar
18.6% of women with births in Oldsmar are unmarried. Women with the educational attainment of college or associate's degree are most likely to be married with 100.0% of them married at childbirth, while women with the educational attainment of high school diploma are least likely to be married with 100.0% of them unmarried at childbirth.
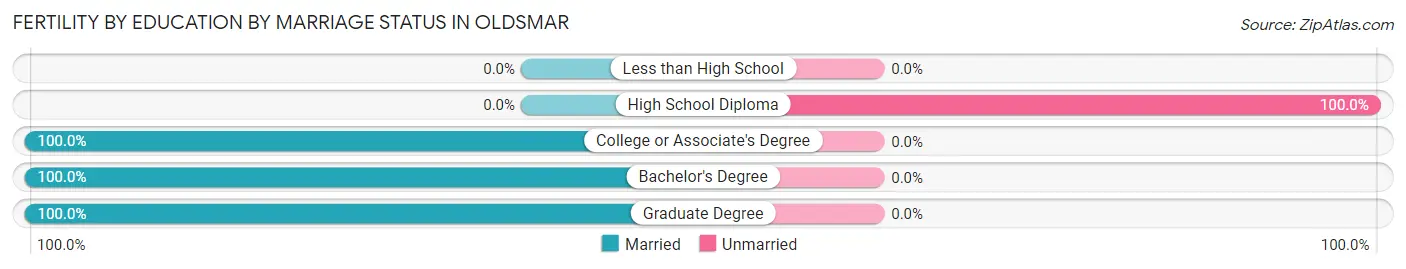
| Educational Attainment | Married | Unmarried |
| Less than High School | 0 (0.0%) | 0 (0.0%) |
| High School Diploma | 0 (0.0%) | 21 (100.0%) |
| College or Associate's Degree | 30 (100.0%) | 0 (0.0%) |
| Bachelor's Degree | 42 (100.0%) | 0 (0.0%) |
| Graduate Degree | 20 (100.0%) | 0 (0.0%) |
| Total | 92 (81.4%) | 21 (18.6%) |
Employment Characteristics in Oldsmar
Employment by Class of Employer in Oldsmar
Among the 7,320 employed individuals in Oldsmar, private company employees (5,604 | 76.6%), local government employees (420 | 5.7%), and self-employed (not incorporated) (415 | 5.7%) make up the most common classes of employment.
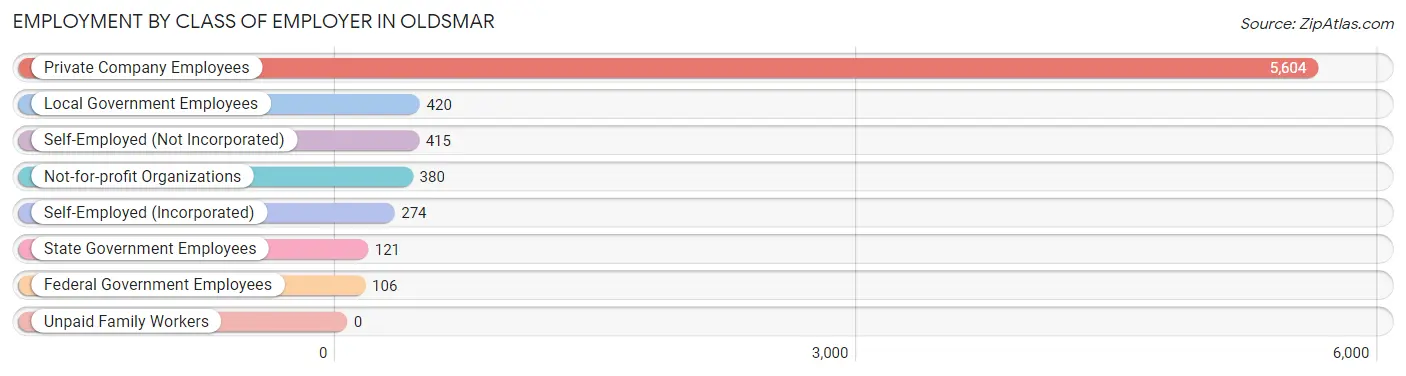
| Employer Class | # Employees | % Employees |
| Private Company Employees | 5,604 | 76.6% |
| Self-Employed (Incorporated) | 274 | 3.7% |
| Self-Employed (Not Incorporated) | 415 | 5.7% |
| Not-for-profit Organizations | 380 | 5.2% |
| Local Government Employees | 420 | 5.7% |
| State Government Employees | 121 | 1.7% |
| Federal Government Employees | 106 | 1.5% |
| Unpaid Family Workers | 0 | 0.0% |
| Total | 7,320 | 100.0% |
Employment Status by Age in Oldsmar
According to the labor force statistics for Oldsmar, out of the total population over 16 years of age (11,992), 65.2% or 7,819 individuals are in the labor force, with 5.3% or 414 of them unemployed. The age group with the highest labor force participation rate is 30 to 34 years, with 89.9% or 750 individuals in the labor force. Within the labor force, the 60 to 64 years age range has the highest percentage of unemployed individuals, with 12.4% or 100 of them being unemployed.
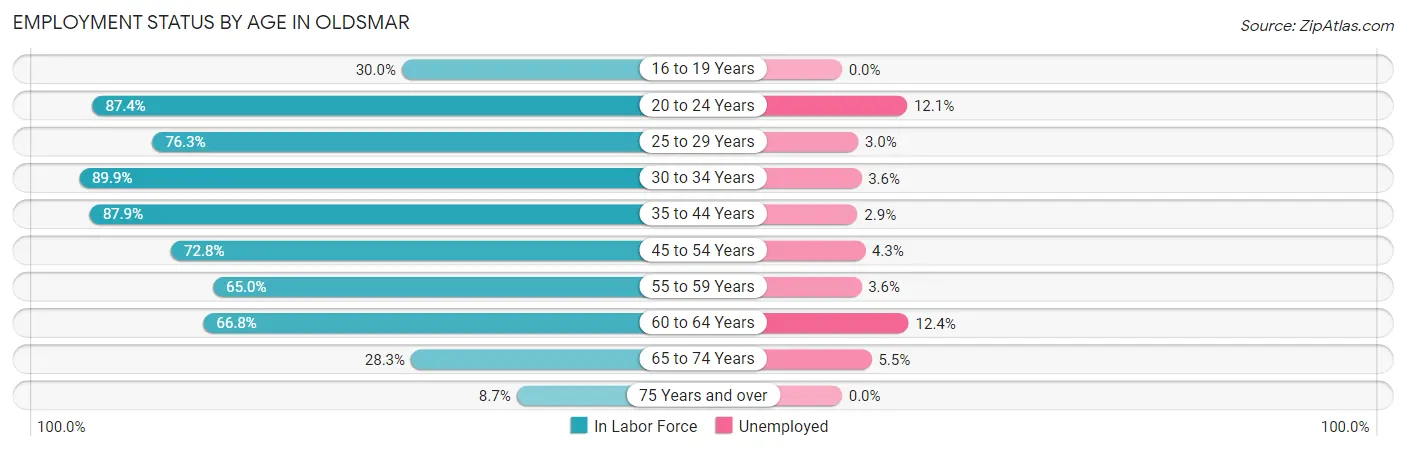
| Age Bracket | In Labor Force | Unemployed |
| 16 to 19 Years | 156 (30.0%) | 0 (0.0%) |
| 20 to 24 Years | 849 (87.4%) | 103 (12.1%) |
| 25 to 29 Years | 1,012 (76.3%) | 30 (3.0%) |
| 30 to 34 Years | 750 (89.9%) | 27 (3.6%) |
| 35 to 44 Years | 1,597 (87.9%) | 46 (2.9%) |
| 45 to 54 Years | 1,428 (72.8%) | 61 (4.3%) |
| 55 to 59 Years | 744 (65.0%) | 27 (3.6%) |
| 60 to 64 Years | 806 (66.8%) | 100 (12.4%) |
| 65 to 74 Years | 417 (28.3%) | 23 (5.5%) |
| 75 Years and over | 64 (8.7%) | 0 (0.0%) |
| Total | 7,819 (65.2%) | 414 (5.3%) |
Employment Status by Educational Attainment in Oldsmar
According to labor force statistics for Oldsmar, 76.5% of individuals (6,341) out of the total population between 25 and 64 years of age (8,289) are in the labor force, with 4.6% or 292 of them being unemployed. The group with the highest labor force participation rate are those with the educational attainment of college / associate degree, with 83.7% or 2,260 individuals in the labor force. Within the labor force, individuals with less than high school education have the highest percentage of unemployment, with 9.6% or 15 of them being unemployed.
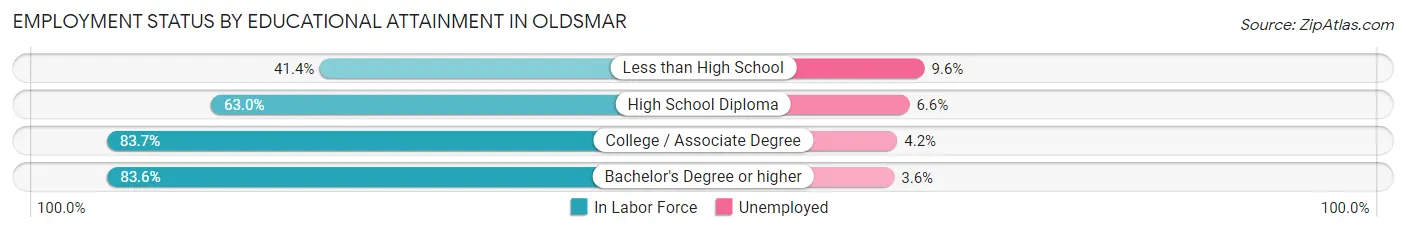
| Educational Attainment | In Labor Force | Unemployed |
| Less than High School | 156 (41.4%) | 36 (9.6%) |
| High School Diploma | 1,332 (63.0%) | 140 (6.6%) |
| College / Associate Degree | 2,260 (83.7%) | 113 (4.2%) |
| Bachelor's Degree or higher | 2,590 (83.6%) | 112 (3.6%) |
| Total | 6,341 (76.5%) | 381 (4.6%) |
Employment Occupations by Sex in Oldsmar
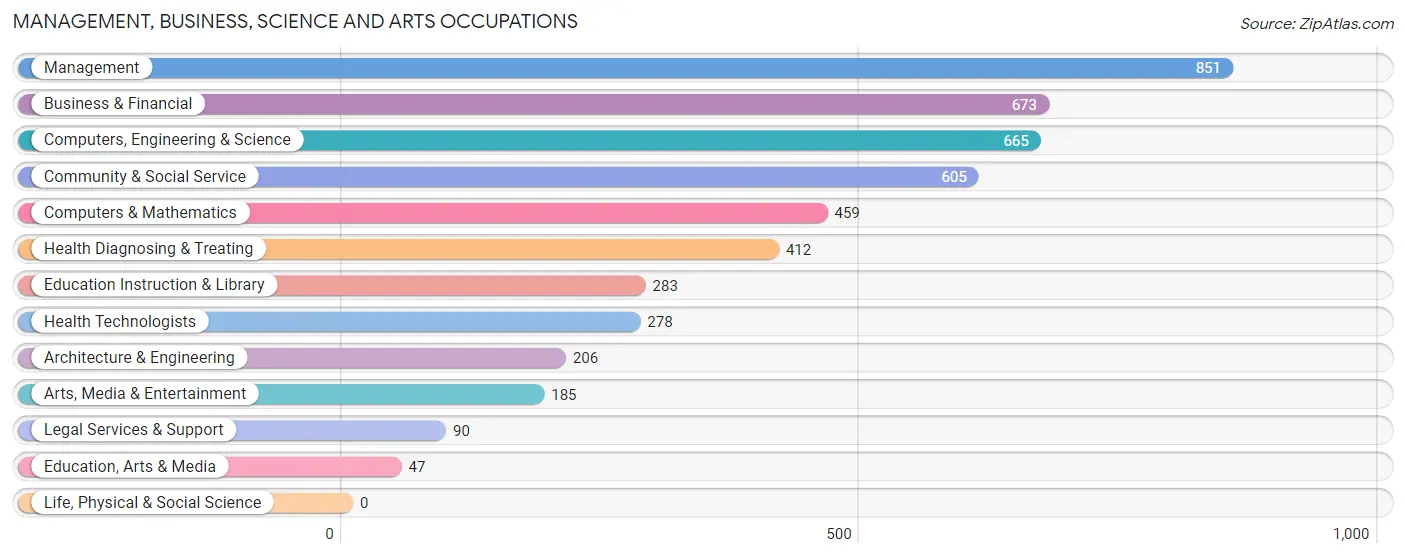
Management, Business, Science and Arts Occupations
The most common Management, Business, Science and Arts occupations in Oldsmar are Management (851 | 11.5%), Business & Financial (673 | 9.1%), Computers, Engineering & Science (665 | 9.0%), Community & Social Service (605 | 8.2%), and Computers & Mathematics (459 | 6.2%).
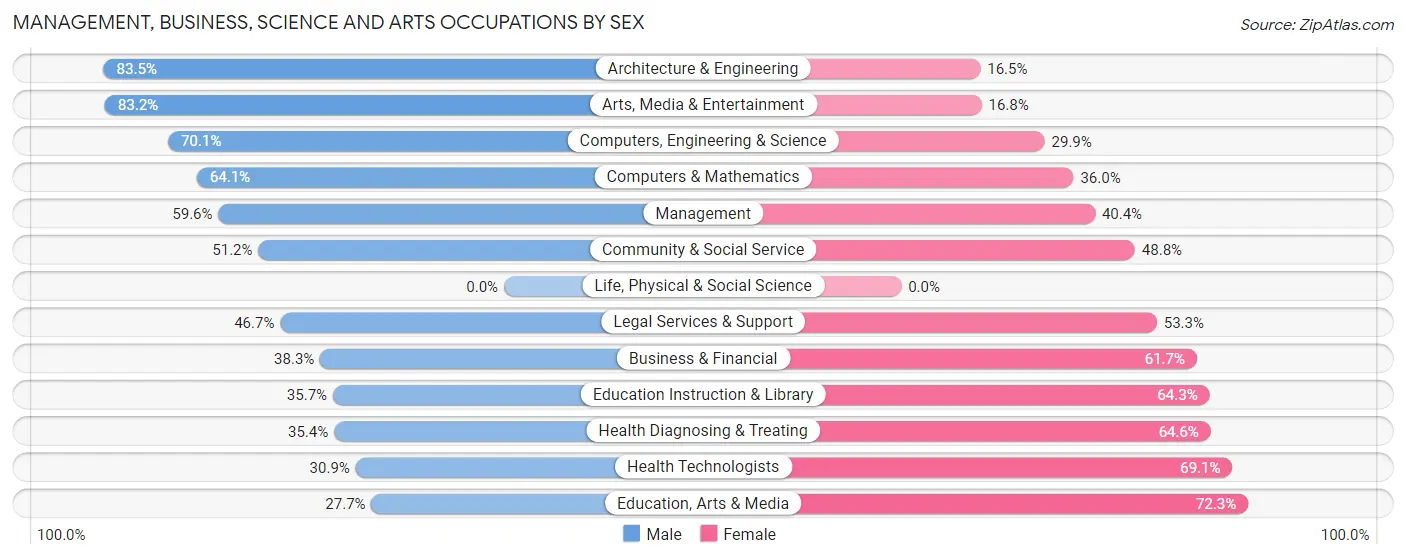
Management, Business, Science and Arts Occupations by Sex
Within the Management, Business, Science and Arts occupations in Oldsmar, the most male-oriented occupations are Architecture & Engineering (83.5%), Arts, Media & Entertainment (83.2%), and Computers, Engineering & Science (70.1%), while the most female-oriented occupations are Education, Arts & Media (72.3%), Health Technologists (69.1%), and Health Diagnosing & Treating (64.6%).
| Occupation | Male | Female |
| Management | 507 (59.6%) | 344 (40.4%) |
| Business & Financial | 258 (38.3%) | 415 (61.7%) |
| Computers, Engineering & Science | 466 (70.1%) | 199 (29.9%) |
| Computers & Mathematics | 294 (64.0%) | 165 (35.9%) |
| Architecture & Engineering | 172 (83.5%) | 34 (16.5%) |
| Life, Physical & Social Science | 0 (0.0%) | 0 (0.0%) |
| Community & Social Service | 310 (51.2%) | 295 (48.8%) |
| Education, Arts & Media | 13 (27.7%) | 34 (72.3%) |
| Legal Services & Support | 42 (46.7%) | 48 (53.3%) |
| Education Instruction & Library | 101 (35.7%) | 182 (64.3%) |
| Arts, Media & Entertainment | 154 (83.2%) | 31 (16.8%) |
| Health Diagnosing & Treating | 146 (35.4%) | 266 (64.6%) |
| Health Technologists | 86 (30.9%) | 192 (69.1%) |
| Total (Category) | 1,687 (52.6%) | 1,519 (47.4%) |
| Total (Overall) | 3,887 (52.5%) | 3,520 (47.5%) |
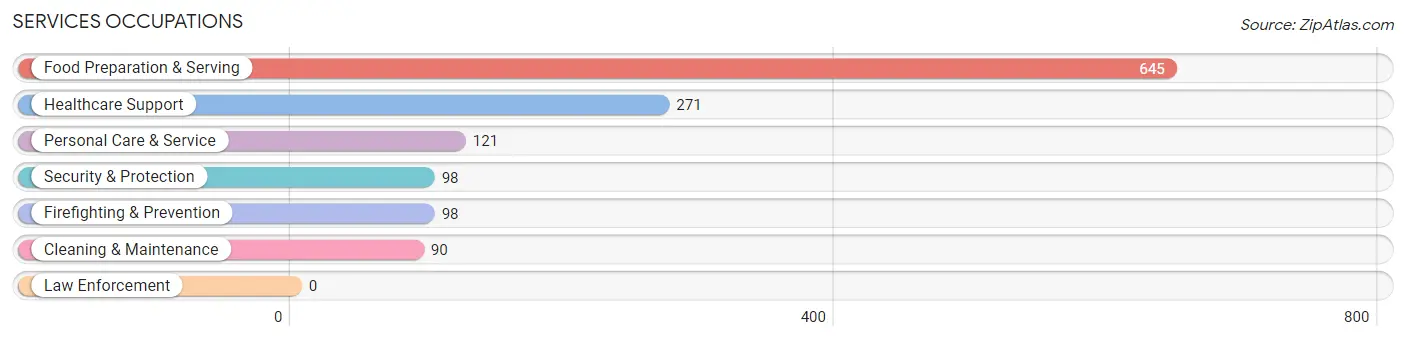
Services Occupations
The most common Services occupations in Oldsmar are Food Preparation & Serving (645 | 8.7%), Healthcare Support (271 | 3.7%), Personal Care & Service (121 | 1.6%), Security & Protection (98 | 1.3%), and Firefighting & Prevention (98 | 1.3%).
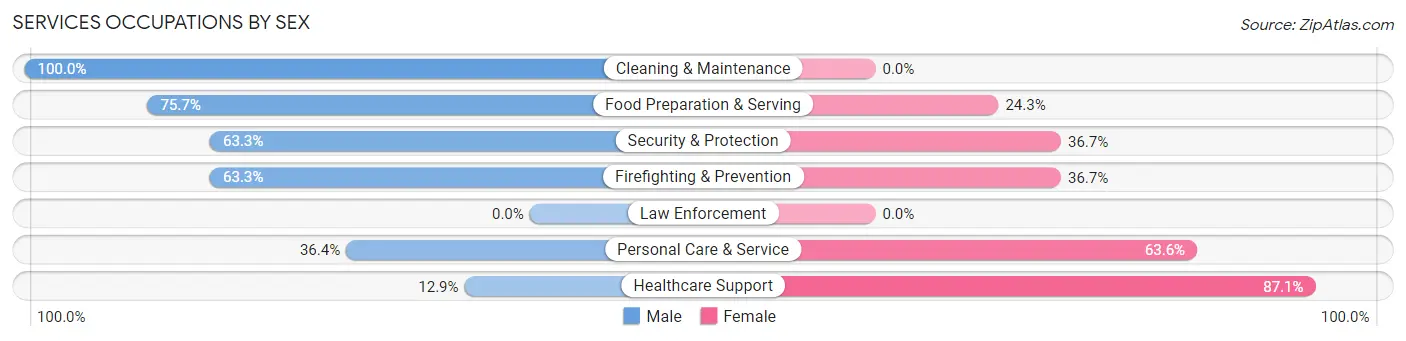
Services Occupations by Sex
Within the Services occupations in Oldsmar, the most male-oriented occupations are Cleaning & Maintenance (100.0%), Food Preparation & Serving (75.7%), and Security & Protection (63.3%), while the most female-oriented occupations are Healthcare Support (87.1%), Personal Care & Service (63.6%), and Security & Protection (36.7%).
| Occupation | Male | Female |
| Healthcare Support | 35 (12.9%) | 236 (87.1%) |
| Security & Protection | 62 (63.3%) | 36 (36.7%) |
| Firefighting & Prevention | 62 (63.3%) | 36 (36.7%) |
| Law Enforcement | 0 (0.0%) | 0 (0.0%) |
| Food Preparation & Serving | 488 (75.7%) | 157 (24.3%) |
| Cleaning & Maintenance | 90 (100.0%) | 0 (0.0%) |
| Personal Care & Service | 44 (36.4%) | 77 (63.6%) |
| Total (Category) | 719 (58.7%) | 506 (41.3%) |
| Total (Overall) | 3,887 (52.5%) | 3,520 (47.5%) |
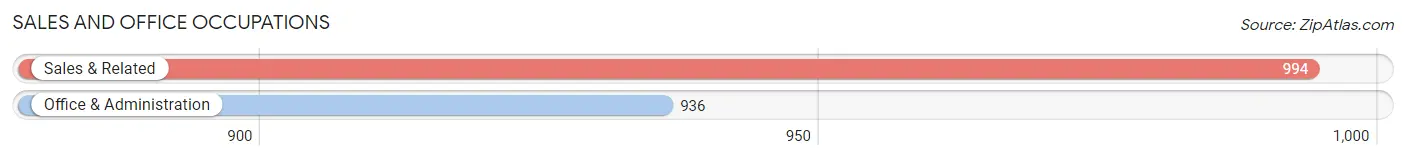
Sales and Office Occupations
The most common Sales and Office occupations in Oldsmar are Sales & Related (994 | 13.4%), and Office & Administration (936 | 12.6%).
Sales and Office Occupations by Sex
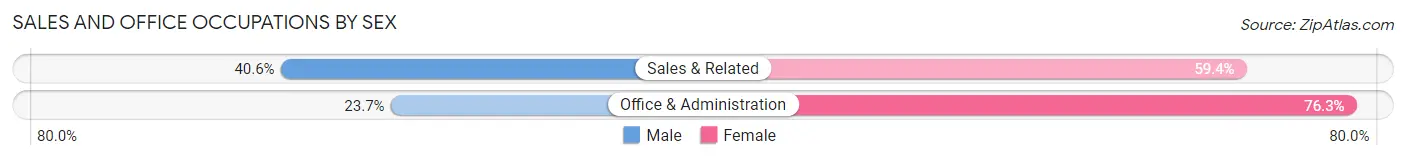
| Occupation | Male | Female |
| Sales & Related | 404 (40.6%) | 590 (59.4%) |
| Office & Administration | 222 (23.7%) | 714 (76.3%) |
| Total (Category) | 626 (32.4%) | 1,304 (67.6%) |
| Total (Overall) | 3,887 (52.5%) | 3,520 (47.5%) |
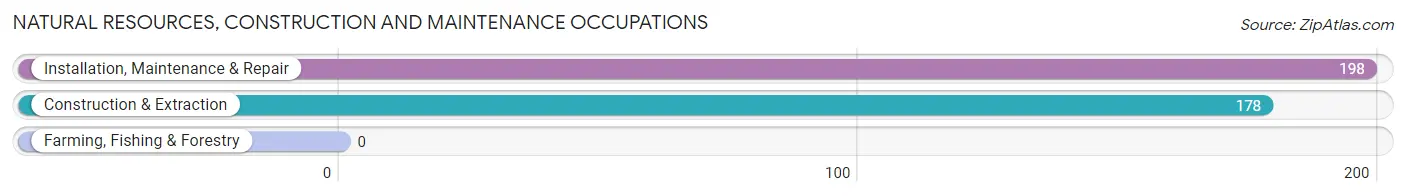
Natural Resources, Construction and Maintenance Occupations
The most common Natural Resources, Construction and Maintenance occupations in Oldsmar are Installation, Maintenance & Repair (198 | 2.7%), and Construction & Extraction (178 | 2.4%).
Natural Resources, Construction and Maintenance Occupations by Sex
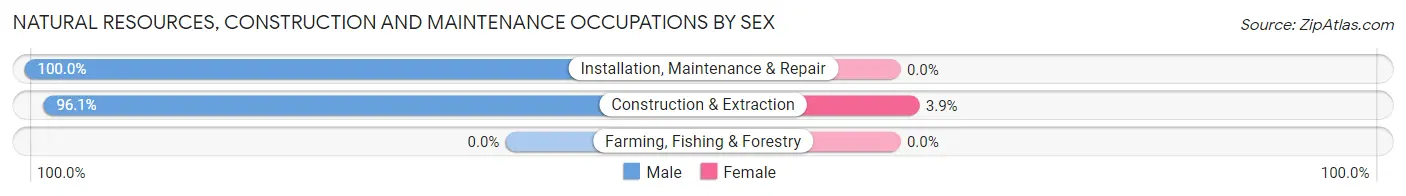
| Occupation | Male | Female |
| Farming, Fishing & Forestry | 0 (0.0%) | 0 (0.0%) |
| Construction & Extraction | 171 (96.1%) | 7 (3.9%) |
| Installation, Maintenance & Repair | 198 (100.0%) | 0 (0.0%) |
| Total (Category) | 369 (98.1%) | 7 (1.9%) |
| Total (Overall) | 3,887 (52.5%) | 3,520 (47.5%) |
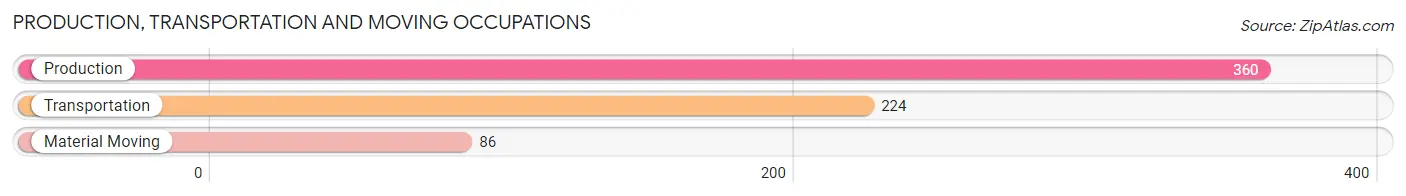
Production, Transportation and Moving Occupations
The most common Production, Transportation and Moving occupations in Oldsmar are Production (360 | 4.9%), Transportation (224 | 3.0%), and Material Moving (86 | 1.2%).
Production, Transportation and Moving Occupations by Sex
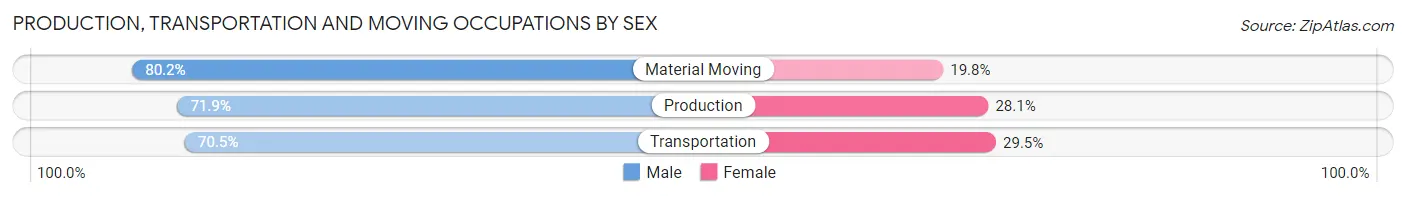
| Occupation | Male | Female |
| Production | 259 (71.9%) | 101 (28.1%) |
| Transportation | 158 (70.5%) | 66 (29.5%) |
| Material Moving | 69 (80.2%) | 17 (19.8%) |
| Total (Category) | 486 (72.5%) | 184 (27.5%) |
| Total (Overall) | 3,887 (52.5%) | 3,520 (47.5%) |
Employment Industries by Sex in Oldsmar
Employment Industries in Oldsmar
The major employment industries in Oldsmar include Retail Trade (1,148 | 15.5%), Health Care & Social Assistance (976 | 13.2%), Professional & Scientific (763 | 10.3%), Manufacturing (691 | 9.3%), and Accommodation & Food Services (647 | 8.7%).
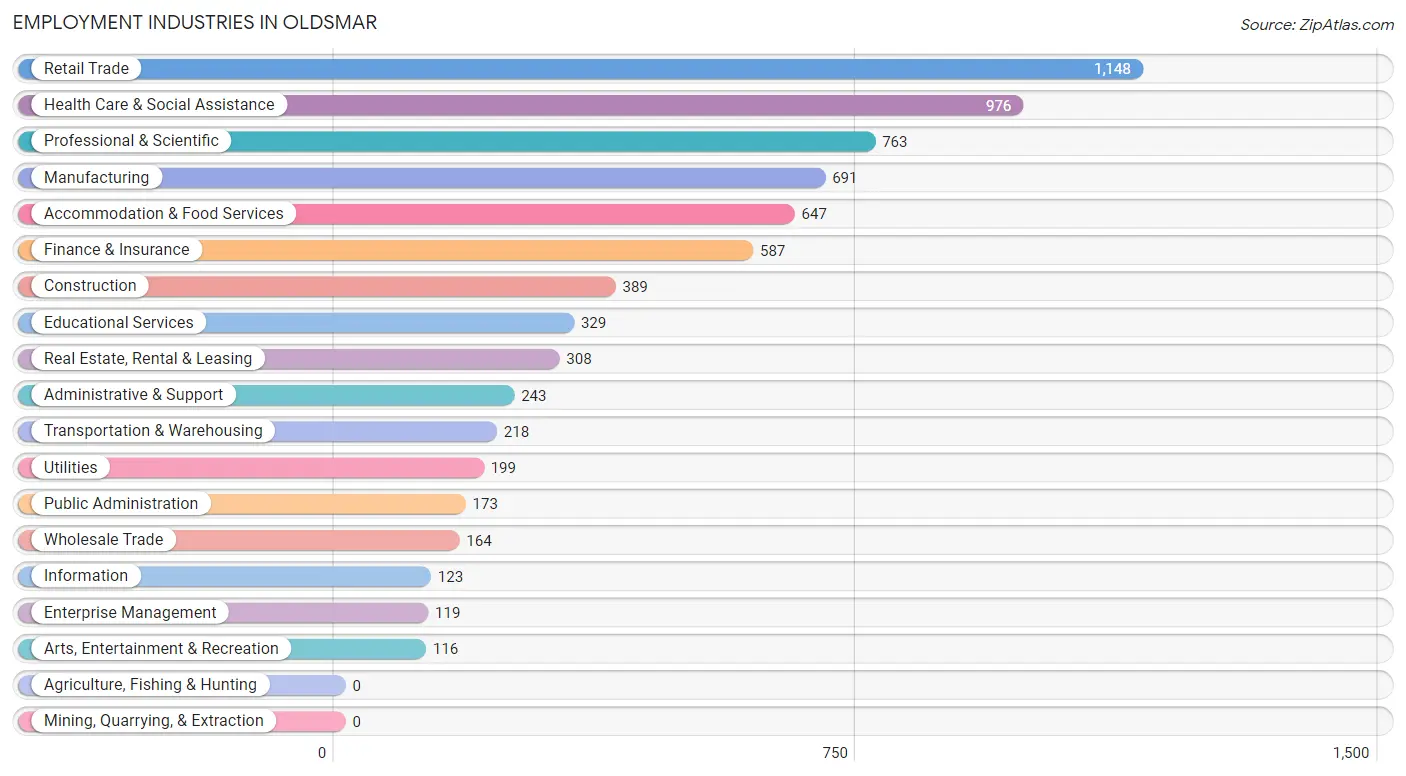
Employment Industries by Sex in Oldsmar
The Oldsmar industries that see more men than women are Construction (91.3%), Wholesale Trade (88.4%), and Transportation & Warehousing (83.0%), whereas the industries that tend to have a higher number of women are Enterprise Management (100.0%), Educational Services (71.1%), and Information (70.7%).
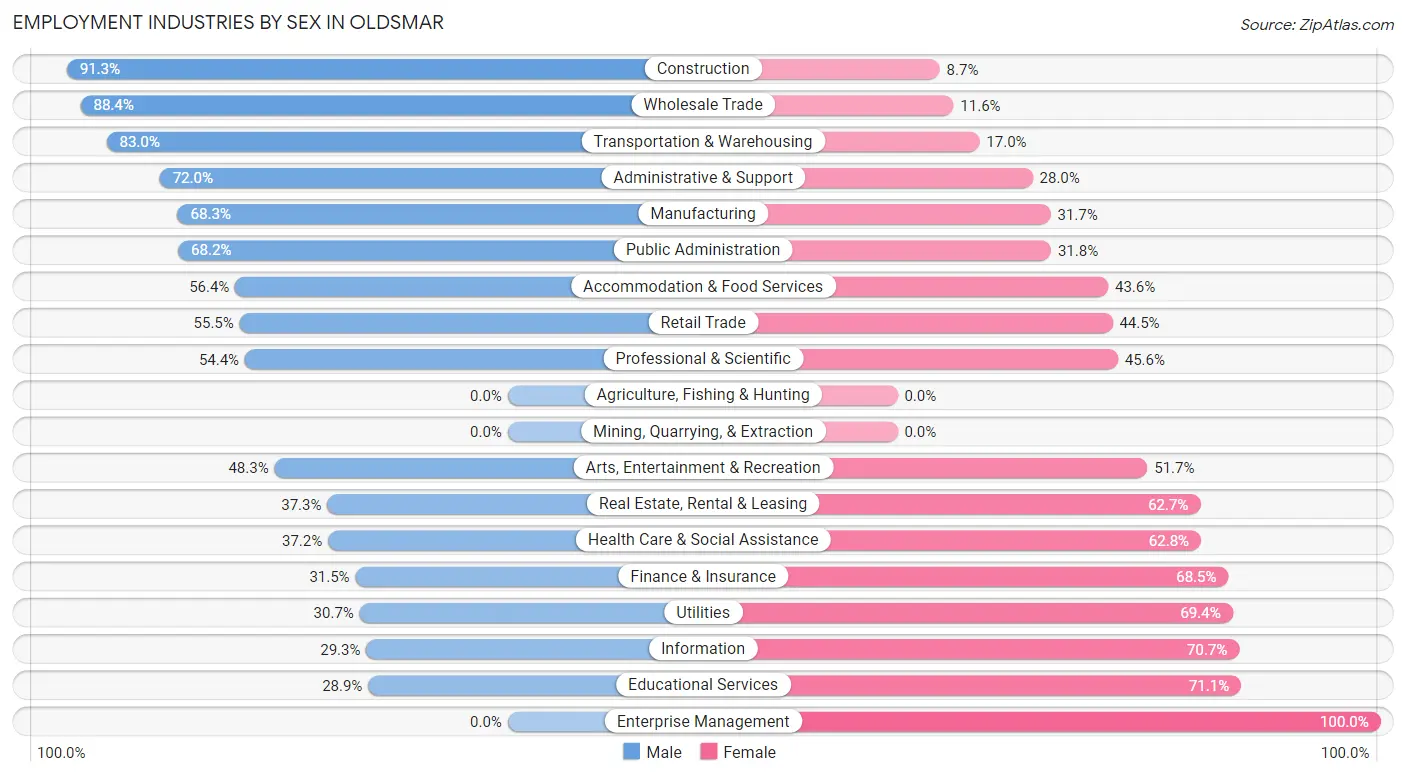
| Industry | Male | Female |
| Agriculture, Fishing & Hunting | 0 (0.0%) | 0 (0.0%) |
| Mining, Quarrying, & Extraction | 0 (0.0%) | 0 (0.0%) |
| Construction | 355 (91.3%) | 34 (8.7%) |
| Manufacturing | 472 (68.3%) | 219 (31.7%) |
| Wholesale Trade | 145 (88.4%) | 19 (11.6%) |
| Retail Trade | 637 (55.5%) | 511 (44.5%) |
| Transportation & Warehousing | 181 (83.0%) | 37 (17.0%) |
| Utilities | 61 (30.6%) | 138 (69.4%) |
| Information | 36 (29.3%) | 87 (70.7%) |
| Finance & Insurance | 185 (31.5%) | 402 (68.5%) |
| Real Estate, Rental & Leasing | 115 (37.3%) | 193 (62.7%) |
| Professional & Scientific | 415 (54.4%) | 348 (45.6%) |
| Enterprise Management | 0 (0.0%) | 119 (100.0%) |
| Administrative & Support | 175 (72.0%) | 68 (28.0%) |
| Educational Services | 95 (28.9%) | 234 (71.1%) |
| Health Care & Social Assistance | 363 (37.2%) | 613 (62.8%) |
| Arts, Entertainment & Recreation | 56 (48.3%) | 60 (51.7%) |
| Accommodation & Food Services | 365 (56.4%) | 282 (43.6%) |
| Public Administration | 118 (68.2%) | 55 (31.8%) |
| Total | 3,887 (52.5%) | 3,520 (47.5%) |
Education in Oldsmar
School Enrollment in Oldsmar
The most common levels of schooling among the 3,380 students in Oldsmar are college / undergraduate (838 | 24.8%), elementary school (746 | 22.1%), and middle school (686 | 20.3%).
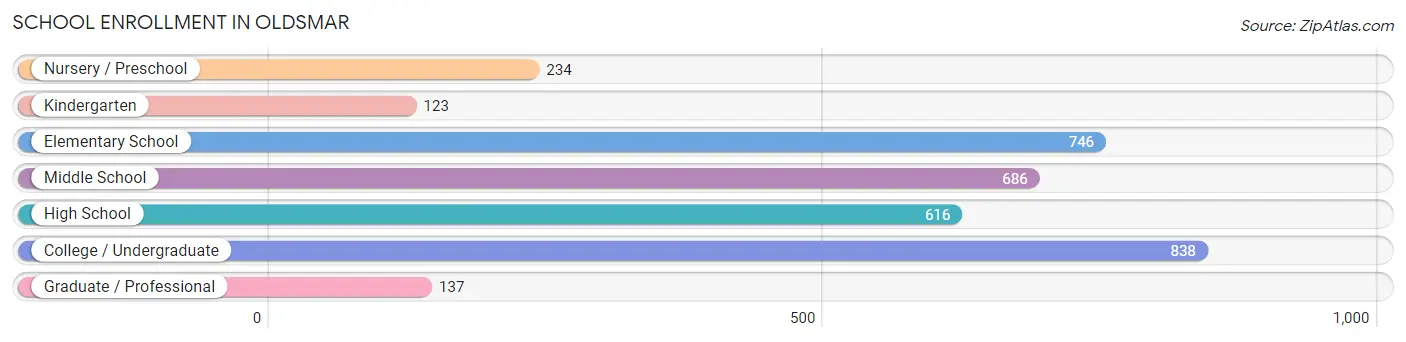
| School Level | # Students | % Students |
| Nursery / Preschool | 234 | 6.9% |
| Kindergarten | 123 | 3.6% |
| Elementary School | 746 | 22.1% |
| Middle School | 686 | 20.3% |
| High School | 616 | 18.2% |
| College / Undergraduate | 838 | 24.8% |
| Graduate / Professional | 137 | 4.1% |
| Total | 3,380 | 100.0% |
School Enrollment by Age by Funding Source in Oldsmar
Out of a total of 3,380 students who are enrolled in schools in Oldsmar, 869 (25.7%) attend a private institution, while the remaining 2,511 (74.3%) are enrolled in public schools. The age group of 3 to 4 year olds has the highest likelihood of being enrolled in private schools, with 156 (70.9% in the age bracket) enrolled. Conversely, the age group of 18 to 19 year olds has the lowest likelihood of being enrolled in a private school, with 219 (100.0% in the age bracket) attending a public institution.
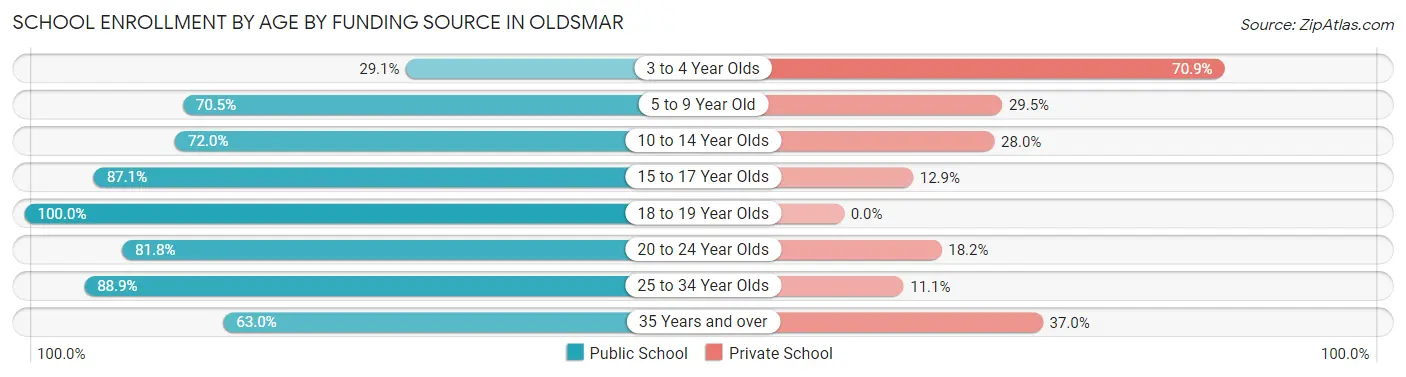
| Age Bracket | Public School | Private School |
| 3 to 4 Year Olds | 64 (29.1%) | 156 (70.9%) |
| 5 to 9 Year Old | 519 (70.5%) | 217 (29.5%) |
| 10 to 14 Year Olds | 706 (72.0%) | 275 (28.0%) |
| 15 to 17 Year Olds | 345 (87.1%) | 51 (12.9%) |
| 18 to 19 Year Olds | 219 (100.0%) | 0 (0.0%) |
| 20 to 24 Year Olds | 324 (81.8%) | 72 (18.2%) |
| 25 to 34 Year Olds | 216 (88.9%) | 27 (11.1%) |
| 35 Years and over | 119 (63.0%) | 70 (37.0%) |
| Total | 2,511 (74.3%) | 869 (25.7%) |
Educational Attainment by Field of Study in Oldsmar
Business (1,129 | 27.8%), science & technology (524 | 12.9%), education (352 | 8.6%), psychology (332 | 8.2%), and engineering (321 | 7.9%) are the most common fields of study among 4,068 individuals in Oldsmar who have obtained a bachelor's degree or higher.
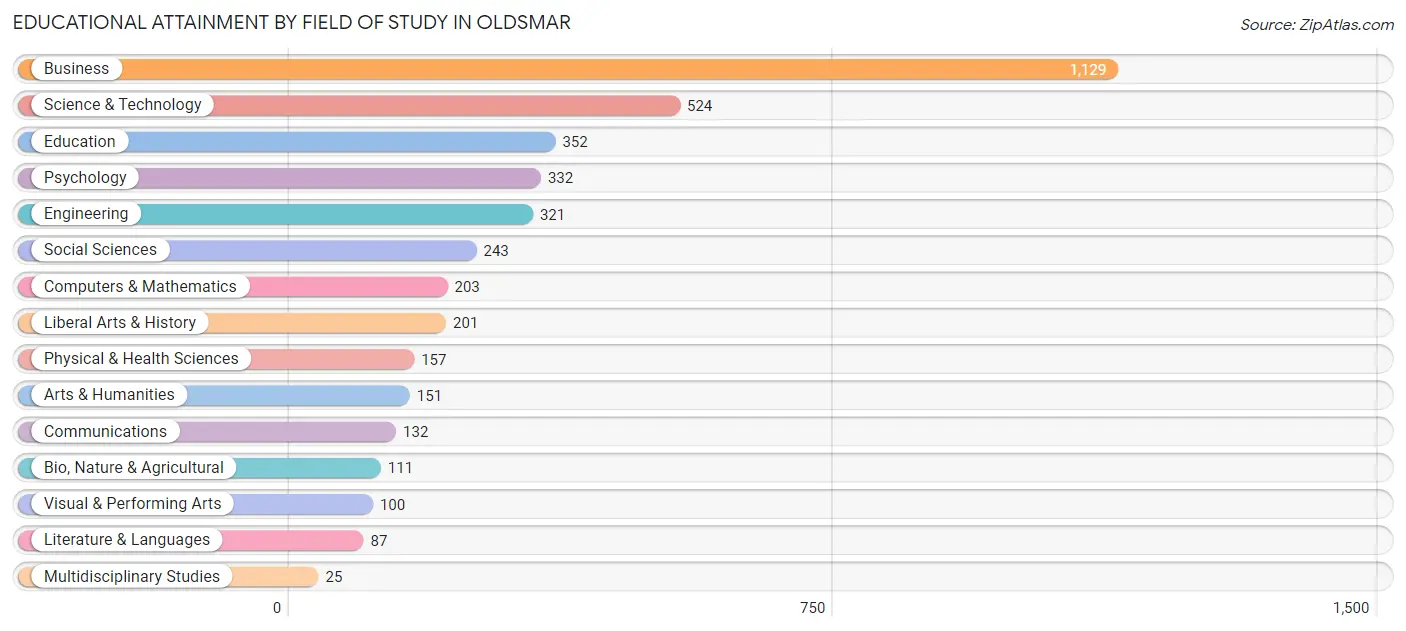
| Field of Study | # Graduates | % Graduates |
| Computers & Mathematics | 203 | 5.0% |
| Bio, Nature & Agricultural | 111 | 2.7% |
| Physical & Health Sciences | 157 | 3.9% |
| Psychology | 332 | 8.2% |
| Social Sciences | 243 | 6.0% |
| Engineering | 321 | 7.9% |
| Multidisciplinary Studies | 25 | 0.6% |
| Science & Technology | 524 | 12.9% |
| Business | 1,129 | 27.8% |
| Education | 352 | 8.6% |
| Literature & Languages | 87 | 2.1% |
| Liberal Arts & History | 201 | 4.9% |
| Visual & Performing Arts | 100 | 2.5% |
| Communications | 132 | 3.2% |
| Arts & Humanities | 151 | 3.7% |
| Total | 4,068 | 100.0% |
Transportation & Commute in Oldsmar
Vehicle Availability by Sex in Oldsmar
The most prevalent vehicle ownership categories in Oldsmar are males with 2 vehicles (1,964, accounting for 50.8%) and females with 2 vehicles (1,460, making up 56.9%).
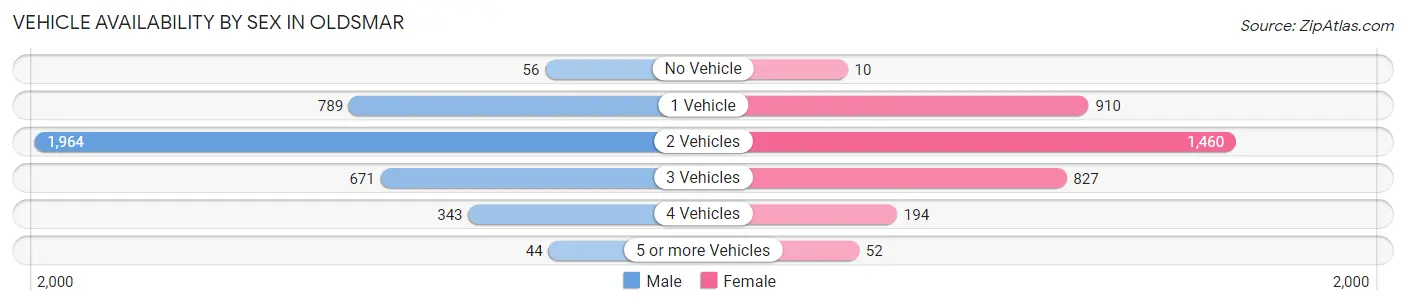
| Vehicles Available | Male | Female |
| No Vehicle | 56 (1.5%) | 10 (0.3%) |
| 1 Vehicle | 789 (20.4%) | 910 (26.4%) |
| 2 Vehicles | 1,964 (50.8%) | 1,460 (42.3%) |
| 3 Vehicles | 671 (17.3%) | 827 (23.9%) |
| 4 Vehicles | 343 (8.9%) | 194 (5.6%) |
| 5 or more Vehicles | 44 (1.1%) | 52 (1.5%) |
| Total | 3,867 (100.0%) | 3,453 (100.0%) |
Commute Time in Oldsmar
The most frequently occuring commute durations in Oldsmar are 30 to 34 minutes (1,377 commuters, 22.6%), 20 to 24 minutes (948 commuters, 15.5%), and 15 to 19 minutes (810 commuters, 13.3%).
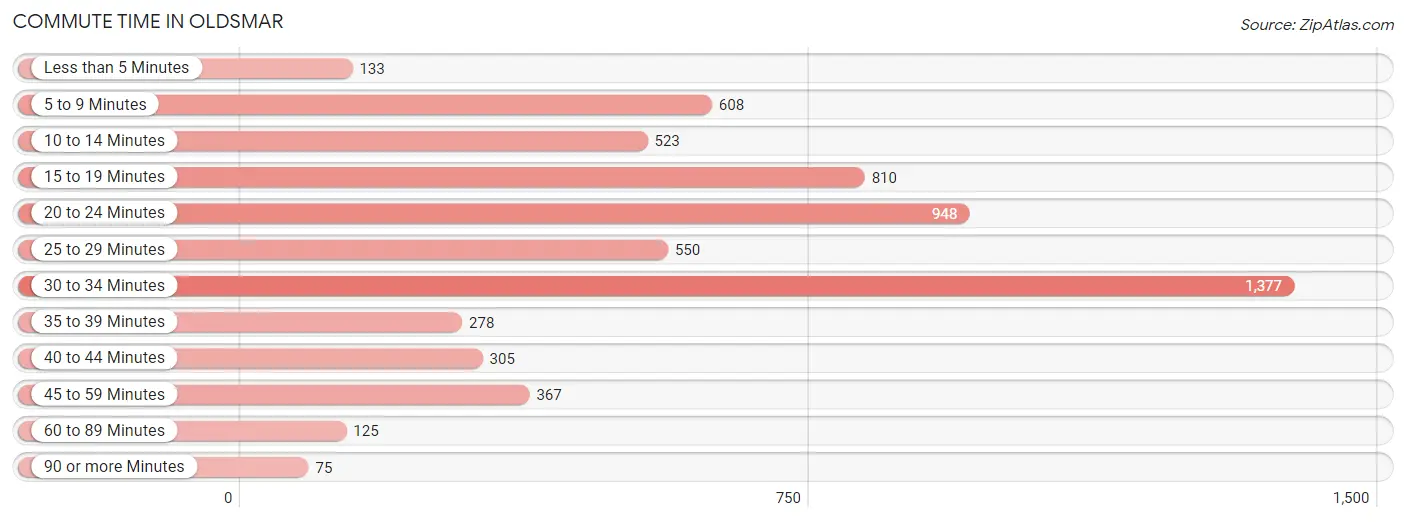
| Commute Time | # Commuters | % Commuters |
| Less than 5 Minutes | 133 | 2.2% |
| 5 to 9 Minutes | 608 | 10.0% |
| 10 to 14 Minutes | 523 | 8.6% |
| 15 to 19 Minutes | 810 | 13.3% |
| 20 to 24 Minutes | 948 | 15.5% |
| 25 to 29 Minutes | 550 | 9.0% |
| 30 to 34 Minutes | 1,377 | 22.6% |
| 35 to 39 Minutes | 278 | 4.6% |
| 40 to 44 Minutes | 305 | 5.0% |
| 45 to 59 Minutes | 367 | 6.0% |
| 60 to 89 Minutes | 125 | 2.1% |
| 90 or more Minutes | 75 | 1.2% |
Commute Time by Sex in Oldsmar
The most common commute times in Oldsmar are 30 to 34 minutes (839 commuters, 25.6%) for males and 30 to 34 minutes (538 commuters, 19.1%) for females.
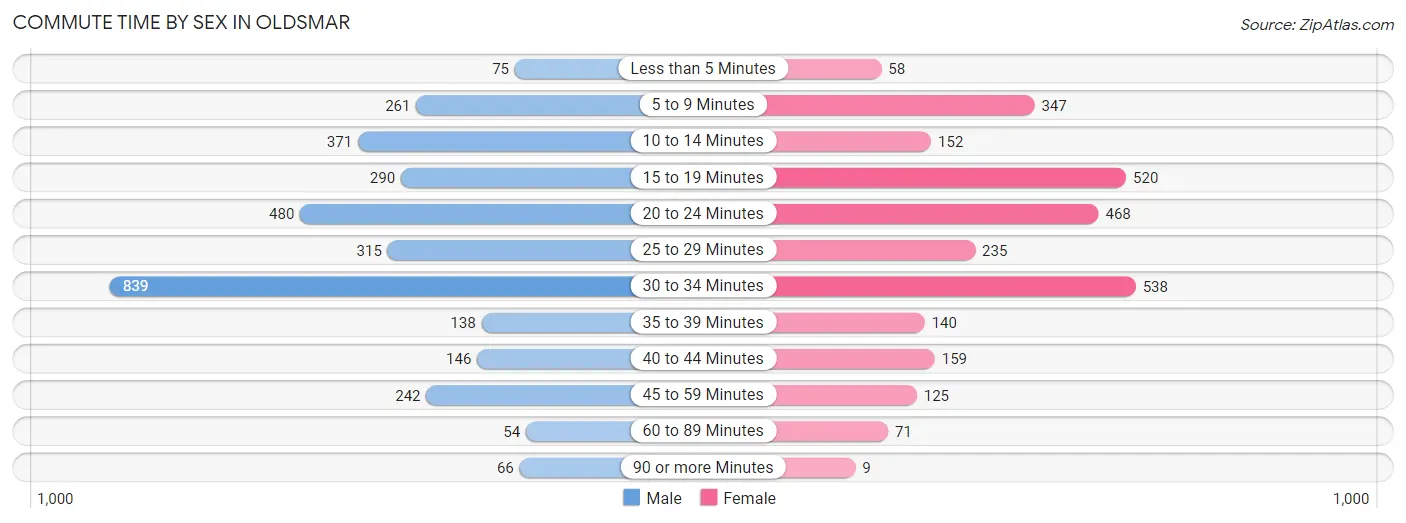
| Commute Time | Male | Female |
| Less than 5 Minutes | 75 (2.3%) | 58 (2.1%) |
| 5 to 9 Minutes | 261 (8.0%) | 347 (12.3%) |
| 10 to 14 Minutes | 371 (11.3%) | 152 (5.4%) |
| 15 to 19 Minutes | 290 (8.8%) | 520 (18.4%) |
| 20 to 24 Minutes | 480 (14.6%) | 468 (16.6%) |
| 25 to 29 Minutes | 315 (9.6%) | 235 (8.3%) |
| 30 to 34 Minutes | 839 (25.6%) | 538 (19.1%) |
| 35 to 39 Minutes | 138 (4.2%) | 140 (5.0%) |
| 40 to 44 Minutes | 146 (4.5%) | 159 (5.6%) |
| 45 to 59 Minutes | 242 (7.4%) | 125 (4.4%) |
| 60 to 89 Minutes | 54 (1.7%) | 71 (2.5%) |
| 90 or more Minutes | 66 (2.0%) | 9 (0.3%) |
Time of Departure to Work by Sex in Oldsmar
The most frequent times of departure to work in Oldsmar are 7:00 AM to 7:29 AM (532, 16.2%) for males and 7:00 AM to 7:29 AM (572, 20.3%) for females.
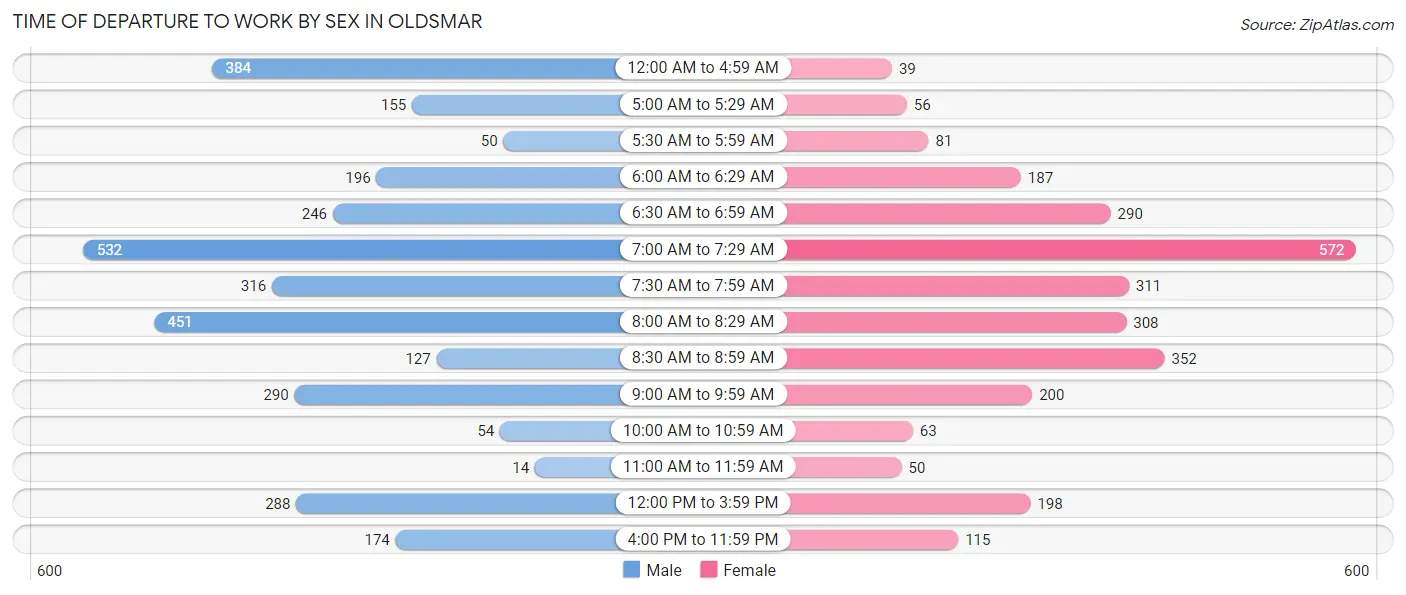
| Time of Departure | Male | Female |
| 12:00 AM to 4:59 AM | 384 (11.7%) | 39 (1.4%) |
| 5:00 AM to 5:29 AM | 155 (4.7%) | 56 (2.0%) |
| 5:30 AM to 5:59 AM | 50 (1.5%) | 81 (2.9%) |
| 6:00 AM to 6:29 AM | 196 (6.0%) | 187 (6.6%) |
| 6:30 AM to 6:59 AM | 246 (7.5%) | 290 (10.3%) |
| 7:00 AM to 7:29 AM | 532 (16.2%) | 572 (20.3%) |
| 7:30 AM to 7:59 AM | 316 (9.6%) | 311 (11.0%) |
| 8:00 AM to 8:29 AM | 451 (13.8%) | 308 (10.9%) |
| 8:30 AM to 8:59 AM | 127 (3.9%) | 352 (12.5%) |
| 9:00 AM to 9:59 AM | 290 (8.8%) | 200 (7.1%) |
| 10:00 AM to 10:59 AM | 54 (1.7%) | 63 (2.2%) |
| 11:00 AM to 11:59 AM | 14 (0.4%) | 50 (1.8%) |
| 12:00 PM to 3:59 PM | 288 (8.8%) | 198 (7.0%) |
| 4:00 PM to 11:59 PM | 174 (5.3%) | 115 (4.1%) |
| Total | 3,277 (100.0%) | 2,822 (100.0%) |
Housing Occupancy in Oldsmar
Occupancy by Ownership in Oldsmar
Of the total 5,326 dwellings in Oldsmar, owner-occupied units account for 3,871 (72.7%), while renter-occupied units make up 1,455 (27.3%).
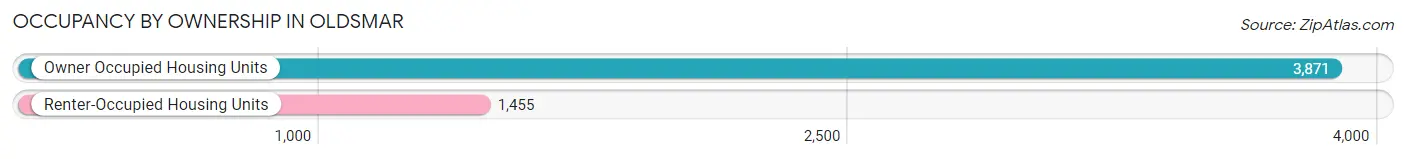
| Occupancy | # Housing Units | % Housing Units |
| Owner Occupied Housing Units | 3,871 | 72.7% |
| Renter-Occupied Housing Units | 1,455 | 27.3% |
| Total Occupied Housing Units | 5,326 | 100.0% |
Occupancy by Household Size in Oldsmar
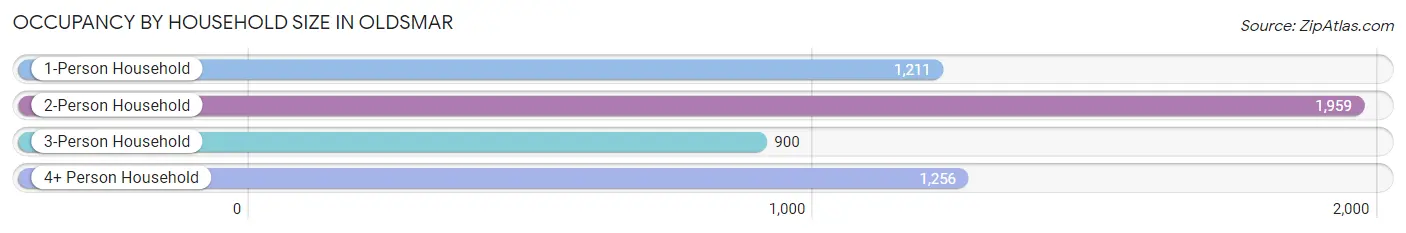
| Household Size | # Housing Units | % Housing Units |
| 1-Person Household | 1,211 | 22.7% |
| 2-Person Household | 1,959 | 36.8% |
| 3-Person Household | 900 | 16.9% |
| 4+ Person Household | 1,256 | 23.6% |
| Total Housing Units | 5,326 | 100.0% |
Occupancy by Ownership by Household Size in Oldsmar
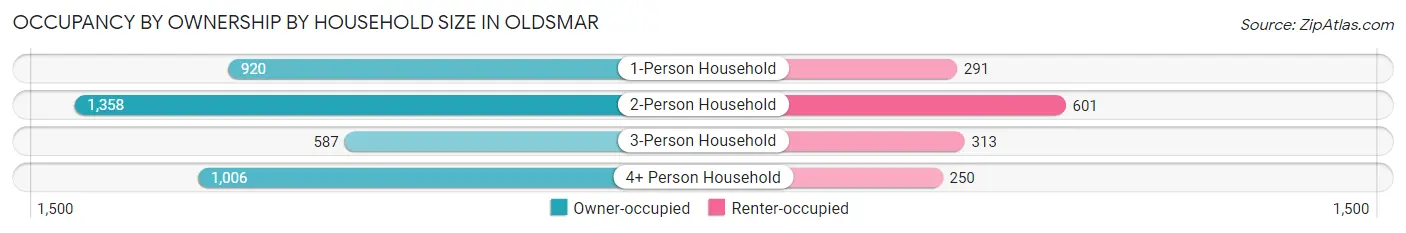
| Household Size | Owner-occupied | Renter-occupied |
| 1-Person Household | 920 (76.0%) | 291 (24.0%) |
| 2-Person Household | 1,358 (69.3%) | 601 (30.7%) |
| 3-Person Household | 587 (65.2%) | 313 (34.8%) |
| 4+ Person Household | 1,006 (80.1%) | 250 (19.9%) |
| Total Housing Units | 3,871 (72.7%) | 1,455 (27.3%) |
Occupancy by Educational Attainment in Oldsmar
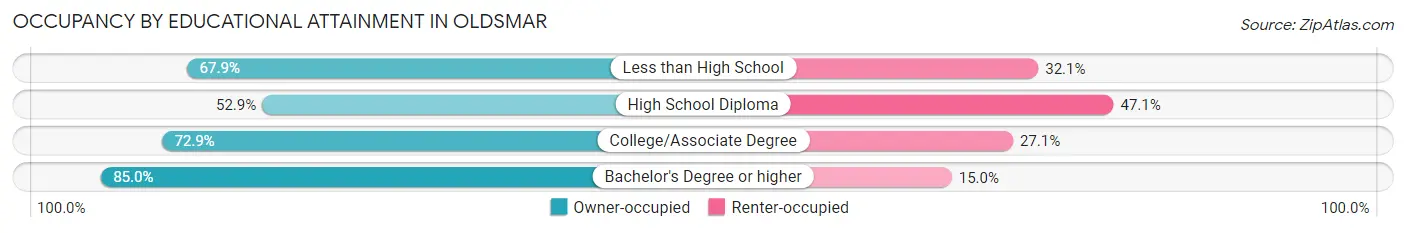
| Household Size | Owner-occupied | Renter-occupied |
| Less than High School | 152 (67.9%) | 72 (32.1%) |
| High School Diploma | 659 (52.9%) | 586 (47.1%) |
| College/Associate Degree | 1,313 (72.9%) | 489 (27.1%) |
| Bachelor's Degree or higher | 1,747 (85.0%) | 308 (15.0%) |
Occupancy by Age of Householder in Oldsmar
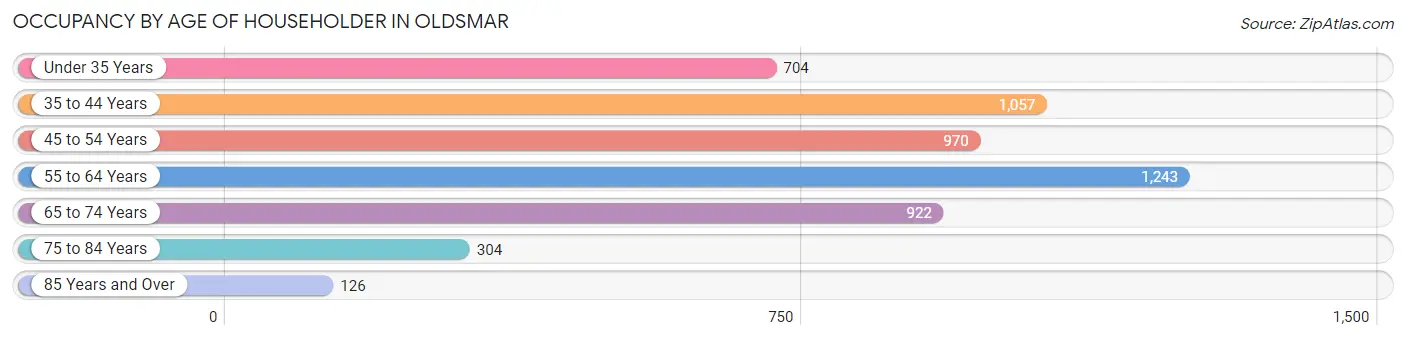
| Age Bracket | # Households | % Households |
| Under 35 Years | 704 | 13.2% |
| 35 to 44 Years | 1,057 | 19.9% |
| 45 to 54 Years | 970 | 18.2% |
| 55 to 64 Years | 1,243 | 23.3% |
| 65 to 74 Years | 922 | 17.3% |
| 75 to 84 Years | 304 | 5.7% |
| 85 Years and Over | 126 | 2.4% |
| Total | 5,326 | 100.0% |
Housing Finances in Oldsmar
Median Income by Occupancy in Oldsmar
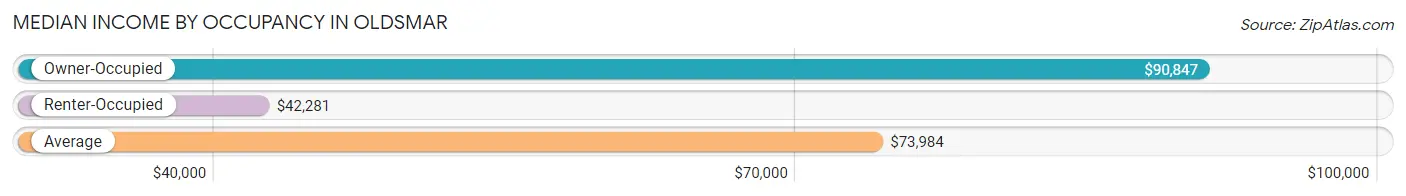
| Occupancy Type | # Households | Median Income |
| Owner-Occupied | 3,871 (72.7%) | $90,847 |
| Renter-Occupied | 1,455 (27.3%) | $42,281 |
| Average | 5,326 (100.0%) | $73,984 |
Occupancy by Householder Income Bracket in Oldsmar
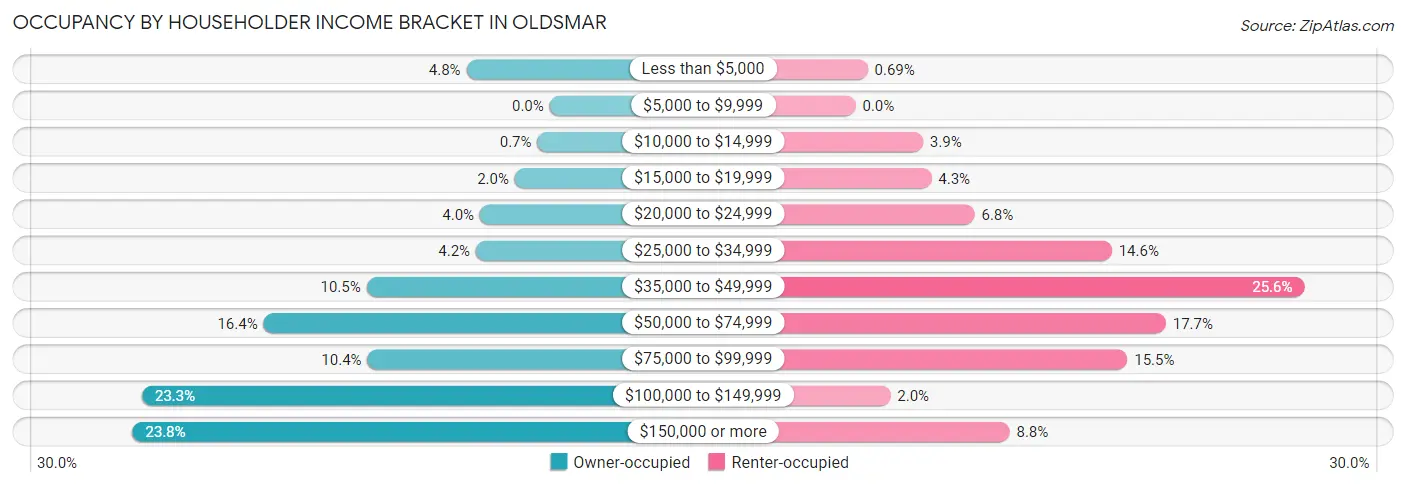
| Income Bracket | Owner-occupied | Renter-occupied |
| Less than $5,000 | 184 (4.8%) | 10 (0.7%) |
| $5,000 to $9,999 | 0 (0.0%) | 0 (0.0%) |
| $10,000 to $14,999 | 27 (0.7%) | 56 (3.8%) |
| $15,000 to $19,999 | 77 (2.0%) | 63 (4.3%) |
| $20,000 to $24,999 | 154 (4.0%) | 99 (6.8%) |
| $25,000 to $34,999 | 163 (4.2%) | 213 (14.6%) |
| $35,000 to $49,999 | 405 (10.5%) | 373 (25.6%) |
| $50,000 to $74,999 | 633 (16.4%) | 258 (17.7%) |
| $75,000 to $99,999 | 403 (10.4%) | 226 (15.5%) |
| $100,000 to $149,999 | 902 (23.3%) | 29 (2.0%) |
| $150,000 or more | 923 (23.8%) | 128 (8.8%) |
| Total | 3,871 (100.0%) | 1,455 (100.0%) |
Monthly Housing Cost Tiers in Oldsmar
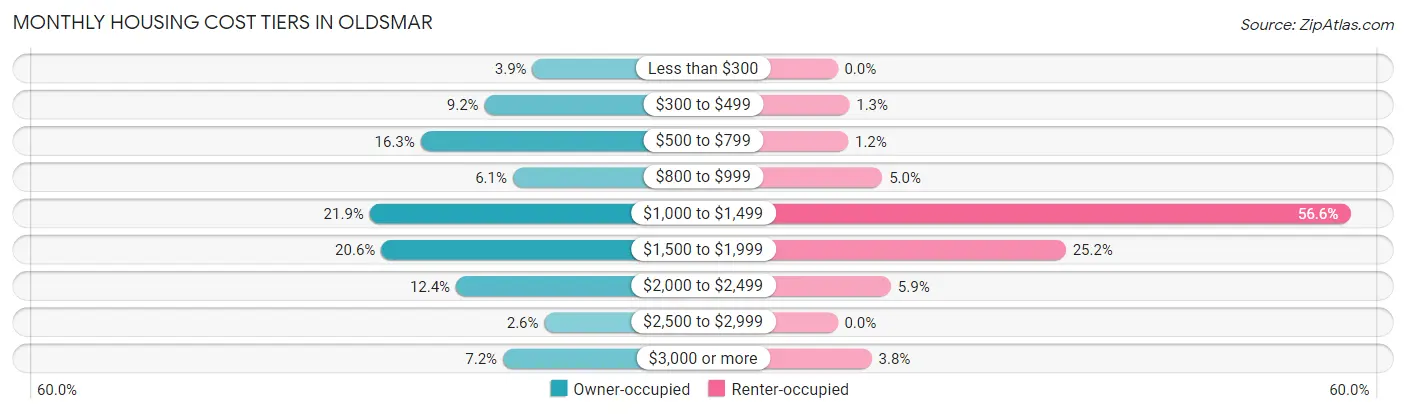
| Monthly Cost | Owner-occupied | Renter-occupied |
| Less than $300 | 151 (3.9%) | 0 (0.0%) |
| $300 to $499 | 356 (9.2%) | 19 (1.3%) |
| $500 to $799 | 629 (16.3%) | 17 (1.2%) |
| $800 to $999 | 235 (6.1%) | 72 (5.0%) |
| $1,000 to $1,499 | 847 (21.9%) | 824 (56.6%) |
| $1,500 to $1,999 | 798 (20.6%) | 367 (25.2%) |
| $2,000 to $2,499 | 478 (12.3%) | 86 (5.9%) |
| $2,500 to $2,999 | 100 (2.6%) | 0 (0.0%) |
| $3,000 or more | 277 (7.2%) | 55 (3.8%) |
| Total | 3,871 (100.0%) | 1,455 (100.0%) |
Physical Housing Characteristics in Oldsmar
Housing Structures in Oldsmar
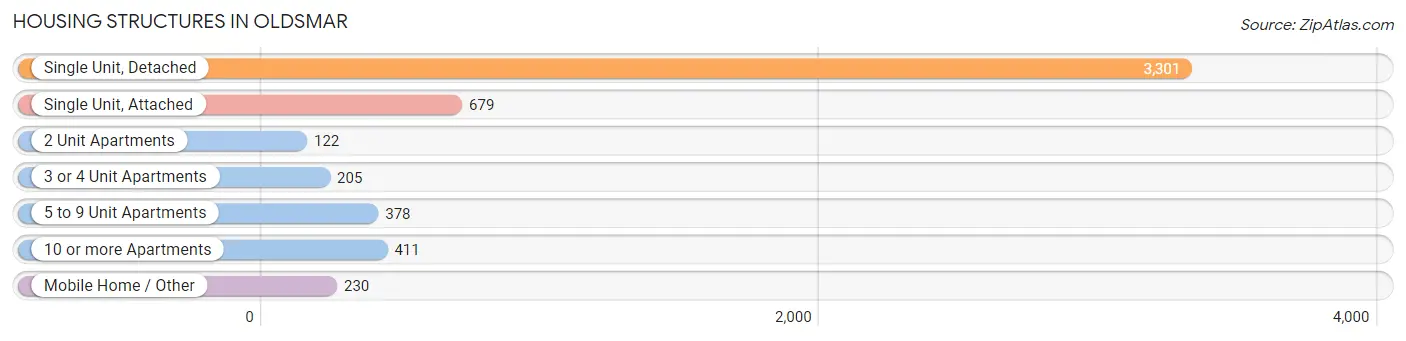
| Structure Type | # Housing Units | % Housing Units |
| Single Unit, Detached | 3,301 | 62.0% |
| Single Unit, Attached | 679 | 12.8% |
| 2 Unit Apartments | 122 | 2.3% |
| 3 or 4 Unit Apartments | 205 | 3.8% |
| 5 to 9 Unit Apartments | 378 | 7.1% |
| 10 or more Apartments | 411 | 7.7% |
| Mobile Home / Other | 230 | 4.3% |
| Total | 5,326 | 100.0% |
Housing Structures by Occupancy in Oldsmar
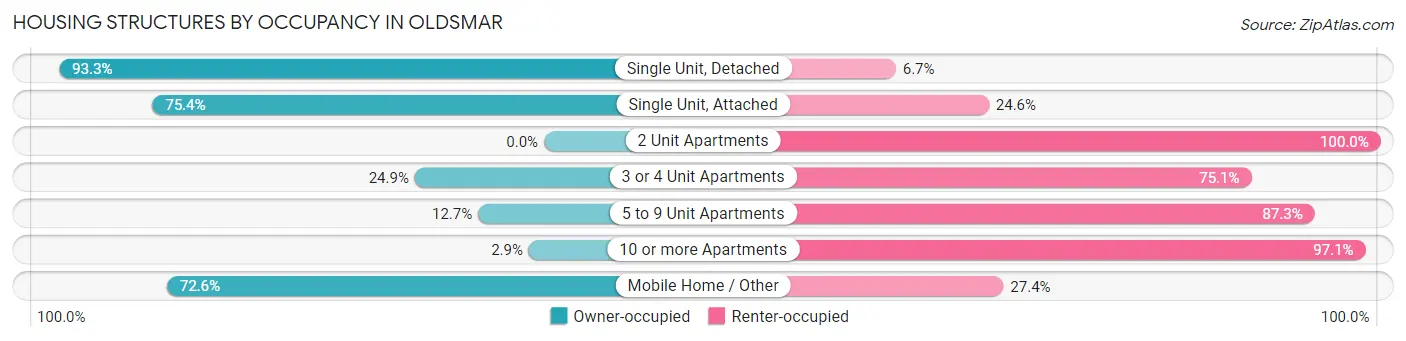
| Structure Type | Owner-occupied | Renter-occupied |
| Single Unit, Detached | 3,081 (93.3%) | 220 (6.7%) |
| Single Unit, Attached | 512 (75.4%) | 167 (24.6%) |
| 2 Unit Apartments | 0 (0.0%) | 122 (100.0%) |
| 3 or 4 Unit Apartments | 51 (24.9%) | 154 (75.1%) |
| 5 to 9 Unit Apartments | 48 (12.7%) | 330 (87.3%) |
| 10 or more Apartments | 12 (2.9%) | 399 (97.1%) |
| Mobile Home / Other | 167 (72.6%) | 63 (27.4%) |
| Total | 3,871 (72.7%) | 1,455 (27.3%) |
Housing Structures by Number of Rooms in Oldsmar
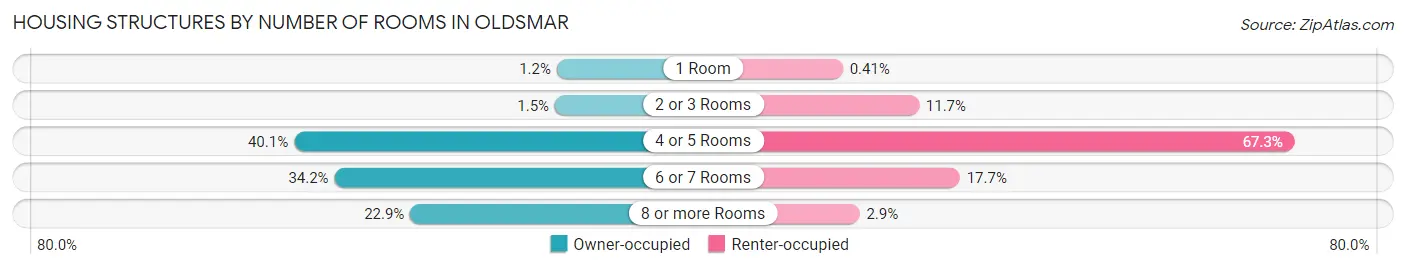
| Number of Rooms | Owner-occupied | Renter-occupied |
| 1 Room | 48 (1.2%) | 6 (0.4%) |
| 2 or 3 Rooms | 59 (1.5%) | 170 (11.7%) |
| 4 or 5 Rooms | 1,554 (40.1%) | 979 (67.3%) |
| 6 or 7 Rooms | 1,322 (34.2%) | 258 (17.7%) |
| 8 or more Rooms | 888 (22.9%) | 42 (2.9%) |
| Total | 3,871 (100.0%) | 1,455 (100.0%) |
Housing Structure by Heating Type in Oldsmar
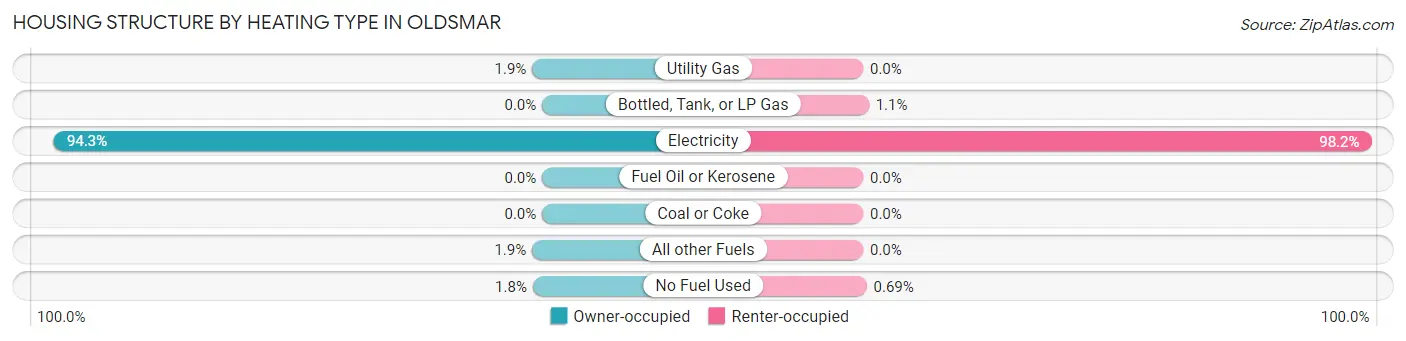
| Heating Type | Owner-occupied | Renter-occupied |
| Utility Gas | 74 (1.9%) | 0 (0.0%) |
| Bottled, Tank, or LP Gas | 0 (0.0%) | 16 (1.1%) |
| Electricity | 3,652 (94.3%) | 1,429 (98.2%) |
| Fuel Oil or Kerosene | 0 (0.0%) | 0 (0.0%) |
| Coal or Coke | 0 (0.0%) | 0 (0.0%) |
| All other Fuels | 75 (1.9%) | 0 (0.0%) |
| No Fuel Used | 70 (1.8%) | 10 (0.7%) |
| Total | 3,871 (100.0%) | 1,455 (100.0%) |
Household Vehicle Usage in Oldsmar
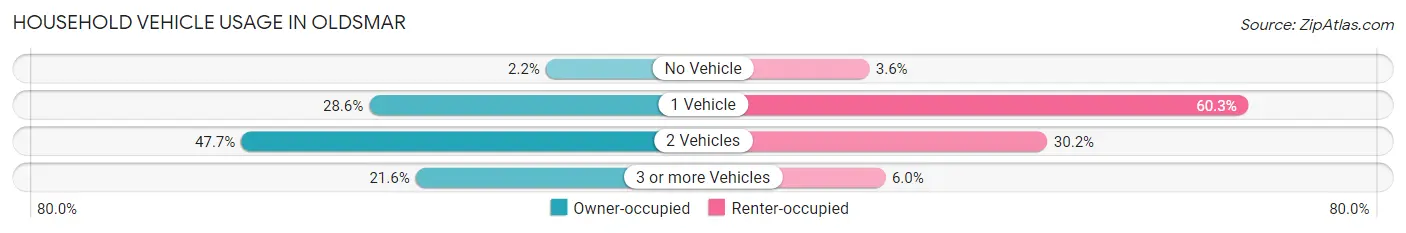
| Vehicles per Household | Owner-occupied | Renter-occupied |
| No Vehicle | 84 (2.2%) | 52 (3.6%) |
| 1 Vehicle | 1,105 (28.5%) | 877 (60.3%) |
| 2 Vehicles | 1,845 (47.7%) | 439 (30.2%) |
| 3 or more Vehicles | 837 (21.6%) | 87 (6.0%) |
| Total | 3,871 (100.0%) | 1,455 (100.0%) |
Real Estate & Mortgages in Oldsmar
Real Estate and Mortgage Overview in Oldsmar
| Characteristic | Without Mortgage | With Mortgage |
| Housing Units | 1,362 | 2,509 |
| Median Property Value | $309,700 | $330,000 |
| Median Household Income | $59,167 | $737 |
| Monthly Housing Costs | $558 | $277 |
| Real Estate Taxes | $2,099 | $45 |
Property Value by Mortgage Status in Oldsmar
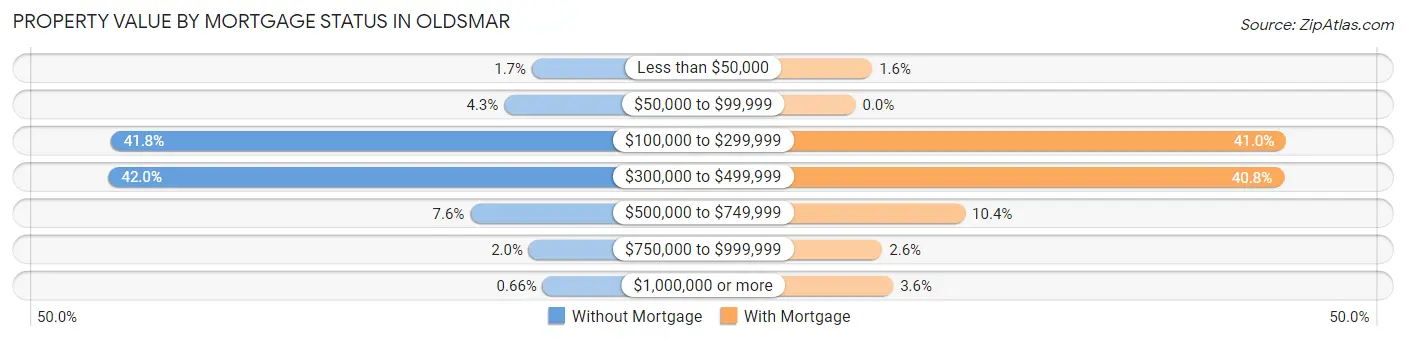
| Property Value | Without Mortgage | With Mortgage |
| Less than $50,000 | 23 (1.7%) | 40 (1.6%) |
| $50,000 to $99,999 | 59 (4.3%) | 0 (0.0%) |
| $100,000 to $299,999 | 569 (41.8%) | 1,029 (41.0%) |
| $300,000 to $499,999 | 572 (42.0%) | 1,024 (40.8%) |
| $500,000 to $749,999 | 103 (7.6%) | 262 (10.4%) |
| $750,000 to $999,999 | 27 (2.0%) | 64 (2.5%) |
| $1,000,000 or more | 9 (0.7%) | 90 (3.6%) |
| Total | 1,362 (100.0%) | 2,509 (100.0%) |
Household Income by Mortgage Status in Oldsmar
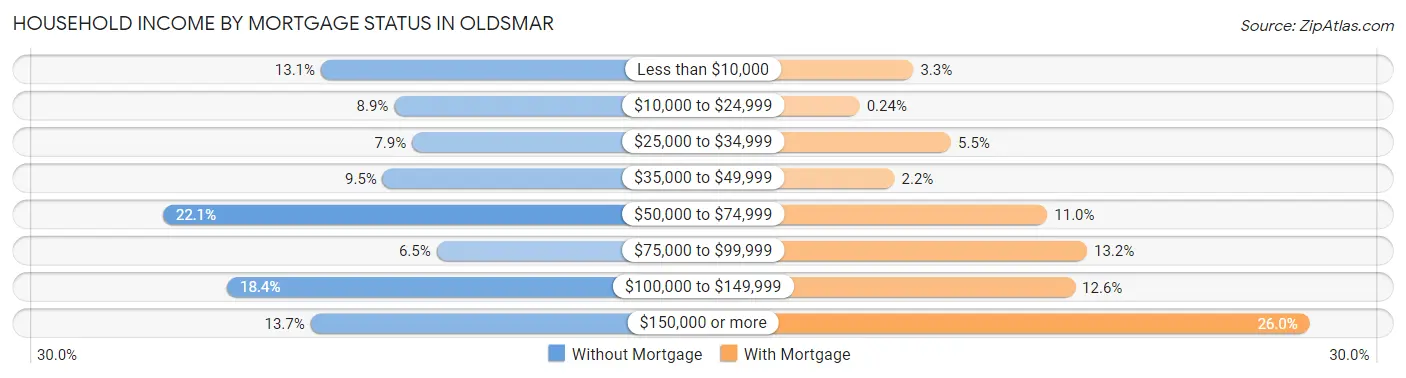
| Household Income | Without Mortgage | With Mortgage |
| Less than $10,000 | 178 (13.1%) | 83 (3.3%) |
| $10,000 to $24,999 | 121 (8.9%) | 6 (0.2%) |
| $25,000 to $34,999 | 107 (7.9%) | 137 (5.5%) |
| $35,000 to $49,999 | 130 (9.5%) | 56 (2.2%) |
| $50,000 to $74,999 | 301 (22.1%) | 275 (11.0%) |
| $75,000 to $99,999 | 88 (6.5%) | 332 (13.2%) |
| $100,000 to $149,999 | 251 (18.4%) | 315 (12.6%) |
| $150,000 or more | 186 (13.7%) | 651 (26.0%) |
| Total | 1,362 (100.0%) | 2,509 (100.0%) |
Property Value to Household Income Ratio in Oldsmar
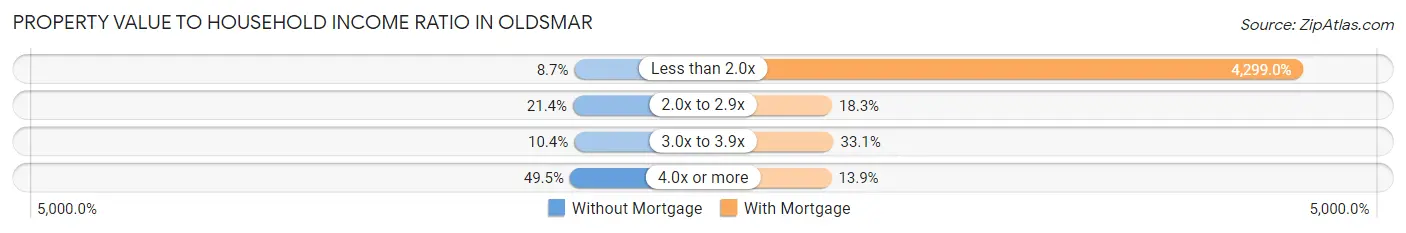
| Value-to-Income Ratio | Without Mortgage | With Mortgage |
| Less than 2.0x | 118 (8.7%) | 107,861 (4,299.0%) |
| 2.0x to 2.9x | 292 (21.4%) | 460 (18.3%) |
| 3.0x to 3.9x | 142 (10.4%) | 830 (33.1%) |
| 4.0x or more | 674 (49.5%) | 348 (13.9%) |
| Total | 1,362 (100.0%) | 2,509 (100.0%) |
Real Estate Taxes by Mortgage Status in Oldsmar
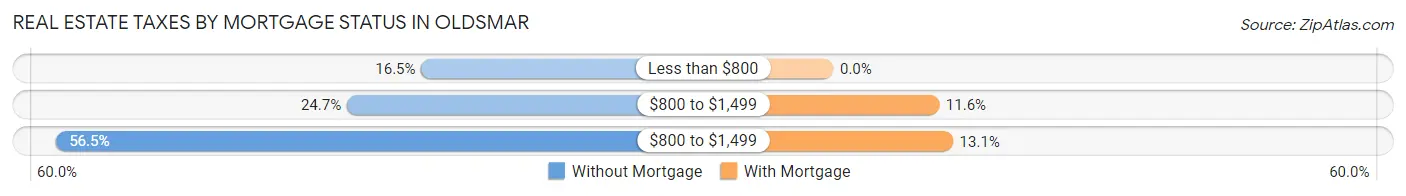
| Property Taxes | Without Mortgage | With Mortgage |
| Less than $800 | 225 (16.5%) | 0 (0.0%) |
| $800 to $1,499 | 336 (24.7%) | 291 (11.6%) |
| $800 to $1,499 | 770 (56.5%) | 329 (13.1%) |
| Total | 1,362 (100.0%) | 2,509 (100.0%) |
Health & Disability in Oldsmar
Health Insurance Coverage by Age in Oldsmar
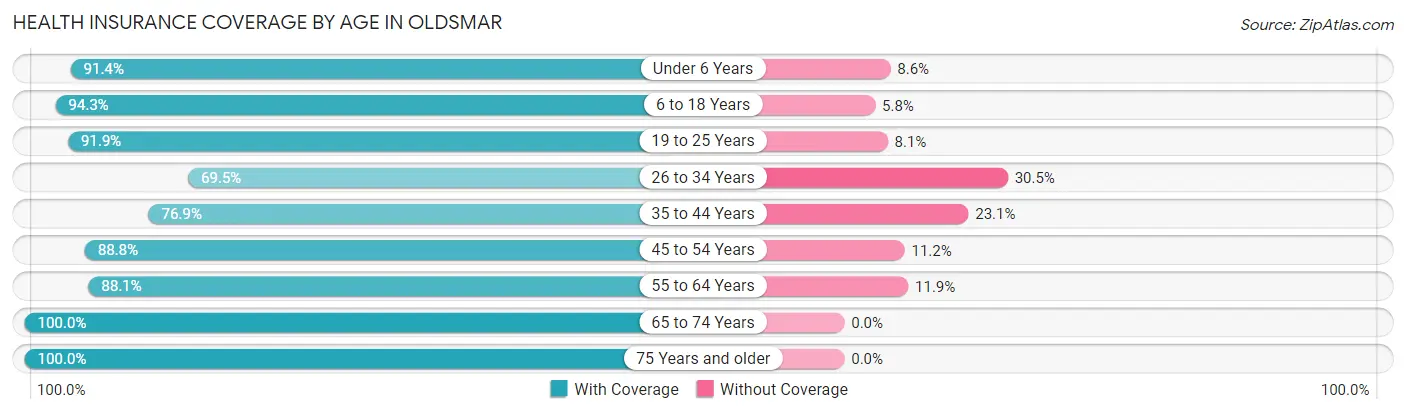
| Age Bracket | With Coverage | Without Coverage |
| Under 6 Years | 862 (91.4%) | 81 (8.6%) |
| 6 to 18 Years | 2,130 (94.3%) | 130 (5.8%) |
| 19 to 25 Years | 1,320 (91.9%) | 116 (8.1%) |
| 26 to 34 Years | 1,319 (69.5%) | 578 (30.5%) |
| 35 to 44 Years | 1,397 (76.9%) | 420 (23.1%) |
| 45 to 54 Years | 1,732 (88.8%) | 219 (11.2%) |
| 55 to 64 Years | 2,050 (88.1%) | 277 (11.9%) |
| 65 to 74 Years | 1,457 (100.0%) | 0 (0.0%) |
| 75 Years and older | 634 (100.0%) | 0 (0.0%) |
| Total | 12,901 (87.6%) | 1,821 (12.4%) |
Health Insurance Coverage by Citizenship Status in Oldsmar
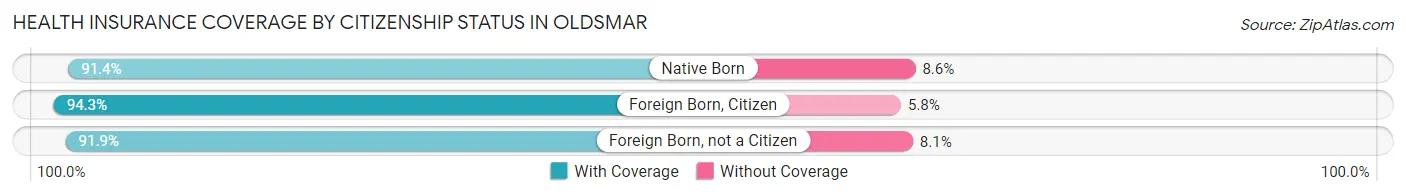
| Citizenship Status | With Coverage | Without Coverage |
| Native Born | 862 (91.4%) | 81 (8.6%) |
| Foreign Born, Citizen | 2,130 (94.3%) | 130 (5.8%) |
| Foreign Born, not a Citizen | 1,320 (91.9%) | 116 (8.1%) |
Health Insurance Coverage by Household Income in Oldsmar
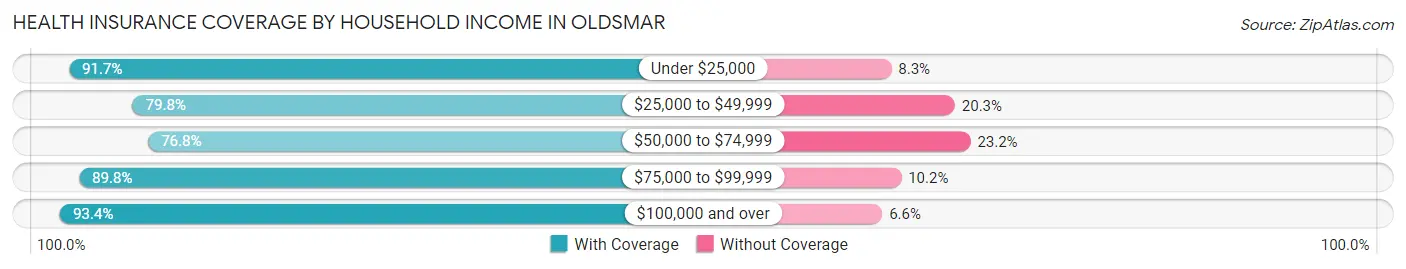
| Household Income | With Coverage | Without Coverage |
| Under $25,000 | 1,297 (91.7%) | 118 (8.3%) |
| $25,000 to $49,999 | 1,938 (79.7%) | 492 (20.3%) |
| $50,000 to $74,999 | 1,976 (76.8%) | 596 (23.2%) |
| $75,000 to $99,999 | 1,602 (89.8%) | 182 (10.2%) |
| $100,000 and over | 6,088 (93.4%) | 433 (6.6%) |
Public vs Private Health Insurance Coverage by Age in Oldsmar
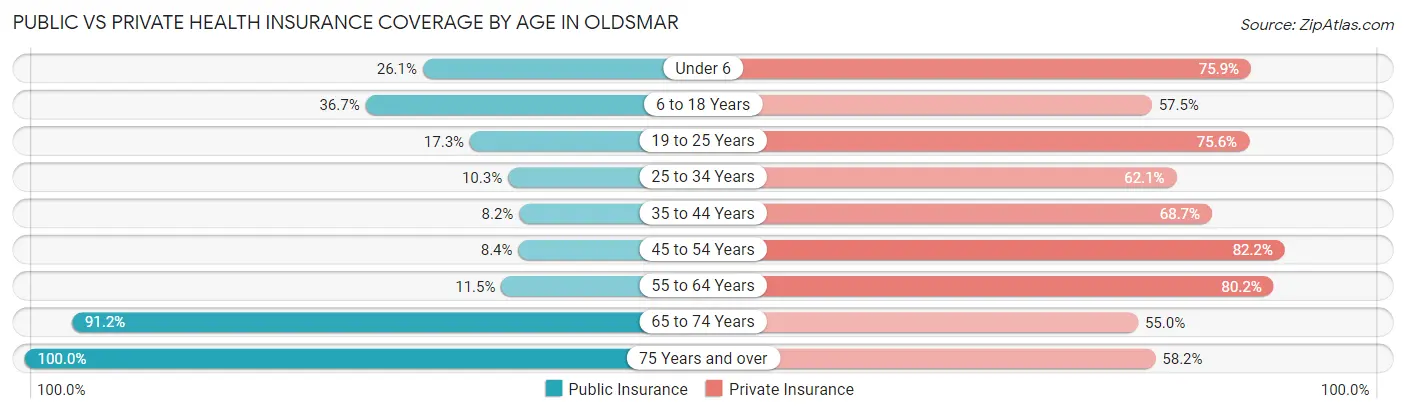
| Age Bracket | Public Insurance | Private Insurance |
| Under 6 | 246 (26.1%) | 716 (75.9%) |
| 6 to 18 Years | 830 (36.7%) | 1,300 (57.5%) |
| 19 to 25 Years | 249 (17.3%) | 1,085 (75.6%) |
| 25 to 34 Years | 195 (10.3%) | 1,178 (62.1%) |
| 35 to 44 Years | 149 (8.2%) | 1,248 (68.7%) |
| 45 to 54 Years | 163 (8.4%) | 1,604 (82.2%) |
| 55 to 64 Years | 268 (11.5%) | 1,865 (80.1%) |
| 65 to 74 Years | 1,329 (91.2%) | 801 (55.0%) |
| 75 Years and over | 634 (100.0%) | 369 (58.2%) |
| Total | 4,063 (27.6%) | 10,166 (69.1%) |
Disability Status by Sex by Age in Oldsmar
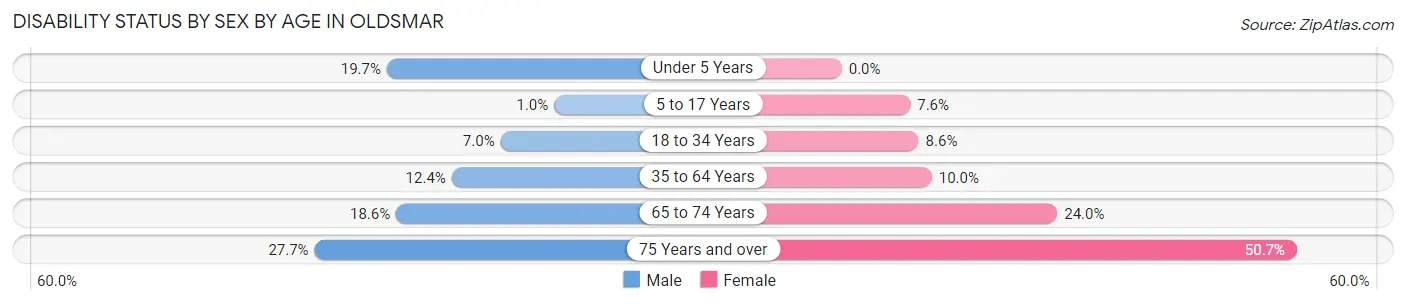
| Age Bracket | Male | Female |
| Under 5 Years | 80 (19.7%) | 0 (0.0%) |
| 5 to 17 Years | 14 (1.0%) | 70 (7.6%) |
| 18 to 34 Years | 118 (7.0%) | 146 (8.6%) |
| 35 to 64 Years | 361 (12.4%) | 320 (10.0%) |
| 65 to 74 Years | 117 (18.6%) | 199 (24.0%) |
| 75 Years and over | 74 (27.7%) | 186 (50.7%) |
Disability Class by Sex by Age in Oldsmar
Disability Class: Hearing Difficulty
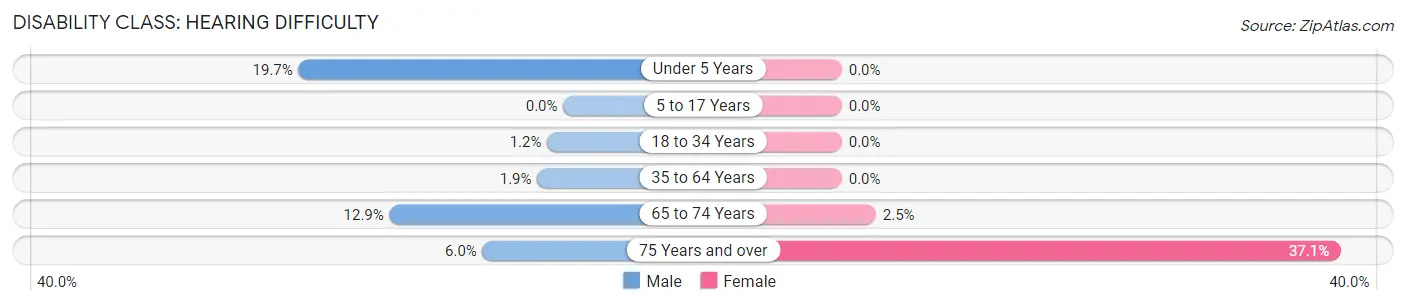
| Age Bracket | Male | Female |
| Under 5 Years | 80 (19.7%) | 0 (0.0%) |
| 5 to 17 Years | 0 (0.0%) | 0 (0.0%) |
| 18 to 34 Years | 20 (1.2%) | 0 (0.0%) |
| 35 to 64 Years | 56 (1.9%) | 0 (0.0%) |
| 65 to 74 Years | 81 (12.9%) | 21 (2.5%) |
| 75 Years and over | 16 (6.0%) | 136 (37.1%) |
Disability Class: Vision Difficulty
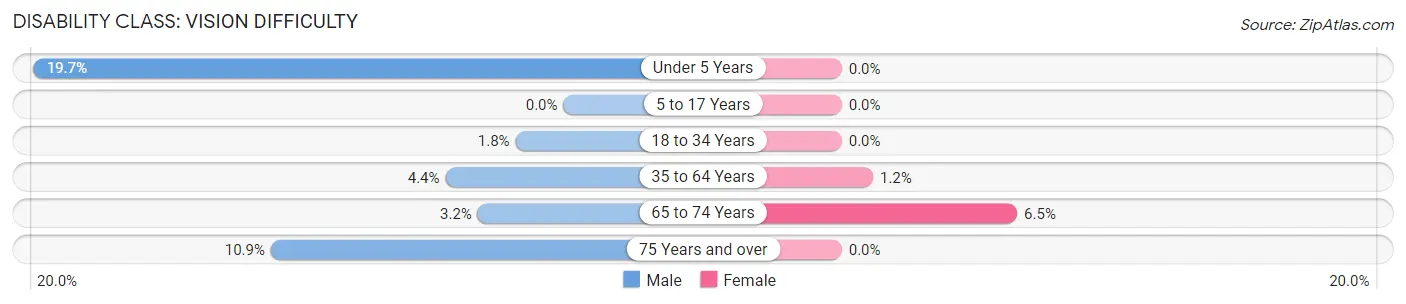
| Age Bracket | Male | Female |
| Under 5 Years | 80 (19.7%) | 0 (0.0%) |
| 5 to 17 Years | 0 (0.0%) | 0 (0.0%) |
| 18 to 34 Years | 30 (1.8%) | 0 (0.0%) |
| 35 to 64 Years | 127 (4.4%) | 37 (1.2%) |
| 65 to 74 Years | 20 (3.2%) | 54 (6.5%) |
| 75 Years and over | 29 (10.9%) | 0 (0.0%) |
Disability Class: Cognitive Difficulty
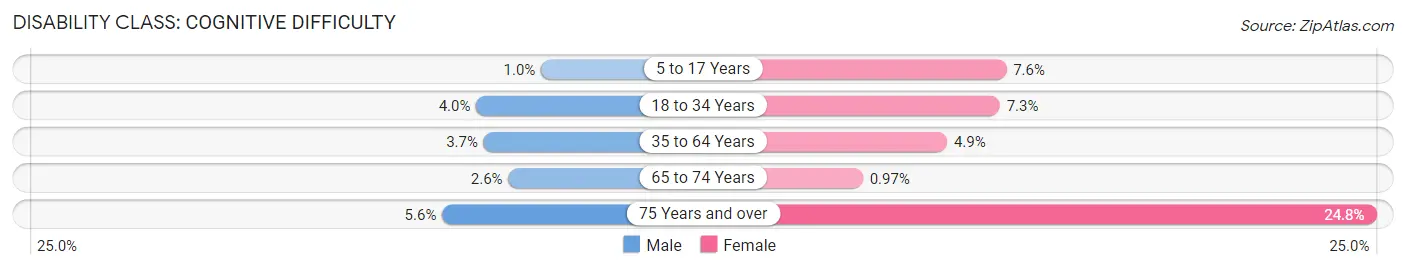
| Age Bracket | Male | Female |
| 5 to 17 Years | 14 (1.0%) | 70 (7.6%) |
| 18 to 34 Years | 68 (4.0%) | 125 (7.3%) |
| 35 to 64 Years | 107 (3.7%) | 156 (4.9%) |
| 65 to 74 Years | 16 (2.5%) | 8 (1.0%) |
| 75 Years and over | 15 (5.6%) | 91 (24.8%) |
Disability Class: Ambulatory Difficulty
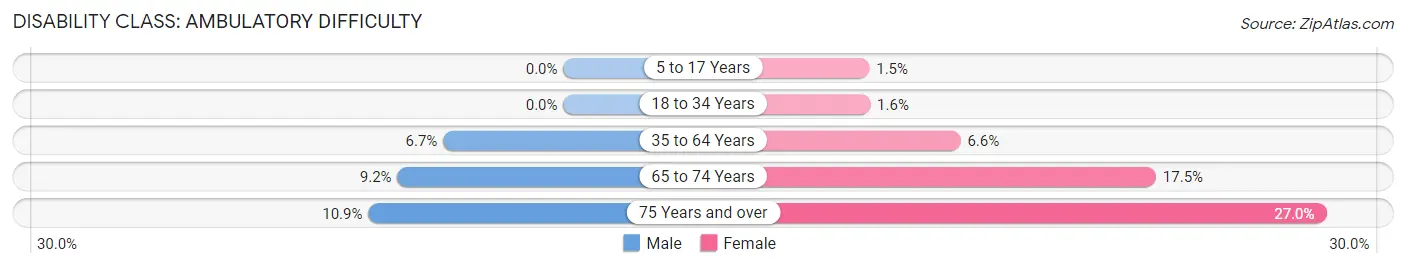
| Age Bracket | Male | Female |
| 5 to 17 Years | 0 (0.0%) | 14 (1.5%) |
| 18 to 34 Years | 0 (0.0%) | 27 (1.6%) |
| 35 to 64 Years | 194 (6.7%) | 211 (6.6%) |
| 65 to 74 Years | 58 (9.2%) | 145 (17.5%) |
| 75 Years and over | 29 (10.9%) | 99 (27.0%) |
Disability Class: Self-Care Difficulty
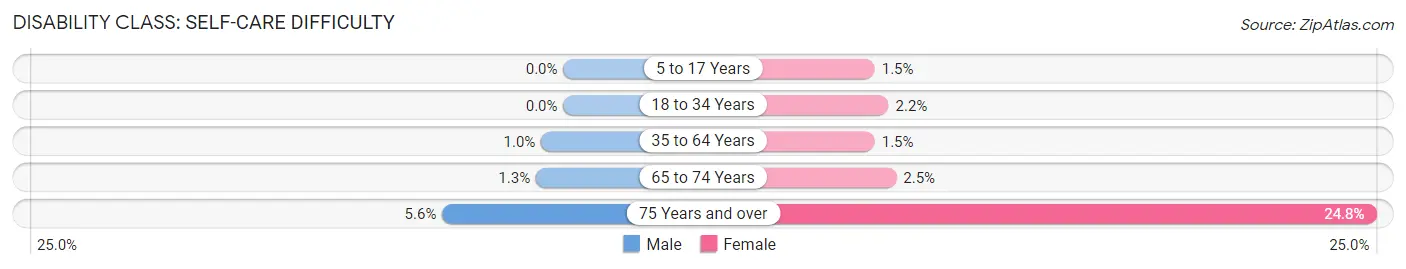
| Age Bracket | Male | Female |
| 5 to 17 Years | 0 (0.0%) | 14 (1.5%) |
| 18 to 34 Years | 0 (0.0%) | 37 (2.2%) |
| 35 to 64 Years | 30 (1.0%) | 49 (1.5%) |
| 65 to 74 Years | 8 (1.3%) | 21 (2.5%) |
| 75 Years and over | 15 (5.6%) | 91 (24.8%) |
Technology Access in Oldsmar
Computing Device Access in Oldsmar
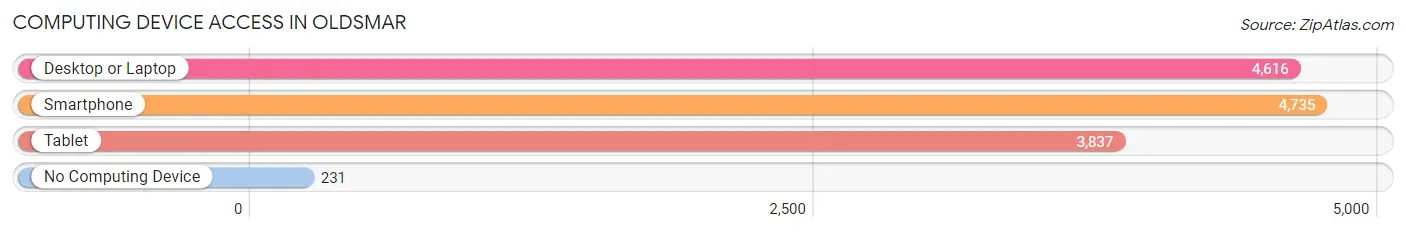
| Device Type | # Households | % Households |
| Desktop or Laptop | 4,616 | 86.7% |
| Smartphone | 4,735 | 88.9% |
| Tablet | 3,837 | 72.0% |
| No Computing Device | 231 | 4.3% |
| Total | 5,326 | 100.0% |
Internet Access in Oldsmar
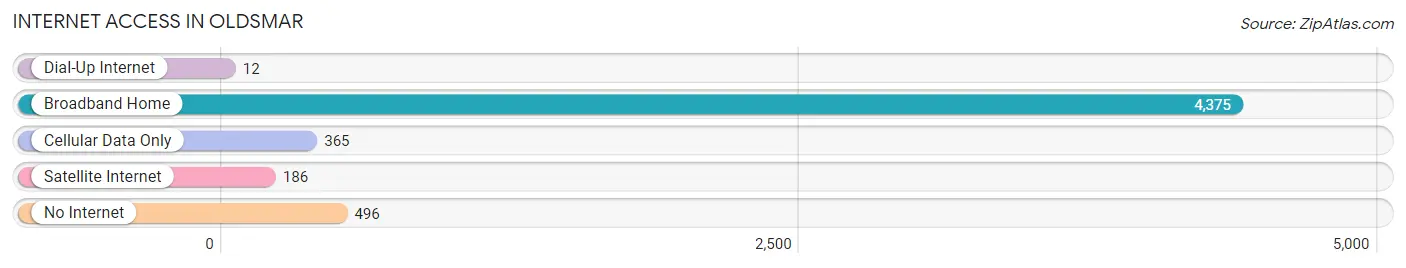
| Internet Type | # Households | % Households |
| Dial-Up Internet | 12 | 0.2% |
| Broadband Home | 4,375 | 82.1% |
| Cellular Data Only | 365 | 6.9% |
| Satellite Internet | 186 | 3.5% |
| No Internet | 496 | 9.3% |
| Total | 5,326 | 100.0% |
Oldsmar Summary
Oldsmar is a city located in Pinellas County, Florida, United States. It is located on the northern shore of Tampa Bay, approximately 15 miles northwest of downtown Tampa. The population was 13,591 at the 2010 census.
Geography
Oldsmar is located at 28°03′N 82°39′W (28.05, -82.65). According to the United States Census Bureau, the city has a total area of 8.2 square miles (21.2 km2), of which 7.9 square miles (20.5 km2) is land and 0.3 square miles (0.7 km2) (3.45%) is water.
History
Oldsmar was founded in 1916 by Ransom E. Olds, the founder of Oldsmobile. The city was originally named after him, but was later changed to Oldsmar. The city was incorporated in 1924.
Economy
Oldsmar is home to several large employers, including Nielsen Media Research, Raymond James Financial, and the Tampa Bay Times. The city also has a thriving tourism industry, with many hotels, restaurants, and attractions.
Demographics
As of the census of 2010, there were 13,591 people, 5,845 households, and 3,717 families residing in the city. The population density was 1,717.2 people per square mile (662.7/km2). There were 6,541 housing units at an average density of 822.3 per square mile (317.7/km2). The racial makeup of the city was 79.2% White, 8.2% African American, 0.3% Native American, 4.2% Asian, 0.1% Pacific Islander, 4.7% from other races, and 3.3% from two or more races. Hispanic or Latino of any race were 15.2% of the population.
There were 5,845 households, out of which 24.2% had children under the age of 18 living with them, 46.2% were married couples living together, 11.7% had a female householder with no husband present, and 37.2% were non-families. 30.2% of all households were made up of individuals, and 11.2% had someone living alone who was 65 years of age or older. The average household size was 2.31 and the average family size was 2.88.
In the city, the population was spread out, with 20.7% under the age of 18, 7.2% from 18 to 24, 28.2% from 25 to 44, 25.3% from 45 to 64, and 18.6% who were 65 years of age or older. The median age was 40 years. For every 100 females, there were 93.2 males. For every 100 females age 18 and over, there were 90.2 males.
The median income for a household in the city was $45,945, and the median income for a family was $54,945. Males had a median income of $41,945 versus $30,945 for females. The per capita income for the city was $25,945. About 6.2% of families and 8.2% of the population were below the poverty line, including 11.2% of those under age 18 and 6.2% of those age 65 or over.
Common Questions
What is Per Capita Income in Oldsmar?
Per Capita income in Oldsmar is $37,469.
What is the Median Family Income in Oldsmar?
Median Family Income in Oldsmar is $88,317.
What is the Median Household income in Oldsmar?
Median Household Income in Oldsmar is $73,984.
What is Income or Wage Gap in Oldsmar?
Income or Wage Gap in Oldsmar is 16.0%.
Women in Oldsmar earn 84.0 cents for every dollar earned by a man.
What is Inequality or Gini Index in Oldsmar?
Inequality or Gini Index in Oldsmar is 0.44.
What is the Total Population of Oldsmar?
Total Population of Oldsmar is 14,877.
What is the Total Male Population of Oldsmar?
Total Male Population of Oldsmar is 7,308.
What is the Total Female Population of Oldsmar?
Total Female Population of Oldsmar is 7,569.
What is the Ratio of Males per 100 Females in Oldsmar?
There are 96.55 Males per 100 Females in Oldsmar.
What is the Ratio of Females per 100 Males in Oldsmar?
There are 103.57 Females per 100 Males in Oldsmar.
What is the Median Population Age in Oldsmar?
Median Population Age in Oldsmar is 38.7 Years.
What is the Average Family Size in Oldsmar
Average Family Size in Oldsmar is 3.2 People.
What is the Average Household Size in Oldsmar
Average Household Size in Oldsmar is 2.8 People.
How Large is the Labor Force in Oldsmar?
There are 7,819 People in the Labor Forcein in Oldsmar.
What is the Percentage of People in the Labor Force in Oldsmar?
65.2% of People are in the Labor Force in Oldsmar.
What is the Unemployment Rate in Oldsmar?
Unemployment Rate in Oldsmar is 5.3%.