Lake Alfred, FL Map & Demographics
Lake Alfred Map
Lake Alfred Overview
$28,713
PER CAPITA INCOME
$76,083
AVG FAMILY INCOME
$62,311
AVG HOUSEHOLD INCOME
2.9%
WAGE / INCOME GAP [ % ]
97.1¢/ $1
WAGE / INCOME GAP [ $ ]
0.42
INEQUALITY / GINI INDEX
6,555
TOTAL POPULATION
3,001
MALE POPULATION
3,554
FEMALE POPULATION
84.44
MALES / 100 FEMALES
118.43
FEMALES / 100 MALES
36.3
MEDIAN AGE
3.4
AVG FAMILY SIZE
2.9
AVG HOUSEHOLD SIZE
3,537
LABOR FORCE [ PEOPLE ]
66.8%
PERCENT IN LABOR FORCE
6.7%
UNEMPLOYMENT RATE
Lake Alfred Zip Codes
Lake Alfred Area Codes
Income in Lake Alfred
Income Overview in Lake Alfred
Per Capita Income in Lake Alfred is $28,713, while median incomes of families and households are $76,083 and $62,311 respectively.
| Characteristic | Number | Measure |
| Per Capita Income | 6,555 | $28,713 |
| Median Family Income | 1,434 | $76,083 |
| Mean Family Income | 1,434 | $95,238 |
| Median Household Income | 2,254 | $62,311 |
| Mean Household Income | 2,254 | $78,771 |
| Income Deficit | 1,434 | $0 |
| Wage / Income Gap (%) | 6,555 | 2.87% |
| Wage / Income Gap ($) | 6,555 | 97.13¢ per $1 |
| Gini / Inequality Index | 6,555 | 0.42 |
Earnings by Sex in Lake Alfred
Average Earnings in Lake Alfred are $34,021, $34,309 for men and $33,325 for women, a difference of 2.9%.
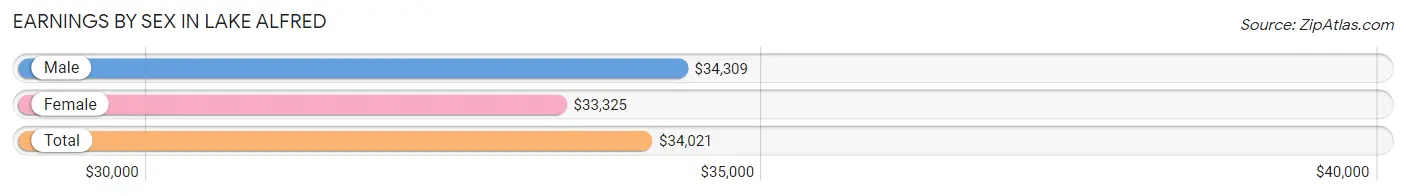
| Sex | Number | Average Earnings |
| Male | 1,708 (48.3%) | $34,309 |
| Female | 1,826 (51.7%) | $33,325 |
| Total | 3,534 (100.0%) | $34,021 |
Earnings by Sex by Income Bracket in Lake Alfred
The most common earnings brackets in Lake Alfred are $30,000 to $34,999 for men (251 | 14.7%) and $35,000 to $39,999 for women (345 | 18.9%).
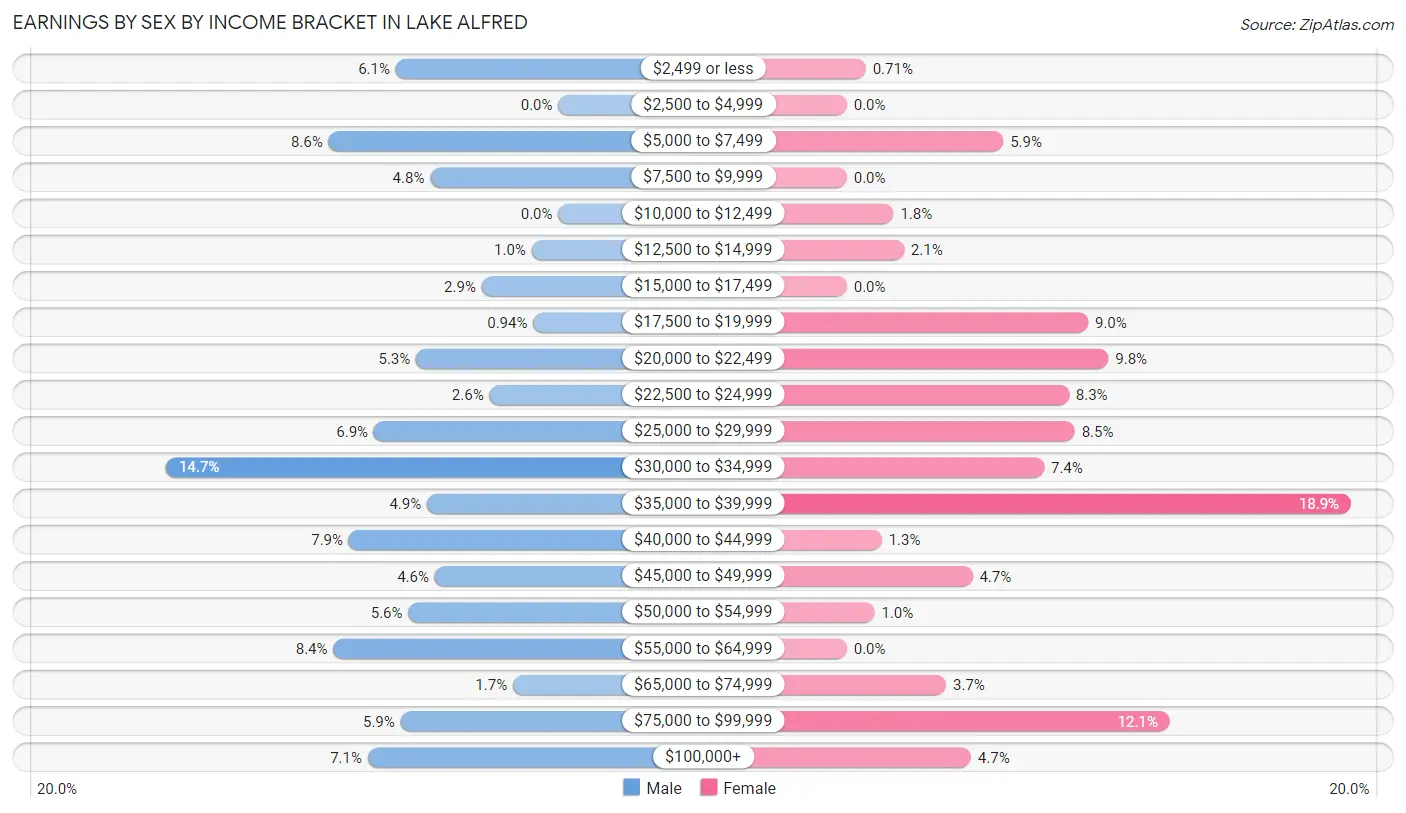
| Income | Male | Female |
| $2,499 or less | 104 (6.1%) | 13 (0.7%) |
| $2,500 to $4,999 | 0 (0.0%) | 0 (0.0%) |
| $5,000 to $7,499 | 147 (8.6%) | 107 (5.9%) |
| $7,500 to $9,999 | 82 (4.8%) | 0 (0.0%) |
| $10,000 to $12,499 | 0 (0.0%) | 32 (1.8%) |
| $12,500 to $14,999 | 17 (1.0%) | 39 (2.1%) |
| $15,000 to $17,499 | 49 (2.9%) | 0 (0.0%) |
| $17,500 to $19,999 | 16 (0.9%) | 165 (9.0%) |
| $20,000 to $22,499 | 91 (5.3%) | 179 (9.8%) |
| $22,500 to $24,999 | 44 (2.6%) | 152 (8.3%) |
| $25,000 to $29,999 | 118 (6.9%) | 156 (8.5%) |
| $30,000 to $34,999 | 251 (14.7%) | 135 (7.4%) |
| $35,000 to $39,999 | 84 (4.9%) | 345 (18.9%) |
| $40,000 to $44,999 | 134 (7.9%) | 24 (1.3%) |
| $45,000 to $49,999 | 79 (4.6%) | 86 (4.7%) |
| $50,000 to $54,999 | 96 (5.6%) | 19 (1.0%) |
| $55,000 to $64,999 | 144 (8.4%) | 0 (0.0%) |
| $65,000 to $74,999 | 29 (1.7%) | 68 (3.7%) |
| $75,000 to $99,999 | 101 (5.9%) | 221 (12.1%) |
| $100,000+ | 122 (7.1%) | 85 (4.6%) |
| Total | 1,708 (100.0%) | 1,826 (100.0%) |
Earnings by Sex by Educational Attainment in Lake Alfred
Average earnings in Lake Alfred are $34,729 for men and $35,202 for women, a difference of 1.3%. Men with an educational attainment of graduate degree enjoy the highest average annual earnings of $57,033, while those with less than high school education earn the least with $24,034. Women with an educational attainment of bachelor's degree earn the most with the average annual earnings of $69,816, while those with college or associate's degree education have the smallest earnings of $33,840.
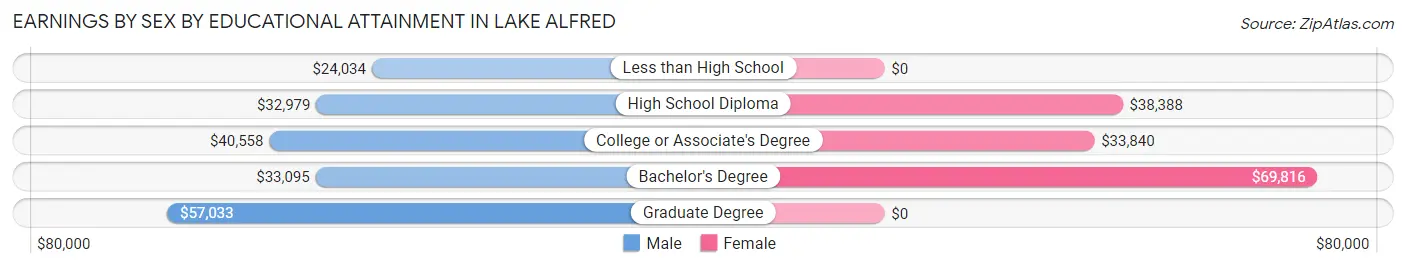
| Educational Attainment | Male Income | Female Income |
| Less than High School | $24,034 | $0 |
| High School Diploma | $32,979 | $38,388 |
| College or Associate's Degree | $40,558 | $33,840 |
| Bachelor's Degree | $33,095 | $69,816 |
| Graduate Degree | $57,033 | $0 |
| Total | $34,729 | $35,202 |
Family Income in Lake Alfred
Family Income Brackets in Lake Alfred
According to the Lake Alfred family income data, there are 308 families falling into the $100,000 to $149,999 income range, which is the most common income bracket and makes up 21.5% of all families. Conversely, the less than $10,000 income bracket is the least frequent group with only 20 families (1.4%) belonging to this category.
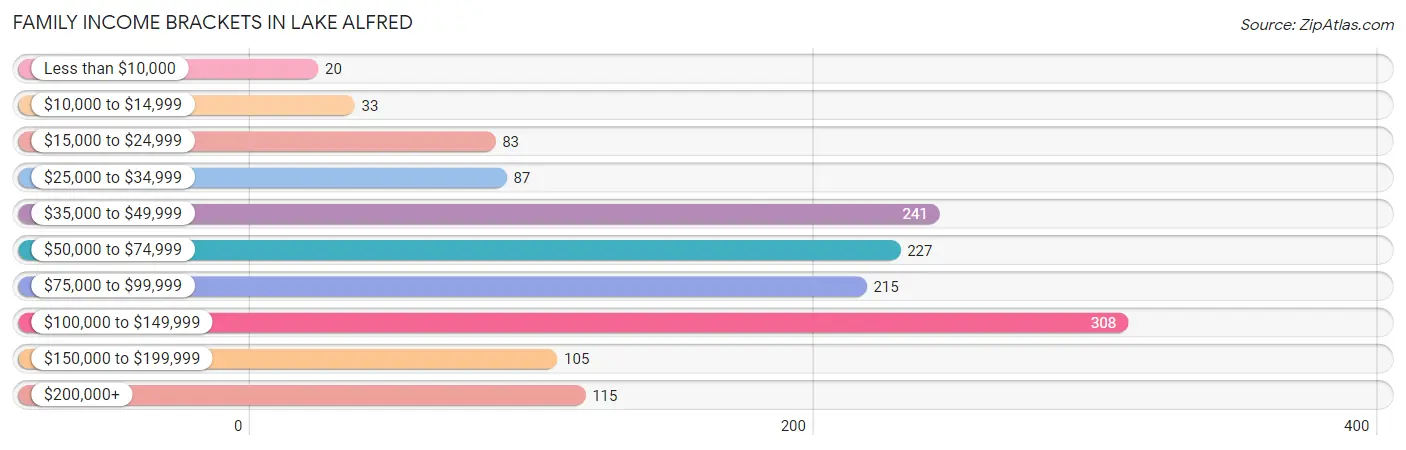
| Income Bracket | # Families | % Families |
| Less than $10,000 | 20 | 1.4% |
| $10,000 to $14,999 | 33 | 2.3% |
| $15,000 to $24,999 | 83 | 5.8% |
| $25,000 to $34,999 | 87 | 6.1% |
| $35,000 to $49,999 | 241 | 16.8% |
| $50,000 to $74,999 | 227 | 15.8% |
| $75,000 to $99,999 | 215 | 15.0% |
| $100,000 to $149,999 | 308 | 21.5% |
| $150,000 to $199,999 | 105 | 7.3% |
| $200,000+ | 115 | 8.0% |
Family Income by Famaliy Size in Lake Alfred
7+ person families (128 | 8.9%) account for the highest median family income in Lake Alfred with $147,892 per family, while 2-person families (659 | 46.0%) have the highest median income of $32,552 per family member.
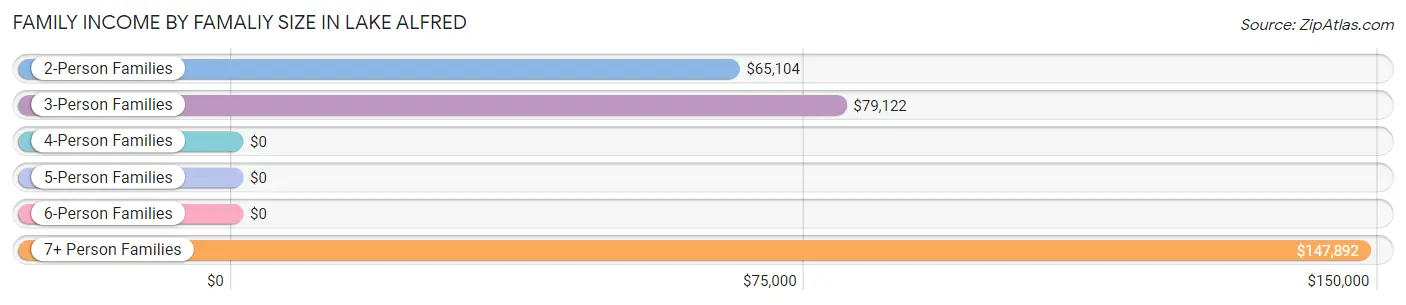
| Income Bracket | # Families | Median Income |
| 2-Person Families | 659 (46.0%) | $65,104 |
| 3-Person Families | 426 (29.7%) | $79,122 |
| 4-Person Families | 123 (8.6%) | $0 |
| 5-Person Families | 98 (6.8%) | $0 |
| 6-Person Families | 0 (0.0%) | $0 |
| 7+ Person Families | 128 (8.9%) | $147,892 |
| Total | 1,434 (100.0%) | $76,083 |
Family Income by Number of Earners in Lake Alfred
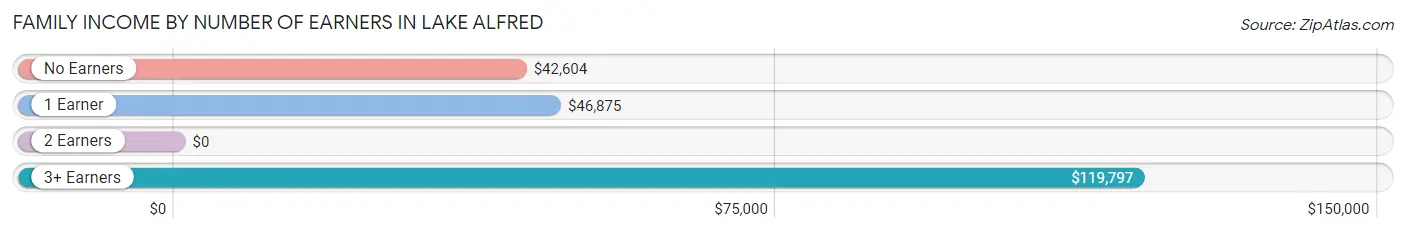
| Number of Earners | # Families | Median Income |
| No Earners | 226 (15.8%) | $42,604 |
| 1 Earner | 418 (29.1%) | $46,875 |
| 2 Earners | 607 (42.3%) | $0 |
| 3+ Earners | 183 (12.8%) | $119,797 |
| Total | 1,434 (100.0%) | $76,083 |
Household Income in Lake Alfred
Household Income Brackets in Lake Alfred
With 435 households falling in the category, the $100,000 to $149,999 income range is the most frequent in Lake Alfred, accounting for 19.3% of all households. In contrast, only 59 households (2.6%) fall into the $10,000 to $14,999 income bracket, making it the least populous group.
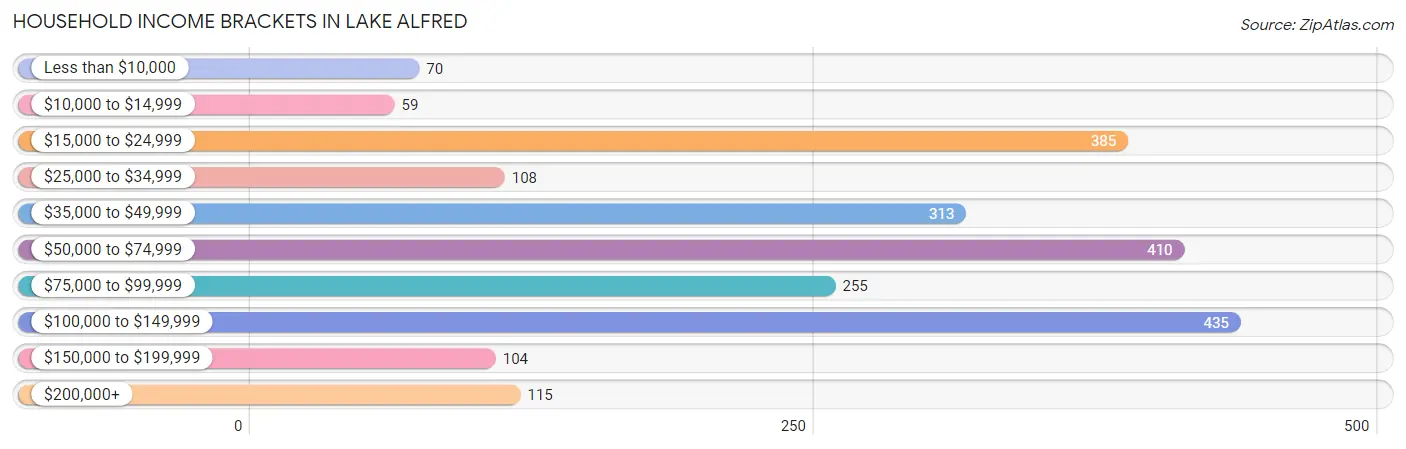
| Income Bracket | # Households | % Households |
| Less than $10,000 | 70 | 3.1% |
| $10,000 to $14,999 | 59 | 2.6% |
| $15,000 to $24,999 | 385 | 17.1% |
| $25,000 to $34,999 | 108 | 4.8% |
| $35,000 to $49,999 | 313 | 13.9% |
| $50,000 to $74,999 | 410 | 18.2% |
| $75,000 to $99,999 | 255 | 11.3% |
| $100,000 to $149,999 | 435 | 19.3% |
| $150,000 to $199,999 | 104 | 4.6% |
| $200,000+ | 115 | 5.1% |
Household Income by Householder Age in Lake Alfred
The median household income in Lake Alfred is $62,311, with the highest median household income of $84,630 found in the 45 to 64 years age bracket for the primary householder. A total of 576 households (25.6%) fall into this category. Meanwhile, the 15 to 24 years age bracket for the primary householder has the lowest median household income of $0, with 38 households (1.7%) in this group.
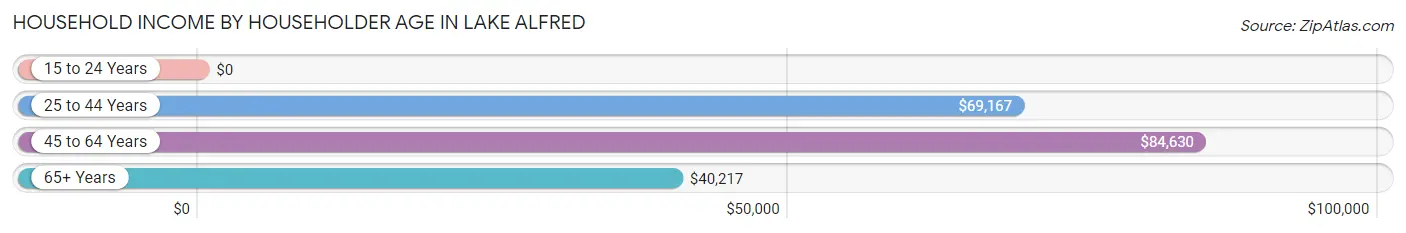
| Income Bracket | # Households | Median Income |
| 15 to 24 Years | 38 (1.7%) | $0 |
| 25 to 44 Years | 902 (40.0%) | $69,167 |
| 45 to 64 Years | 576 (25.6%) | $84,630 |
| 65+ Years | 738 (32.7%) | $40,217 |
| Total | 2,254 (100.0%) | $62,311 |
Poverty in Lake Alfred
Income Below Poverty by Sex and Age in Lake Alfred
With 9.1% poverty level for males and 9.7% for females among the residents of Lake Alfred, 35 to 44 year old males and 25 to 34 year old females are the most vulnerable to poverty, with 138 males (24.9%) and 150 females (19.1%) in their respective age groups living below the poverty level.
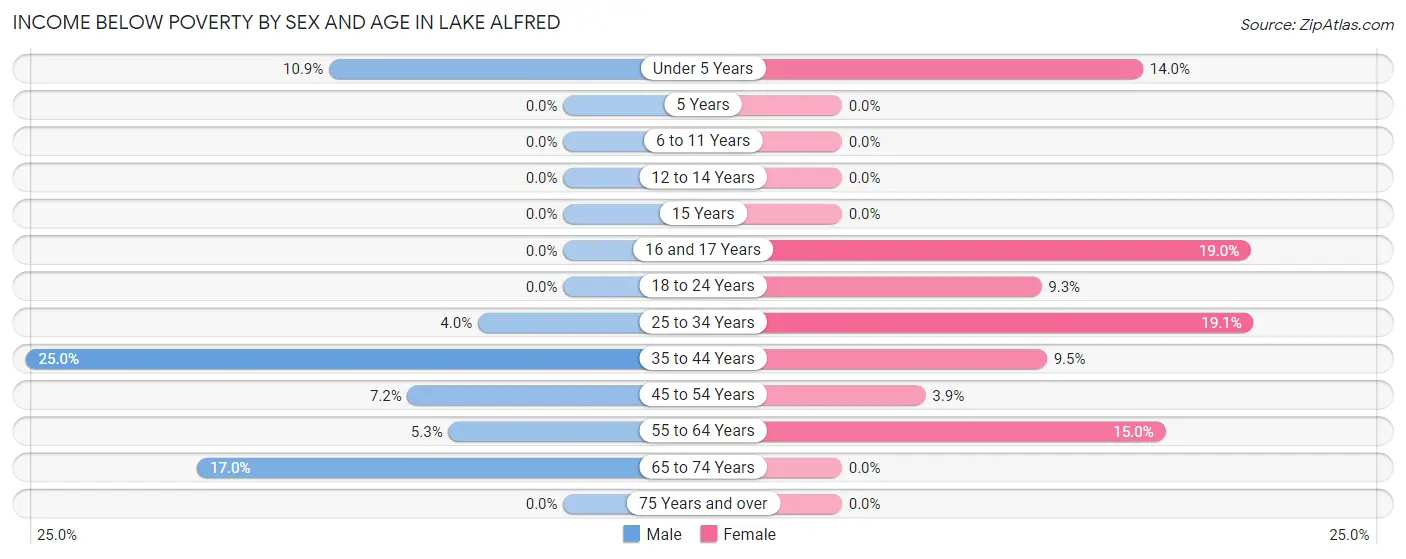
| Age Bracket | Male | Female |
| Under 5 Years | 25 (10.9%) | 44 (14.0%) |
| 5 Years | 0 (0.0%) | 0 (0.0%) |
| 6 to 11 Years | 0 (0.0%) | 0 (0.0%) |
| 12 to 14 Years | 0 (0.0%) | 0 (0.0%) |
| 15 Years | 0 (0.0%) | 0 (0.0%) |
| 16 and 17 Years | 0 (0.0%) | 15 (19.0%) |
| 18 to 24 Years | 0 (0.0%) | 20 (9.3%) |
| 25 to 34 Years | 22 (4.0%) | 150 (19.1%) |
| 35 to 44 Years | 138 (24.9%) | 52 (9.5%) |
| 45 to 54 Years | 17 (7.2%) | 13 (3.9%) |
| 55 to 64 Years | 16 (5.3%) | 47 (15.0%) |
| 65 to 74 Years | 52 (17.0%) | 0 (0.0%) |
| 75 Years and over | 0 (0.0%) | 0 (0.0%) |
| Total | 270 (9.1%) | 341 (9.7%) |
Income Above Poverty by Sex and Age in Lake Alfred
According to the poverty statistics in Lake Alfred, males aged 5 years and females aged 5 years are the age groups that are most secure financially, with 100.0% of males and 100.0% of females in these age groups living above the poverty line.
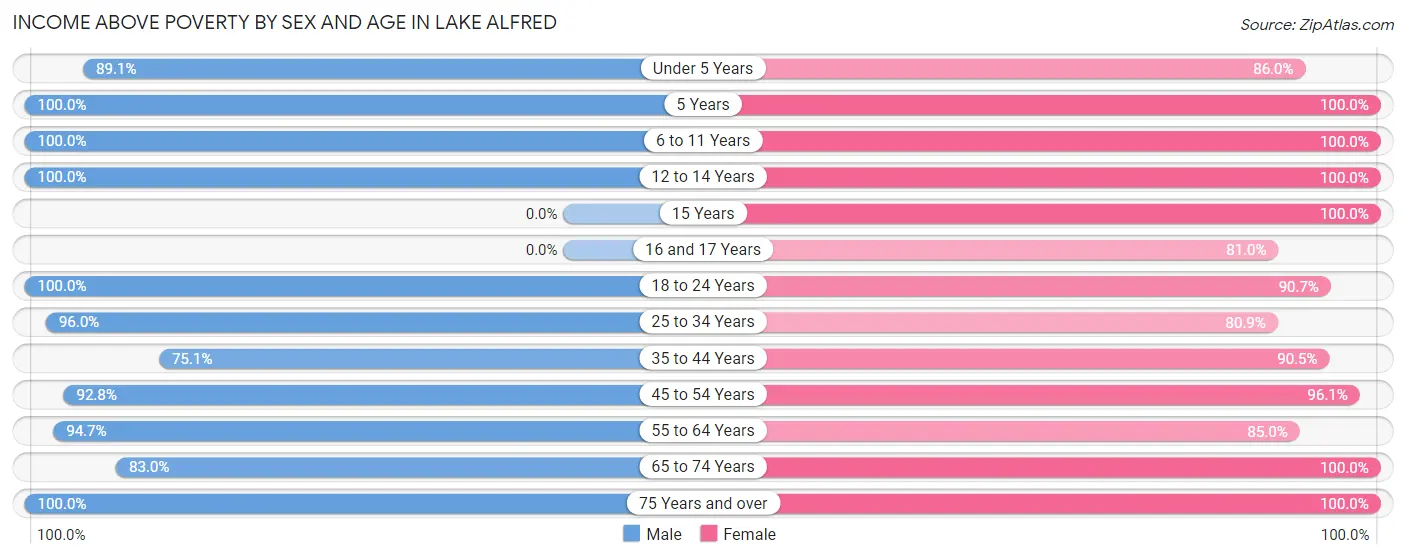
| Age Bracket | Male | Female |
| Under 5 Years | 205 (89.1%) | 271 (86.0%) |
| 5 Years | 7 (100.0%) | 20 (100.0%) |
| 6 to 11 Years | 141 (100.0%) | 233 (100.0%) |
| 12 to 14 Years | 159 (100.0%) | 126 (100.0%) |
| 15 Years | 0 (0.0%) | 29 (100.0%) |
| 16 and 17 Years | 0 (0.0%) | 64 (81.0%) |
| 18 to 24 Years | 167 (100.0%) | 196 (90.7%) |
| 25 to 34 Years | 534 (96.0%) | 635 (80.9%) |
| 35 to 44 Years | 415 (75.0%) | 495 (90.5%) |
| 45 to 54 Years | 218 (92.8%) | 322 (96.1%) |
| 55 to 64 Years | 284 (94.7%) | 266 (85.0%) |
| 65 to 74 Years | 254 (83.0%) | 343 (100.0%) |
| 75 Years and over | 320 (100.0%) | 190 (100.0%) |
| Total | 2,704 (90.9%) | 3,190 (90.3%) |
Income Below Poverty Among Married-Couple Families in Lake Alfred
The poverty statistics for married-couple families in Lake Alfred show that 3.8% or 46 of the total 1,202 families live below the poverty line. Families with 3 or 4 children have the highest poverty rate of 11.6%, comprising of 16 families. On the other hand, families with no children have the lowest poverty rate of 1.8%, which includes 13 families.
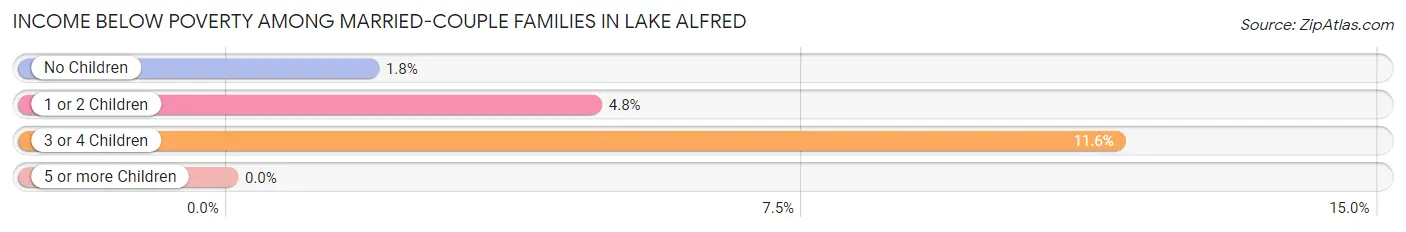
| Children | Above Poverty | Below Poverty |
| No Children | 693 (98.2%) | 13 (1.8%) |
| 1 or 2 Children | 341 (95.3%) | 17 (4.8%) |
| 3 or 4 Children | 122 (88.4%) | 16 (11.6%) |
| 5 or more Children | 0 (0.0%) | 0 (0.0%) |
| Total | 1,156 (96.2%) | 46 (3.8%) |
Income Below Poverty Among Single-Parent Households in Lake Alfred
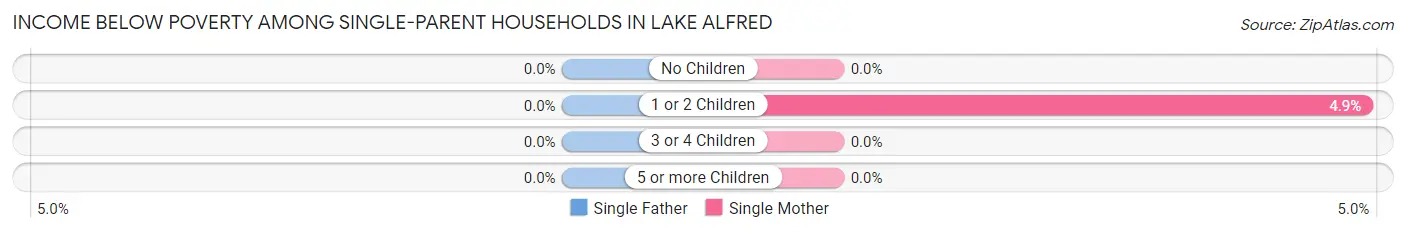
| Children | Single Father | Single Mother |
| No Children | 0 (0.0%) | 0 (0.0%) |
| 1 or 2 Children | 0 (0.0%) | 7 (4.9%) |
| 3 or 4 Children | 0 (0.0%) | 0 (0.0%) |
| 5 or more Children | 0 (0.0%) | 0 (0.0%) |
| Total | 0 (0.0%) | 7 (3.0%) |
Income Below Poverty Among Married-Couple vs Single-Parent Households in Lake Alfred
The poverty data for Lake Alfred shows that 46 of the married-couple family households (3.8%) and 7 of the single-parent households (3.0%) are living below the poverty level. Within the married-couple family households, those with 3 or 4 children have the highest poverty rate, with 16 households (11.6%) falling below the poverty line. Among the single-parent households, those with 1 or 2 children have the highest poverty rate, with 7 household (4.9%) living below poverty.
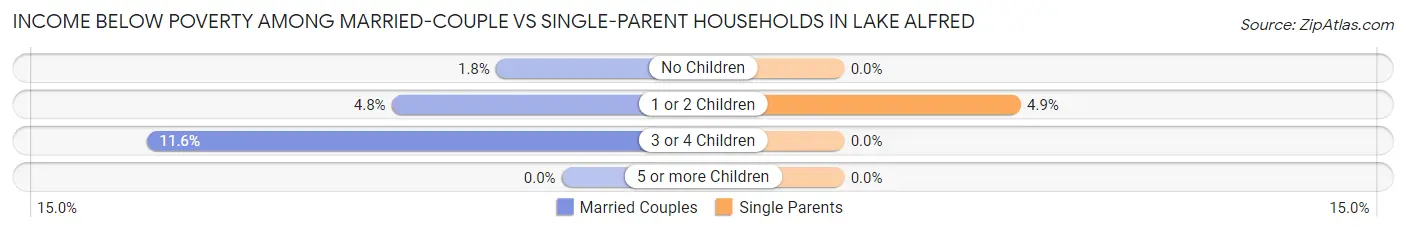
| Children | Married-Couple Families | Single-Parent Households |
| No Children | 13 (1.8%) | 0 (0.0%) |
| 1 or 2 Children | 17 (4.8%) | 7 (4.9%) |
| 3 or 4 Children | 16 (11.6%) | 0 (0.0%) |
| 5 or more Children | 0 (0.0%) | 0 (0.0%) |
| Total | 46 (3.8%) | 7 (3.0%) |
Race in Lake Alfred
The most populous races in Lake Alfred are White / Caucasian (3,563 | 54.4%), Hispanic or Latino (1,542 | 23.5%), and Black / African American (958 | 14.6%).
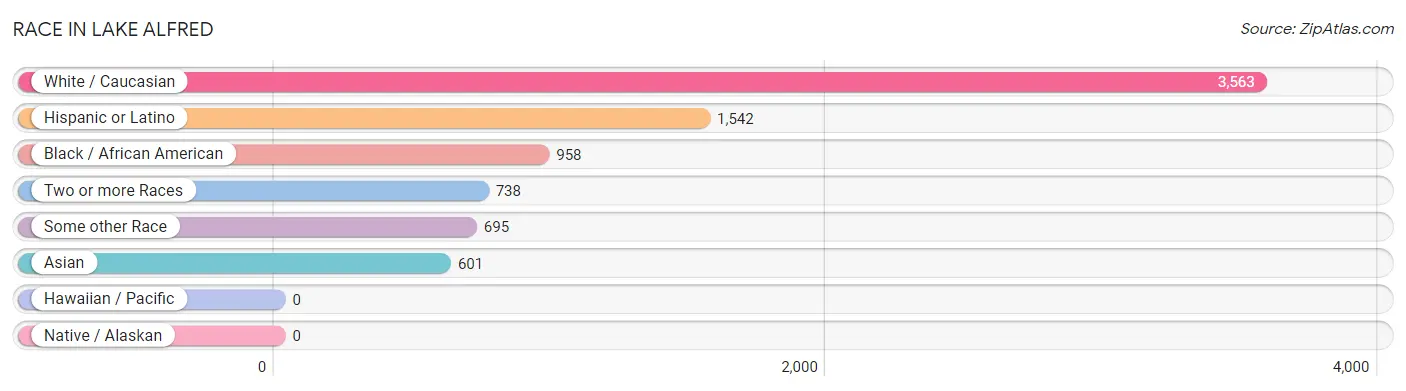
| Race | # Population | % Population |
| Asian | 601 | 9.2% |
| Black / African American | 958 | 14.6% |
| Hawaiian / Pacific | 0 | 0.0% |
| Hispanic or Latino | 1,542 | 23.5% |
| Native / Alaskan | 0 | 0.0% |
| White / Caucasian | 3,563 | 54.4% |
| Two or more Races | 738 | 11.3% |
| Some other Race | 695 | 10.6% |
| Total | 6,555 | 100.0% |
Ancestry in Lake Alfred
The most populous ancestries reported in Lake Alfred are Puerto Rican (1,208 | 18.4%), American (984 | 15.0%), German (601 | 9.2%), English (390 | 5.9%), and Northern European (314 | 4.8%), together accounting for 53.4% of all Lake Alfred residents.
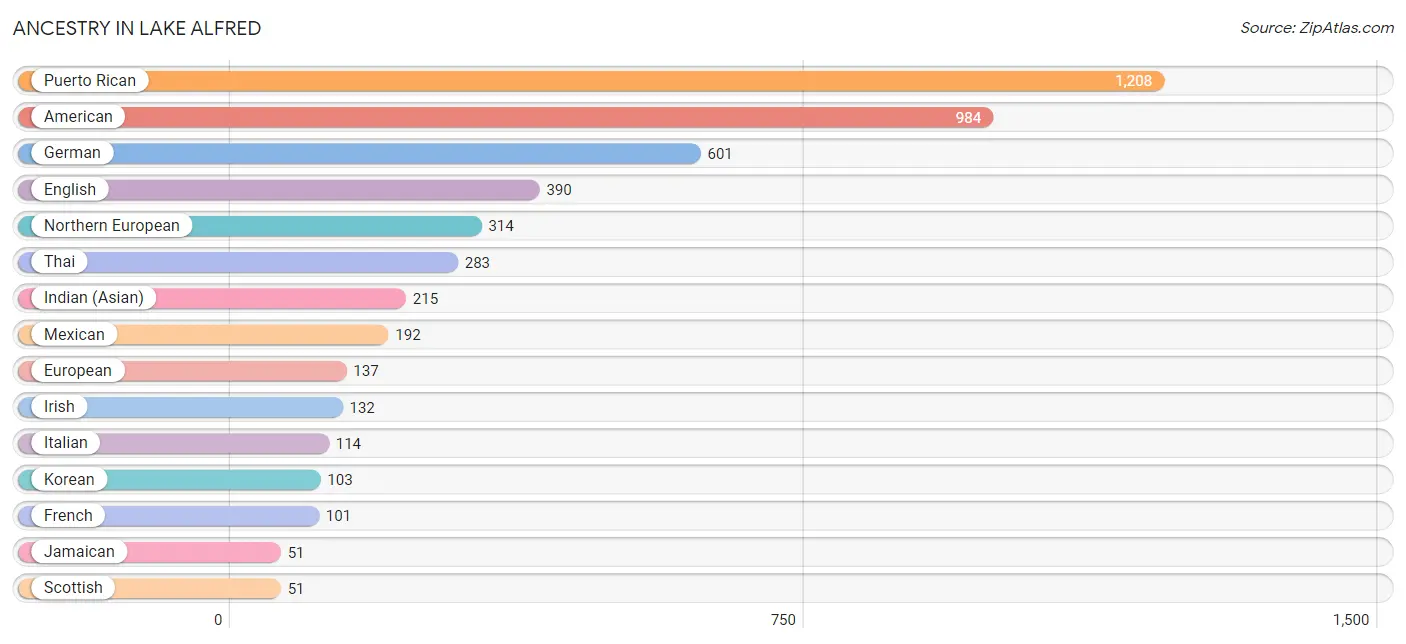
| Ancestry | # Population | % Population |
| American | 984 | 15.0% |
| British | 40 | 0.6% |
| Canadian | 26 | 0.4% |
| Central American | 26 | 0.4% |
| Cherokee | 33 | 0.5% |
| Colombian | 44 | 0.7% |
| Dominican | 33 | 0.5% |
| English | 390 | 5.9% |
| European | 137 | 2.1% |
| French | 101 | 1.5% |
| French Canadian | 31 | 0.5% |
| German | 601 | 9.2% |
| Guatemalan | 10 | 0.2% |
| Haitian | 39 | 0.6% |
| Indian (Asian) | 215 | 3.3% |
| Irish | 132 | 2.0% |
| Italian | 114 | 1.7% |
| Jamaican | 51 | 0.8% |
| Korean | 103 | 1.6% |
| Mexican | 192 | 2.9% |
| Northern European | 314 | 4.8% |
| Polish | 32 | 0.5% |
| Puerto Rican | 1,208 | 18.4% |
| Russian | 30 | 0.5% |
| Salvadoran | 16 | 0.2% |
| Scotch-Irish | 43 | 0.7% |
| Scottish | 51 | 0.8% |
| Serbian | 24 | 0.4% |
| South American | 44 | 0.7% |
| Swedish | 31 | 0.5% |
| Thai | 283 | 4.3% |
| Trinidadian and Tobagonian | 6 | 0.1% |
| Ukrainian | 17 | 0.3% | View All 33 Rows |
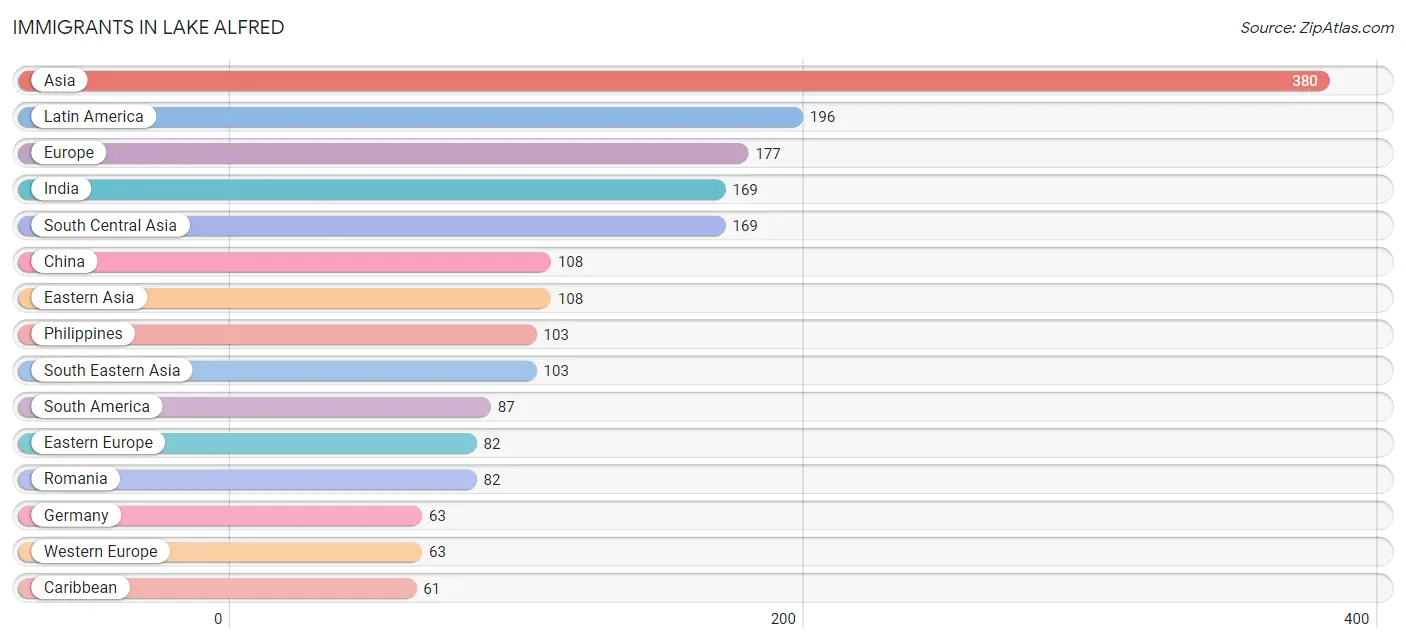
Immigrants in Lake Alfred
The most numerous immigrant groups reported in Lake Alfred came from Asia (380 | 5.8%), Latin America (196 | 3.0%), Europe (177 | 2.7%), India (169 | 2.6%), and South Central Asia (169 | 2.6%), together accounting for 16.6% of all Lake Alfred residents.
| Immigration Origin | # Population | % Population |
| Asia | 380 | 5.8% |
| Canada | 57 | 0.9% |
| Caribbean | 61 | 0.9% |
| Central America | 48 | 0.7% |
| China | 108 | 1.7% |
| Colombia | 44 | 0.7% |
| Eastern Asia | 108 | 1.7% |
| Eastern Europe | 82 | 1.3% |
| El Salvador | 16 | 0.2% |
| Europe | 177 | 2.7% |
| Germany | 63 | 1.0% |
| Guatemala | 10 | 0.2% |
| Guyana | 43 | 0.7% |
| Haiti | 55 | 0.8% |
| India | 169 | 2.6% |
| Latin America | 196 | 3.0% |
| Mexico | 22 | 0.3% |
| Northern Europe | 32 | 0.5% |
| Philippines | 103 | 1.6% |
| Romania | 82 | 1.3% |
| South America | 87 | 1.3% |
| South Central Asia | 169 | 2.6% |
| South Eastern Asia | 103 | 1.6% |
| Trinidad and Tobago | 6 | 0.1% |
| Western Europe | 63 | 1.0% | View All 25 Rows |
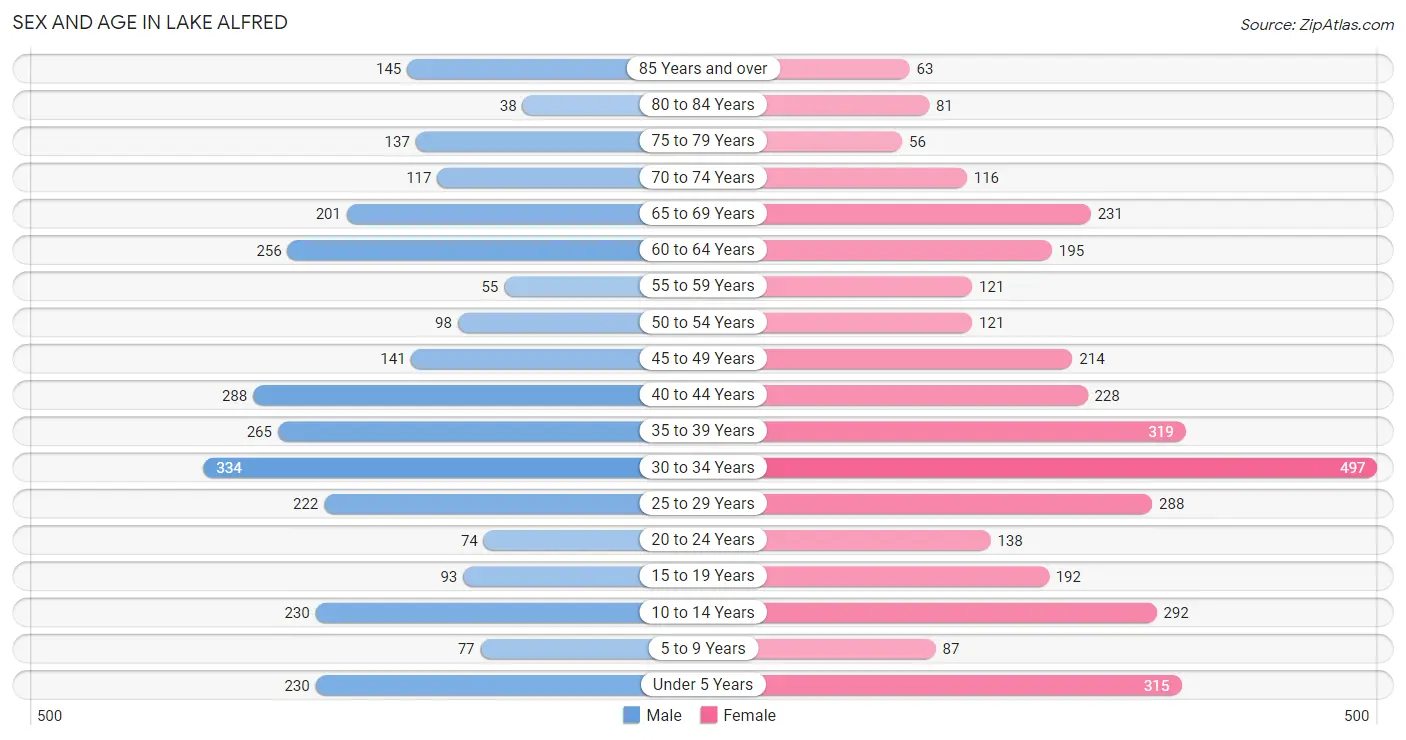
Sex and Age in Lake Alfred
Sex and Age in Lake Alfred
The most populous age groups in Lake Alfred are 30 to 34 Years (334 | 11.1%) for men and 30 to 34 Years (497 | 14.0%) for women.
| Age Bracket | Male | Female |
| Under 5 Years | 230 (7.7%) | 315 (8.9%) |
| 5 to 9 Years | 77 (2.6%) | 87 (2.5%) |
| 10 to 14 Years | 230 (7.7%) | 292 (8.2%) |
| 15 to 19 Years | 93 (3.1%) | 192 (5.4%) |
| 20 to 24 Years | 74 (2.5%) | 138 (3.9%) |
| 25 to 29 Years | 222 (7.4%) | 288 (8.1%) |
| 30 to 34 Years | 334 (11.1%) | 497 (14.0%) |
| 35 to 39 Years | 265 (8.8%) | 319 (9.0%) |
| 40 to 44 Years | 288 (9.6%) | 228 (6.4%) |
| 45 to 49 Years | 141 (4.7%) | 214 (6.0%) |
| 50 to 54 Years | 98 (3.3%) | 121 (3.4%) |
| 55 to 59 Years | 55 (1.8%) | 121 (3.4%) |
| 60 to 64 Years | 256 (8.5%) | 195 (5.5%) |
| 65 to 69 Years | 201 (6.7%) | 231 (6.5%) |
| 70 to 74 Years | 117 (3.9%) | 116 (3.3%) |
| 75 to 79 Years | 137 (4.6%) | 56 (1.6%) |
| 80 to 84 Years | 38 (1.3%) | 81 (2.3%) |
| 85 Years and over | 145 (4.8%) | 63 (1.8%) |
| Total | 3,001 (100.0%) | 3,554 (100.0%) |
Families and Households in Lake Alfred
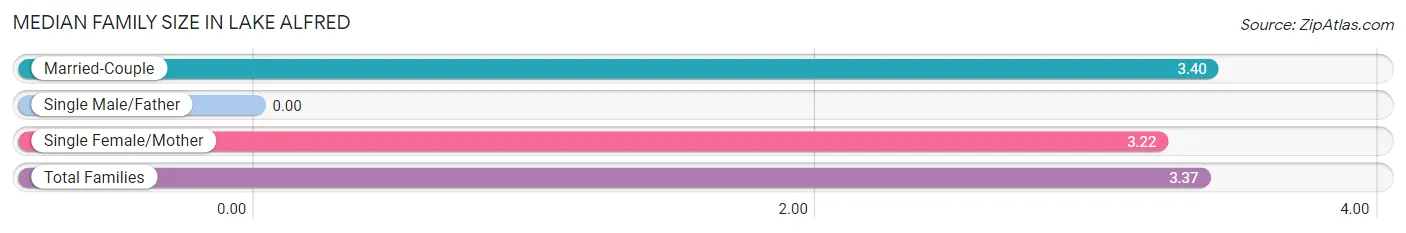
Median Family Size in Lake Alfred
| Family Type | # Families | Family Size |
| Married-Couple | 1,202 (83.8%) | 3.40 |
| Single Male/Father | 0 (0.0%) | - |
| Single Female/Mother | 232 (16.2%) | 3.22 |
| Total Families | 1,434 (100.0%) | 3.37 |
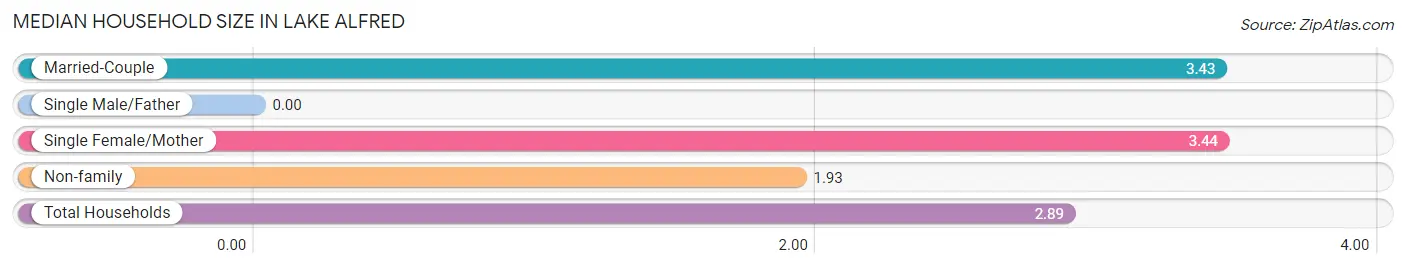
Median Household Size in Lake Alfred
| Household Type | # Households | Household Size |
| Married-Couple | 1,202 (53.3%) | 3.43 |
| Single Male/Father | 0 (0.0%) | - |
| Single Female/Mother | 232 (10.3%) | 3.44 |
| Non-family | 820 (36.4%) | 1.93 |
| Total Households | 2,254 (100.0%) | 2.89 |
Household Size by Marriage Status in Lake Alfred
Out of a total of 2,254 households in Lake Alfred, 1,434 (63.6%) are family households, while 820 (36.4%) are nonfamily households. The most numerous type of family households are 2-person households, comprising 613, and the most common type of nonfamily households are 1-person households, comprising 568.
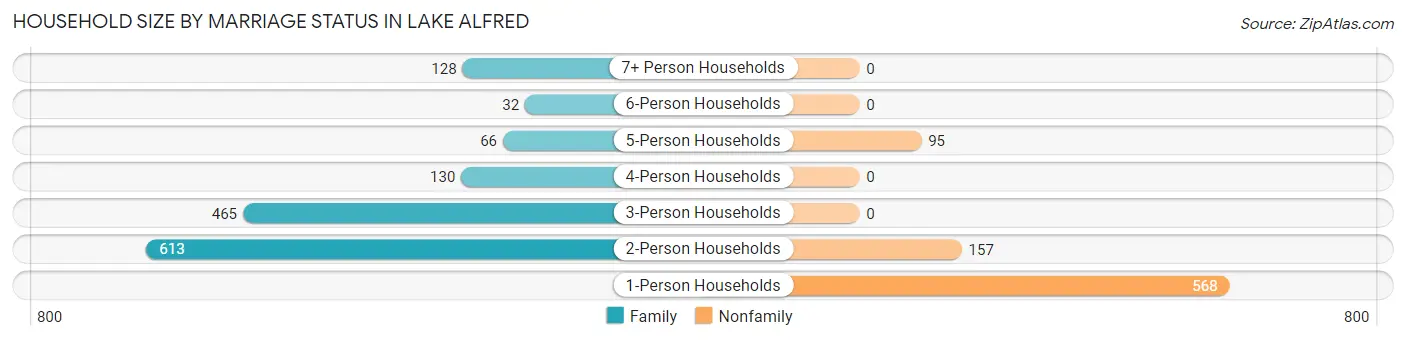
| Household Size | Family Households | Nonfamily Households |
| 1-Person Households | - | 568 (25.2%) |
| 2-Person Households | 613 (27.2%) | 157 (7.0%) |
| 3-Person Households | 465 (20.6%) | 0 (0.0%) |
| 4-Person Households | 130 (5.8%) | 0 (0.0%) |
| 5-Person Households | 66 (2.9%) | 95 (4.2%) |
| 6-Person Households | 32 (1.4%) | 0 (0.0%) |
| 7+ Person Households | 128 (5.7%) | 0 (0.0%) |
| Total | 1,434 (63.6%) | 820 (36.4%) |
Female Fertility in Lake Alfred
Fertility by Age in Lake Alfred
Average fertility rate in Lake Alfred is 106.0 births per 1,000 women. Women in the age bracket of 35 to 50 years have the highest fertility rate with 204.0 births per 1,000 women. Women in the age bracket of 35 to 50 years acount for 78.3% of all women with births.
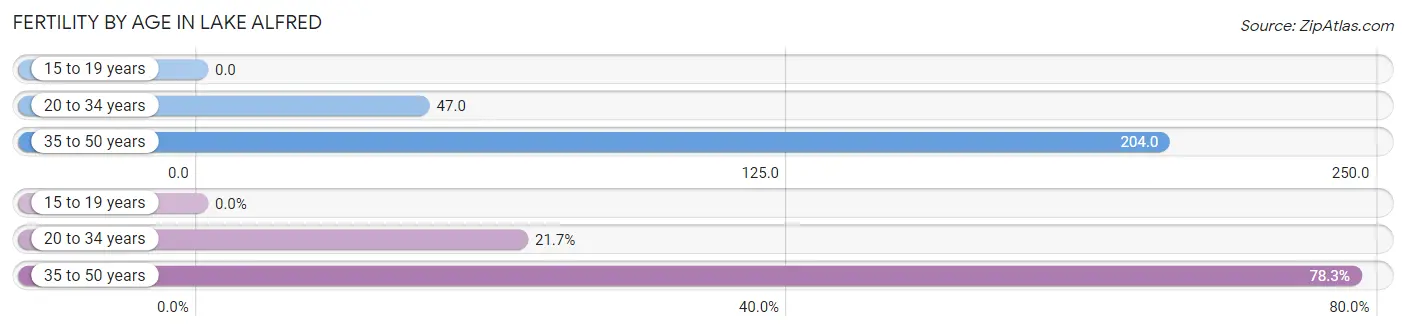
| Age Bracket | Women with Births | Births / 1,000 Women |
| 15 to 19 years | 0 (0.0%) | 0.0 |
| 20 to 34 years | 43 (21.7%) | 47.0 |
| 35 to 50 years | 155 (78.3%) | 204.0 |
| Total | 198 (100.0%) | 106.0 |
Fertility by Age by Marriage Status in Lake Alfred
73.7% of women with births (198) in Lake Alfred are married. The highest percentage of unmarried women with births falls into 35 to 50 years age bracket with 33.6% of them unmarried at the time of birth, while the lowest percentage of unmarried women with births belong to 20 to 34 years age bracket with 0.0% of them unmarried.
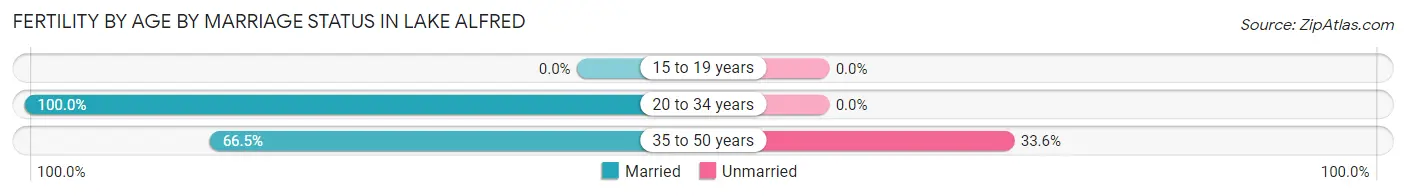
| Age Bracket | Married | Unmarried |
| 15 to 19 years | 0 (0.0%) | 0 (0.0%) |
| 20 to 34 years | 43 (100.0%) | 0 (0.0%) |
| 35 to 50 years | 103 (66.4%) | 52 (33.6%) |
| Total | 146 (73.7%) | 52 (26.3%) |
Fertility by Education in Lake Alfred
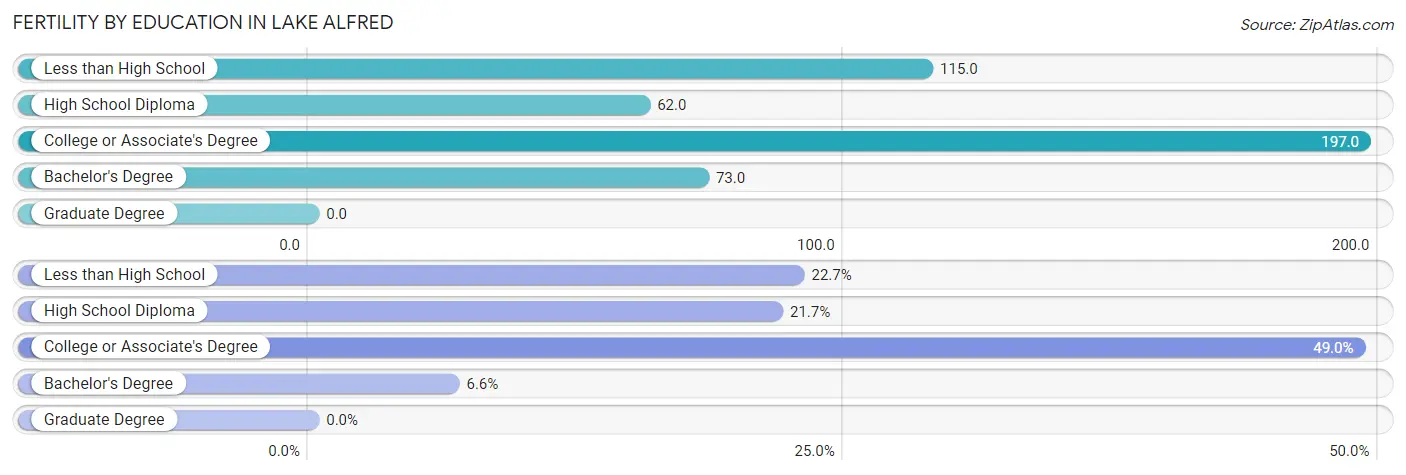
| Educational Attainment | Women with Births | Births / 1,000 Women |
| Less than High School | 45 (22.7%) | 115.0 |
| High School Diploma | 43 (21.7%) | 62.0 |
| College or Associate's Degree | 97 (49.0%) | 197.0 |
| Bachelor's Degree | 13 (6.6%) | 73.0 |
| Graduate Degree | 0 (0.0%) | 0.0 |
| Total | 198 (100.0%) | 106.0 |
Fertility by Education by Marriage Status in Lake Alfred
26.3% of women with births in Lake Alfred are unmarried. Women with the educational attainment of high school diploma are most likely to be married with 100.0% of them married at childbirth, while women with the educational attainment of less than high school are least likely to be married with 100.0% of them unmarried at childbirth.
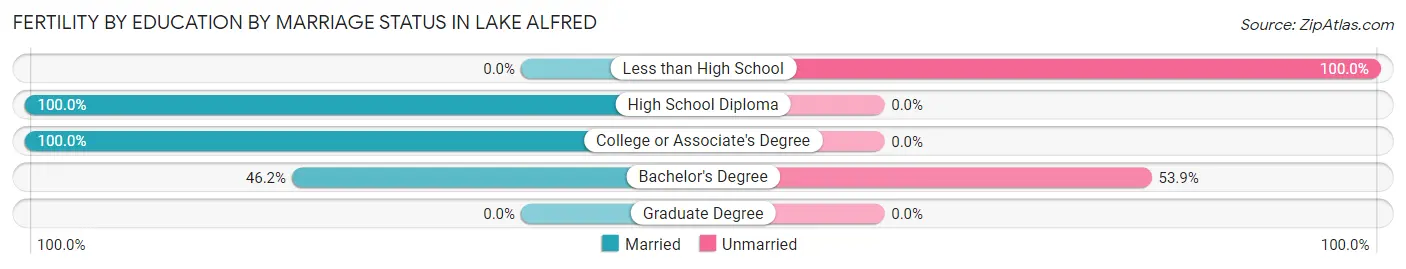
| Educational Attainment | Married | Unmarried |
| Less than High School | 0 (0.0%) | 45 (100.0%) |
| High School Diploma | 43 (100.0%) | 0 (0.0%) |
| College or Associate's Degree | 97 (100.0%) | 0 (0.0%) |
| Bachelor's Degree | 6 (46.2%) | 7 (53.8%) |
| Graduate Degree | 0 (0.0%) | 0 (0.0%) |
| Total | 146 (73.7%) | 52 (26.3%) |
Employment Characteristics in Lake Alfred
Employment by Class of Employer in Lake Alfred
Among the 3,179 employed individuals in Lake Alfred, private company employees (2,416 | 76.0%), local government employees (284 | 8.9%), and not-for-profit organizations (275 | 8.6%) make up the most common classes of employment.
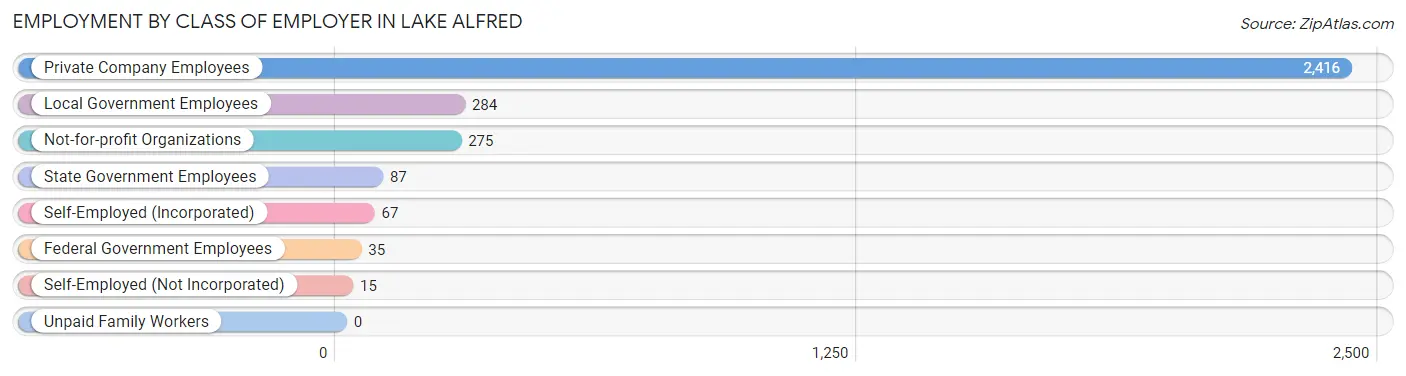
| Employer Class | # Employees | % Employees |
| Private Company Employees | 2,416 | 76.0% |
| Self-Employed (Incorporated) | 67 | 2.1% |
| Self-Employed (Not Incorporated) | 15 | 0.5% |
| Not-for-profit Organizations | 275 | 8.6% |
| Local Government Employees | 284 | 8.9% |
| State Government Employees | 87 | 2.7% |
| Federal Government Employees | 35 | 1.1% |
| Unpaid Family Workers | 0 | 0.0% |
| Total | 3,179 | 100.0% |
Employment Status by Age in Lake Alfred
According to the labor force statistics for Lake Alfred, out of the total population over 16 years of age (5,295), 66.8% or 3,537 individuals are in the labor force, with 6.7% or 237 of them unemployed. The age group with the highest labor force participation rate is 25 to 29 years, with 97.8% or 499 individuals in the labor force. Within the labor force, the 16 to 19 years age range has the highest percentage of unemployed individuals, with 57.4% or 66 of them being unemployed.
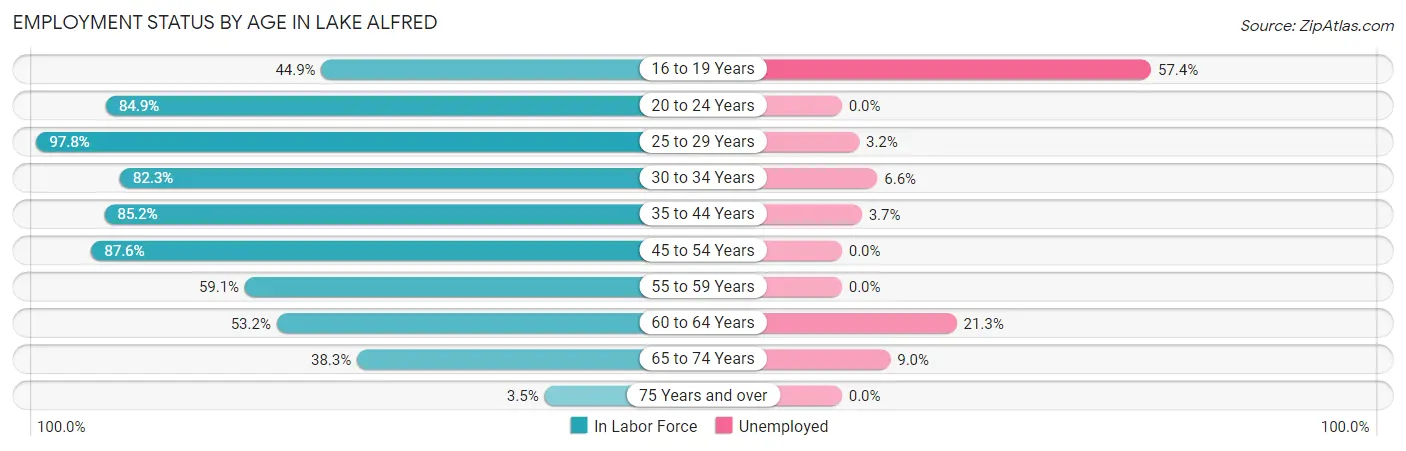
| Age Bracket | In Labor Force | Unemployed |
| 16 to 19 Years | 115 (44.9%) | 66 (57.4%) |
| 20 to 24 Years | 180 (84.9%) | 0 (0.0%) |
| 25 to 29 Years | 499 (97.8%) | 16 (3.2%) |
| 30 to 34 Years | 684 (82.3%) | 45 (6.6%) |
| 35 to 44 Years | 937 (85.2%) | 35 (3.7%) |
| 45 to 54 Years | 503 (87.6%) | 0 (0.0%) |
| 55 to 59 Years | 104 (59.1%) | 0 (0.0%) |
| 60 to 64 Years | 240 (53.2%) | 51 (21.3%) |
| 65 to 74 Years | 255 (38.3%) | 23 (9.0%) |
| 75 Years and over | 18 (3.5%) | 0 (0.0%) |
| Total | 3,537 (66.8%) | 237 (6.7%) |
Employment Status by Educational Attainment in Lake Alfred
According to labor force statistics for Lake Alfred, 81.5% of individuals (2,968) out of the total population between 25 and 64 years of age (3,642) are in the labor force, with 5.0% or 148 of them being unemployed. The group with the highest labor force participation rate are those with the educational attainment of college / associate degree, with 93.4% or 1,046 individuals in the labor force. Within the labor force, individuals with less than high school education have the highest percentage of unemployment, with 10.5% or 29 of them being unemployed.
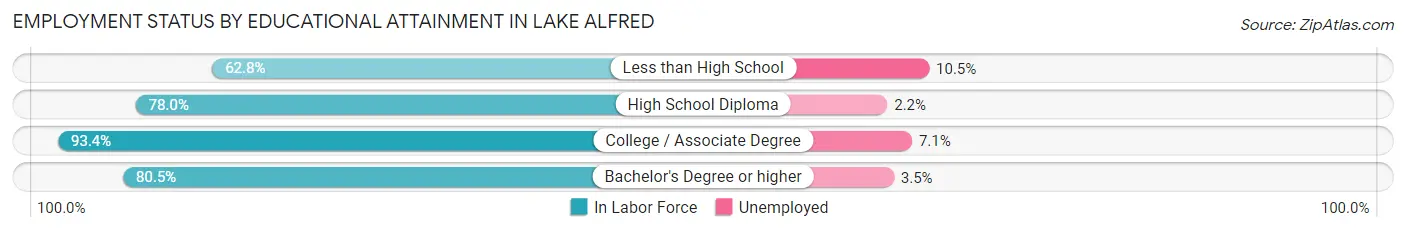
| Educational Attainment | In Labor Force | Unemployed |
| Less than High School | 275 (62.8%) | 46 (10.5%) |
| High School Diploma | 1,012 (78.0%) | 29 (2.2%) |
| College / Associate Degree | 1,046 (93.4%) | 80 (7.1%) |
| Bachelor's Degree or higher | 633 (80.5%) | 28 (3.5%) |
| Total | 2,968 (81.5%) | 182 (5.0%) |
Employment Occupations by Sex in Lake Alfred
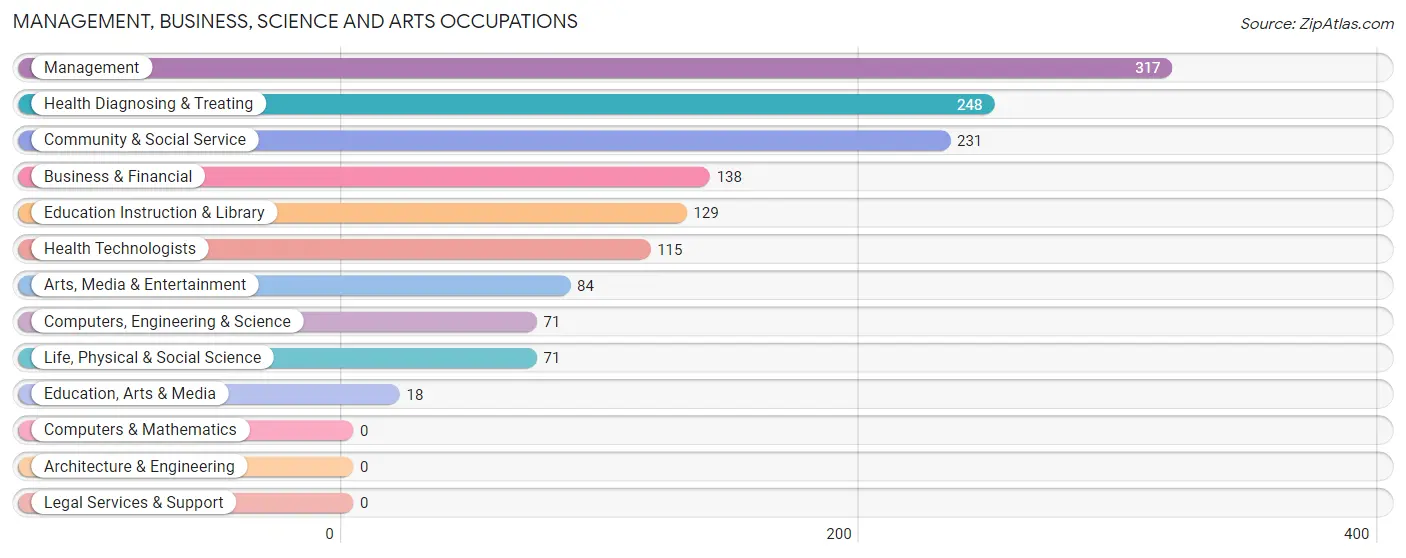
Management, Business, Science and Arts Occupations
The most common Management, Business, Science and Arts occupations in Lake Alfred are Management (317 | 9.6%), Health Diagnosing & Treating (248 | 7.5%), Community & Social Service (231 | 7.0%), Business & Financial (138 | 4.2%), and Education Instruction & Library (129 | 3.9%).
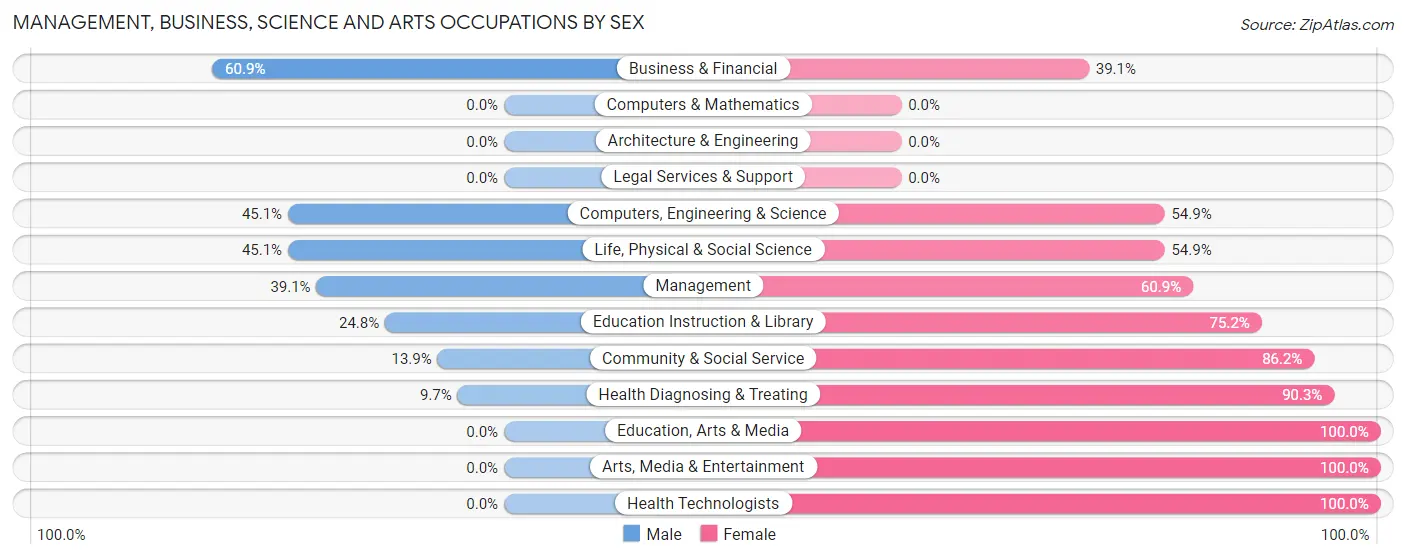
Management, Business, Science and Arts Occupations by Sex
Within the Management, Business, Science and Arts occupations in Lake Alfred, the most male-oriented occupations are Business & Financial (60.9%), Computers, Engineering & Science (45.1%), and Life, Physical & Social Science (45.1%), while the most female-oriented occupations are Education, Arts & Media (100.0%), Arts, Media & Entertainment (100.0%), and Health Technologists (100.0%).
| Occupation | Male | Female |
| Management | 124 (39.1%) | 193 (60.9%) |
| Business & Financial | 84 (60.9%) | 54 (39.1%) |
| Computers, Engineering & Science | 32 (45.1%) | 39 (54.9%) |
| Computers & Mathematics | 0 (0.0%) | 0 (0.0%) |
| Architecture & Engineering | 0 (0.0%) | 0 (0.0%) |
| Life, Physical & Social Science | 32 (45.1%) | 39 (54.9%) |
| Community & Social Service | 32 (13.9%) | 199 (86.2%) |
| Education, Arts & Media | 0 (0.0%) | 18 (100.0%) |
| Legal Services & Support | 0 (0.0%) | 0 (0.0%) |
| Education Instruction & Library | 32 (24.8%) | 97 (75.2%) |
| Arts, Media & Entertainment | 0 (0.0%) | 84 (100.0%) |
| Health Diagnosing & Treating | 24 (9.7%) | 224 (90.3%) |
| Health Technologists | 0 (0.0%) | 115 (100.0%) |
| Total (Category) | 296 (29.4%) | 709 (70.6%) |
| Total (Overall) | 1,539 (46.7%) | 1,760 (53.3%) |
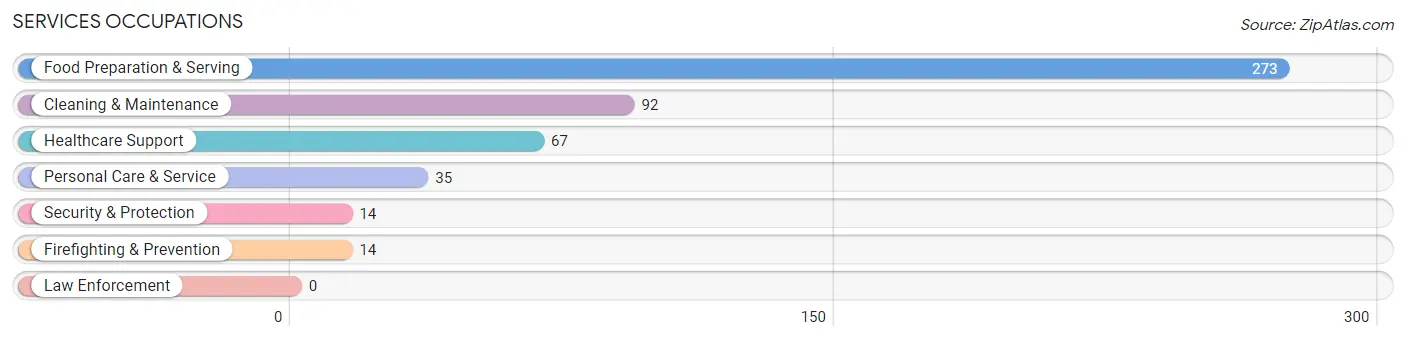
Services Occupations
The most common Services occupations in Lake Alfred are Food Preparation & Serving (273 | 8.3%), Cleaning & Maintenance (92 | 2.8%), Healthcare Support (67 | 2.0%), Personal Care & Service (35 | 1.1%), and Security & Protection (14 | 0.4%).
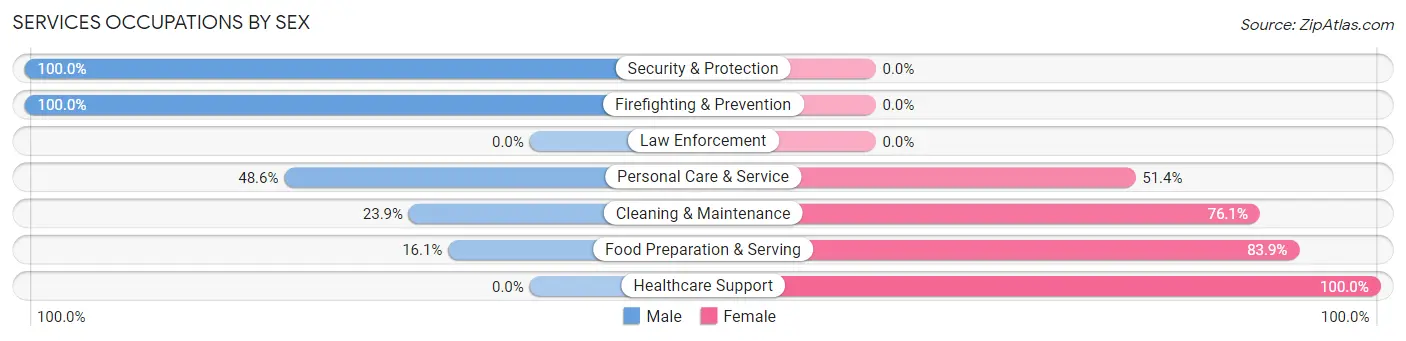
Services Occupations by Sex
Within the Services occupations in Lake Alfred, the most male-oriented occupations are Security & Protection (100.0%), Firefighting & Prevention (100.0%), and Personal Care & Service (48.6%), while the most female-oriented occupations are Healthcare Support (100.0%), Food Preparation & Serving (83.9%), and Cleaning & Maintenance (76.1%).
| Occupation | Male | Female |
| Healthcare Support | 0 (0.0%) | 67 (100.0%) |
| Security & Protection | 14 (100.0%) | 0 (0.0%) |
| Firefighting & Prevention | 14 (100.0%) | 0 (0.0%) |
| Law Enforcement | 0 (0.0%) | 0 (0.0%) |
| Food Preparation & Serving | 44 (16.1%) | 229 (83.9%) |
| Cleaning & Maintenance | 22 (23.9%) | 70 (76.1%) |
| Personal Care & Service | 17 (48.6%) | 18 (51.4%) |
| Total (Category) | 97 (20.2%) | 384 (79.8%) |
| Total (Overall) | 1,539 (46.7%) | 1,760 (53.3%) |
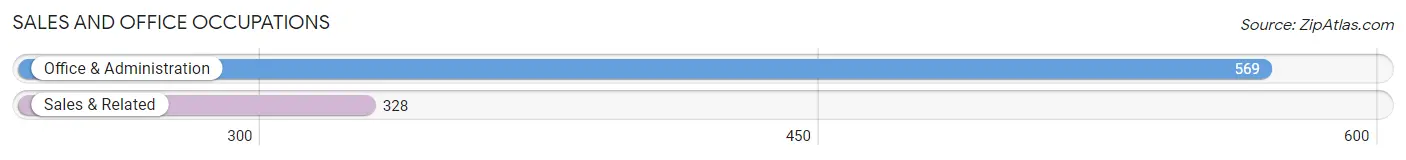
Sales and Office Occupations
The most common Sales and Office occupations in Lake Alfred are Office & Administration (569 | 17.2%), and Sales & Related (328 | 9.9%).
Sales and Office Occupations by Sex
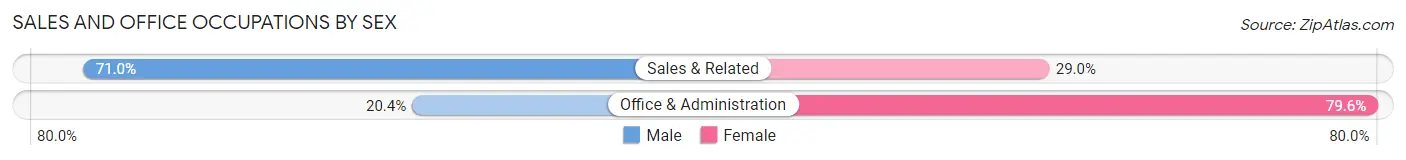
| Occupation | Male | Female |
| Sales & Related | 233 (71.0%) | 95 (29.0%) |
| Office & Administration | 116 (20.4%) | 453 (79.6%) |
| Total (Category) | 349 (38.9%) | 548 (61.1%) |
| Total (Overall) | 1,539 (46.7%) | 1,760 (53.3%) |
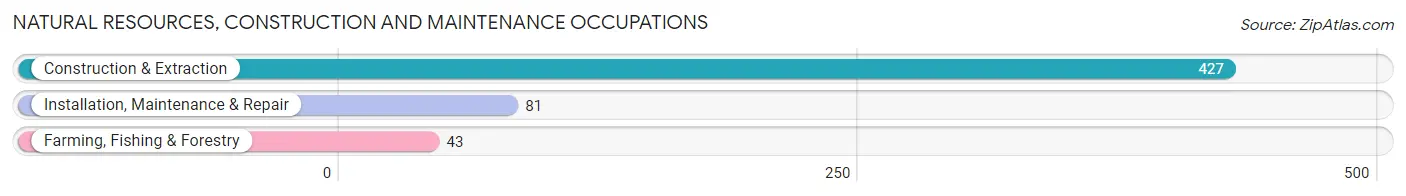
Natural Resources, Construction and Maintenance Occupations
The most common Natural Resources, Construction and Maintenance occupations in Lake Alfred are Construction & Extraction (427 | 12.9%), Installation, Maintenance & Repair (81 | 2.5%), and Farming, Fishing & Forestry (43 | 1.3%).
Natural Resources, Construction and Maintenance Occupations by Sex
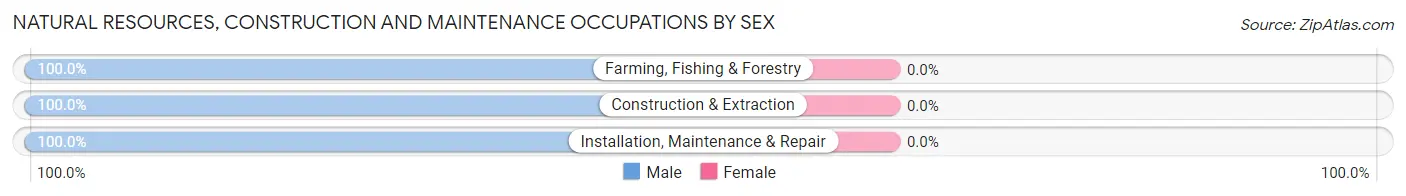
| Occupation | Male | Female |
| Farming, Fishing & Forestry | 43 (100.0%) | 0 (0.0%) |
| Construction & Extraction | 427 (100.0%) | 0 (0.0%) |
| Installation, Maintenance & Repair | 81 (100.0%) | 0 (0.0%) |
| Total (Category) | 551 (100.0%) | 0 (0.0%) |
| Total (Overall) | 1,539 (46.7%) | 1,760 (53.3%) |
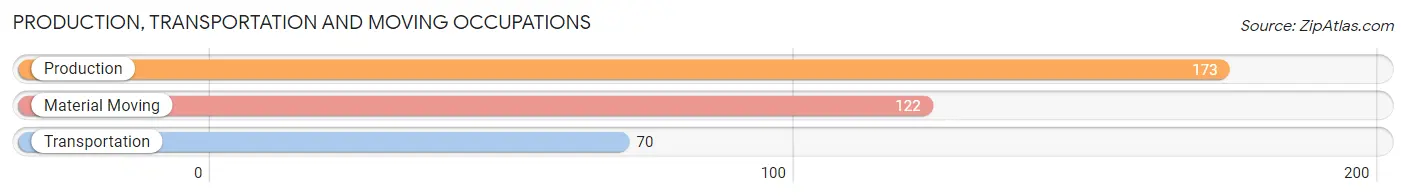
Production, Transportation and Moving Occupations
The most common Production, Transportation and Moving occupations in Lake Alfred are Production (173 | 5.2%), Material Moving (122 | 3.7%), and Transportation (70 | 2.1%).
Production, Transportation and Moving Occupations by Sex
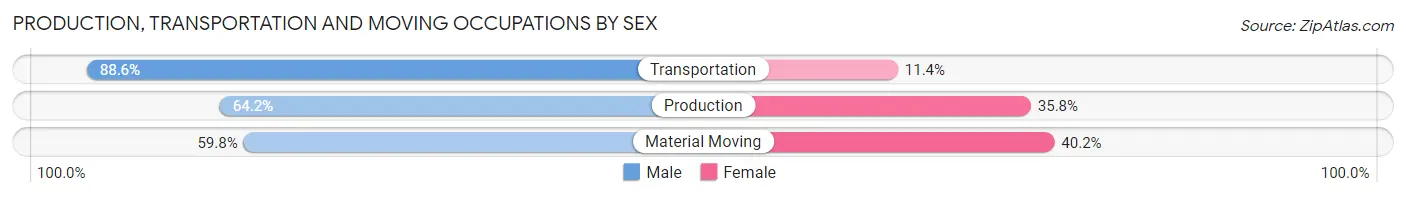
| Occupation | Male | Female |
| Production | 111 (64.2%) | 62 (35.8%) |
| Transportation | 62 (88.6%) | 8 (11.4%) |
| Material Moving | 73 (59.8%) | 49 (40.2%) |
| Total (Category) | 246 (67.4%) | 119 (32.6%) |
| Total (Overall) | 1,539 (46.7%) | 1,760 (53.3%) |
Employment Industries by Sex in Lake Alfred
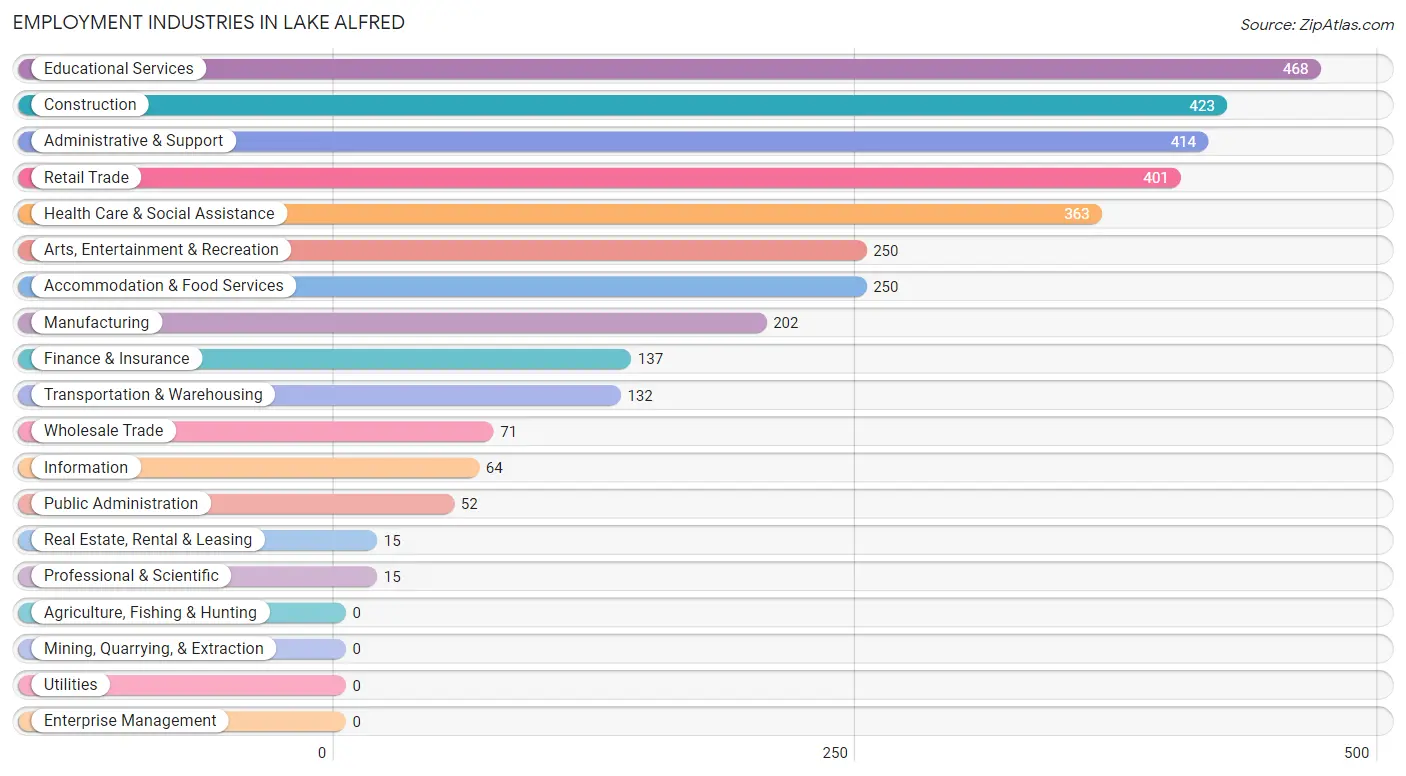
Employment Industries in Lake Alfred
The major employment industries in Lake Alfred include Educational Services (468 | 14.2%), Construction (423 | 12.8%), Administrative & Support (414 | 12.6%), Retail Trade (401 | 12.2%), and Health Care & Social Assistance (363 | 11.0%).
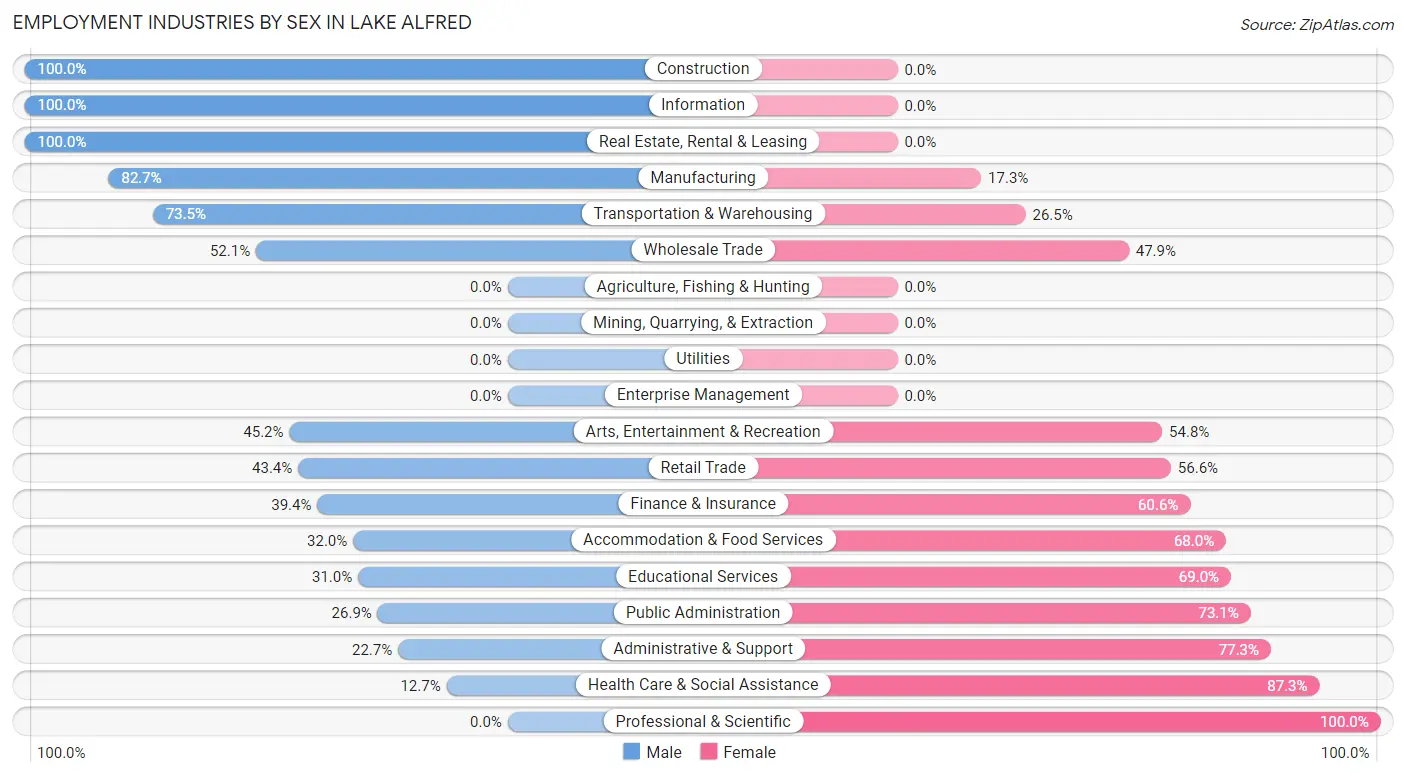
Employment Industries by Sex in Lake Alfred
The Lake Alfred industries that see more men than women are Construction (100.0%), Information (100.0%), and Real Estate, Rental & Leasing (100.0%), whereas the industries that tend to have a higher number of women are Professional & Scientific (100.0%), Health Care & Social Assistance (87.3%), and Administrative & Support (77.3%).
| Industry | Male | Female |
| Agriculture, Fishing & Hunting | 0 (0.0%) | 0 (0.0%) |
| Mining, Quarrying, & Extraction | 0 (0.0%) | 0 (0.0%) |
| Construction | 423 (100.0%) | 0 (0.0%) |
| Manufacturing | 167 (82.7%) | 35 (17.3%) |
| Wholesale Trade | 37 (52.1%) | 34 (47.9%) |
| Retail Trade | 174 (43.4%) | 227 (56.6%) |
| Transportation & Warehousing | 97 (73.5%) | 35 (26.5%) |
| Utilities | 0 (0.0%) | 0 (0.0%) |
| Information | 64 (100.0%) | 0 (0.0%) |
| Finance & Insurance | 54 (39.4%) | 83 (60.6%) |
| Real Estate, Rental & Leasing | 15 (100.0%) | 0 (0.0%) |
| Professional & Scientific | 0 (0.0%) | 15 (100.0%) |
| Enterprise Management | 0 (0.0%) | 0 (0.0%) |
| Administrative & Support | 94 (22.7%) | 320 (77.3%) |
| Educational Services | 145 (31.0%) | 323 (69.0%) |
| Health Care & Social Assistance | 46 (12.7%) | 317 (87.3%) |
| Arts, Entertainment & Recreation | 113 (45.2%) | 137 (54.8%) |
| Accommodation & Food Services | 80 (32.0%) | 170 (68.0%) |
| Public Administration | 14 (26.9%) | 38 (73.1%) |
| Total | 1,539 (46.7%) | 1,760 (53.3%) |
Education in Lake Alfred
School Enrollment in Lake Alfred
The most common levels of schooling among the 1,196 students in Lake Alfred are middle school (446 | 37.3%), college / undergraduate (243 | 20.3%), and high school (211 | 17.6%).
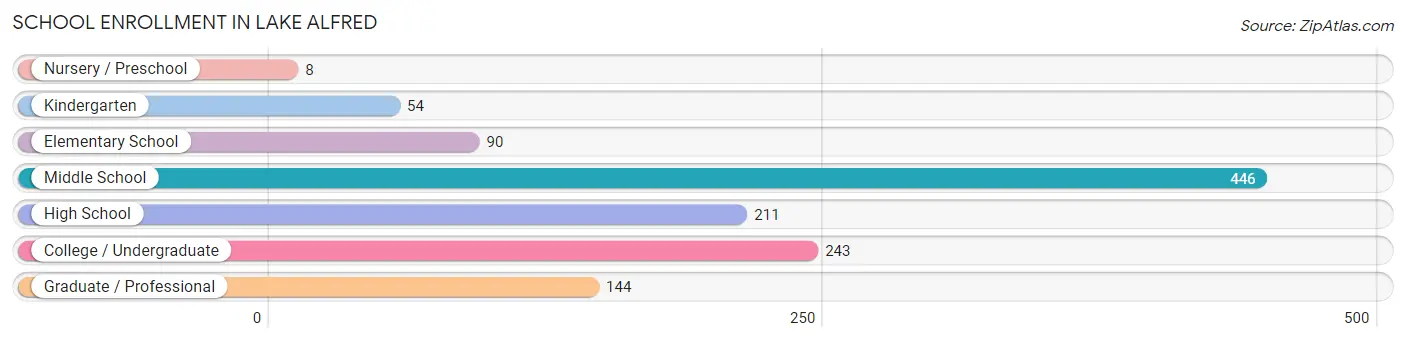
| School Level | # Students | % Students |
| Nursery / Preschool | 8 | 0.7% |
| Kindergarten | 54 | 4.5% |
| Elementary School | 90 | 7.5% |
| Middle School | 446 | 37.3% |
| High School | 211 | 17.6% |
| College / Undergraduate | 243 | 20.3% |
| Graduate / Professional | 144 | 12.0% |
| Total | 1,196 | 100.0% |
School Enrollment by Age by Funding Source in Lake Alfred
Out of a total of 1,196 students who are enrolled in schools in Lake Alfred, 158 (13.2%) attend a private institution, while the remaining 1,038 (86.8%) are enrolled in public schools. The age group of 3 to 4 year olds has the highest likelihood of being enrolled in private schools, with 8 (100.0% in the age bracket) enrolled. Conversely, the age group of 20 to 24 year olds has the lowest likelihood of being enrolled in a private school, with 67 (100.0% in the age bracket) attending a public institution.
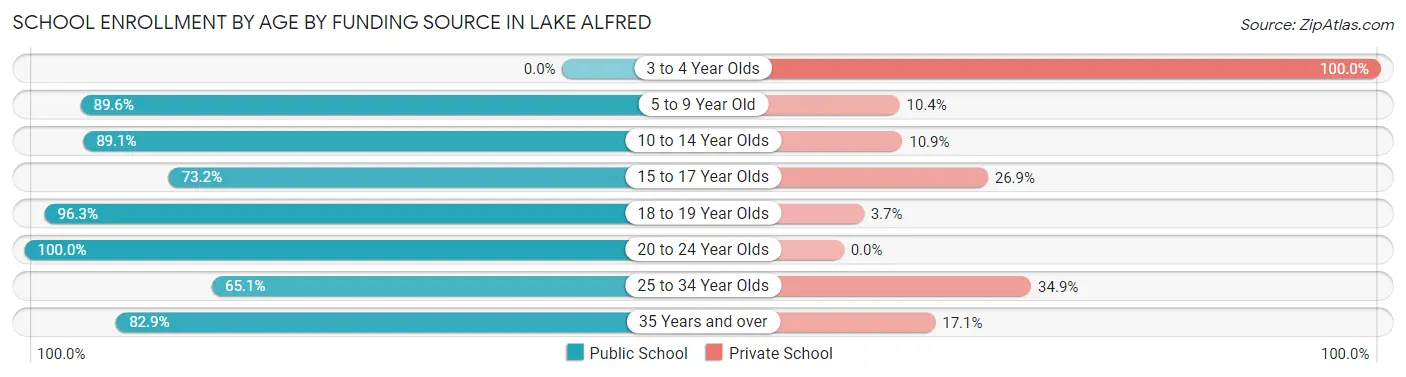
| Age Bracket | Public School | Private School |
| 3 to 4 Year Olds | 0 (0.0%) | 8 (100.0%) |
| 5 to 9 Year Old | 129 (89.6%) | 15 (10.4%) |
| 10 to 14 Year Olds | 465 (89.1%) | 57 (10.9%) |
| 15 to 17 Year Olds | 79 (73.2%) | 29 (26.9%) |
| 18 to 19 Year Olds | 155 (96.3%) | 6 (3.7%) |
| 20 to 24 Year Olds | 67 (100.0%) | 0 (0.0%) |
| 25 to 34 Year Olds | 41 (65.1%) | 22 (34.9%) |
| 35 Years and over | 102 (82.9%) | 21 (17.1%) |
| Total | 1,038 (86.8%) | 158 (13.2%) |
Educational Attainment by Field of Study in Lake Alfred
Bio, nature & agricultural (248 | 22.6%), business (237 | 21.6%), education (173 | 15.8%), liberal arts & history (159 | 14.5%), and science & technology (107 | 9.7%) are the most common fields of study among 1,098 individuals in Lake Alfred who have obtained a bachelor's degree or higher.
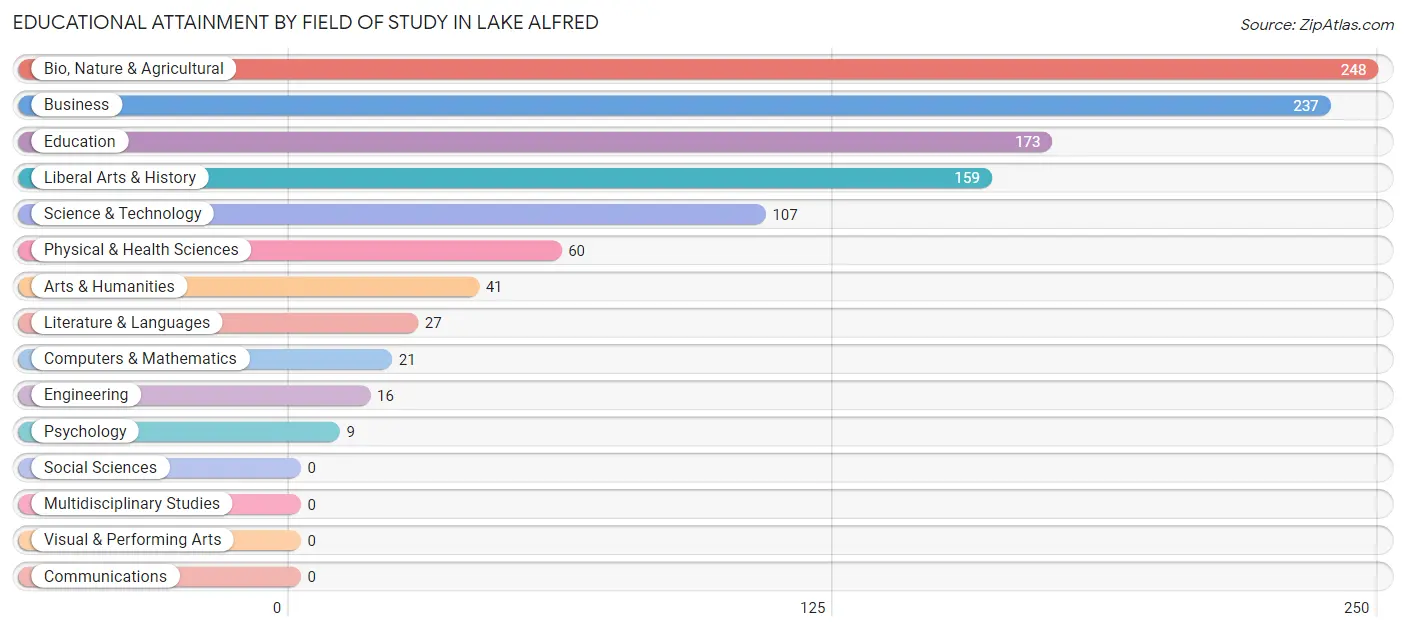
| Field of Study | # Graduates | % Graduates |
| Computers & Mathematics | 21 | 1.9% |
| Bio, Nature & Agricultural | 248 | 22.6% |
| Physical & Health Sciences | 60 | 5.5% |
| Psychology | 9 | 0.8% |
| Social Sciences | 0 | 0.0% |
| Engineering | 16 | 1.5% |
| Multidisciplinary Studies | 0 | 0.0% |
| Science & Technology | 107 | 9.7% |
| Business | 237 | 21.6% |
| Education | 173 | 15.8% |
| Literature & Languages | 27 | 2.5% |
| Liberal Arts & History | 159 | 14.5% |
| Visual & Performing Arts | 0 | 0.0% |
| Communications | 0 | 0.0% |
| Arts & Humanities | 41 | 3.7% |
| Total | 1,098 | 100.0% |
Transportation & Commute in Lake Alfred
Vehicle Availability by Sex in Lake Alfred
The most prevalent vehicle ownership categories in Lake Alfred are males with 2 vehicles (723, accounting for 50.9%) and females with 2 vehicles (849, making up 41.2%).
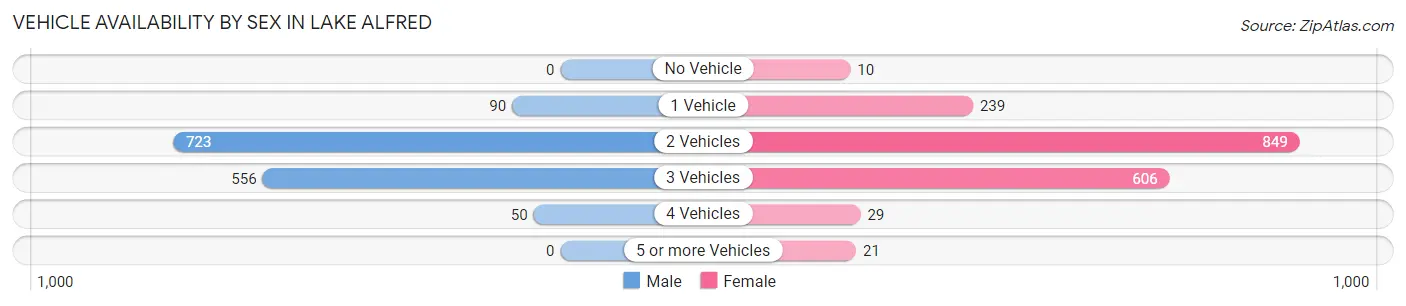
| Vehicles Available | Male | Female |
| No Vehicle | 0 (0.0%) | 10 (0.6%) |
| 1 Vehicle | 90 (6.3%) | 239 (13.6%) |
| 2 Vehicles | 723 (50.9%) | 849 (48.4%) |
| 3 Vehicles | 556 (39.2%) | 606 (34.5%) |
| 4 Vehicles | 50 (3.5%) | 29 (1.7%) |
| 5 or more Vehicles | 0 (0.0%) | 21 (1.2%) |
| Total | 1,419 (100.0%) | 1,754 (100.0%) |
Commute Time in Lake Alfred
The most frequently occuring commute durations in Lake Alfred are 15 to 19 minutes (536 commuters, 20.7%), 5 to 9 minutes (349 commuters, 13.5%), and 20 to 24 minutes (326 commuters, 12.6%).
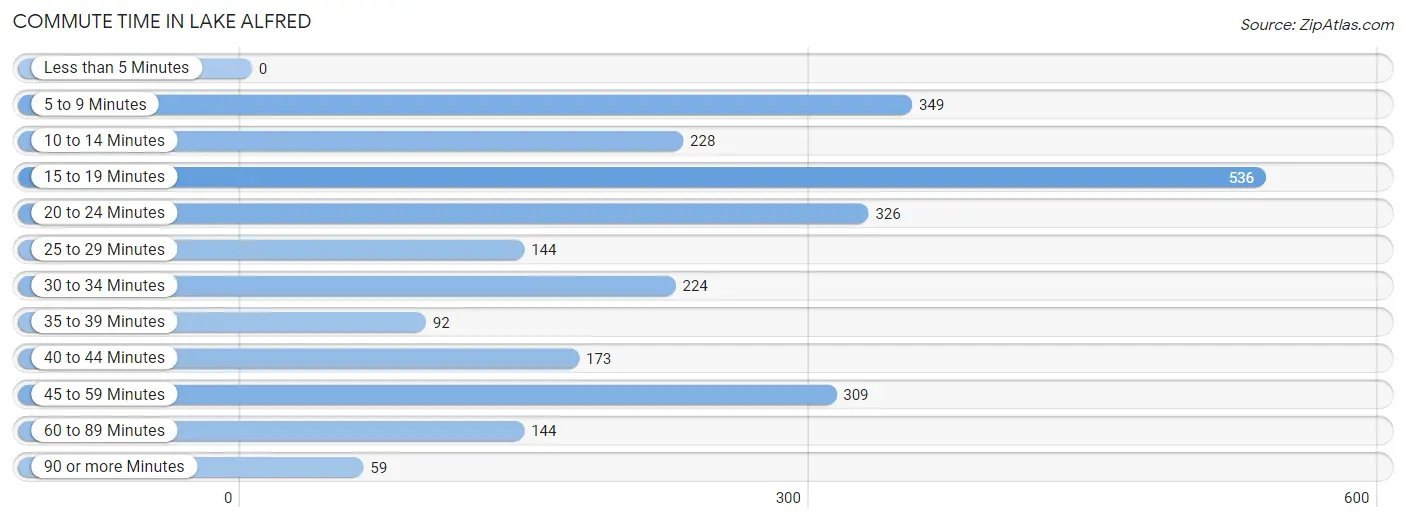
| Commute Time | # Commuters | % Commuters |
| Less than 5 Minutes | 0 | 0.0% |
| 5 to 9 Minutes | 349 | 13.5% |
| 10 to 14 Minutes | 228 | 8.8% |
| 15 to 19 Minutes | 536 | 20.7% |
| 20 to 24 Minutes | 326 | 12.6% |
| 25 to 29 Minutes | 144 | 5.6% |
| 30 to 34 Minutes | 224 | 8.7% |
| 35 to 39 Minutes | 92 | 3.6% |
| 40 to 44 Minutes | 173 | 6.7% |
| 45 to 59 Minutes | 309 | 12.0% |
| 60 to 89 Minutes | 144 | 5.6% |
| 90 or more Minutes | 59 | 2.3% |
Commute Time by Sex in Lake Alfred
The most common commute times in Lake Alfred are 45 to 59 minutes (171 commuters, 15.3%) for males and 15 to 19 minutes (372 commuters, 25.4%) for females.
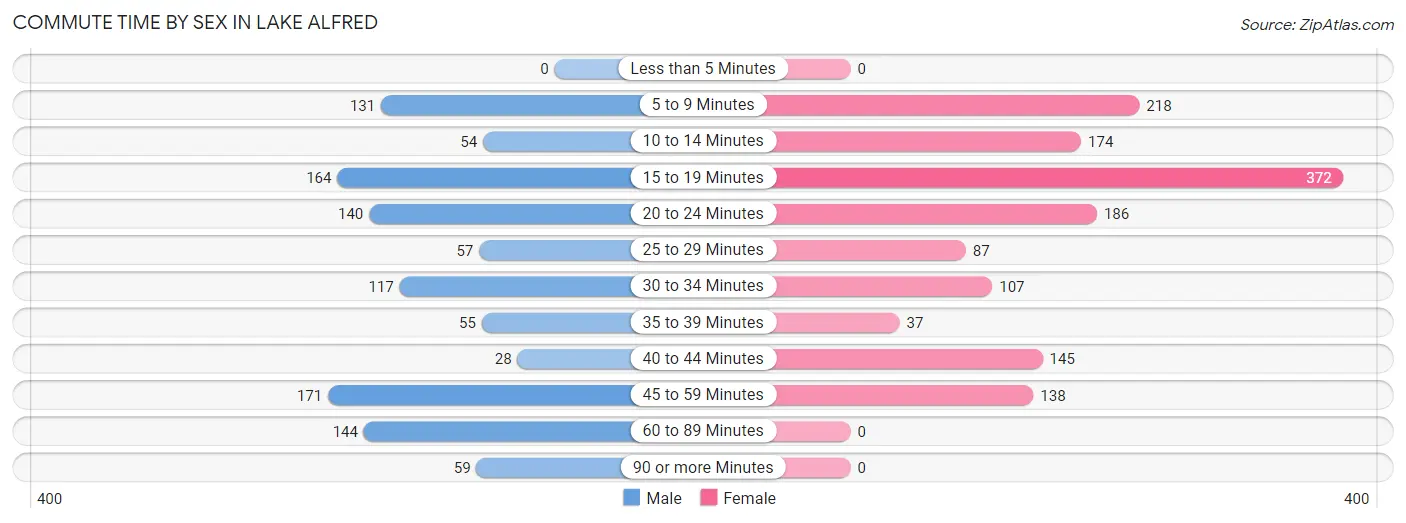
| Commute Time | Male | Female |
| Less than 5 Minutes | 0 (0.0%) | 0 (0.0%) |
| 5 to 9 Minutes | 131 (11.7%) | 218 (14.9%) |
| 10 to 14 Minutes | 54 (4.8%) | 174 (11.9%) |
| 15 to 19 Minutes | 164 (14.6%) | 372 (25.4%) |
| 20 to 24 Minutes | 140 (12.5%) | 186 (12.7%) |
| 25 to 29 Minutes | 57 (5.1%) | 87 (5.9%) |
| 30 to 34 Minutes | 117 (10.4%) | 107 (7.3%) |
| 35 to 39 Minutes | 55 (4.9%) | 37 (2.5%) |
| 40 to 44 Minutes | 28 (2.5%) | 145 (9.9%) |
| 45 to 59 Minutes | 171 (15.3%) | 138 (9.4%) |
| 60 to 89 Minutes | 144 (12.9%) | 0 (0.0%) |
| 90 or more Minutes | 59 (5.3%) | 0 (0.0%) |
Time of Departure to Work by Sex in Lake Alfred
The most frequent times of departure to work in Lake Alfred are 8:00 AM to 8:29 AM (208, 18.6%) for males and 4:00 PM to 11:59 PM (332, 22.7%) for females.
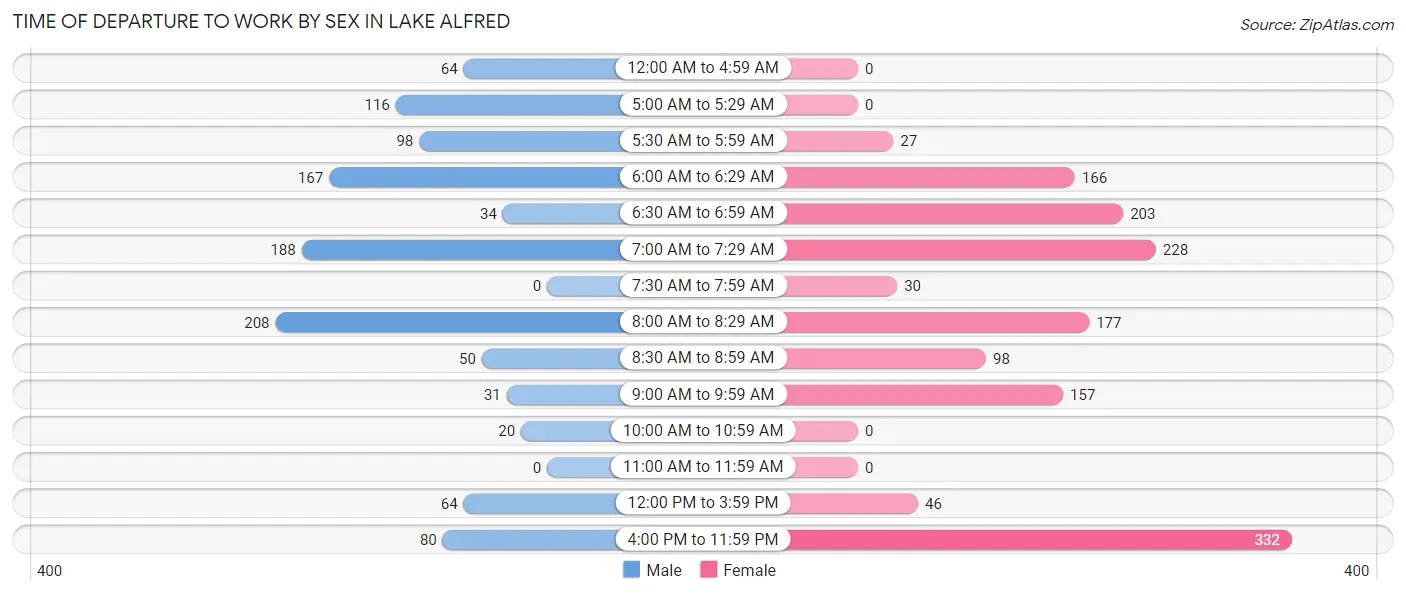
| Time of Departure | Male | Female |
| 12:00 AM to 4:59 AM | 64 (5.7%) | 0 (0.0%) |
| 5:00 AM to 5:29 AM | 116 (10.4%) | 0 (0.0%) |
| 5:30 AM to 5:59 AM | 98 (8.7%) | 27 (1.8%) |
| 6:00 AM to 6:29 AM | 167 (14.9%) | 166 (11.3%) |
| 6:30 AM to 6:59 AM | 34 (3.0%) | 203 (13.9%) |
| 7:00 AM to 7:29 AM | 188 (16.8%) | 228 (15.6%) |
| 7:30 AM to 7:59 AM | 0 (0.0%) | 30 (2.1%) |
| 8:00 AM to 8:29 AM | 208 (18.6%) | 177 (12.1%) |
| 8:30 AM to 8:59 AM | 50 (4.5%) | 98 (6.7%) |
| 9:00 AM to 9:59 AM | 31 (2.8%) | 157 (10.7%) |
| 10:00 AM to 10:59 AM | 20 (1.8%) | 0 (0.0%) |
| 11:00 AM to 11:59 AM | 0 (0.0%) | 0 (0.0%) |
| 12:00 PM to 3:59 PM | 64 (5.7%) | 46 (3.1%) |
| 4:00 PM to 11:59 PM | 80 (7.1%) | 332 (22.7%) |
| Total | 1,120 (100.0%) | 1,464 (100.0%) |
Housing Occupancy in Lake Alfred
Occupancy by Ownership in Lake Alfred
Of the total 2,254 dwellings in Lake Alfred, owner-occupied units account for 1,584 (70.3%), while renter-occupied units make up 670 (29.7%).
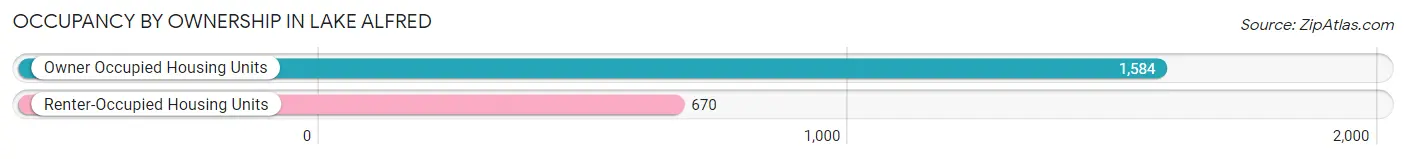
| Occupancy | # Housing Units | % Housing Units |
| Owner Occupied Housing Units | 1,584 | 70.3% |
| Renter-Occupied Housing Units | 670 | 29.7% |
| Total Occupied Housing Units | 2,254 | 100.0% |
Occupancy by Household Size in Lake Alfred
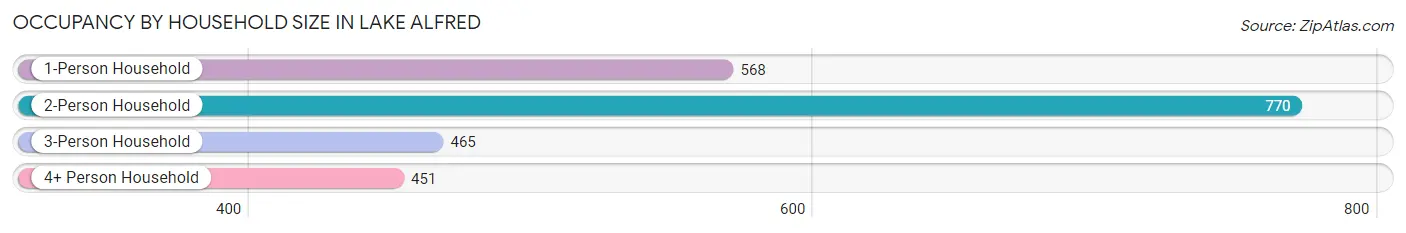
| Household Size | # Housing Units | % Housing Units |
| 1-Person Household | 568 | 25.2% |
| 2-Person Household | 770 | 34.2% |
| 3-Person Household | 465 | 20.6% |
| 4+ Person Household | 451 | 20.0% |
| Total Housing Units | 2,254 | 100.0% |
Occupancy by Ownership by Household Size in Lake Alfred
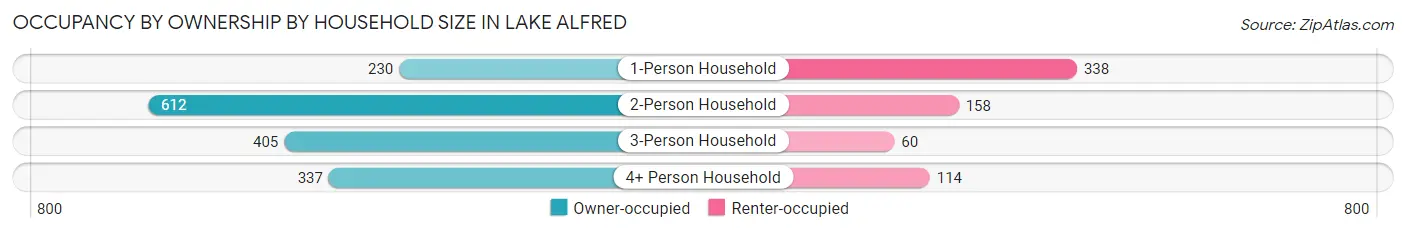
| Household Size | Owner-occupied | Renter-occupied |
| 1-Person Household | 230 (40.5%) | 338 (59.5%) |
| 2-Person Household | 612 (79.5%) | 158 (20.5%) |
| 3-Person Household | 405 (87.1%) | 60 (12.9%) |
| 4+ Person Household | 337 (74.7%) | 114 (25.3%) |
| Total Housing Units | 1,584 (70.3%) | 670 (29.7%) |
Occupancy by Educational Attainment in Lake Alfred
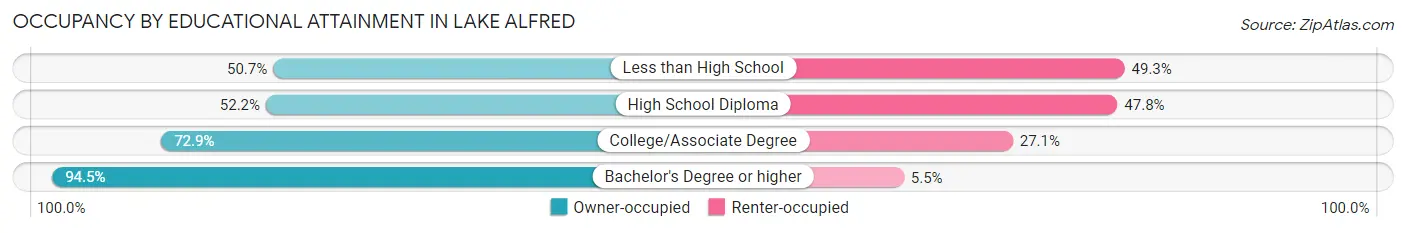
| Household Size | Owner-occupied | Renter-occupied |
| Less than High School | 103 (50.7%) | 100 (49.3%) |
| High School Diploma | 373 (52.2%) | 342 (47.8%) |
| College/Associate Degree | 522 (72.9%) | 194 (27.1%) |
| Bachelor's Degree or higher | 586 (94.5%) | 34 (5.5%) |
Occupancy by Age of Householder in Lake Alfred
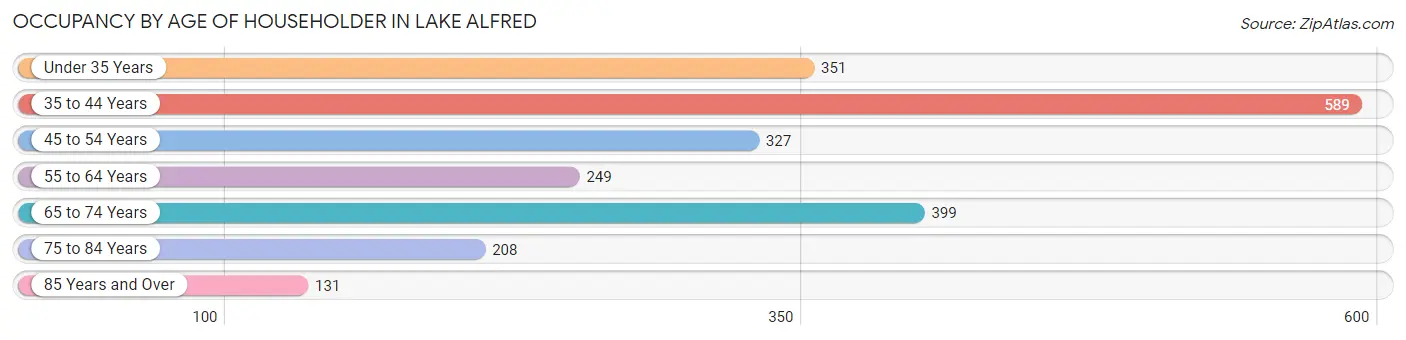
| Age Bracket | # Households | % Households |
| Under 35 Years | 351 | 15.6% |
| 35 to 44 Years | 589 | 26.1% |
| 45 to 54 Years | 327 | 14.5% |
| 55 to 64 Years | 249 | 11.1% |
| 65 to 74 Years | 399 | 17.7% |
| 75 to 84 Years | 208 | 9.2% |
| 85 Years and Over | 131 | 5.8% |
| Total | 2,254 | 100.0% |
Housing Finances in Lake Alfred
Median Income by Occupancy in Lake Alfred
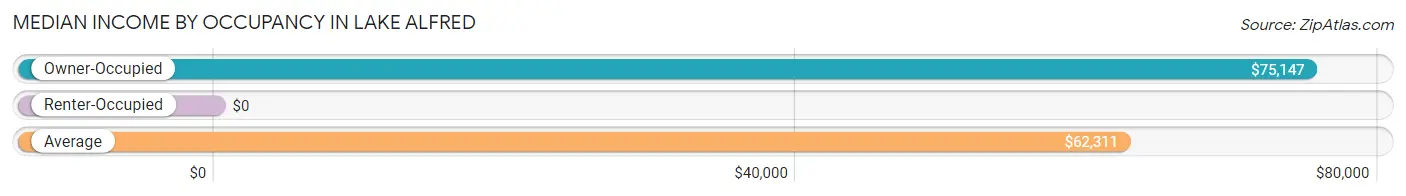
| Occupancy Type | # Households | Median Income |
| Owner-Occupied | 1,584 (70.3%) | $75,147 |
| Renter-Occupied | 670 (29.7%) | $0 |
| Average | 2,254 (100.0%) | $62,311 |
Occupancy by Householder Income Bracket in Lake Alfred
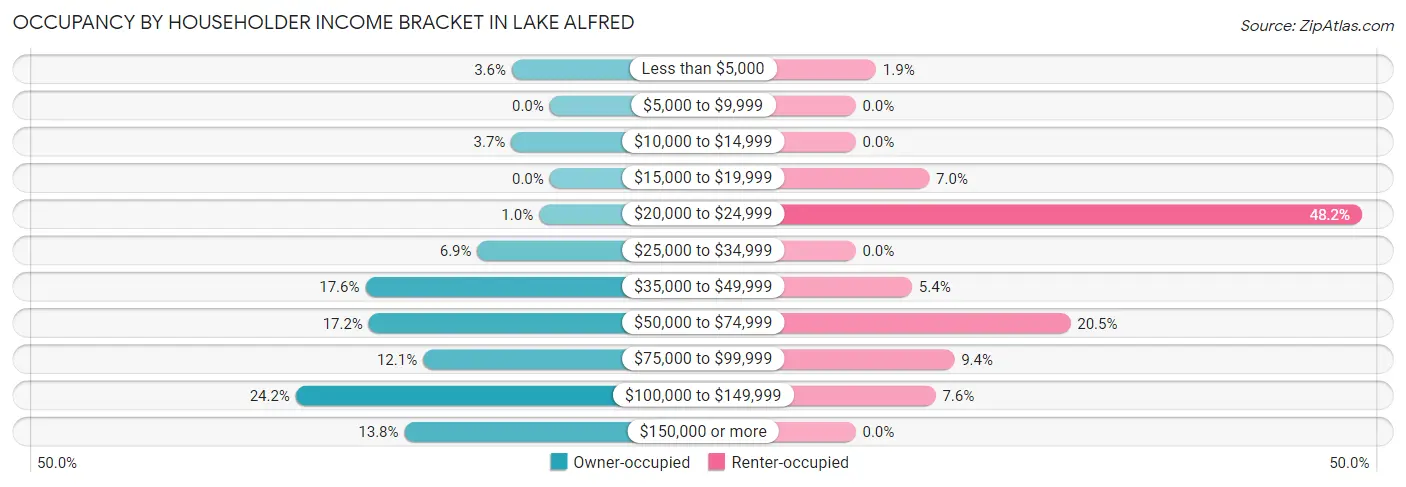
| Income Bracket | Owner-occupied | Renter-occupied |
| Less than $5,000 | 57 (3.6%) | 13 (1.9%) |
| $5,000 to $9,999 | 0 (0.0%) | 0 (0.0%) |
| $10,000 to $14,999 | 58 (3.7%) | 0 (0.0%) |
| $15,000 to $19,999 | 0 (0.0%) | 47 (7.0%) |
| $20,000 to $24,999 | 16 (1.0%) | 323 (48.2%) |
| $25,000 to $34,999 | 109 (6.9%) | 0 (0.0%) |
| $35,000 to $49,999 | 278 (17.5%) | 36 (5.4%) |
| $50,000 to $74,999 | 273 (17.2%) | 137 (20.4%) |
| $75,000 to $99,999 | 191 (12.1%) | 63 (9.4%) |
| $100,000 to $149,999 | 383 (24.2%) | 51 (7.6%) |
| $150,000 or more | 219 (13.8%) | 0 (0.0%) |
| Total | 1,584 (100.0%) | 670 (100.0%) |
Monthly Housing Cost Tiers in Lake Alfred
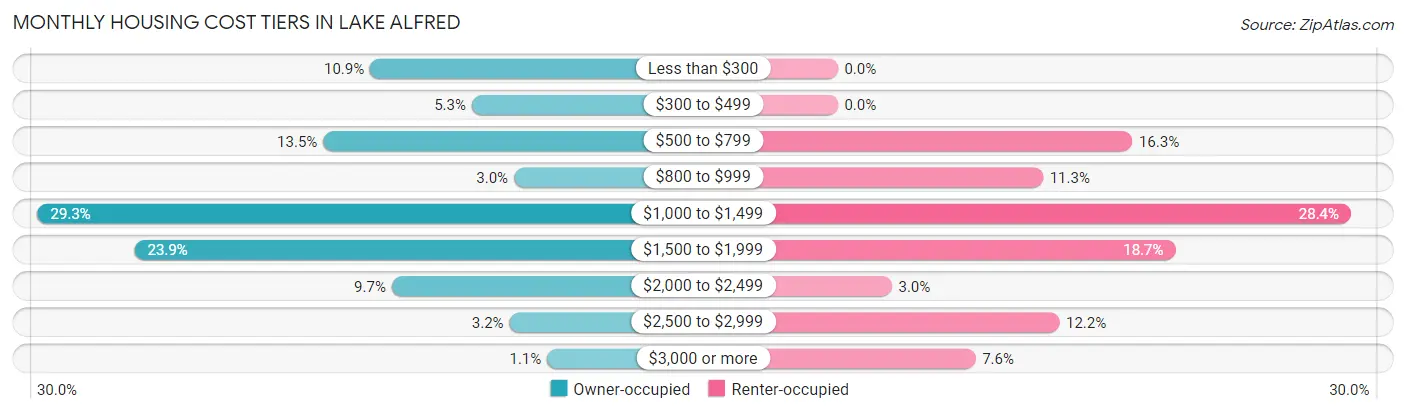
| Monthly Cost | Owner-occupied | Renter-occupied |
| Less than $300 | 173 (10.9%) | 0 (0.0%) |
| $300 to $499 | 84 (5.3%) | 0 (0.0%) |
| $500 to $799 | 214 (13.5%) | 109 (16.3%) |
| $800 to $999 | 47 (3.0%) | 76 (11.3%) |
| $1,000 to $1,499 | 464 (29.3%) | 190 (28.4%) |
| $1,500 to $1,999 | 379 (23.9%) | 125 (18.7%) |
| $2,000 to $2,499 | 154 (9.7%) | 20 (3.0%) |
| $2,500 to $2,999 | 51 (3.2%) | 82 (12.2%) |
| $3,000 or more | 18 (1.1%) | 51 (7.6%) |
| Total | 1,584 (100.0%) | 670 (100.0%) |
Physical Housing Characteristics in Lake Alfred
Housing Structures in Lake Alfred
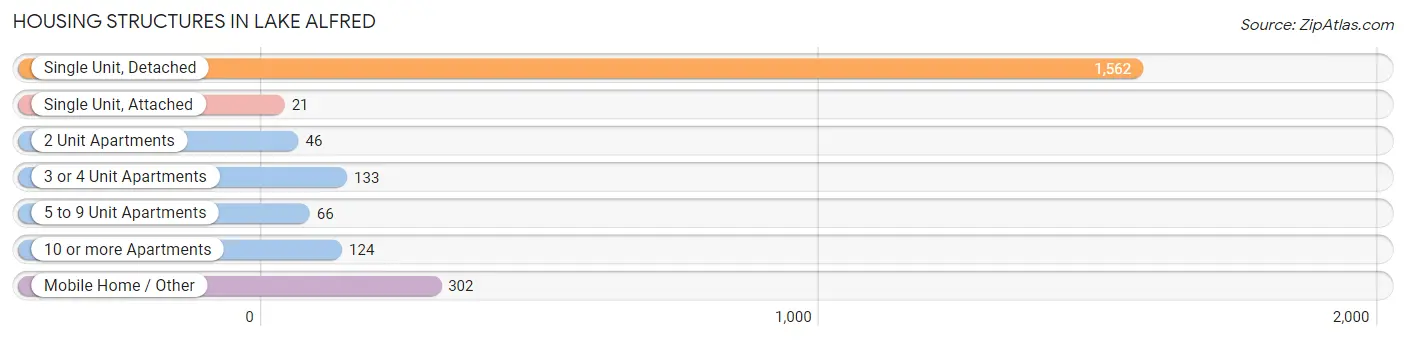
| Structure Type | # Housing Units | % Housing Units |
| Single Unit, Detached | 1,562 | 69.3% |
| Single Unit, Attached | 21 | 0.9% |
| 2 Unit Apartments | 46 | 2.0% |
| 3 or 4 Unit Apartments | 133 | 5.9% |
| 5 to 9 Unit Apartments | 66 | 2.9% |
| 10 or more Apartments | 124 | 5.5% |
| Mobile Home / Other | 302 | 13.4% |
| Total | 2,254 | 100.0% |
Housing Structures by Occupancy in Lake Alfred
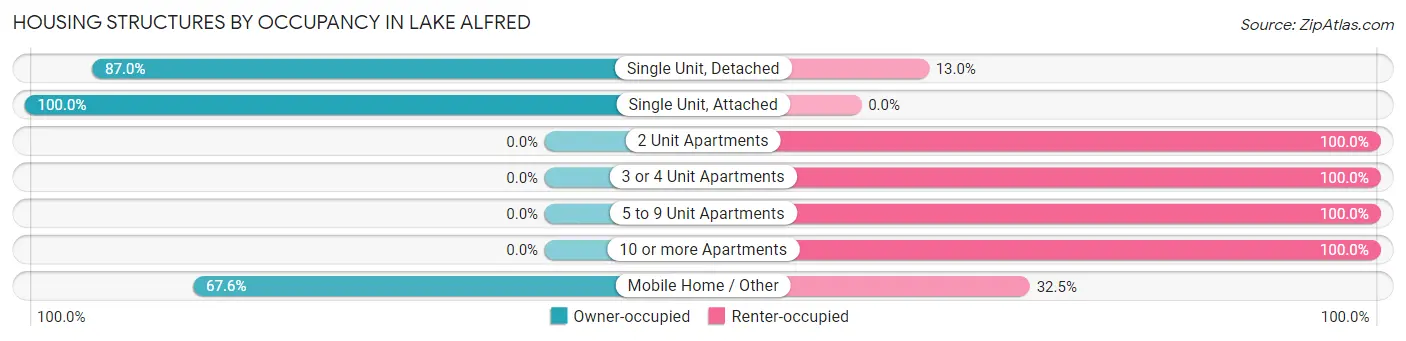
| Structure Type | Owner-occupied | Renter-occupied |
| Single Unit, Detached | 1,359 (87.0%) | 203 (13.0%) |
| Single Unit, Attached | 21 (100.0%) | 0 (0.0%) |
| 2 Unit Apartments | 0 (0.0%) | 46 (100.0%) |
| 3 or 4 Unit Apartments | 0 (0.0%) | 133 (100.0%) |
| 5 to 9 Unit Apartments | 0 (0.0%) | 66 (100.0%) |
| 10 or more Apartments | 0 (0.0%) | 124 (100.0%) |
| Mobile Home / Other | 204 (67.5%) | 98 (32.5%) |
| Total | 1,584 (70.3%) | 670 (29.7%) |
Housing Structures by Number of Rooms in Lake Alfred
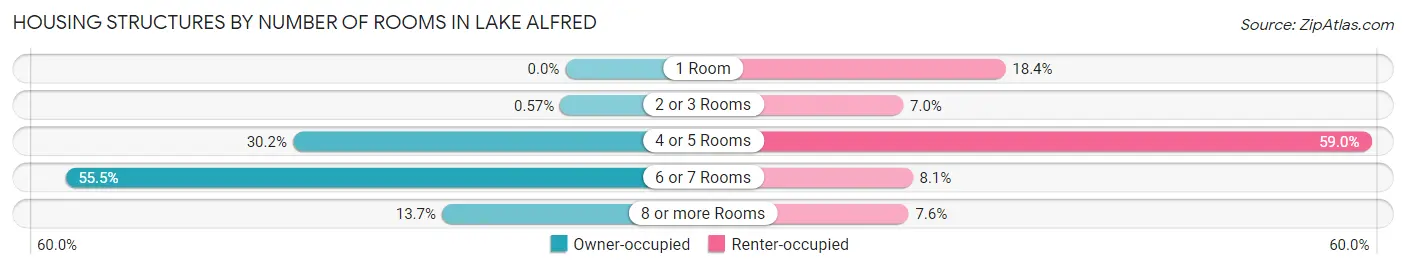
| Number of Rooms | Owner-occupied | Renter-occupied |
| 1 Room | 0 (0.0%) | 123 (18.4%) |
| 2 or 3 Rooms | 9 (0.6%) | 47 (7.0%) |
| 4 or 5 Rooms | 479 (30.2%) | 395 (59.0%) |
| 6 or 7 Rooms | 879 (55.5%) | 54 (8.1%) |
| 8 or more Rooms | 217 (13.7%) | 51 (7.6%) |
| Total | 1,584 (100.0%) | 670 (100.0%) |
Housing Structure by Heating Type in Lake Alfred
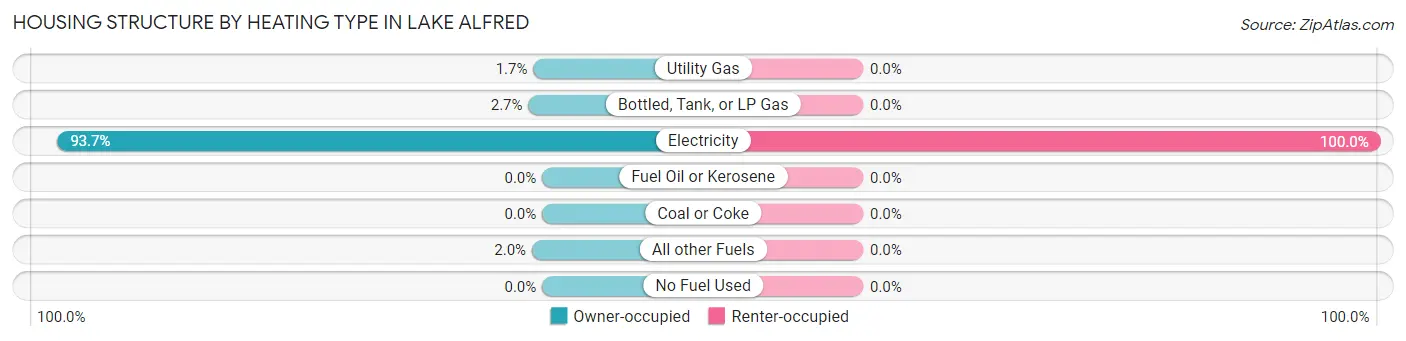
| Heating Type | Owner-occupied | Renter-occupied |
| Utility Gas | 27 (1.7%) | 0 (0.0%) |
| Bottled, Tank, or LP Gas | 42 (2.6%) | 0 (0.0%) |
| Electricity | 1,484 (93.7%) | 670 (100.0%) |
| Fuel Oil or Kerosene | 0 (0.0%) | 0 (0.0%) |
| Coal or Coke | 0 (0.0%) | 0 (0.0%) |
| All other Fuels | 31 (2.0%) | 0 (0.0%) |
| No Fuel Used | 0 (0.0%) | 0 (0.0%) |
| Total | 1,584 (100.0%) | 670 (100.0%) |
Household Vehicle Usage in Lake Alfred
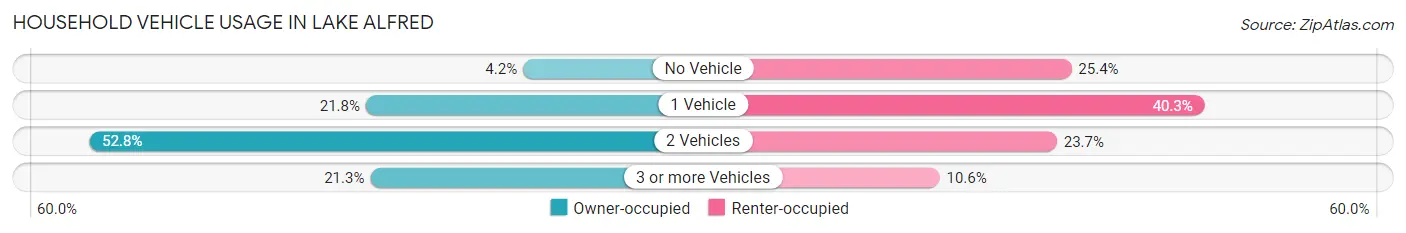
| Vehicles per Household | Owner-occupied | Renter-occupied |
| No Vehicle | 66 (4.2%) | 170 (25.4%) |
| 1 Vehicle | 345 (21.8%) | 270 (40.3%) |
| 2 Vehicles | 836 (52.8%) | 159 (23.7%) |
| 3 or more Vehicles | 337 (21.3%) | 71 (10.6%) |
| Total | 1,584 (100.0%) | 670 (100.0%) |
Real Estate & Mortgages in Lake Alfred
Real Estate and Mortgage Overview in Lake Alfred
| Characteristic | Without Mortgage | With Mortgage |
| Housing Units | 477 | 1,107 |
| Median Property Value | $98,900 | $224,500 |
| Median Household Income | $44,688 | $166 |
| Monthly Housing Costs | $504 | $18 |
| Real Estate Taxes | $669 | $45 |
Property Value by Mortgage Status in Lake Alfred
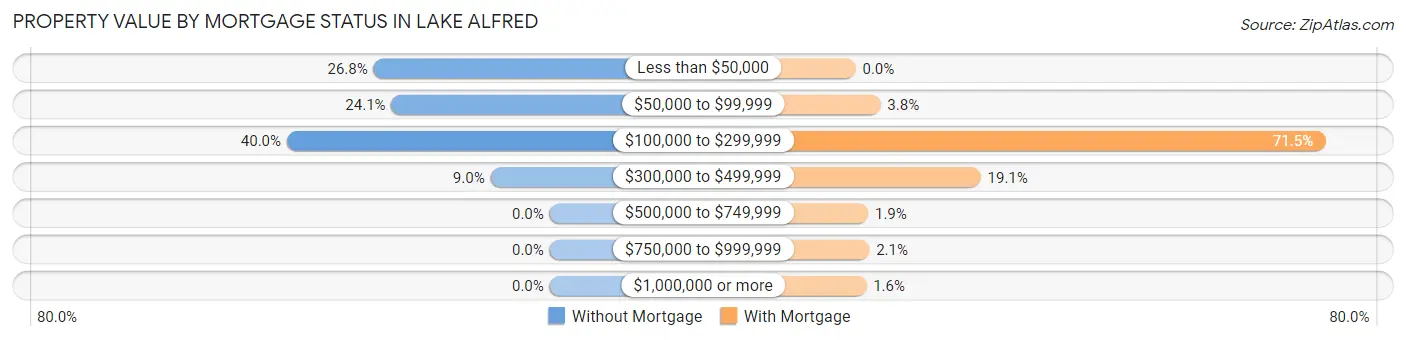
| Property Value | Without Mortgage | With Mortgage |
| Less than $50,000 | 128 (26.8%) | 0 (0.0%) |
| $50,000 to $99,999 | 115 (24.1%) | 42 (3.8%) |
| $100,000 to $299,999 | 191 (40.0%) | 792 (71.5%) |
| $300,000 to $499,999 | 43 (9.0%) | 211 (19.1%) |
| $500,000 to $749,999 | 0 (0.0%) | 21 (1.9%) |
| $750,000 to $999,999 | 0 (0.0%) | 23 (2.1%) |
| $1,000,000 or more | 0 (0.0%) | 18 (1.6%) |
| Total | 477 (100.0%) | 1,107 (100.0%) |
Household Income by Mortgage Status in Lake Alfred
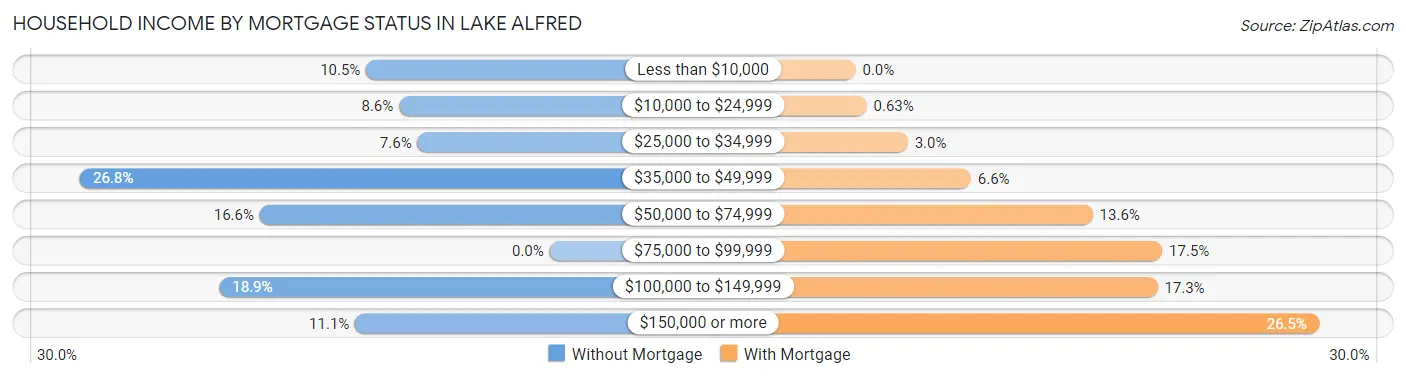
| Household Income | Without Mortgage | With Mortgage |
| Less than $10,000 | 50 (10.5%) | 0 (0.0%) |
| $10,000 to $24,999 | 41 (8.6%) | 7 (0.6%) |
| $25,000 to $34,999 | 36 (7.5%) | 33 (3.0%) |
| $35,000 to $49,999 | 128 (26.8%) | 73 (6.6%) |
| $50,000 to $74,999 | 79 (16.6%) | 150 (13.6%) |
| $75,000 to $99,999 | 0 (0.0%) | 194 (17.5%) |
| $100,000 to $149,999 | 90 (18.9%) | 191 (17.2%) |
| $150,000 or more | 53 (11.1%) | 293 (26.5%) |
| Total | 477 (100.0%) | 1,107 (100.0%) |
Property Value to Household Income Ratio in Lake Alfred
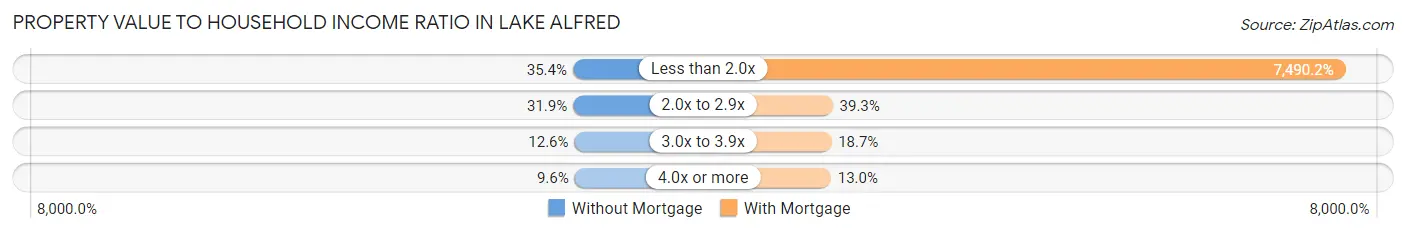
| Value-to-Income Ratio | Without Mortgage | With Mortgage |
| Less than 2.0x | 169 (35.4%) | 82,917 (7,490.2%) |
| 2.0x to 2.9x | 152 (31.9%) | 435 (39.3%) |
| 3.0x to 3.9x | 60 (12.6%) | 207 (18.7%) |
| 4.0x or more | 46 (9.6%) | 144 (13.0%) |
| Total | 477 (100.0%) | 1,107 (100.0%) |
Real Estate Taxes by Mortgage Status in Lake Alfred
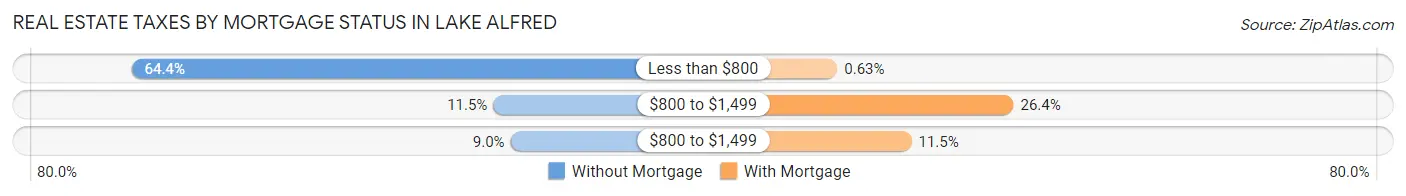
| Property Taxes | Without Mortgage | With Mortgage |
| Less than $800 | 307 (64.4%) | 7 (0.6%) |
| $800 to $1,499 | 55 (11.5%) | 292 (26.4%) |
| $800 to $1,499 | 43 (9.0%) | 127 (11.5%) |
| Total | 477 (100.0%) | 1,107 (100.0%) |
Health & Disability in Lake Alfred
Health Insurance Coverage by Age in Lake Alfred
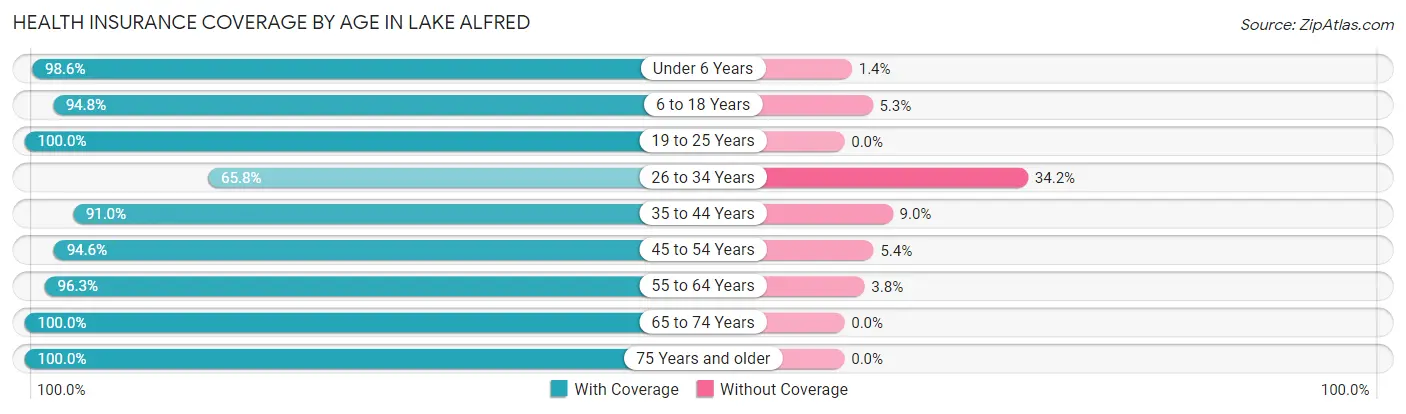
| Age Bracket | With Coverage | Without Coverage |
| Under 6 Years | 564 (98.6%) | 8 (1.4%) |
| 6 to 18 Years | 758 (94.8%) | 42 (5.2%) |
| 19 to 25 Years | 415 (100.0%) | 0 (0.0%) |
| 26 to 34 Years | 843 (65.8%) | 439 (34.2%) |
| 35 to 44 Years | 1,001 (91.0%) | 99 (9.0%) |
| 45 to 54 Years | 539 (94.6%) | 31 (5.4%) |
| 55 to 64 Years | 590 (96.3%) | 23 (3.7%) |
| 65 to 74 Years | 649 (100.0%) | 0 (0.0%) |
| 75 Years and older | 510 (100.0%) | 0 (0.0%) |
| Total | 5,869 (90.1%) | 642 (9.9%) |
Health Insurance Coverage by Citizenship Status in Lake Alfred
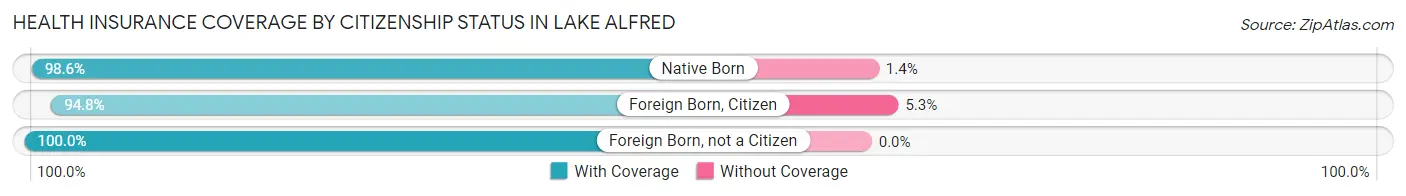
| Citizenship Status | With Coverage | Without Coverage |
| Native Born | 564 (98.6%) | 8 (1.4%) |
| Foreign Born, Citizen | 758 (94.8%) | 42 (5.2%) |
| Foreign Born, not a Citizen | 415 (100.0%) | 0 (0.0%) |
Health Insurance Coverage by Household Income in Lake Alfred
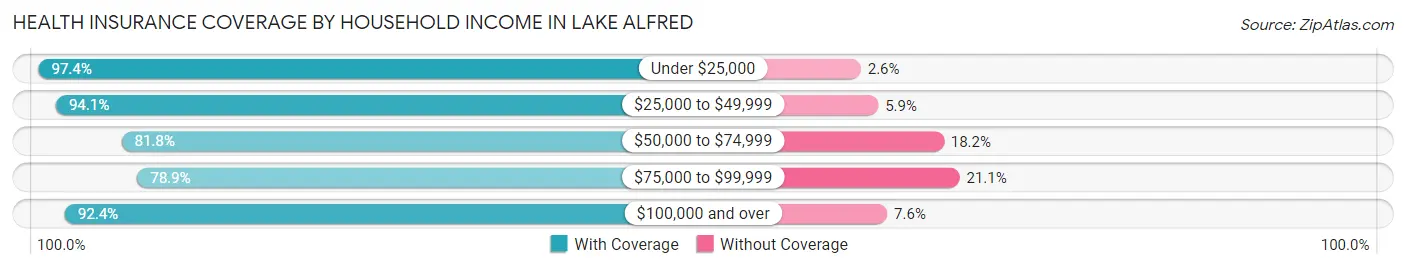
| Household Income | With Coverage | Without Coverage |
| Under $25,000 | 779 (97.4%) | 21 (2.6%) |
| $25,000 to $49,999 | 847 (94.1%) | 53 (5.9%) |
| $50,000 to $74,999 | 815 (81.8%) | 181 (18.2%) |
| $75,000 to $99,999 | 575 (78.9%) | 154 (21.1%) |
| $100,000 and over | 2,847 (92.4%) | 233 (7.6%) |
Public vs Private Health Insurance Coverage by Age in Lake Alfred
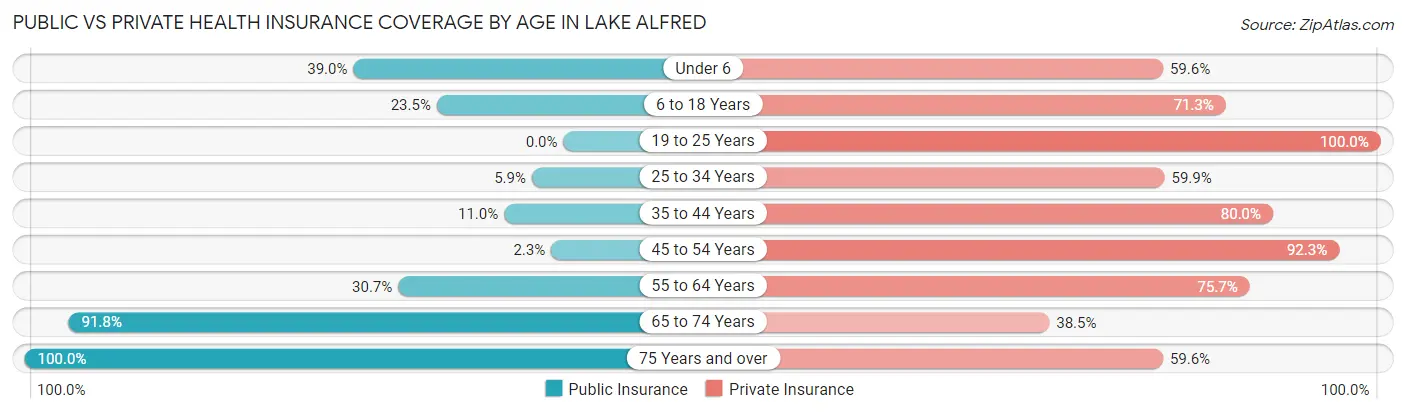
| Age Bracket | Public Insurance | Private Insurance |
| Under 6 | 223 (39.0%) | 341 (59.6%) |
| 6 to 18 Years | 188 (23.5%) | 570 (71.3%) |
| 19 to 25 Years | 0 (0.0%) | 415 (100.0%) |
| 25 to 34 Years | 75 (5.9%) | 768 (59.9%) |
| 35 to 44 Years | 121 (11.0%) | 880 (80.0%) |
| 45 to 54 Years | 13 (2.3%) | 526 (92.3%) |
| 55 to 64 Years | 188 (30.7%) | 464 (75.7%) |
| 65 to 74 Years | 596 (91.8%) | 250 (38.5%) |
| 75 Years and over | 510 (100.0%) | 304 (59.6%) |
| Total | 1,914 (29.4%) | 4,518 (69.4%) |
Disability Status by Sex by Age in Lake Alfred
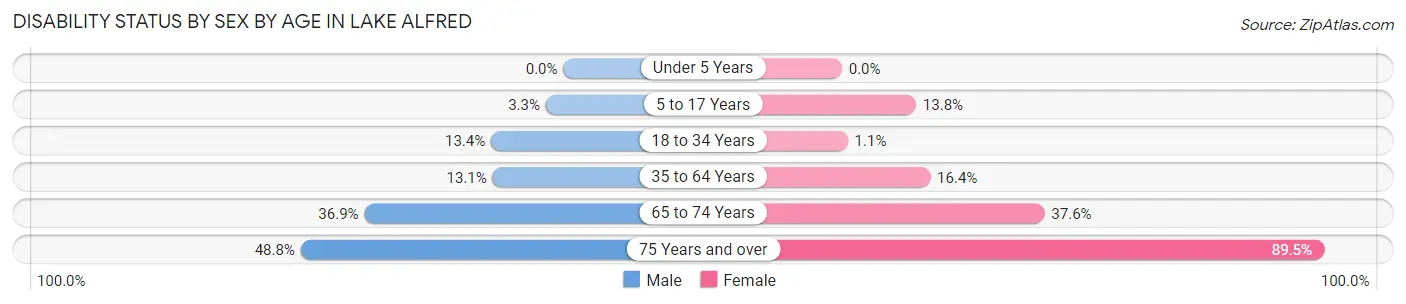
| Age Bracket | Male | Female |
| Under 5 Years | 0 (0.0%) | 0 (0.0%) |
| 5 to 17 Years | 10 (3.3%) | 67 (13.8%) |
| 18 to 34 Years | 97 (13.4%) | 11 (1.1%) |
| 35 to 64 Years | 143 (13.1%) | 196 (16.4%) |
| 65 to 74 Years | 113 (36.9%) | 129 (37.6%) |
| 75 Years and over | 156 (48.7%) | 170 (89.5%) |
Disability Class by Sex by Age in Lake Alfred
Disability Class: Hearing Difficulty
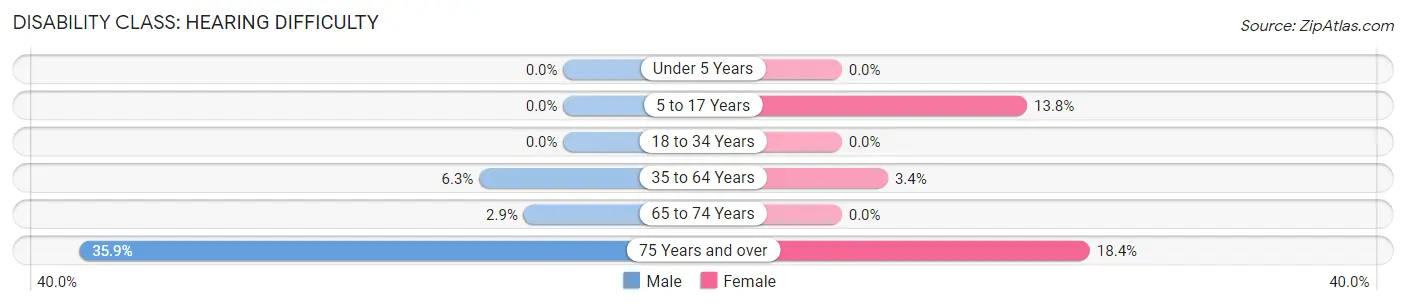
| Age Bracket | Male | Female |
| Under 5 Years | 0 (0.0%) | 0 (0.0%) |
| 5 to 17 Years | 0 (0.0%) | 67 (13.8%) |
| 18 to 34 Years | 0 (0.0%) | 0 (0.0%) |
| 35 to 64 Years | 68 (6.2%) | 41 (3.4%) |
| 65 to 74 Years | 9 (2.9%) | 0 (0.0%) |
| 75 Years and over | 115 (35.9%) | 35 (18.4%) |
Disability Class: Vision Difficulty
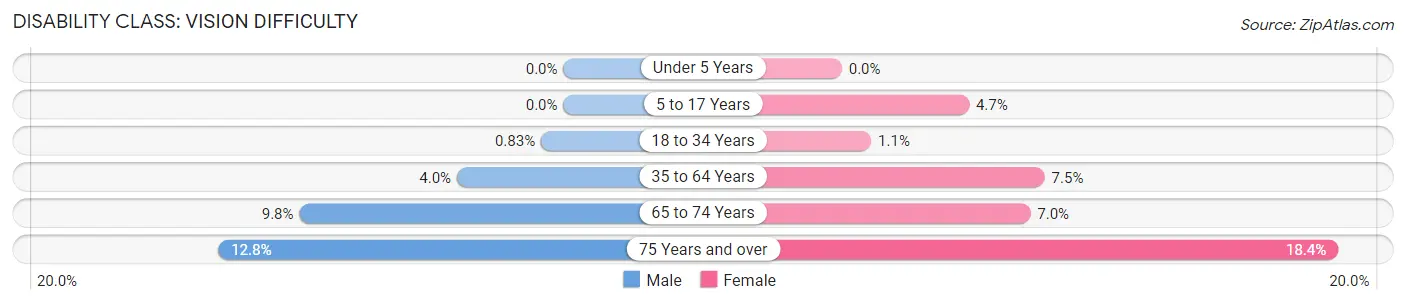
| Age Bracket | Male | Female |
| Under 5 Years | 0 (0.0%) | 0 (0.0%) |
| 5 to 17 Years | 0 (0.0%) | 23 (4.7%) |
| 18 to 34 Years | 6 (0.8%) | 11 (1.1%) |
| 35 to 64 Years | 43 (4.0%) | 90 (7.5%) |
| 65 to 74 Years | 30 (9.8%) | 24 (7.0%) |
| 75 Years and over | 41 (12.8%) | 35 (18.4%) |
Disability Class: Cognitive Difficulty
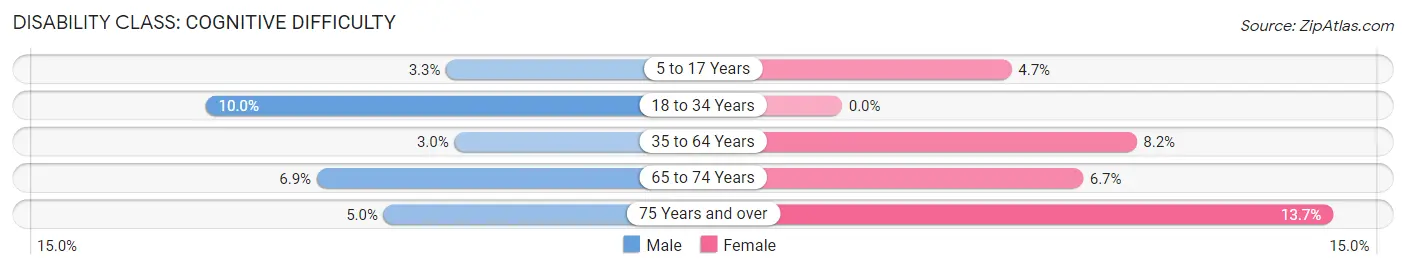
| Age Bracket | Male | Female |
| 5 to 17 Years | 10 (3.3%) | 23 (4.7%) |
| 18 to 34 Years | 72 (10.0%) | 0 (0.0%) |
| 35 to 64 Years | 33 (3.0%) | 98 (8.2%) |
| 65 to 74 Years | 21 (6.9%) | 23 (6.7%) |
| 75 Years and over | 16 (5.0%) | 26 (13.7%) |
Disability Class: Ambulatory Difficulty
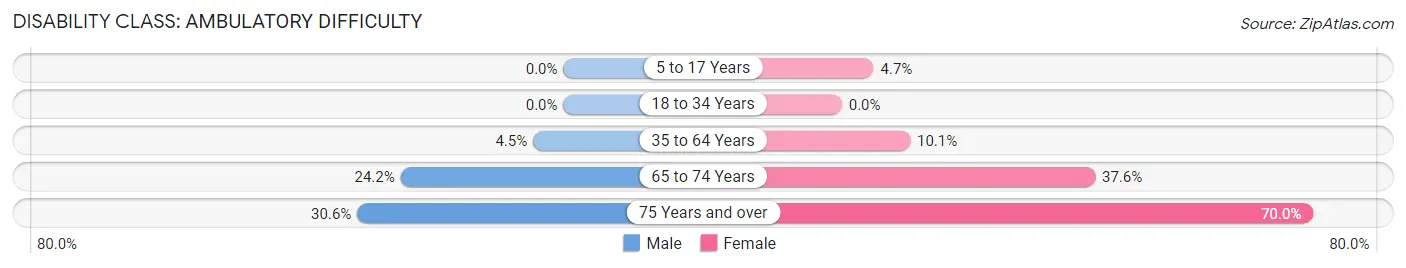
| Age Bracket | Male | Female |
| 5 to 17 Years | 0 (0.0%) | 23 (4.7%) |
| 18 to 34 Years | 0 (0.0%) | 0 (0.0%) |
| 35 to 64 Years | 49 (4.5%) | 121 (10.1%) |
| 65 to 74 Years | 74 (24.2%) | 129 (37.6%) |
| 75 Years and over | 98 (30.6%) | 133 (70.0%) |
Disability Class: Self-Care Difficulty
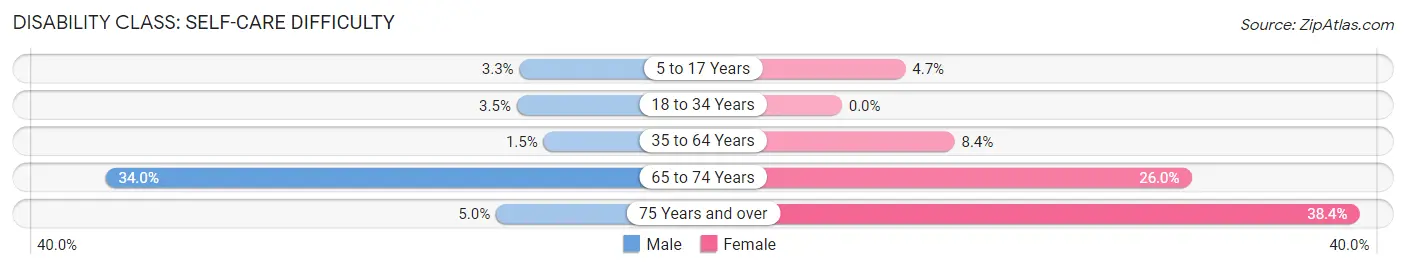
| Age Bracket | Male | Female |
| 5 to 17 Years | 10 (3.3%) | 23 (4.7%) |
| 18 to 34 Years | 25 (3.5%) | 0 (0.0%) |
| 35 to 64 Years | 16 (1.5%) | 100 (8.4%) |
| 65 to 74 Years | 104 (34.0%) | 89 (26.0%) |
| 75 Years and over | 16 (5.0%) | 73 (38.4%) |
Technology Access in Lake Alfred
Computing Device Access in Lake Alfred
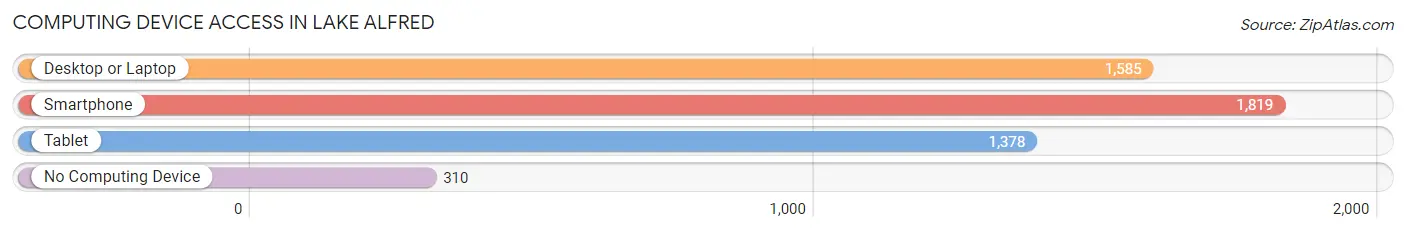
| Device Type | # Households | % Households |
| Desktop or Laptop | 1,585 | 70.3% |
| Smartphone | 1,819 | 80.7% |
| Tablet | 1,378 | 61.1% |
| No Computing Device | 310 | 13.8% |
| Total | 2,254 | 100.0% |
Internet Access in Lake Alfred
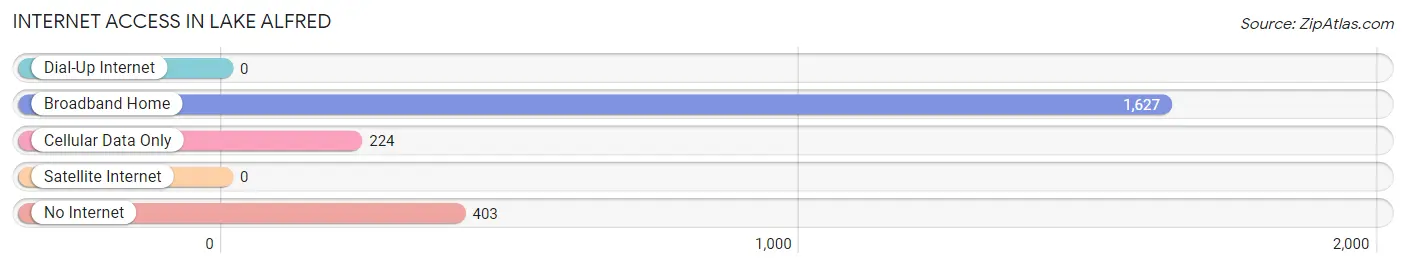
| Internet Type | # Households | % Households |
| Dial-Up Internet | 0 | 0.0% |
| Broadband Home | 1,627 | 72.2% |
| Cellular Data Only | 224 | 9.9% |
| Satellite Internet | 0 | 0.0% |
| No Internet | 403 | 17.9% |
| Total | 2,254 | 100.0% |
Lake Alfred Summary
History
Lake Alfred is a city located in Polk County, Florida, United States. The city was founded in 1883 by Captain John W. Alfred, a Civil War veteran, who purchased the land from the State of Florida. The city was originally known as Alfred, but was later changed to Lake Alfred in 1925 when the city was incorporated.
The city of Lake Alfred has a rich history that dates back to the early 1800s. The area was originally inhabited by the Seminole Indians, who were later forced out by the United States government. The area was then settled by pioneers who were attracted to the area due to its abundance of natural resources. The city was officially founded in 1883 by Captain John W. Alfred, a Civil War veteran, who purchased the land from the State of Florida.
The city of Lake Alfred has seen many changes over the years. In 1925, the city was incorporated and the name was changed to Lake Alfred. The city has also seen a number of businesses come and go, including a sawmill, a citrus packing plant, and a phosphate mining operation.
Geography
Lake Alfred is located in Polk County, Florida, United States. The city is situated on the western shore of Lake Alfred, a natural freshwater lake. The city is located approximately 25 miles southwest of Orlando and is part of the Lakeland-Winter Haven Metropolitan Statistical Area.
The city of Lake Alfred has a total area of 4.2 square miles, all of which is land. The city is located at an elevation of 98 feet above sea level. The city is bordered by the cities of Winter Haven to the north, Auburndale to the east, and Haines City to the south.
Economy
The economy of Lake Alfred is largely based on agriculture and tourism. The city is home to a number of citrus groves, as well as a number of other agricultural operations. The city is also home to a number of tourist attractions, including the Lake Alfred Historical Museum, the Lake Alfred Nature Park, and the Lake Alfred Aquatic Center.
The city is also home to a number of businesses, including a number of retail stores, restaurants, and other service-oriented businesses. The city is also home to a number of manufacturing and industrial businesses, including a number of food processing plants.
Demographics
As of the 2010 census, the city of Lake Alfred had a population of 5,043. The racial makeup of the city was 79.3% White, 15.2% African American, 0.4% Native American, 0.7% Asian, 0.1% Pacific Islander, 2.2% from other races, and 2.3% from two or more races. Hispanic or Latino of any race were 8.2% of the population.
The median income for a household in the city was $37,917, and the median income for a family was $45,938. The per capita income for the city was $19,945. About 11.3% of families and 14.2% of the population were below the poverty line, including 19.2% of those under age 18 and 8.2% of those age 65 or over.
Common Questions
What is Per Capita Income in Lake Alfred?
Per Capita income in Lake Alfred is $28,713.
What is the Median Family Income in Lake Alfred?
Median Family Income in Lake Alfred is $76,083.
What is the Median Household income in Lake Alfred?
Median Household Income in Lake Alfred is $62,311.
What is Income or Wage Gap in Lake Alfred?
Income or Wage Gap in Lake Alfred is 2.9%.
Women in Lake Alfred earn 97.1 cents for every dollar earned by a man.
What is Inequality or Gini Index in Lake Alfred?
Inequality or Gini Index in Lake Alfred is 0.42.
What is the Total Population of Lake Alfred?
Total Population of Lake Alfred is 6,555.
What is the Total Male Population of Lake Alfred?
Total Male Population of Lake Alfred is 3,001.
What is the Total Female Population of Lake Alfred?
Total Female Population of Lake Alfred is 3,554.
What is the Ratio of Males per 100 Females in Lake Alfred?
There are 84.44 Males per 100 Females in Lake Alfred.
What is the Ratio of Females per 100 Males in Lake Alfred?
There are 118.43 Females per 100 Males in Lake Alfred.
What is the Median Population Age in Lake Alfred?
Median Population Age in Lake Alfred is 36.3 Years.
What is the Average Family Size in Lake Alfred
Average Family Size in Lake Alfred is 3.4 People.
What is the Average Household Size in Lake Alfred
Average Household Size in Lake Alfred is 2.9 People.
How Large is the Labor Force in Lake Alfred?
There are 3,537 People in the Labor Forcein in Lake Alfred.
What is the Percentage of People in the Labor Force in Lake Alfred?
66.8% of People are in the Labor Force in Lake Alfred.
What is the Unemployment Rate in Lake Alfred?
Unemployment Rate in Lake Alfred is 6.7%.