Pinecrest, FL Map & Demographics
Pinecrest Map
Pinecrest Overview
$100,270
PER CAPITA INCOME
$217,917
AVG FAMILY INCOME
$178,095
AVG HOUSEHOLD INCOME
51.1%
WAGE / INCOME GAP [ % ]
48.9¢/ $1
WAGE / INCOME GAP [ $ ]
$15,227
FAMILY INCOME DEFICIT
0.57
INEQUALITY / GINI INDEX
18,279
TOTAL POPULATION
9,620
MALE POPULATION
8,659
FEMALE POPULATION
111.10
MALES / 100 FEMALES
90.01
FEMALES / 100 MALES
42.0
MEDIAN AGE
3.6
AVG FAMILY SIZE
3.1
AVG HOUSEHOLD SIZE
8,465
LABOR FORCE [ PEOPLE ]
61.9%
PERCENT IN LABOR FORCE
4.9%
UNEMPLOYMENT RATE
Pinecrest Area Codes
Income in Pinecrest
Income Overview in Pinecrest
Per Capita Income in Pinecrest is $100,270, while median incomes of families and households are $217,917 and $178,095 respectively.
| Characteristic | Number | Measure |
| Per Capita Income | 18,279 | $100,270 |
| Median Family Income | 4,659 | $217,917 |
| Mean Family Income | 4,659 | $351,670 |
| Median Household Income | 5,966 | $178,095 |
| Mean Household Income | 5,966 | $304,416 |
| Income Deficit | 4,659 | $15,227 |
| Wage / Income Gap (%) | 18,279 | 51.07% |
| Wage / Income Gap ($) | 18,279 | 48.93¢ per $1 |
| Gini / Inequality Index | 18,279 | 0.57 |
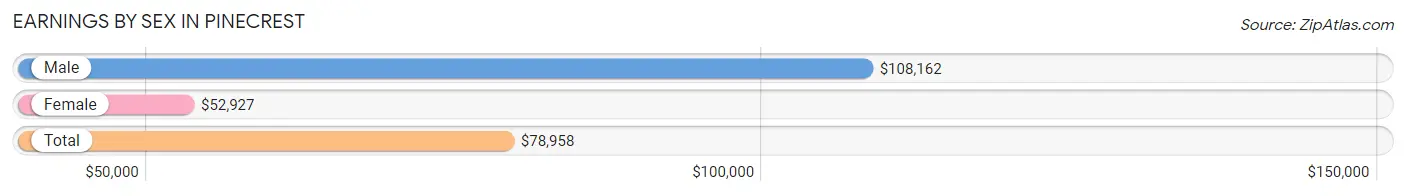
Earnings by Sex in Pinecrest
Average Earnings in Pinecrest are $78,958, $108,162 for men and $52,927 for women, a difference of 51.1%.
| Sex | Number | Average Earnings |
| Male | 5,275 (58.6%) | $108,162 |
| Female | 3,724 (41.4%) | $52,927 |
| Total | 8,999 (100.0%) | $78,958 |
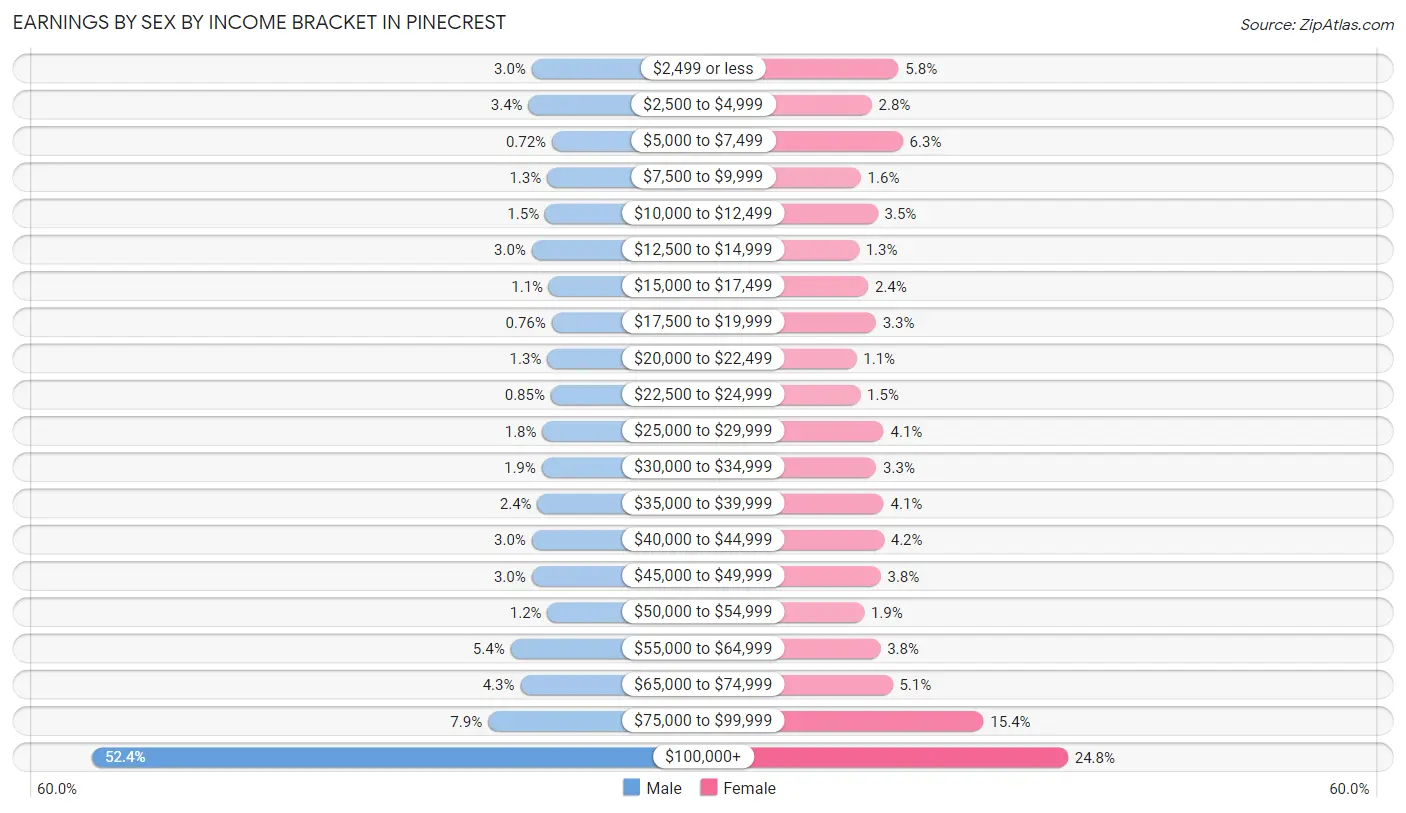
Earnings by Sex by Income Bracket in Pinecrest
The most common earnings brackets in Pinecrest are $100,000+ for men (2,764 | 52.4%) and $100,000+ for women (925 | 24.8%).
| Income | Male | Female |
| $2,499 or less | 158 (3.0%) | 216 (5.8%) |
| $2,500 to $4,999 | 177 (3.4%) | 104 (2.8%) |
| $5,000 to $7,499 | 38 (0.7%) | 234 (6.3%) |
| $7,500 to $9,999 | 67 (1.3%) | 58 (1.6%) |
| $10,000 to $12,499 | 79 (1.5%) | 129 (3.5%) |
| $12,500 to $14,999 | 158 (3.0%) | 50 (1.3%) |
| $15,000 to $17,499 | 56 (1.1%) | 89 (2.4%) |
| $17,500 to $19,999 | 40 (0.8%) | 121 (3.3%) |
| $20,000 to $22,499 | 66 (1.3%) | 40 (1.1%) |
| $22,500 to $24,999 | 45 (0.9%) | 56 (1.5%) |
| $25,000 to $29,999 | 95 (1.8%) | 154 (4.1%) |
| $30,000 to $34,999 | 99 (1.9%) | 123 (3.3%) |
| $35,000 to $39,999 | 124 (2.4%) | 154 (4.1%) |
| $40,000 to $44,999 | 158 (3.0%) | 155 (4.2%) |
| $45,000 to $49,999 | 159 (3.0%) | 141 (3.8%) |
| $50,000 to $54,999 | 65 (1.2%) | 72 (1.9%) |
| $55,000 to $64,999 | 284 (5.4%) | 140 (3.8%) |
| $65,000 to $74,999 | 226 (4.3%) | 191 (5.1%) |
| $75,000 to $99,999 | 417 (7.9%) | 572 (15.4%) |
| $100,000+ | 2,764 (52.4%) | 925 (24.8%) |
| Total | 5,275 (100.0%) | 3,724 (100.0%) |
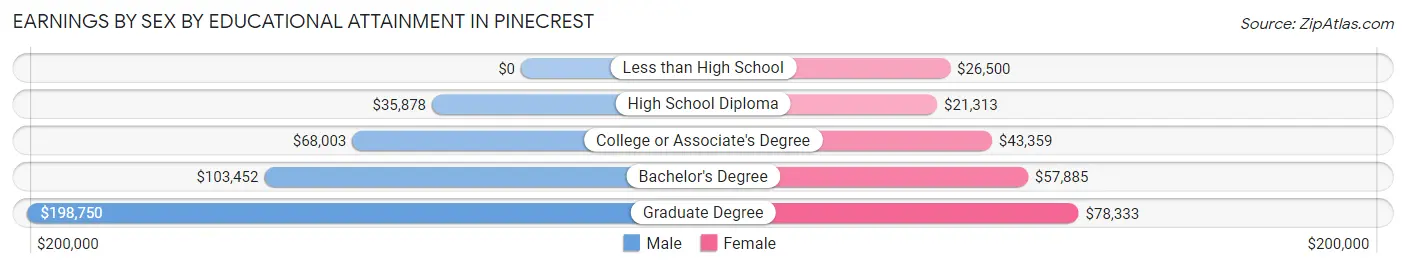
Earnings by Sex by Educational Attainment in Pinecrest
Average earnings in Pinecrest are $114,216 for men and $59,588 for women, a difference of 47.8%. Men with an educational attainment of graduate degree enjoy the highest average annual earnings of $198,750, while those with high school diploma education earn the least with $35,878. Women with an educational attainment of graduate degree earn the most with the average annual earnings of $78,333, while those with high school diploma education have the smallest earnings of $21,313.
| Educational Attainment | Male Income | Female Income |
| Less than High School | - | - |
| High School Diploma | $35,878 | $21,313 |
| College or Associate's Degree | $68,003 | $43,359 |
| Bachelor's Degree | $103,452 | $57,885 |
| Graduate Degree | $198,750 | $78,333 |
| Total | $114,216 | $59,588 |
Family Income in Pinecrest
Family Income Brackets in Pinecrest
According to the Pinecrest family income data, there are 2,544 families falling into the $200,000+ income range, which is the most common income bracket and makes up 54.6% of all families. Conversely, the $10,000 to $14,999 income bracket is the least frequent group with only 37 families (0.8%) belonging to this category.
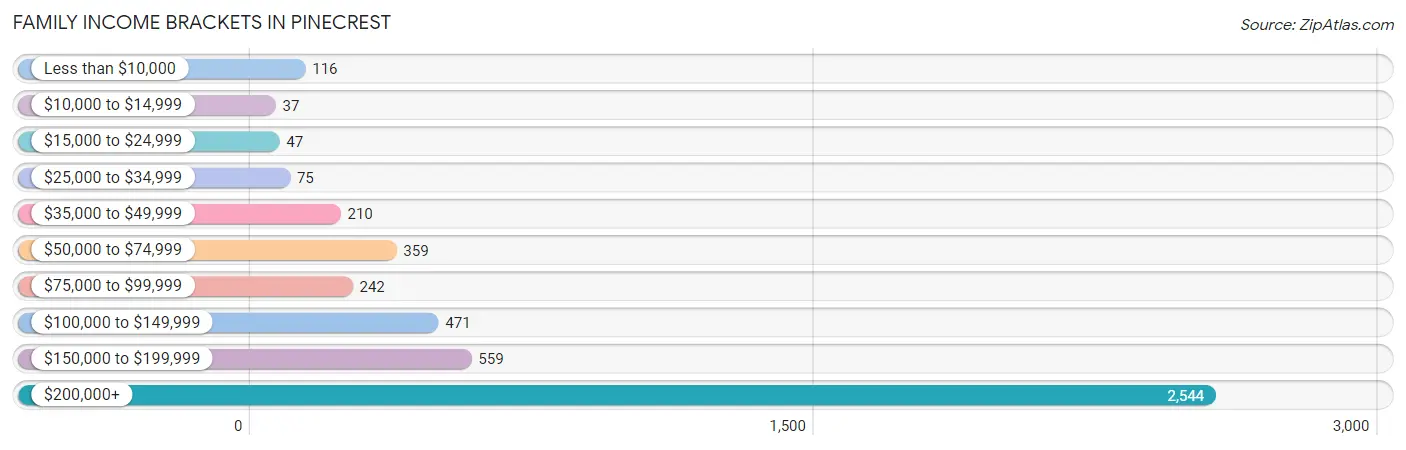
| Income Bracket | # Families | % Families |
| Less than $10,000 | 116 | 2.5% |
| $10,000 to $14,999 | 37 | 0.8% |
| $15,000 to $24,999 | 47 | 1.0% |
| $25,000 to $34,999 | 75 | 1.6% |
| $35,000 to $49,999 | 210 | 4.5% |
| $50,000 to $74,999 | 359 | 7.7% |
| $75,000 to $99,999 | 242 | 5.2% |
| $100,000 to $149,999 | 471 | 10.1% |
| $150,000 to $199,999 | 559 | 12.0% |
| $200,000+ | 2,544 | 54.6% |
Family Income by Famaliy Size in Pinecrest
4-person families (1,124 | 24.1%) account for the highest median family income in Pinecrest with $250,001 per family, while 2-person families (1,719 | 36.9%) have the highest median income of $102,410 per family member.
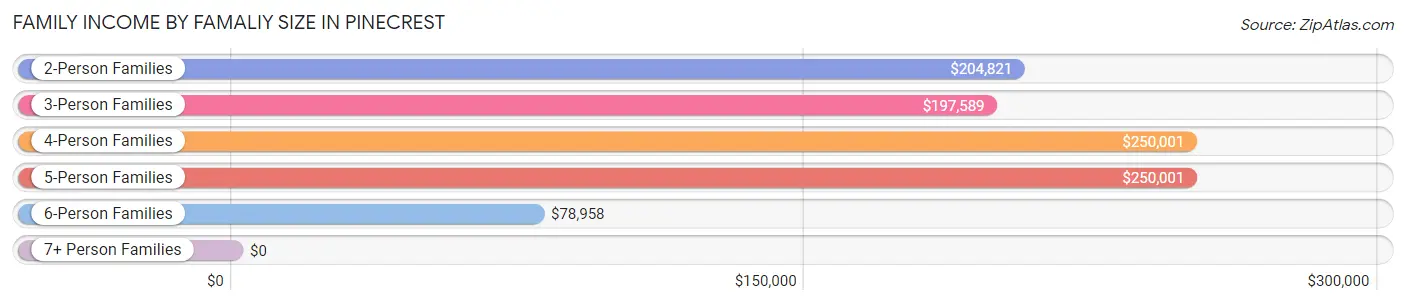
| Income Bracket | # Families | Median Income |
| 2-Person Families | 1,719 (36.9%) | $204,821 |
| 3-Person Families | 1,031 (22.1%) | $197,589 |
| 4-Person Families | 1,124 (24.1%) | $250,001 |
| 5-Person Families | 614 (13.2%) | $250,001 |
| 6-Person Families | 160 (3.4%) | $78,958 |
| 7+ Person Families | 11 (0.2%) | $0 |
| Total | 4,659 (100.0%) | $217,917 |
Family Income by Number of Earners in Pinecrest
The median family income in Pinecrest is $217,917, with families comprising 3+ earners (588) having the highest median family income of $250,001, while families with no earners (458) have the lowest median family income of $68,162, accounting for 12.6% and 9.8% of families, respectively.
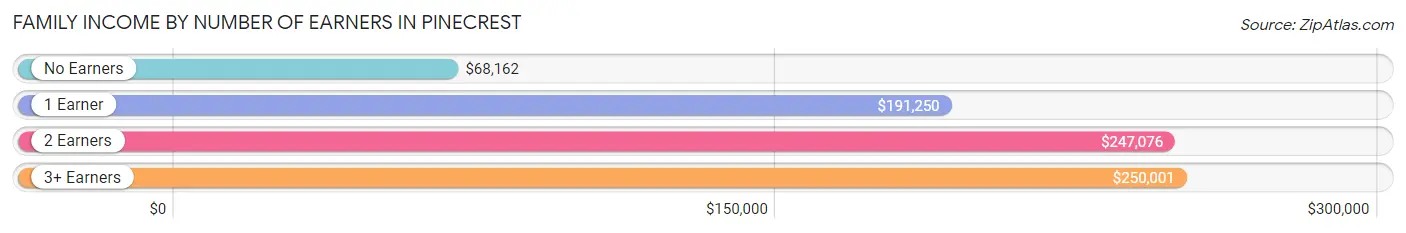
| Number of Earners | # Families | Median Income |
| No Earners | 458 (9.8%) | $68,162 |
| 1 Earner | 1,409 (30.2%) | $191,250 |
| 2 Earners | 2,204 (47.3%) | $247,076 |
| 3+ Earners | 588 (12.6%) | $250,001 |
| Total | 4,659 (100.0%) | $217,917 |
Household Income in Pinecrest
Household Income Brackets in Pinecrest
With 2,691 households falling in the category, the $200,000+ income range is the most frequent in Pinecrest, accounting for 45.1% of all households. In contrast, only 42 households (0.7%) fall into the $10,000 to $14,999 income bracket, making it the least populous group.
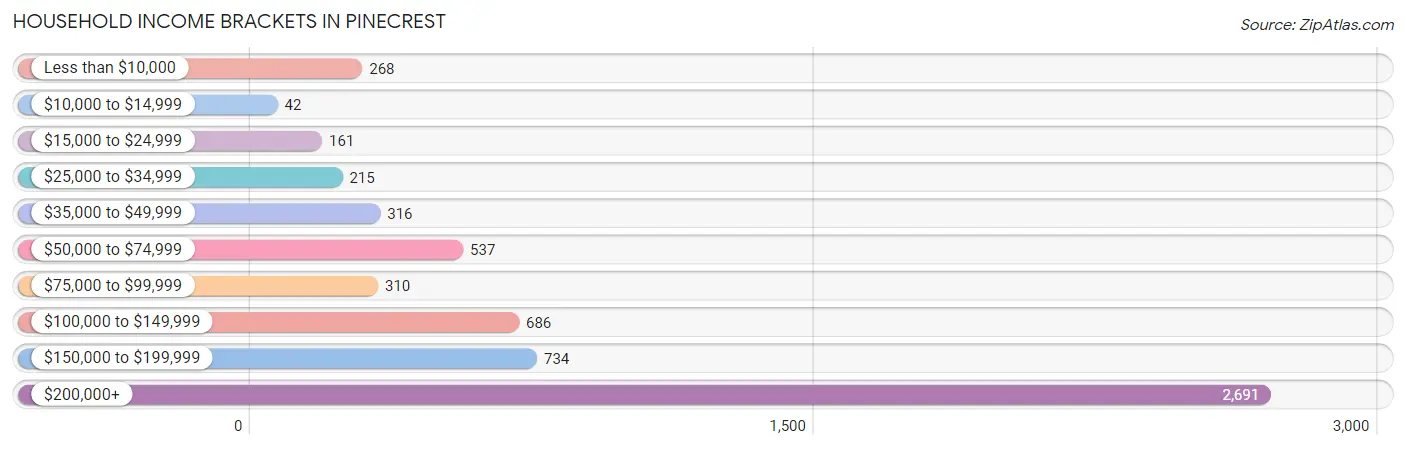
| Income Bracket | # Households | % Households |
| Less than $10,000 | 268 | 4.5% |
| $10,000 to $14,999 | 42 | 0.7% |
| $15,000 to $24,999 | 161 | 2.7% |
| $25,000 to $34,999 | 215 | 3.6% |
| $35,000 to $49,999 | 316 | 5.3% |
| $50,000 to $74,999 | 537 | 9.0% |
| $75,000 to $99,999 | 310 | 5.2% |
| $100,000 to $149,999 | 686 | 11.5% |
| $150,000 to $199,999 | 734 | 12.3% |
| $200,000+ | 2,691 | 45.1% |
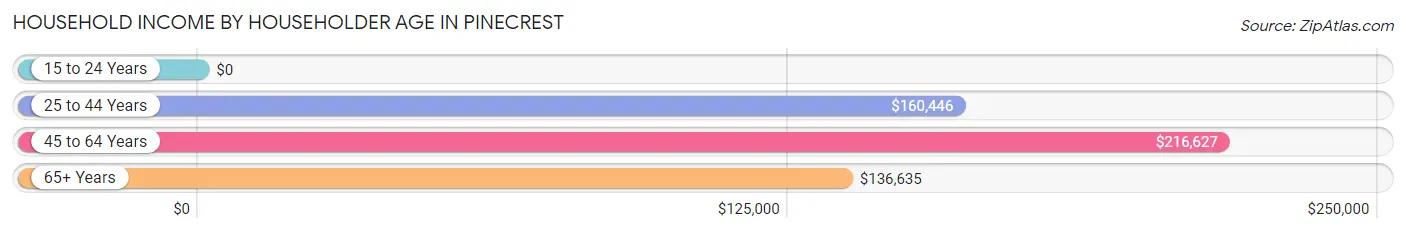
Household Income by Householder Age in Pinecrest
The median household income in Pinecrest is $178,095, with the highest median household income of $216,627 found in the 45 to 64 years age bracket for the primary householder. A total of 2,915 households (48.9%) fall into this category. Meanwhile, the 15 to 24 years age bracket for the primary householder has the lowest median household income of $0, with 19 households (0.3%) in this group.
| Income Bracket | # Households | Median Income |
| 15 to 24 Years | 19 (0.3%) | $0 |
| 25 to 44 Years | 1,173 (19.7%) | $160,446 |
| 45 to 64 Years | 2,915 (48.9%) | $216,627 |
| 65+ Years | 1,859 (31.2%) | $136,635 |
| Total | 5,966 (100.0%) | $178,095 |
Poverty in Pinecrest
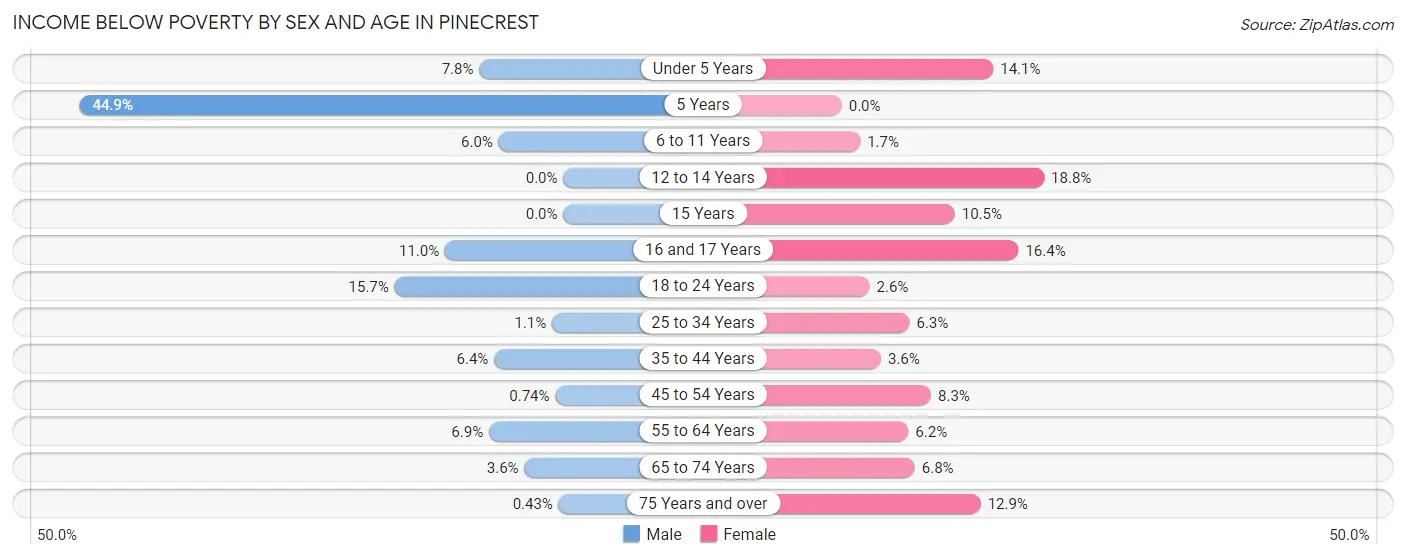
Income Below Poverty by Sex and Age in Pinecrest
With 5.3% poverty level for males and 7.7% for females among the residents of Pinecrest, 5 year old males and 12 to 14 year old females are the most vulnerable to poverty, with 22 males (44.9%) and 89 females (18.8%) in their respective age groups living below the poverty level.
| Age Bracket | Male | Female |
| Under 5 Years | 39 (7.8%) | 63 (14.1%) |
| 5 Years | 22 (44.9%) | 0 (0.0%) |
| 6 to 11 Years | 83 (6.0%) | 14 (1.7%) |
| 12 to 14 Years | 0 (0.0%) | 89 (18.8%) |
| 15 Years | 0 (0.0%) | 15 (10.5%) |
| 16 and 17 Years | 36 (11.0%) | 51 (16.4%) |
| 18 to 24 Years | 122 (15.7%) | 10 (2.6%) |
| 25 to 34 Years | 7 (1.1%) | 35 (6.3%) |
| 35 to 44 Years | 69 (6.4%) | 40 (3.6%) |
| 45 to 54 Years | 10 (0.7%) | 118 (8.3%) |
| 55 to 64 Years | 86 (6.9%) | 77 (6.2%) |
| 65 to 74 Years | 39 (3.6%) | 67 (6.8%) |
| 75 Years and over | 2 (0.4%) | 87 (12.9%) |
| Total | 515 (5.3%) | 666 (7.7%) |
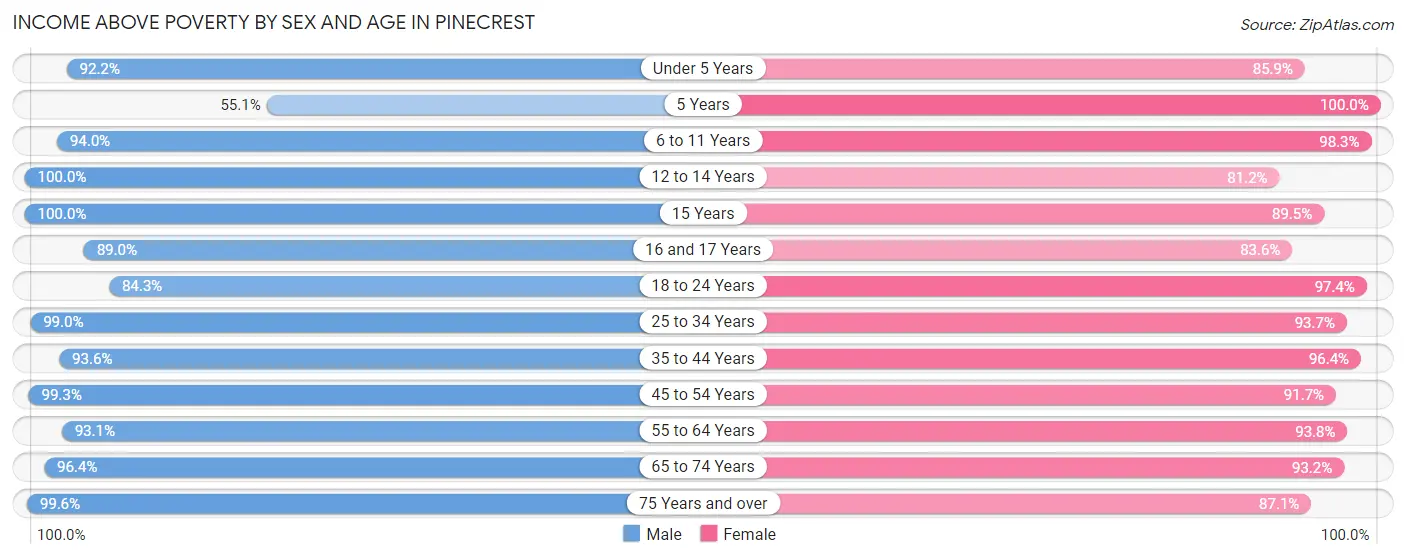
Income Above Poverty by Sex and Age in Pinecrest
According to the poverty statistics in Pinecrest, males aged 12 to 14 years and females aged 5 years are the age groups that are most secure financially, with 100.0% of males and 100.0% of females in these age groups living above the poverty line.
| Age Bracket | Male | Female |
| Under 5 Years | 461 (92.2%) | 385 (85.9%) |
| 5 Years | 27 (55.1%) | 85 (100.0%) |
| 6 to 11 Years | 1,300 (94.0%) | 805 (98.3%) |
| 12 to 14 Years | 515 (100.0%) | 385 (81.2%) |
| 15 Years | 186 (100.0%) | 128 (89.5%) |
| 16 and 17 Years | 292 (89.0%) | 260 (83.6%) |
| 18 to 24 Years | 657 (84.3%) | 377 (97.4%) |
| 25 to 34 Years | 660 (99.0%) | 522 (93.7%) |
| 35 to 44 Years | 1,005 (93.6%) | 1,059 (96.4%) |
| 45 to 54 Years | 1,333 (99.3%) | 1,306 (91.7%) |
| 55 to 64 Years | 1,160 (93.1%) | 1,169 (93.8%) |
| 65 to 74 Years | 1,042 (96.4%) | 921 (93.2%) |
| 75 Years and over | 466 (99.6%) | 588 (87.1%) |
| Total | 9,104 (94.7%) | 7,990 (92.3%) |
Income Below Poverty Among Married-Couple Families in Pinecrest
The poverty statistics for married-couple families in Pinecrest show that 4.4% or 179 of the total 4,059 families live below the poverty line. Families with 3 or 4 children have the highest poverty rate of 11.0%, comprising of 53 families. On the other hand, families with no children have the lowest poverty rate of 2.1%, which includes 45 families.

| Children | Above Poverty | Below Poverty |
| No Children | 2,113 (97.9%) | 45 (2.1%) |
| 1 or 2 Children | 1,336 (94.3%) | 81 (5.7%) |
| 3 or 4 Children | 431 (89.0%) | 53 (11.0%) |
| 5 or more Children | 0 (0.0%) | 0 (0.0%) |
| Total | 3,880 (95.6%) | 179 (4.4%) |
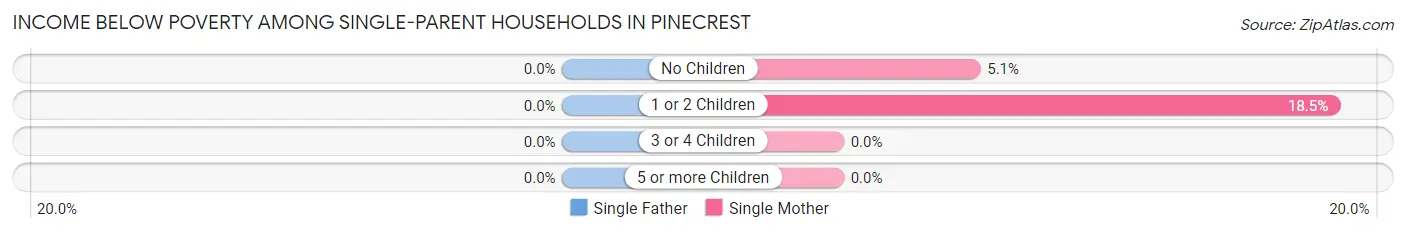
Income Below Poverty Among Single-Parent Households in Pinecrest
| Children | Single Father | Single Mother |
| No Children | 0 (0.0%) | 11 (5.1%) |
| 1 or 2 Children | 0 (0.0%) | 49 (18.5%) |
| 3 or 4 Children | 0 (0.0%) | 0 (0.0%) |
| 5 or more Children | 0 (0.0%) | 0 (0.0%) |
| Total | 0 (0.0%) | 60 (11.8%) |
Income Below Poverty Among Married-Couple vs Single-Parent Households in Pinecrest
The poverty data for Pinecrest shows that 179 of the married-couple family households (4.4%) and 60 of the single-parent households (10.0%) are living below the poverty level. Within the married-couple family households, those with 3 or 4 children have the highest poverty rate, with 53 households (11.0%) falling below the poverty line. Among the single-parent households, those with 1 or 2 children have the highest poverty rate, with 49 household (17.4%) living below poverty.
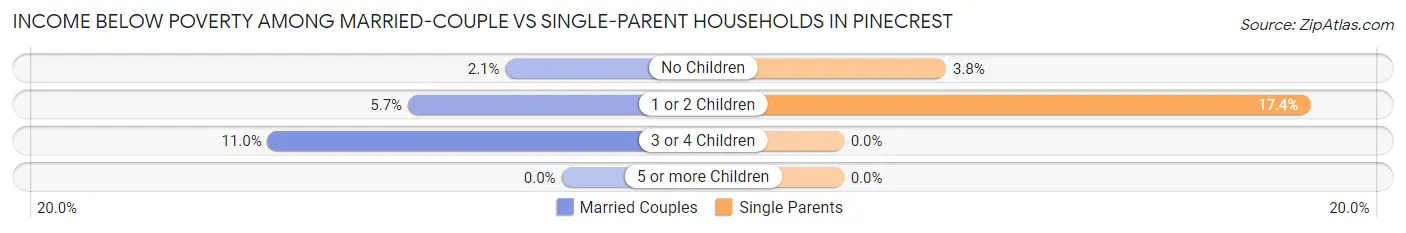
| Children | Married-Couple Families | Single-Parent Households |
| No Children | 45 (2.1%) | 11 (3.8%) |
| 1 or 2 Children | 81 (5.7%) | 49 (17.4%) |
| 3 or 4 Children | 53 (11.0%) | 0 (0.0%) |
| 5 or more Children | 0 (0.0%) | 0 (0.0%) |
| Total | 179 (4.4%) | 60 (10.0%) |
Race in Pinecrest
The most populous races in Pinecrest are White / Caucasian (11,767 | 64.4%), Hispanic or Latino (7,788 | 42.6%), and Two or more Races (5,053 | 27.6%).
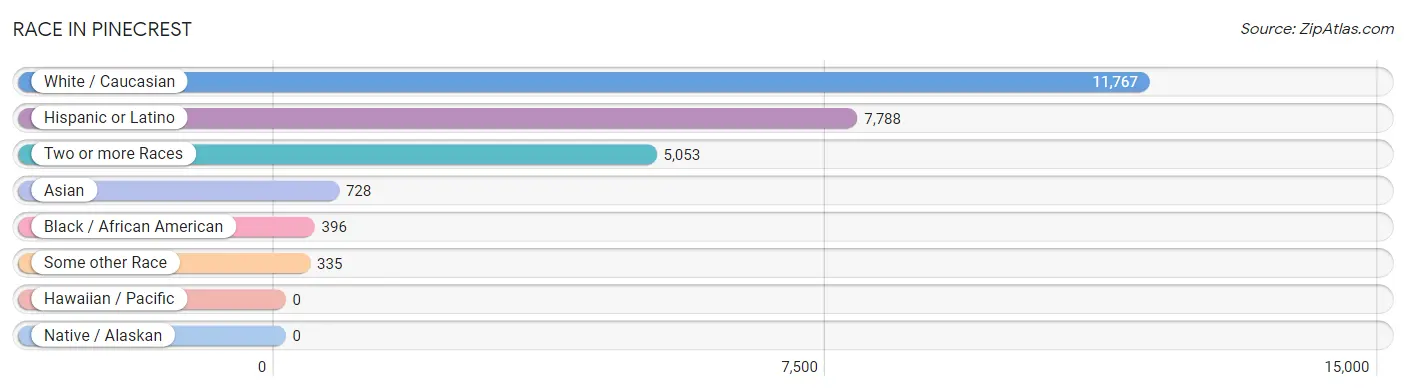
| Race | # Population | % Population |
| Asian | 728 | 4.0% |
| Black / African American | 396 | 2.2% |
| Hawaiian / Pacific | 0 | 0.0% |
| Hispanic or Latino | 7,788 | 42.6% |
| Native / Alaskan | 0 | 0.0% |
| White / Caucasian | 11,767 | 64.4% |
| Two or more Races | 5,053 | 27.6% |
| Some other Race | 335 | 1.8% |
| Total | 18,279 | 100.0% |
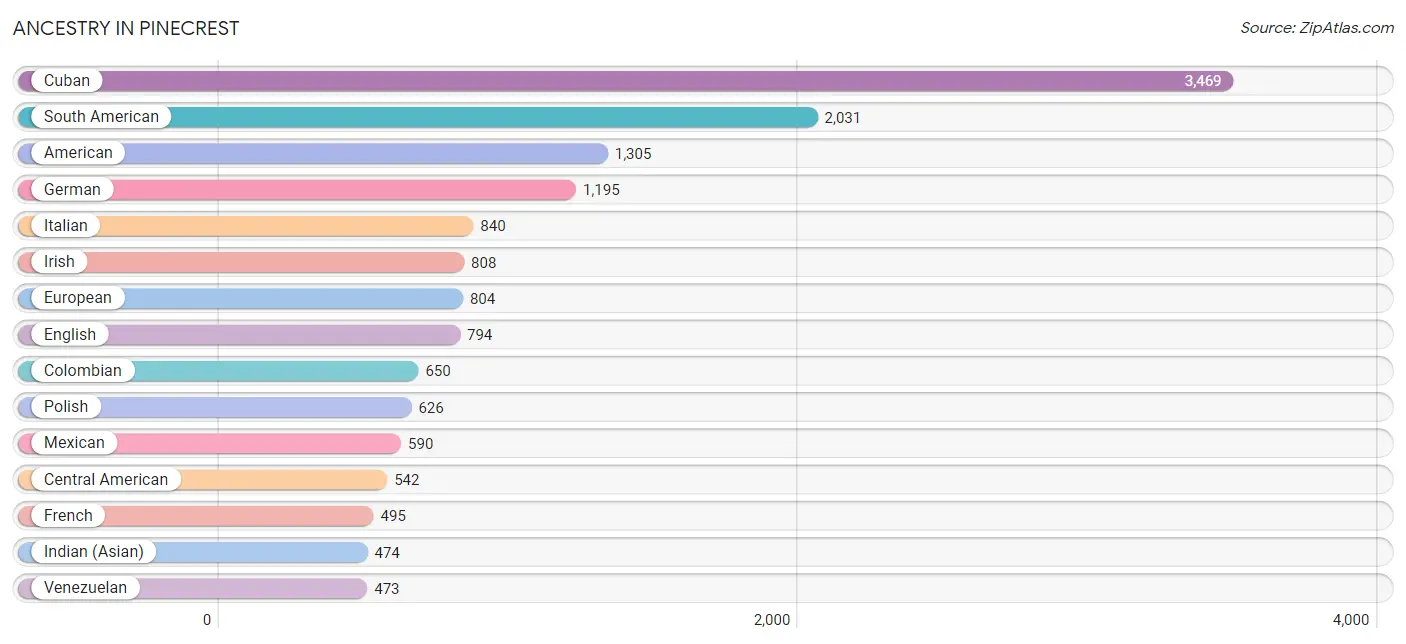
Ancestry in Pinecrest
The most populous ancestries reported in Pinecrest are Cuban (3,469 | 19.0%), South American (2,031 | 11.1%), American (1,305 | 7.1%), German (1,195 | 6.5%), and Italian (840 | 4.6%), together accounting for 48.4% of all Pinecrest residents.
| Ancestry | # Population | % Population |
| Albanian | 5 | 0.0% |
| American | 1,305 | 7.1% |
| Arab | 369 | 2.0% |
| Argentinean | 242 | 1.3% |
| Armenian | 10 | 0.1% |
| Austrian | 50 | 0.3% |
| Bahamian | 1 | 0.0% |
| Belgian | 87 | 0.5% |
| Belizean | 53 | 0.3% |
| Bhutanese | 87 | 0.5% |
| Bolivian | 10 | 0.1% |
| Brazilian | 258 | 1.4% |
| British | 218 | 1.2% |
| Burmese | 90 | 0.5% |
| Canadian | 53 | 0.3% |
| Central American | 542 | 3.0% |
| Central American Indian | 34 | 0.2% |
| Cherokee | 20 | 0.1% |
| Chickasaw | 18 | 0.1% |
| Chilean | 238 | 1.3% |
| Colombian | 650 | 3.6% |
| Costa Rican | 26 | 0.1% |
| Croatian | 24 | 0.1% |
| Cuban | 3,469 | 19.0% |
| Czech | 39 | 0.2% |
| Czechoslovakian | 9 | 0.1% |
| Danish | 121 | 0.7% |
| Dominican | 312 | 1.7% |
| Dutch | 87 | 0.5% |
| Dutch West Indian | 20 | 0.1% |
| Eastern European | 271 | 1.5% |
| Ecuadorian | 175 | 1.0% |
| Egyptian | 18 | 0.1% |
| English | 794 | 4.3% |
| European | 804 | 4.4% |
| Filipino | 10 | 0.1% |
| Finnish | 12 | 0.1% |
| French | 495 | 2.7% |
| French Canadian | 96 | 0.5% |
| German | 1,195 | 6.5% |
| Greek | 181 | 1.0% |
| Guatemalan | 68 | 0.4% |
| Guyanese | 9 | 0.1% |
| Haitian | 21 | 0.1% |
| Honduran | 87 | 0.5% |
| Hungarian | 48 | 0.3% |
| Indian (Asian) | 474 | 2.6% |
| Iranian | 140 | 0.8% |
| Irish | 808 | 4.4% |
| Israeli | 8 | 0.0% |
| Italian | 840 | 4.6% |
| Jamaican | 79 | 0.4% |
| Korean | 86 | 0.5% |
| Laotian | 14 | 0.1% |
| Lebanese | 322 | 1.8% |
| Lithuanian | 54 | 0.3% |
| Luxembourger | 8 | 0.0% |
| Maltese | 14 | 0.1% |
| Mexican | 590 | 3.2% |
| Moroccan | 6 | 0.0% |
| New Zealander | 7 | 0.0% |
| Nicaraguan | 288 | 1.6% |
| Norwegian | 28 | 0.2% |
| Pakistani | 48 | 0.3% |
| Palestinian | 9 | 0.1% |
| Panamanian | 9 | 0.1% |
| Paraguayan | 21 | 0.1% |
| Peruvian | 194 | 1.1% |
| Polish | 626 | 3.4% |
| Portuguese | 134 | 0.7% |
| Puerto Rican | 416 | 2.3% |
| Romanian | 55 | 0.3% |
| Russian | 419 | 2.3% |
| Salvadoran | 53 | 0.3% |
| Scotch-Irish | 41 | 0.2% |
| Scottish | 257 | 1.4% |
| Serbian | 23 | 0.1% |
| Slovak | 109 | 0.6% |
| South African | 16 | 0.1% |
| South American | 2,031 | 11.1% |
| Spaniard | 171 | 0.9% |
| Spanish | 72 | 0.4% |
| Sri Lankan | 8 | 0.0% |
| Subsaharan African | 64 | 0.4% |
| Swedish | 105 | 0.6% |
| Swiss | 23 | 0.1% |
| Syrian | 14 | 0.1% |
| Thai | 277 | 1.5% |
| Trinidadian and Tobagonian | 31 | 0.2% |
| Turkish | 44 | 0.2% |
| Ukrainian | 53 | 0.3% |
| Uruguayan | 28 | 0.2% |
| Venezuelan | 473 | 2.6% |
| West Indian | 18 | 0.1% |
| Yugoslavian | 7 | 0.0% | View All 95 Rows |
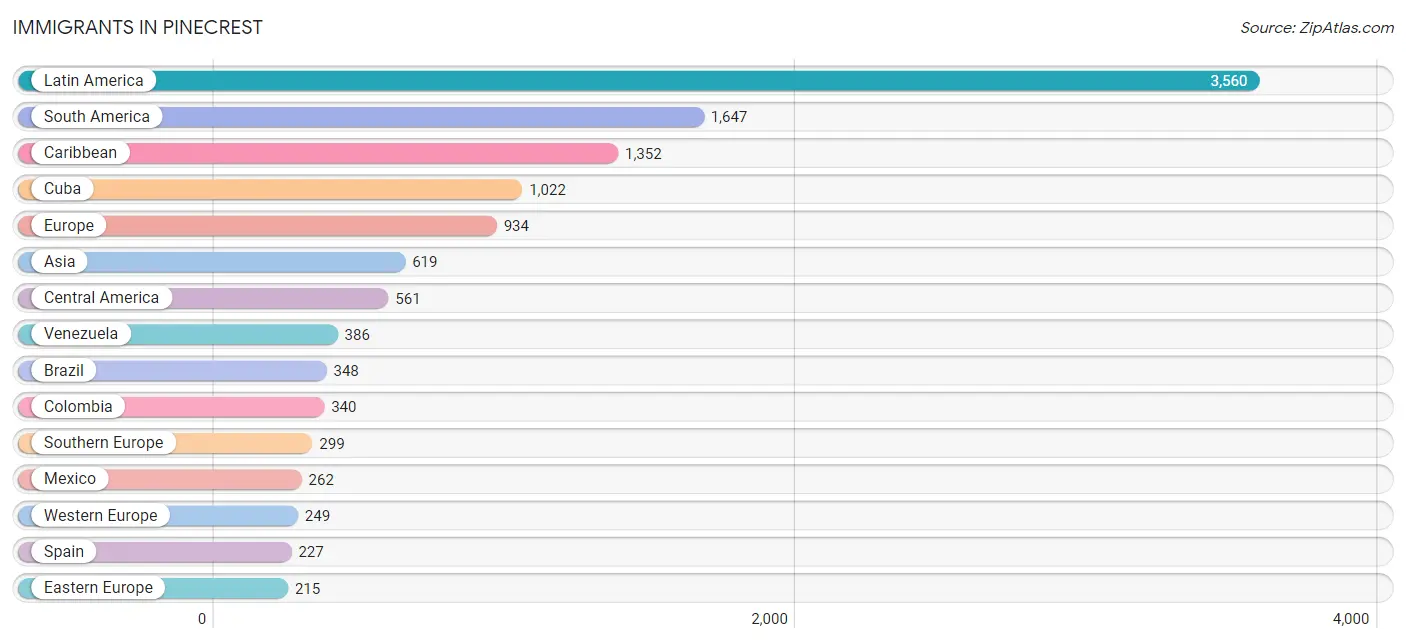
Immigrants in Pinecrest
The most numerous immigrant groups reported in Pinecrest came from Latin America (3,560 | 19.5%), South America (1,647 | 9.0%), Caribbean (1,352 | 7.4%), Cuba (1,022 | 5.6%), and Europe (934 | 5.1%), together accounting for 46.6% of all Pinecrest residents.
| Immigration Origin | # Population | % Population |
| Africa | 52 | 0.3% |
| Albania | 5 | 0.0% |
| Argentina | 147 | 0.8% |
| Asia | 619 | 3.4% |
| Belgium | 102 | 0.6% |
| Belize | 76 | 0.4% |
| Brazil | 348 | 1.9% |
| Canada | 41 | 0.2% |
| Caribbean | 1,352 | 7.4% |
| Central America | 561 | 3.1% |
| Chile | 197 | 1.1% |
| China | 158 | 0.9% |
| Colombia | 340 | 1.9% |
| Costa Rica | 35 | 0.2% |
| Cuba | 1,022 | 5.6% |
| Dominican Republic | 153 | 0.8% |
| Eastern Asia | 173 | 0.9% |
| Eastern Europe | 215 | 1.2% |
| Ecuador | 70 | 0.4% |
| Egypt | 18 | 0.1% |
| El Salvador | 44 | 0.2% |
| England | 101 | 0.5% |
| Europe | 934 | 5.1% |
| France | 83 | 0.4% |
| Germany | 56 | 0.3% |
| Greece | 13 | 0.1% |
| Guatemala | 51 | 0.3% |
| Guyana | 8 | 0.0% |
| Haiti | 7 | 0.0% |
| Honduras | 35 | 0.2% |
| Hong Kong | 13 | 0.1% |
| India | 78 | 0.4% |
| Iran | 46 | 0.3% |
| Ireland | 15 | 0.1% |
| Italy | 49 | 0.3% |
| Jamaica | 102 | 0.6% |
| Korea | 15 | 0.1% |
| Latin America | 3,560 | 19.5% |
| Lebanon | 100 | 0.5% |
| Mexico | 262 | 1.4% |
| Morocco | 6 | 0.0% |
| Netherlands | 8 | 0.0% |
| Nicaragua | 38 | 0.2% |
| Northern Africa | 24 | 0.1% |
| Northern Europe | 171 | 0.9% |
| Panama | 9 | 0.1% |
| Peru | 102 | 0.6% |
| Philippines | 78 | 0.4% |
| Poland | 141 | 0.8% |
| Portugal | 10 | 0.1% |
| Russia | 19 | 0.1% |
| Serbia | 33 | 0.2% |
| South Africa | 28 | 0.2% |
| South America | 1,647 | 9.0% |
| South Central Asia | 138 | 0.7% |
| South Eastern Asia | 153 | 0.8% |
| Southern Europe | 299 | 1.6% |
| Spain | 227 | 1.2% |
| Sri Lanka | 14 | 0.1% |
| Sweden | 45 | 0.3% |
| Taiwan | 20 | 0.1% |
| Thailand | 75 | 0.4% |
| Trinidad and Tobago | 48 | 0.3% |
| Turkey | 38 | 0.2% |
| Ukraine | 10 | 0.1% |
| Uruguay | 28 | 0.2% |
| Venezuela | 386 | 2.1% |
| Western Asia | 138 | 0.7% |
| Western Europe | 249 | 1.4% | View All 69 Rows |
Sex and Age in Pinecrest
Sex and Age in Pinecrest
The most populous age groups in Pinecrest are 10 to 14 Years (1,011 | 10.5%) for men and 10 to 14 Years (813 | 9.4%) for women.
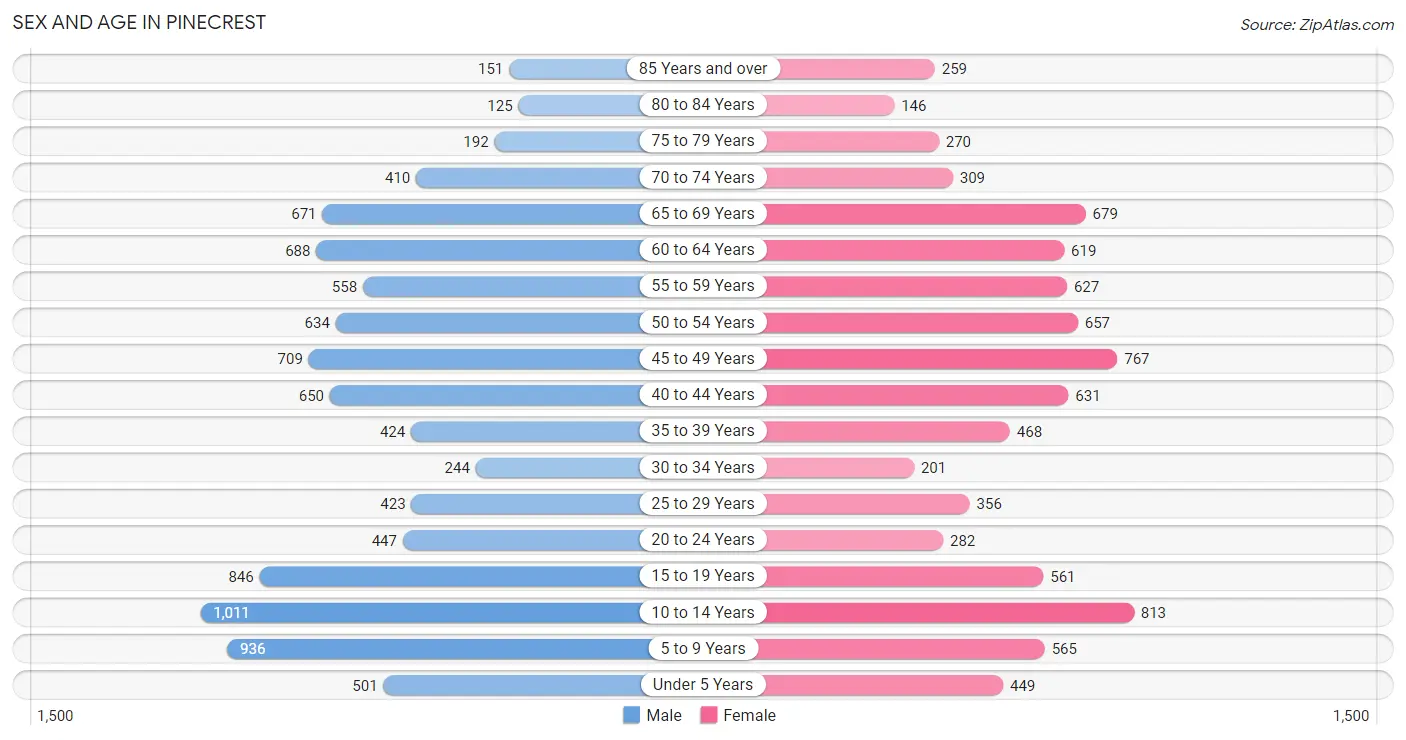
| Age Bracket | Male | Female |
| Under 5 Years | 501 (5.2%) | 449 (5.2%) |
| 5 to 9 Years | 936 (9.7%) | 565 (6.5%) |
| 10 to 14 Years | 1,011 (10.5%) | 813 (9.4%) |
| 15 to 19 Years | 846 (8.8%) | 561 (6.5%) |
| 20 to 24 Years | 447 (4.6%) | 282 (3.3%) |
| 25 to 29 Years | 423 (4.4%) | 356 (4.1%) |
| 30 to 34 Years | 244 (2.5%) | 201 (2.3%) |
| 35 to 39 Years | 424 (4.4%) | 468 (5.4%) |
| 40 to 44 Years | 650 (6.8%) | 631 (7.3%) |
| 45 to 49 Years | 709 (7.4%) | 767 (8.9%) |
| 50 to 54 Years | 634 (6.6%) | 657 (7.6%) |
| 55 to 59 Years | 558 (5.8%) | 627 (7.2%) |
| 60 to 64 Years | 688 (7.1%) | 619 (7.1%) |
| 65 to 69 Years | 671 (7.0%) | 679 (7.8%) |
| 70 to 74 Years | 410 (4.3%) | 309 (3.6%) |
| 75 to 79 Years | 192 (2.0%) | 270 (3.1%) |
| 80 to 84 Years | 125 (1.3%) | 146 (1.7%) |
| 85 Years and over | 151 (1.6%) | 259 (3.0%) |
| Total | 9,620 (100.0%) | 8,659 (100.0%) |
Families and Households in Pinecrest
Median Family Size in Pinecrest
The median family size in Pinecrest is 3.56 persons per family, with married-couple families (4,059 | 87.1%) accounting for the largest median family size of 3.62 persons per family. On the other hand, single male/father families (90 | 1.9%) represent the smallest median family size with 3.12 persons per family.
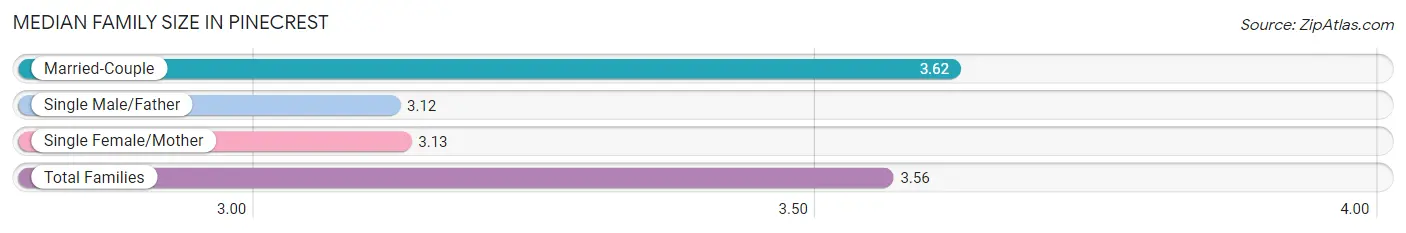
| Family Type | # Families | Family Size |
| Married-Couple | 4,059 (87.1%) | 3.62 |
| Single Male/Father | 90 (1.9%) | 3.12 |
| Single Female/Mother | 510 (11.0%) | 3.13 |
| Total Families | 4,659 (100.0%) | 3.56 |
Median Household Size in Pinecrest
The median household size in Pinecrest is 3.06 persons per household, with married-couple households (4,059 | 68.0%) accounting for the largest median household size of 3.65 persons per household. non-family households (1,307 | 21.9%) represent the smallest median household size with 1.12 persons per household.
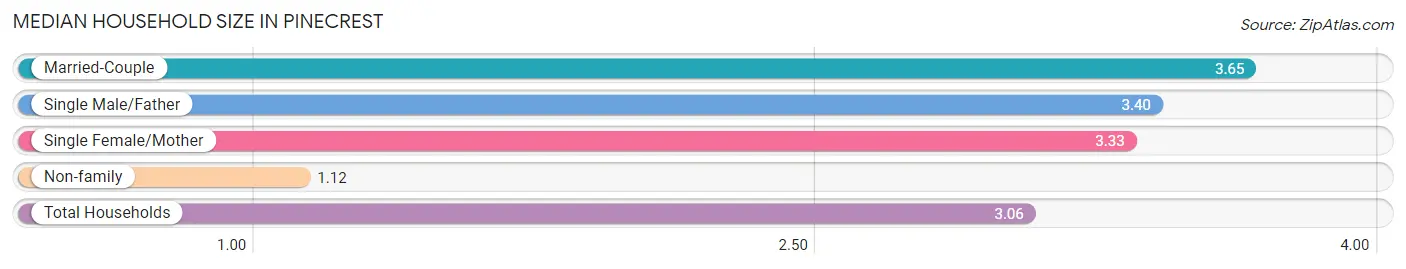
| Household Type | # Households | Household Size |
| Married-Couple | 4,059 (68.0%) | 3.65 |
| Single Male/Father | 90 (1.5%) | 3.40 |
| Single Female/Mother | 510 (8.6%) | 3.33 |
| Non-family | 1,307 (21.9%) | 1.12 |
| Total Households | 5,966 (100.0%) | 3.06 |
Household Size by Marriage Status in Pinecrest
Out of a total of 5,966 households in Pinecrest, 4,659 (78.1%) are family households, while 1,307 (21.9%) are nonfamily households. The most numerous type of family households are 2-person households, comprising 1,661, and the most common type of nonfamily households are 1-person households, comprising 1,187.
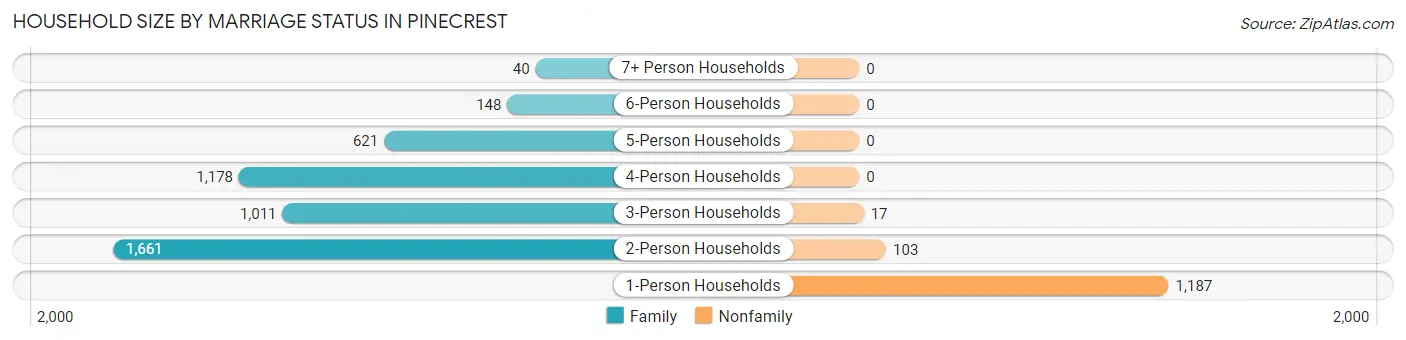
| Household Size | Family Households | Nonfamily Households |
| 1-Person Households | - | 1,187 (19.9%) |
| 2-Person Households | 1,661 (27.8%) | 103 (1.7%) |
| 3-Person Households | 1,011 (17.0%) | 17 (0.3%) |
| 4-Person Households | 1,178 (19.8%) | 0 (0.0%) |
| 5-Person Households | 621 (10.4%) | 0 (0.0%) |
| 6-Person Households | 148 (2.5%) | 0 (0.0%) |
| 7+ Person Households | 40 (0.7%) | 0 (0.0%) |
| Total | 4,659 (78.1%) | 1,307 (21.9%) |
Female Fertility in Pinecrest
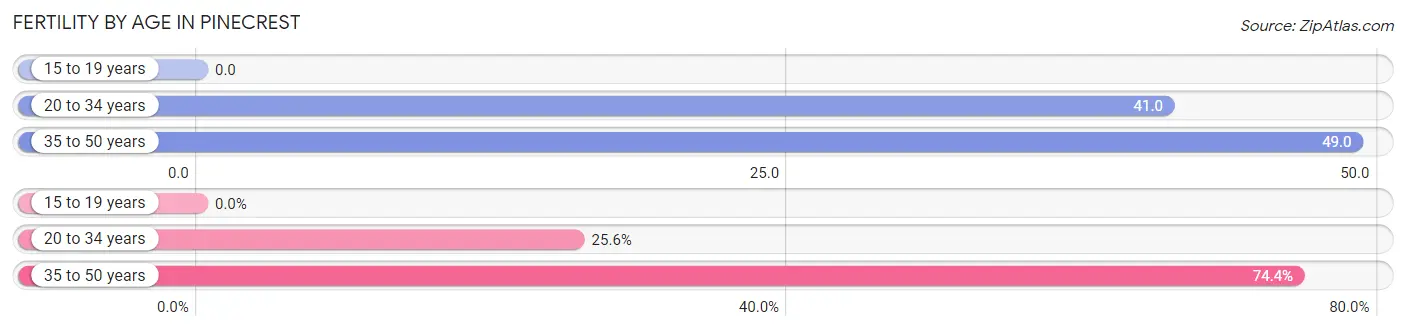
Fertility by Age in Pinecrest
Average fertility rate in Pinecrest is 39.0 births per 1,000 women. Women in the age bracket of 35 to 50 years have the highest fertility rate with 49.0 births per 1,000 women. Women in the age bracket of 35 to 50 years acount for 74.4% of all women with births.
| Age Bracket | Women with Births | Births / 1,000 Women |
| 15 to 19 years | 0 (0.0%) | 0.0 |
| 20 to 34 years | 34 (25.6%) | 41.0 |
| 35 to 50 years | 99 (74.4%) | 49.0 |
| Total | 133 (100.0%) | 39.0 |
Fertility by Age by Marriage Status in Pinecrest
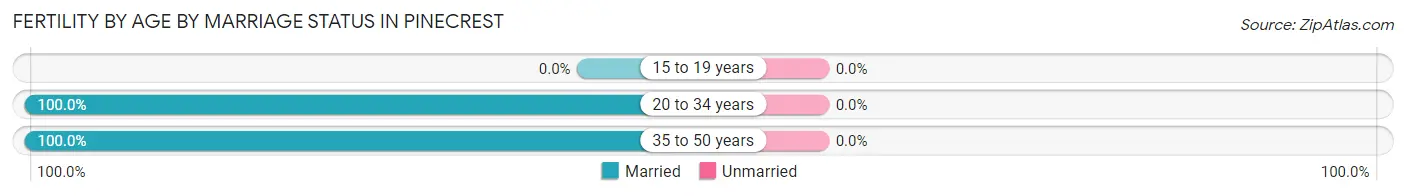
| Age Bracket | Married | Unmarried |
| 15 to 19 years | 0 (0.0%) | 0 (0.0%) |
| 20 to 34 years | 34 (100.0%) | 0 (0.0%) |
| 35 to 50 years | 99 (100.0%) | 0 (0.0%) |
| Total | 133 (100.0%) | 0 (0.0%) |
Fertility by Education in Pinecrest
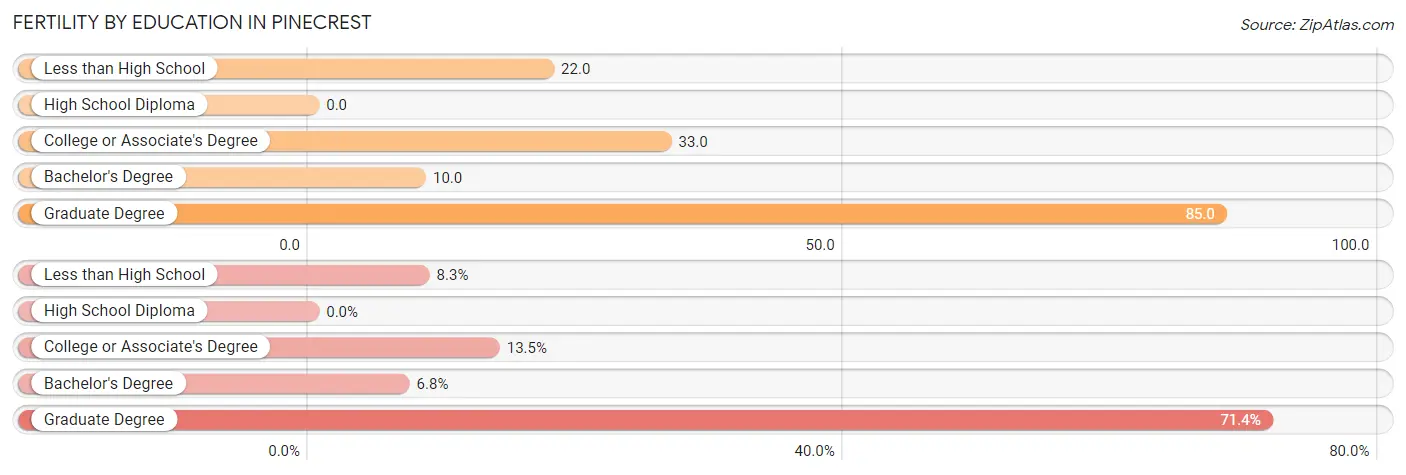
| Educational Attainment | Women with Births | Births / 1,000 Women |
| Less than High School | 11 (8.3%) | 22.0 |
| High School Diploma | 0 (0.0%) | 0.0 |
| College or Associate's Degree | 18 (13.5%) | 33.0 |
| Bachelor's Degree | 9 (6.8%) | 10.0 |
| Graduate Degree | 95 (71.4%) | 85.0 |
| Total | 133 (100.0%) | 39.0 |
Fertility by Education by Marriage Status in Pinecrest
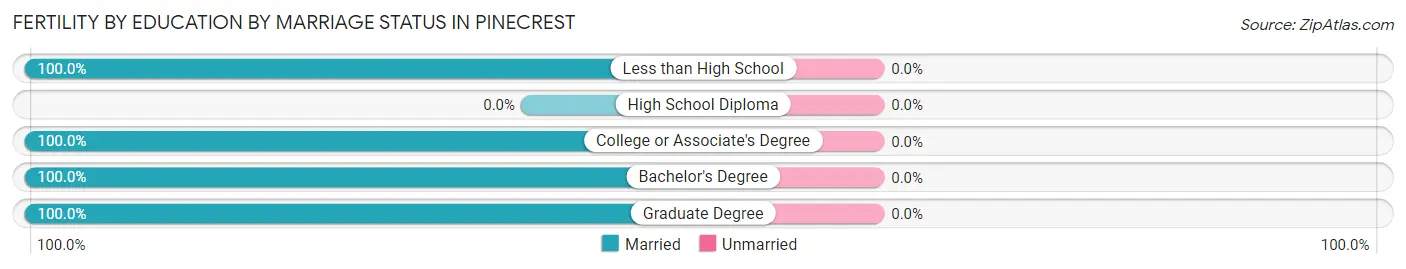
| Educational Attainment | Married | Unmarried |
| Less than High School | 11 (100.0%) | 0 (0.0%) |
| High School Diploma | 0 (0.0%) | 0 (0.0%) |
| College or Associate's Degree | 18 (100.0%) | 0 (0.0%) |
| Bachelor's Degree | 9 (100.0%) | 0 (0.0%) |
| Graduate Degree | 95 (100.0%) | 0 (0.0%) |
| Total | 133 (100.0%) | 0 (0.0%) |
Employment Characteristics in Pinecrest
Employment by Class of Employer in Pinecrest
Among the 7,907 employed individuals in Pinecrest, private company employees (4,392 | 55.5%), self-employed (incorporated) (1,597 | 20.2%), and self-employed (not incorporated) (654 | 8.3%) make up the most common classes of employment.
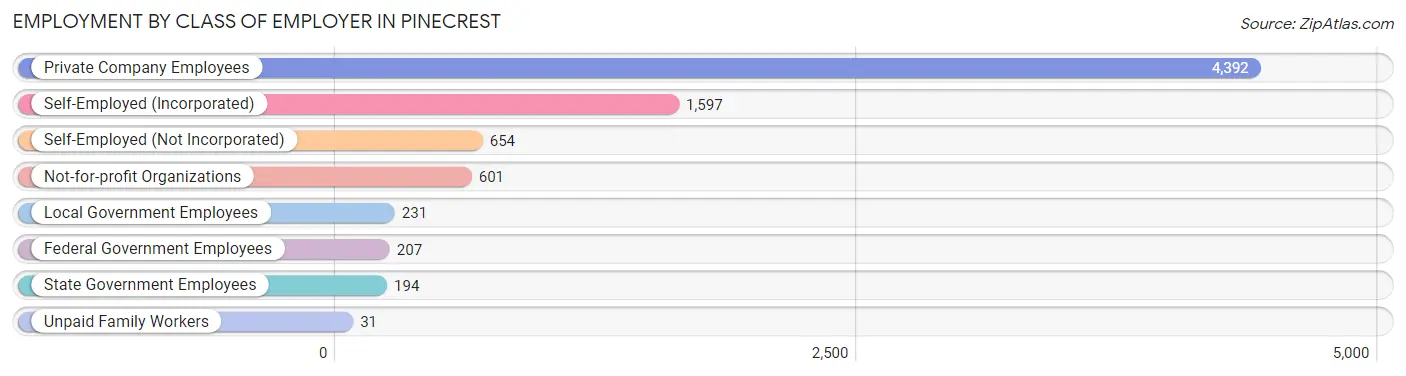
| Employer Class | # Employees | % Employees |
| Private Company Employees | 4,392 | 55.5% |
| Self-Employed (Incorporated) | 1,597 | 20.2% |
| Self-Employed (Not Incorporated) | 654 | 8.3% |
| Not-for-profit Organizations | 601 | 7.6% |
| Local Government Employees | 231 | 2.9% |
| State Government Employees | 194 | 2.5% |
| Federal Government Employees | 207 | 2.6% |
| Unpaid Family Workers | 31 | 0.4% |
| Total | 7,907 | 100.0% |
Employment Status by Age in Pinecrest
According to the labor force statistics for Pinecrest, out of the total population over 16 years of age (13,675), 61.9% or 8,465 individuals are in the labor force, with 4.9% or 415 of them unemployed. The age group with the highest labor force participation rate is 35 to 44 years, with 82.7% or 1,797 individuals in the labor force. Within the labor force, the 16 to 19 years age range has the highest percentage of unemployed individuals, with 23.4% or 26 of them being unemployed.
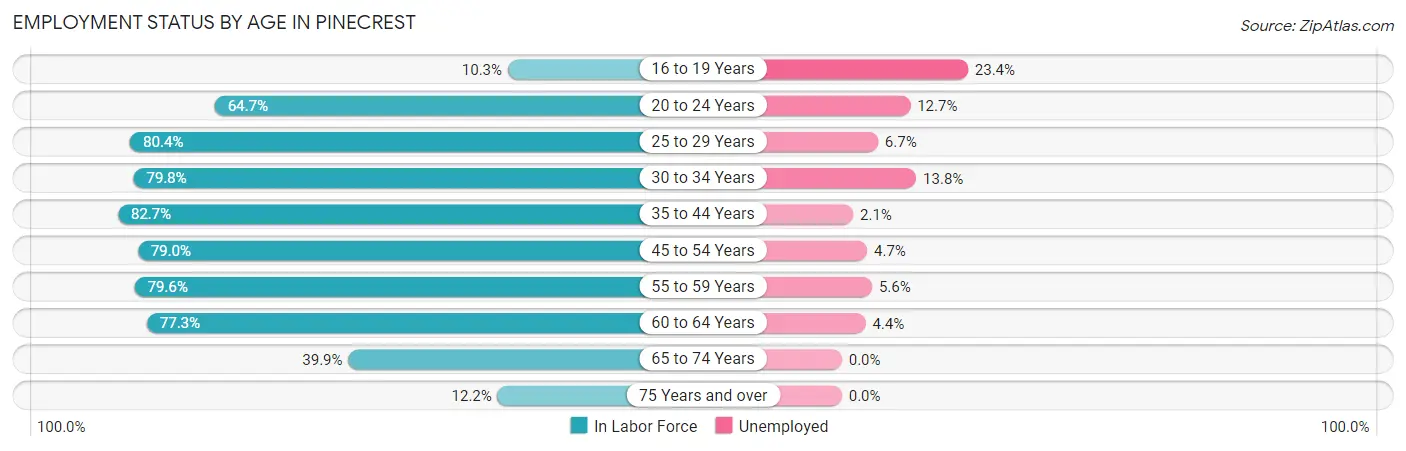
| Age Bracket | In Labor Force | Unemployed |
| 16 to 19 Years | 111 (10.3%) | 26 (23.4%) |
| 20 to 24 Years | 472 (64.7%) | 60 (12.7%) |
| 25 to 29 Years | 626 (80.4%) | 42 (6.7%) |
| 30 to 34 Years | 355 (79.8%) | 49 (13.8%) |
| 35 to 44 Years | 1,797 (82.7%) | 38 (2.1%) |
| 45 to 54 Years | 2,186 (79.0%) | 103 (4.7%) |
| 55 to 59 Years | 943 (79.6%) | 53 (5.6%) |
| 60 to 64 Years | 1,010 (77.3%) | 44 (4.4%) |
| 65 to 74 Years | 826 (39.9%) | 0 (0.0%) |
| 75 Years and over | 139 (12.2%) | 0 (0.0%) |
| Total | 8,465 (61.9%) | 415 (4.9%) |
Employment Status by Educational Attainment in Pinecrest
According to labor force statistics for Pinecrest, 79.9% of individuals (6,916) out of the total population between 25 and 64 years of age (8,656) are in the labor force, with 4.7% or 325 of them being unemployed. The group with the highest labor force participation rate are those with the educational attainment of bachelor's degree or higher, with 82.5% or 5,358 individuals in the labor force. Within the labor force, individuals with high school diploma education have the highest percentage of unemployment, with 12.0% or 48 of them being unemployed.
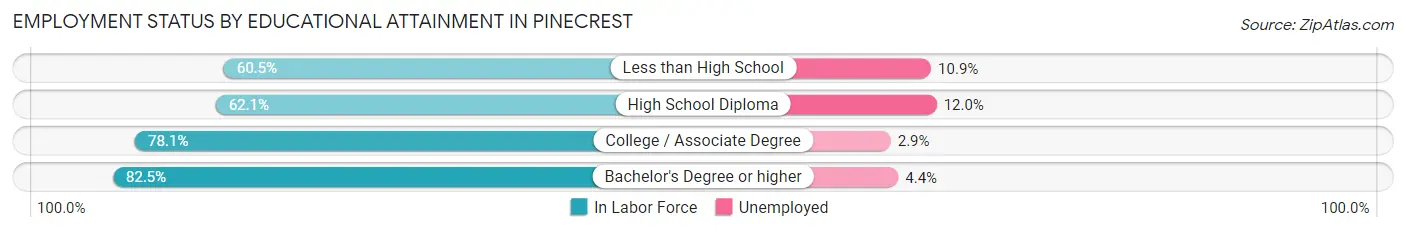
| Educational Attainment | In Labor Force | Unemployed |
| Less than High School | 92 (60.5%) | 17 (10.9%) |
| High School Diploma | 399 (62.1%) | 77 (12.0%) |
| College / Associate Degree | 1,067 (78.1%) | 40 (2.9%) |
| Bachelor's Degree or higher | 5,358 (82.5%) | 286 (4.4%) |
| Total | 6,916 (79.9%) | 407 (4.7%) |
Employment Occupations by Sex in Pinecrest
Management, Business, Science and Arts Occupations
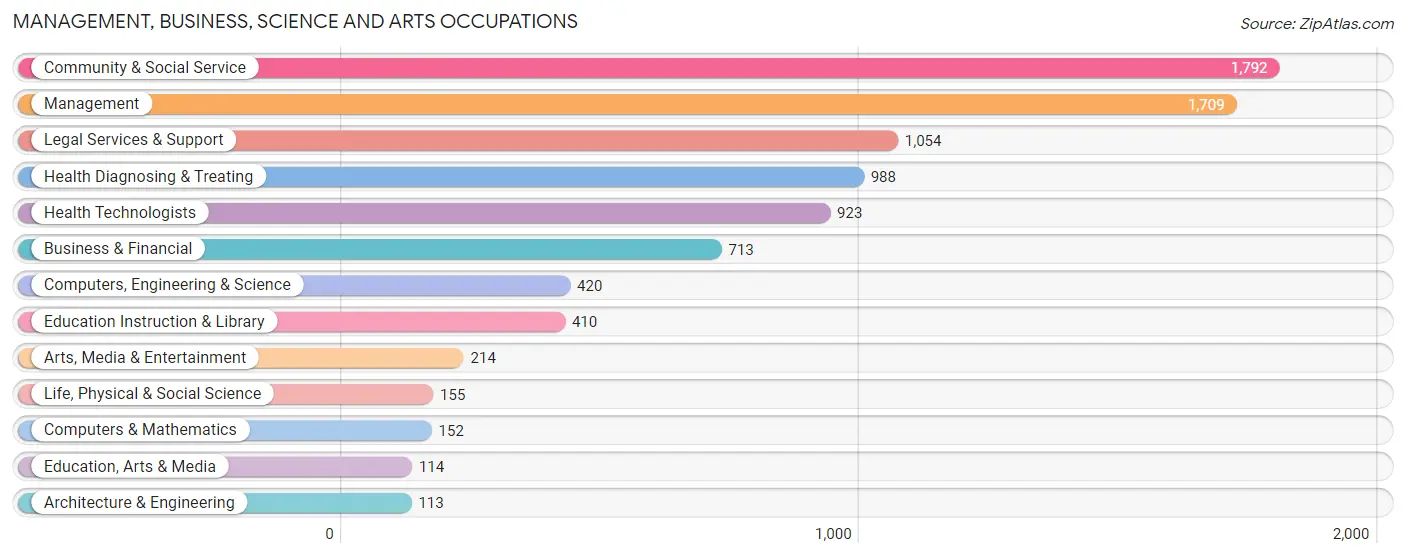
The most common Management, Business, Science and Arts occupations in Pinecrest are Community & Social Service (1,792 | 22.3%), Management (1,709 | 21.3%), Legal Services & Support (1,054 | 13.1%), Health Diagnosing & Treating (988 | 12.3%), and Health Technologists (923 | 11.5%).
Management, Business, Science and Arts Occupations by Sex
Within the Management, Business, Science and Arts occupations in Pinecrest, the most male-oriented occupations are Computers & Mathematics (82.2%), Management (75.0%), and Legal Services & Support (66.9%), while the most female-oriented occupations are Education, Arts & Media (100.0%), Life, Physical & Social Science (95.5%), and Education Instruction & Library (57.1%).
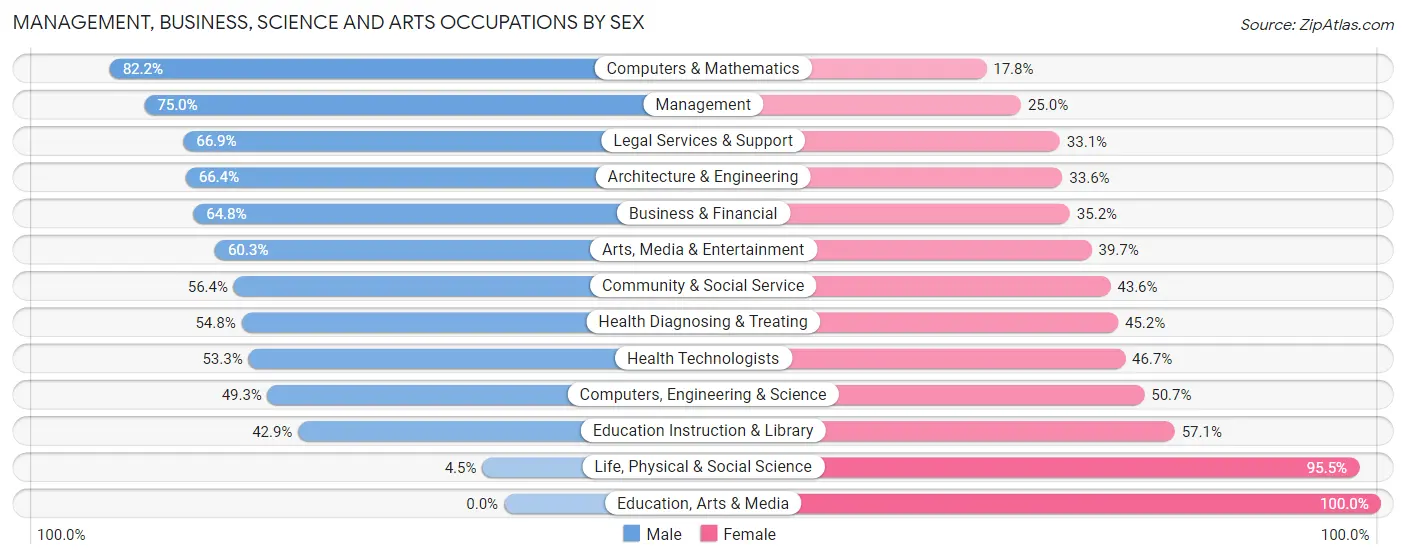
| Occupation | Male | Female |
| Management | 1,282 (75.0%) | 427 (25.0%) |
| Business & Financial | 462 (64.8%) | 251 (35.2%) |
| Computers, Engineering & Science | 207 (49.3%) | 213 (50.7%) |
| Computers & Mathematics | 125 (82.2%) | 27 (17.8%) |
| Architecture & Engineering | 75 (66.4%) | 38 (33.6%) |
| Life, Physical & Social Science | 7 (4.5%) | 148 (95.5%) |
| Community & Social Service | 1,010 (56.4%) | 782 (43.6%) |
| Education, Arts & Media | 0 (0.0%) | 114 (100.0%) |
| Legal Services & Support | 705 (66.9%) | 349 (33.1%) |
| Education Instruction & Library | 176 (42.9%) | 234 (57.1%) |
| Arts, Media & Entertainment | 129 (60.3%) | 85 (39.7%) |
| Health Diagnosing & Treating | 541 (54.8%) | 447 (45.2%) |
| Health Technologists | 492 (53.3%) | 431 (46.7%) |
| Total (Category) | 3,502 (62.3%) | 2,120 (37.7%) |
| Total (Overall) | 4,762 (59.3%) | 3,272 (40.7%) |
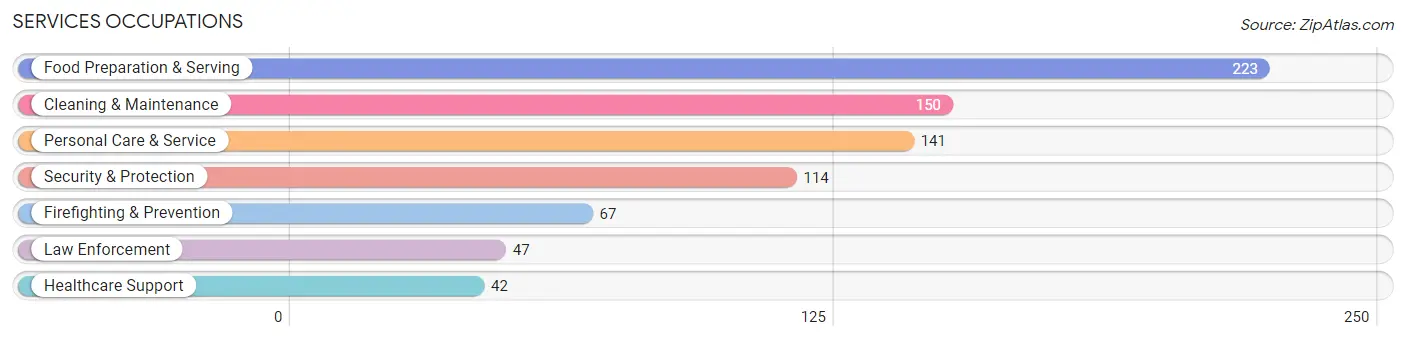
Services Occupations
The most common Services occupations in Pinecrest are Food Preparation & Serving (223 | 2.8%), Cleaning & Maintenance (150 | 1.9%), Personal Care & Service (141 | 1.8%), Security & Protection (114 | 1.4%), and Firefighting & Prevention (67 | 0.8%).
Services Occupations by Sex
Within the Services occupations in Pinecrest, the most male-oriented occupations are Firefighting & Prevention (100.0%), Security & Protection (78.9%), and Food Preparation & Serving (63.2%), while the most female-oriented occupations are Personal Care & Service (81.6%), Healthcare Support (69.1%), and Cleaning & Maintenance (59.3%).
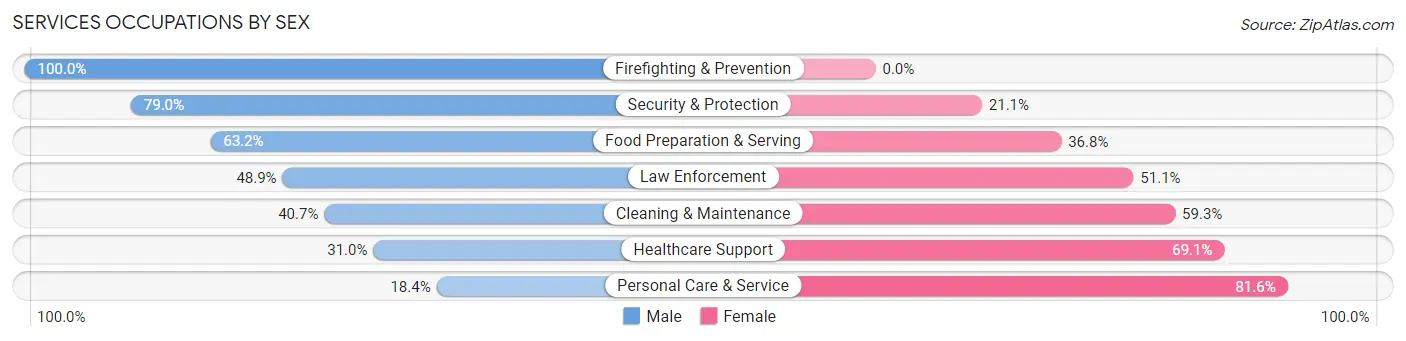
| Occupation | Male | Female |
| Healthcare Support | 13 (30.9%) | 29 (69.1%) |
| Security & Protection | 90 (78.9%) | 24 (21.0%) |
| Firefighting & Prevention | 67 (100.0%) | 0 (0.0%) |
| Law Enforcement | 23 (48.9%) | 24 (51.1%) |
| Food Preparation & Serving | 141 (63.2%) | 82 (36.8%) |
| Cleaning & Maintenance | 61 (40.7%) | 89 (59.3%) |
| Personal Care & Service | 26 (18.4%) | 115 (81.6%) |
| Total (Category) | 331 (49.4%) | 339 (50.6%) |
| Total (Overall) | 4,762 (59.3%) | 3,272 (40.7%) |
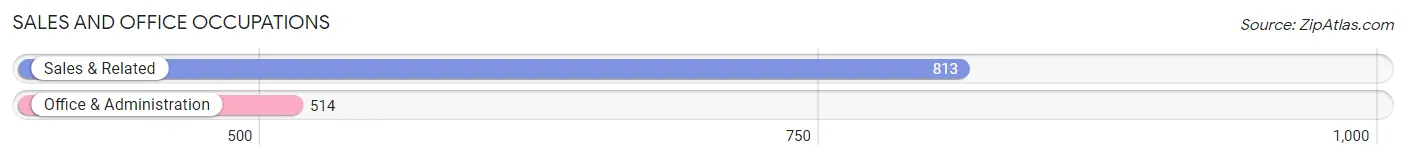
Sales and Office Occupations
The most common Sales and Office occupations in Pinecrest are Sales & Related (813 | 10.1%), and Office & Administration (514 | 6.4%).
Sales and Office Occupations by Sex
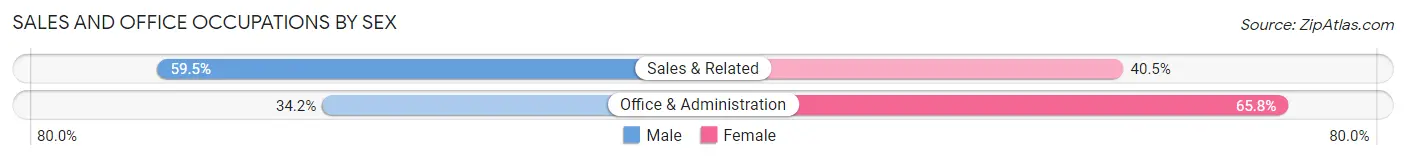
| Occupation | Male | Female |
| Sales & Related | 484 (59.5%) | 329 (40.5%) |
| Office & Administration | 176 (34.2%) | 338 (65.8%) |
| Total (Category) | 660 (49.7%) | 667 (50.3%) |
| Total (Overall) | 4,762 (59.3%) | 3,272 (40.7%) |
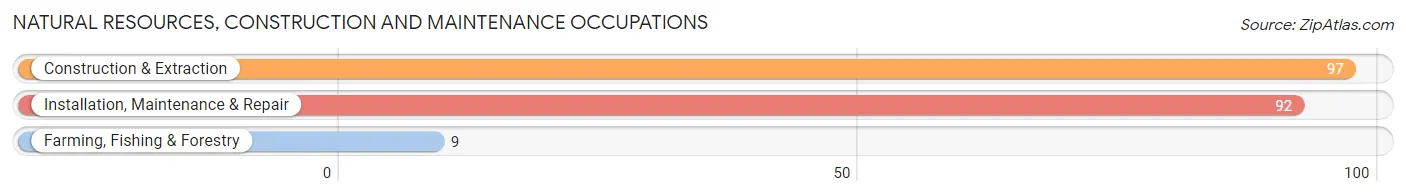
Natural Resources, Construction and Maintenance Occupations
The most common Natural Resources, Construction and Maintenance occupations in Pinecrest are Construction & Extraction (97 | 1.2%), Installation, Maintenance & Repair (92 | 1.1%), and Farming, Fishing & Forestry (9 | 0.1%).
Natural Resources, Construction and Maintenance Occupations by Sex
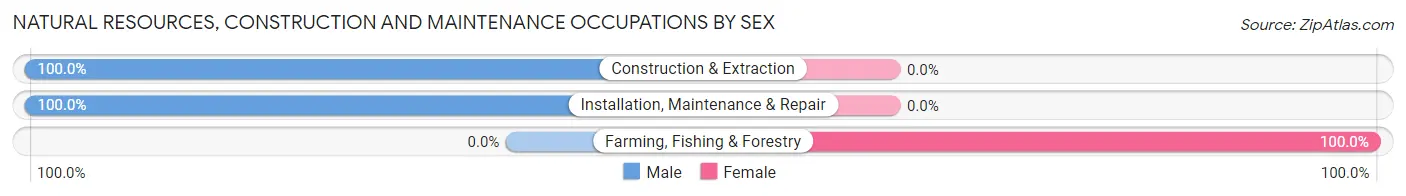
| Occupation | Male | Female |
| Farming, Fishing & Forestry | 0 (0.0%) | 9 (100.0%) |
| Construction & Extraction | 97 (100.0%) | 0 (0.0%) |
| Installation, Maintenance & Repair | 92 (100.0%) | 0 (0.0%) |
| Total (Category) | 189 (95.5%) | 9 (4.5%) |
| Total (Overall) | 4,762 (59.3%) | 3,272 (40.7%) |
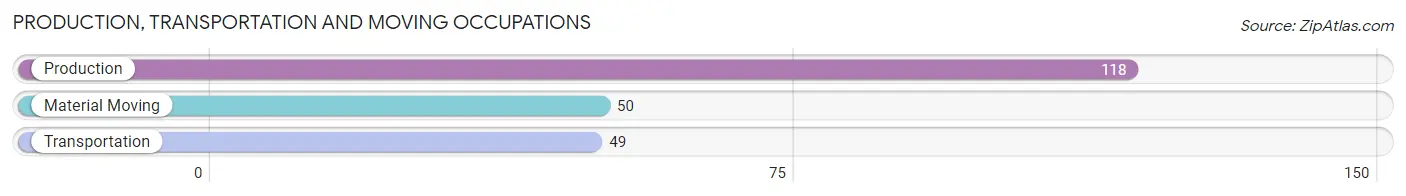
Production, Transportation and Moving Occupations
The most common Production, Transportation and Moving occupations in Pinecrest are Production (118 | 1.5%), Material Moving (50 | 0.6%), and Transportation (49 | 0.6%).
Production, Transportation and Moving Occupations by Sex
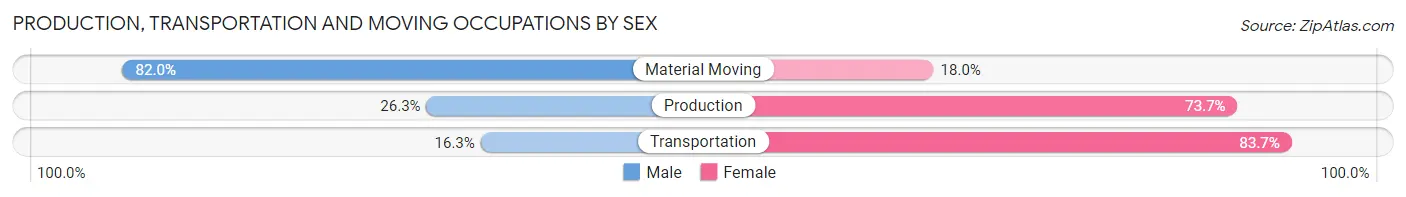
| Occupation | Male | Female |
| Production | 31 (26.3%) | 87 (73.7%) |
| Transportation | 8 (16.3%) | 41 (83.7%) |
| Material Moving | 41 (82.0%) | 9 (18.0%) |
| Total (Category) | 80 (36.9%) | 137 (63.1%) |
| Total (Overall) | 4,762 (59.3%) | 3,272 (40.7%) |
Employment Industries by Sex in Pinecrest
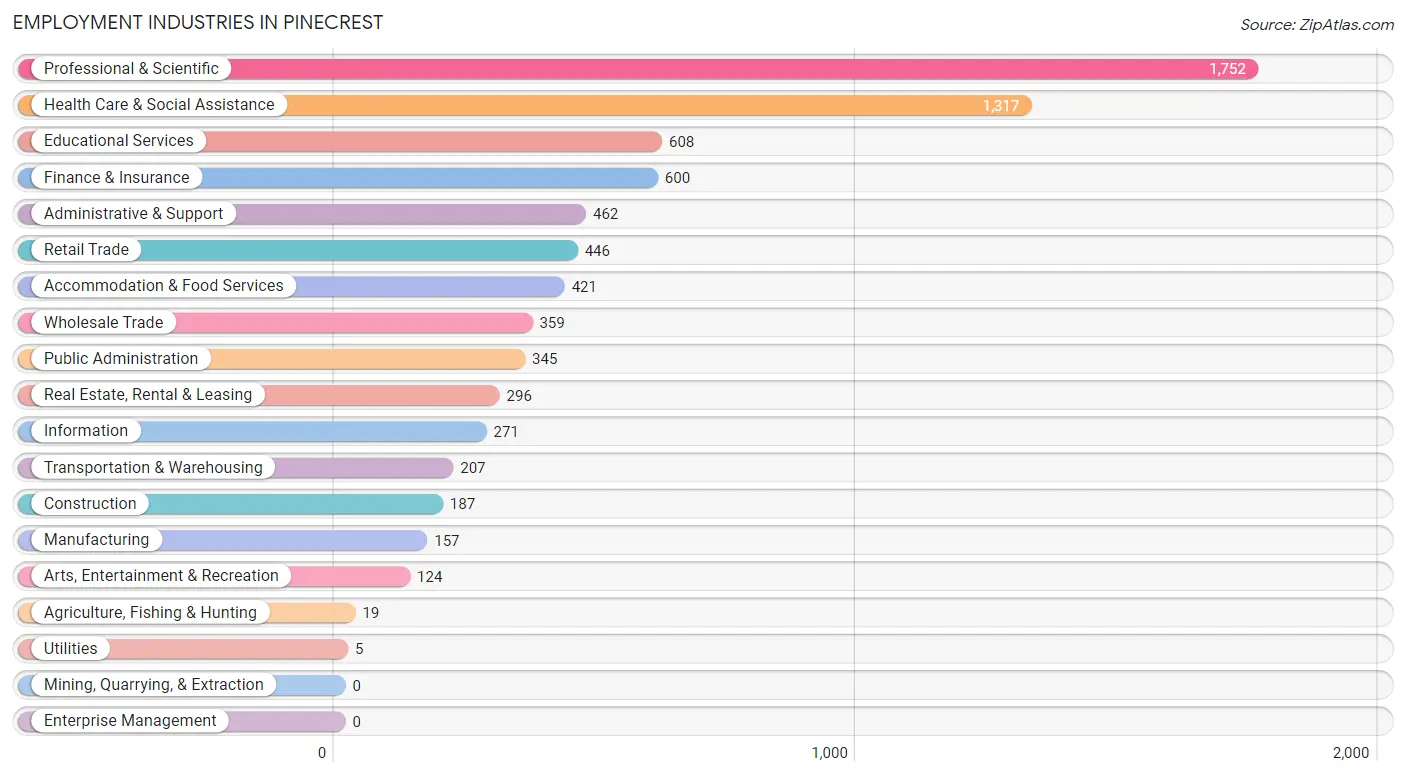
Employment Industries in Pinecrest
The major employment industries in Pinecrest include Professional & Scientific (1,752 | 21.8%), Health Care & Social Assistance (1,317 | 16.4%), Educational Services (608 | 7.6%), Finance & Insurance (600 | 7.5%), and Administrative & Support (462 | 5.8%).
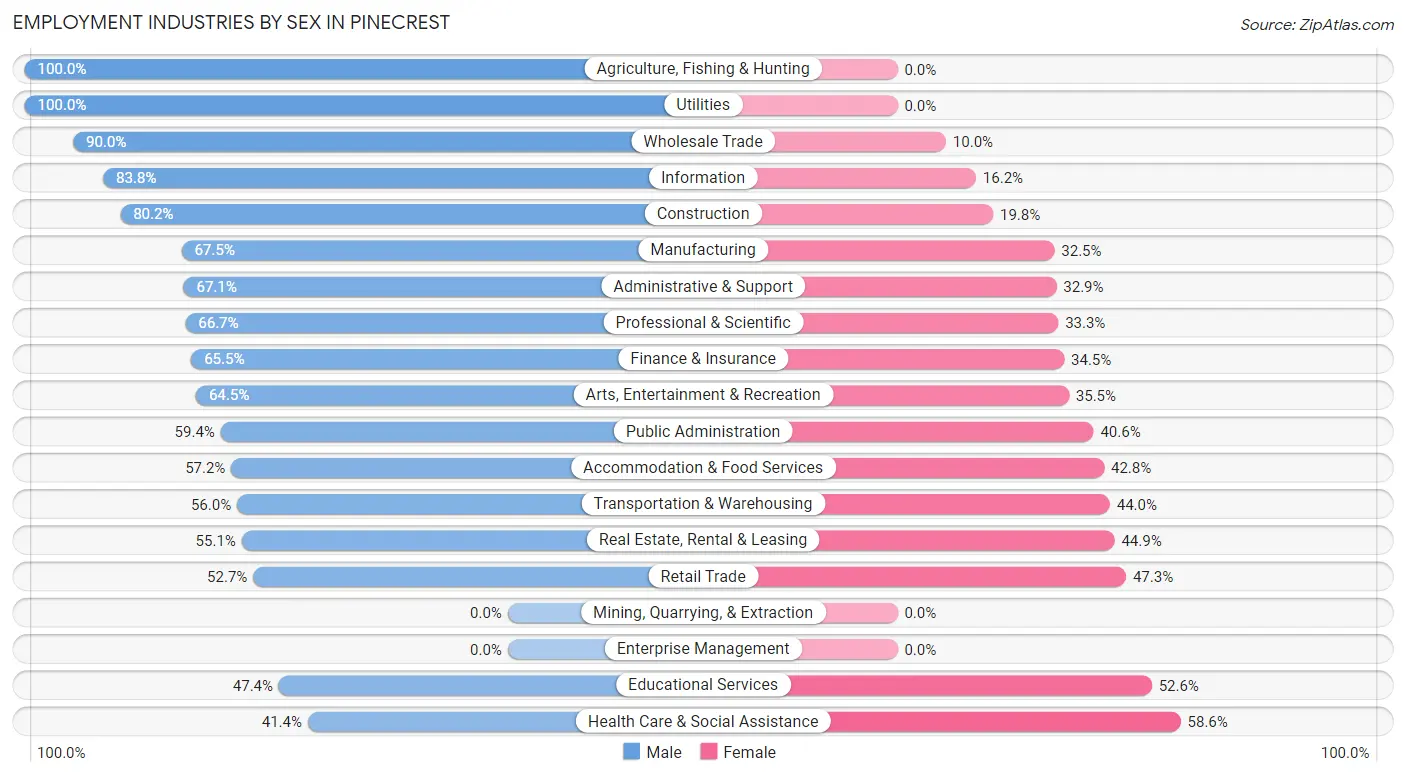
Employment Industries by Sex in Pinecrest
The Pinecrest industries that see more men than women are Agriculture, Fishing & Hunting (100.0%), Utilities (100.0%), and Wholesale Trade (90.0%), whereas the industries that tend to have a higher number of women are Health Care & Social Assistance (58.6%), Educational Services (52.6%), and Retail Trade (47.3%).
| Industry | Male | Female |
| Agriculture, Fishing & Hunting | 19 (100.0%) | 0 (0.0%) |
| Mining, Quarrying, & Extraction | 0 (0.0%) | 0 (0.0%) |
| Construction | 150 (80.2%) | 37 (19.8%) |
| Manufacturing | 106 (67.5%) | 51 (32.5%) |
| Wholesale Trade | 323 (90.0%) | 36 (10.0%) |
| Retail Trade | 235 (52.7%) | 211 (47.3%) |
| Transportation & Warehousing | 116 (56.0%) | 91 (44.0%) |
| Utilities | 5 (100.0%) | 0 (0.0%) |
| Information | 227 (83.8%) | 44 (16.2%) |
| Finance & Insurance | 393 (65.5%) | 207 (34.5%) |
| Real Estate, Rental & Leasing | 163 (55.1%) | 133 (44.9%) |
| Professional & Scientific | 1,169 (66.7%) | 583 (33.3%) |
| Enterprise Management | 0 (0.0%) | 0 (0.0%) |
| Administrative & Support | 310 (67.1%) | 152 (32.9%) |
| Educational Services | 288 (47.4%) | 320 (52.6%) |
| Health Care & Social Assistance | 545 (41.4%) | 772 (58.6%) |
| Arts, Entertainment & Recreation | 80 (64.5%) | 44 (35.5%) |
| Accommodation & Food Services | 241 (57.2%) | 180 (42.8%) |
| Public Administration | 205 (59.4%) | 140 (40.6%) |
| Total | 4,762 (59.3%) | 3,272 (40.7%) |
Education in Pinecrest
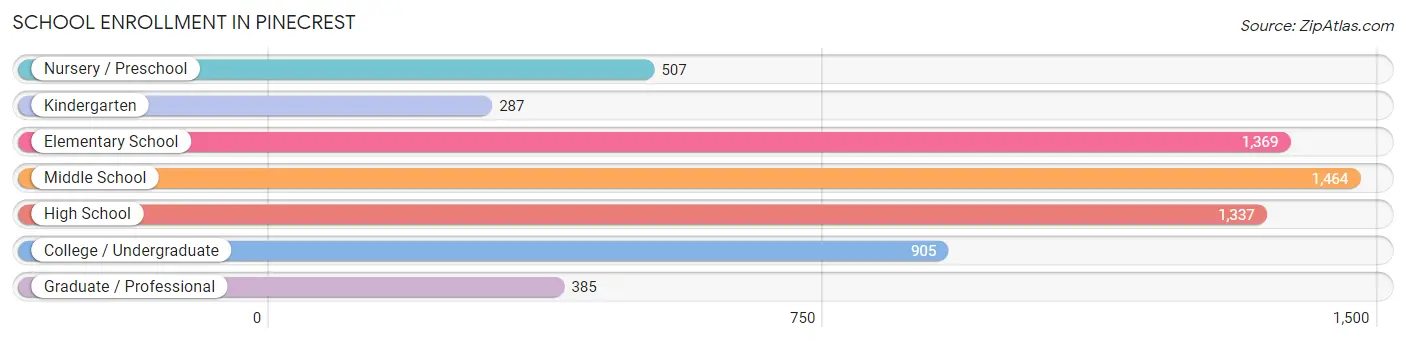
School Enrollment in Pinecrest
The most common levels of schooling among the 6,254 students in Pinecrest are middle school (1,464 | 23.4%), elementary school (1,369 | 21.9%), and high school (1,337 | 21.4%).
| School Level | # Students | % Students |
| Nursery / Preschool | 507 | 8.1% |
| Kindergarten | 287 | 4.6% |
| Elementary School | 1,369 | 21.9% |
| Middle School | 1,464 | 23.4% |
| High School | 1,337 | 21.4% |
| College / Undergraduate | 905 | 14.5% |
| Graduate / Professional | 385 | 6.2% |
| Total | 6,254 | 100.0% |
School Enrollment by Age by Funding Source in Pinecrest
Out of a total of 6,254 students who are enrolled in schools in Pinecrest, 2,683 (42.9%) attend a private institution, while the remaining 3,571 (57.1%) are enrolled in public schools. The age group of 3 to 4 year olds has the highest likelihood of being enrolled in private schools, with 398 (81.6% in the age bracket) enrolled. Conversely, the age group of 35 years and over has the lowest likelihood of being enrolled in a private school, with 247 (68.8% in the age bracket) attending a public institution.
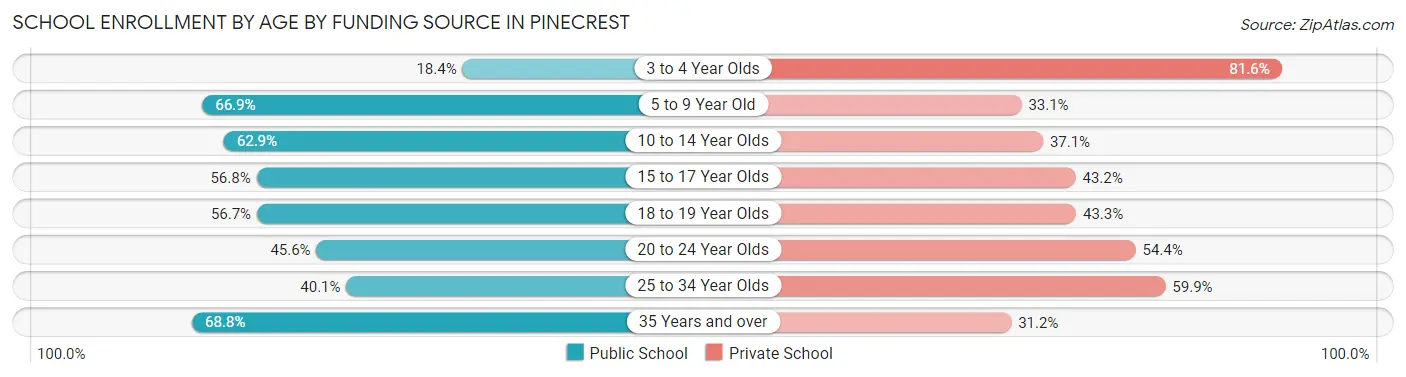
| Age Bracket | Public School | Private School |
| 3 to 4 Year Olds | 90 (18.4%) | 398 (81.6%) |
| 5 to 9 Year Old | 988 (66.9%) | 489 (33.1%) |
| 10 to 14 Year Olds | 1,147 (62.9%) | 677 (37.1%) |
| 15 to 17 Year Olds | 542 (56.8%) | 412 (43.2%) |
| 18 to 19 Year Olds | 249 (56.7%) | 190 (43.3%) |
| 20 to 24 Year Olds | 199 (45.6%) | 237 (54.4%) |
| 25 to 34 Year Olds | 111 (40.1%) | 166 (59.9%) |
| 35 Years and over | 247 (68.8%) | 112 (31.2%) |
| Total | 3,571 (57.1%) | 2,683 (42.9%) |
Educational Attainment by Field of Study in Pinecrest
Business (2,191 | 24.2%), social sciences (859 | 9.5%), science & technology (850 | 9.4%), education (713 | 7.9%), and engineering (687 | 7.6%) are the most common fields of study among 9,040 individuals in Pinecrest who have obtained a bachelor's degree or higher.
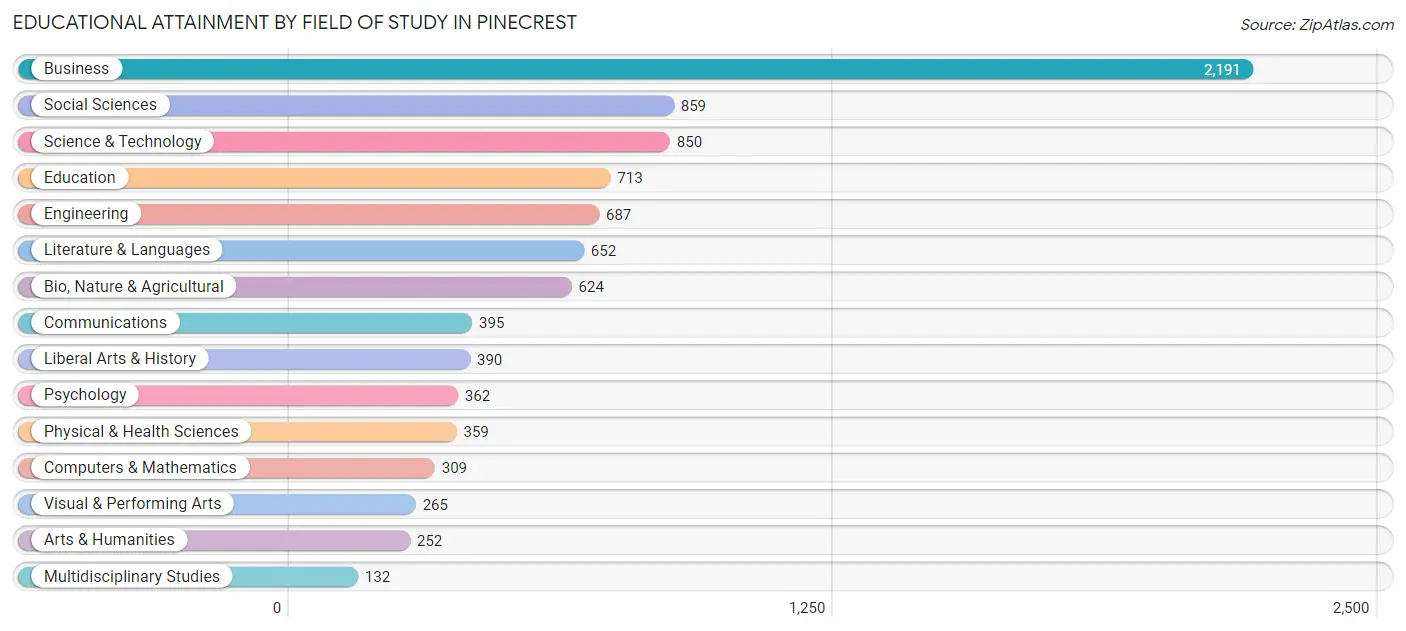
| Field of Study | # Graduates | % Graduates |
| Computers & Mathematics | 309 | 3.4% |
| Bio, Nature & Agricultural | 624 | 6.9% |
| Physical & Health Sciences | 359 | 4.0% |
| Psychology | 362 | 4.0% |
| Social Sciences | 859 | 9.5% |
| Engineering | 687 | 7.6% |
| Multidisciplinary Studies | 132 | 1.5% |
| Science & Technology | 850 | 9.4% |
| Business | 2,191 | 24.2% |
| Education | 713 | 7.9% |
| Literature & Languages | 652 | 7.2% |
| Liberal Arts & History | 390 | 4.3% |
| Visual & Performing Arts | 265 | 2.9% |
| Communications | 395 | 4.4% |
| Arts & Humanities | 252 | 2.8% |
| Total | 9,040 | 100.0% |
Transportation & Commute in Pinecrest
Vehicle Availability by Sex in Pinecrest
The most prevalent vehicle ownership categories in Pinecrest are males with 2 vehicles (1,953, accounting for 41.1%) and females with 2 vehicles (1,358, making up 61.8%).
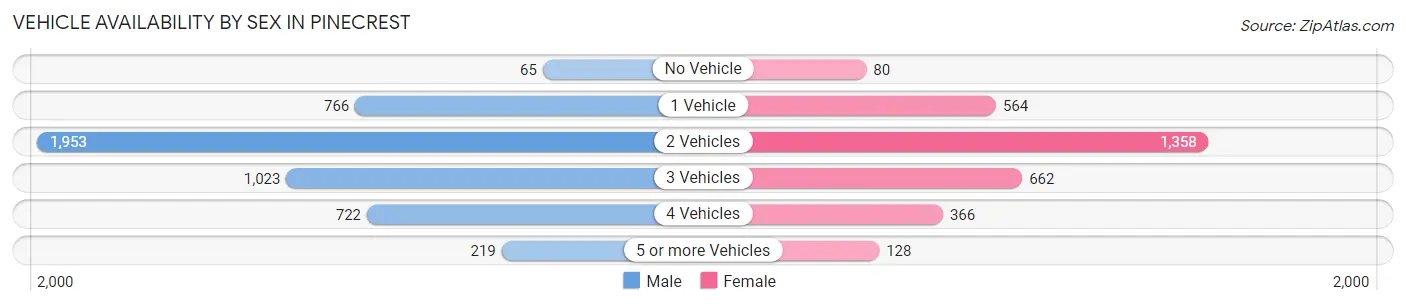
| Vehicles Available | Male | Female |
| No Vehicle | 65 (1.4%) | 80 (2.5%) |
| 1 Vehicle | 766 (16.1%) | 564 (17.9%) |
| 2 Vehicles | 1,953 (41.1%) | 1,358 (43.0%) |
| 3 Vehicles | 1,023 (21.5%) | 662 (21.0%) |
| 4 Vehicles | 722 (15.2%) | 366 (11.6%) |
| 5 or more Vehicles | 219 (4.6%) | 128 (4.1%) |
| Total | 4,748 (100.0%) | 3,158 (100.0%) |
Commute Time in Pinecrest
The most frequently occuring commute durations in Pinecrest are 20 to 24 minutes (1,123 commuters, 18.9%), 30 to 34 minutes (961 commuters, 16.1%), and 45 to 59 minutes (938 commuters, 15.8%).
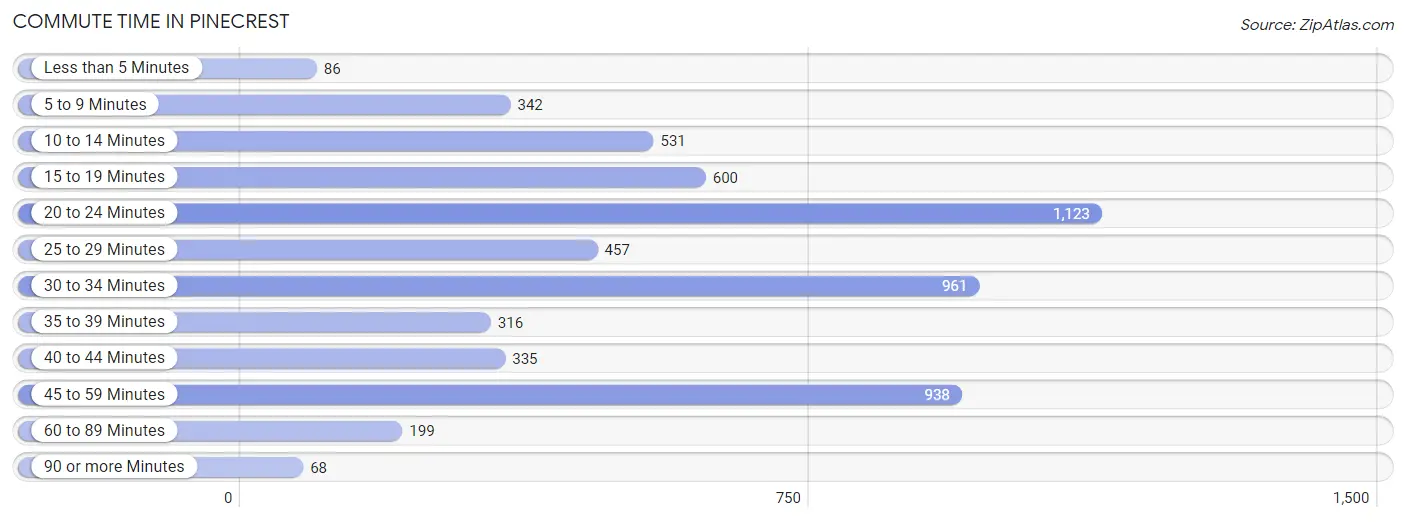
| Commute Time | # Commuters | % Commuters |
| Less than 5 Minutes | 86 | 1.4% |
| 5 to 9 Minutes | 342 | 5.7% |
| 10 to 14 Minutes | 531 | 8.9% |
| 15 to 19 Minutes | 600 | 10.1% |
| 20 to 24 Minutes | 1,123 | 18.9% |
| 25 to 29 Minutes | 457 | 7.7% |
| 30 to 34 Minutes | 961 | 16.1% |
| 35 to 39 Minutes | 316 | 5.3% |
| 40 to 44 Minutes | 335 | 5.6% |
| 45 to 59 Minutes | 938 | 15.8% |
| 60 to 89 Minutes | 199 | 3.3% |
| 90 or more Minutes | 68 | 1.1% |
Commute Time by Sex in Pinecrest
The most common commute times in Pinecrest are 20 to 24 minutes (705 commuters, 18.7%) for males and 20 to 24 minutes (418 commuters, 19.1%) for females.
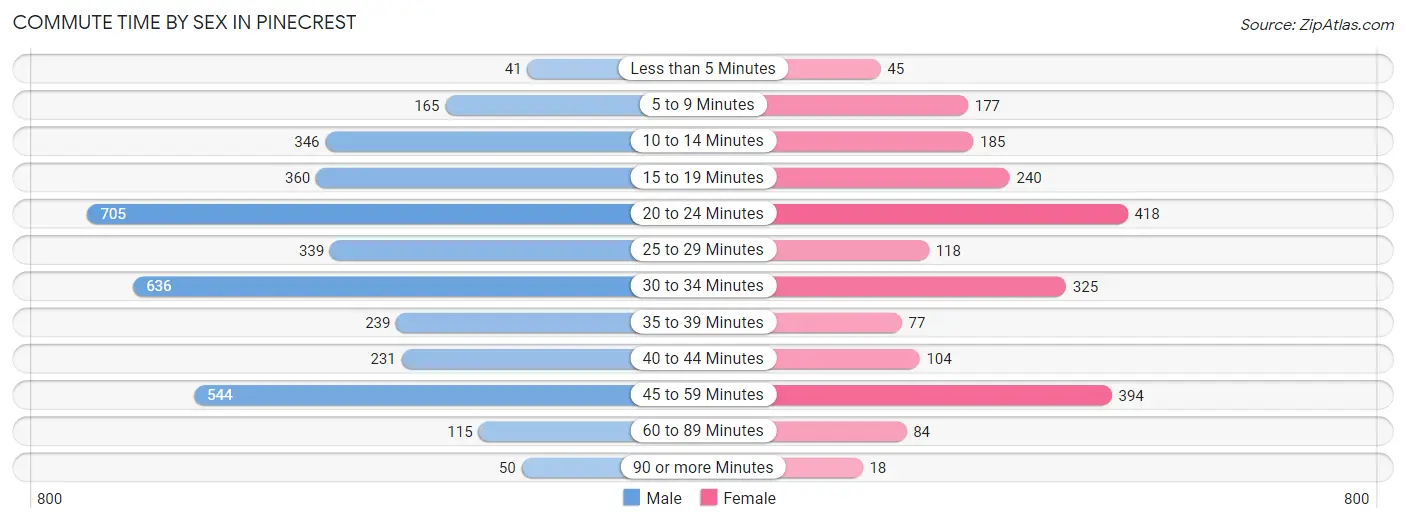
| Commute Time | Male | Female |
| Less than 5 Minutes | 41 (1.1%) | 45 (2.1%) |
| 5 to 9 Minutes | 165 (4.4%) | 177 (8.1%) |
| 10 to 14 Minutes | 346 (9.2%) | 185 (8.5%) |
| 15 to 19 Minutes | 360 (9.6%) | 240 (11.0%) |
| 20 to 24 Minutes | 705 (18.7%) | 418 (19.1%) |
| 25 to 29 Minutes | 339 (9.0%) | 118 (5.4%) |
| 30 to 34 Minutes | 636 (16.9%) | 325 (14.9%) |
| 35 to 39 Minutes | 239 (6.3%) | 77 (3.5%) |
| 40 to 44 Minutes | 231 (6.1%) | 104 (4.8%) |
| 45 to 59 Minutes | 544 (14.4%) | 394 (18.0%) |
| 60 to 89 Minutes | 115 (3.0%) | 84 (3.8%) |
| 90 or more Minutes | 50 (1.3%) | 18 (0.8%) |
Time of Departure to Work by Sex in Pinecrest
The most frequent times of departure to work in Pinecrest are 8:00 AM to 8:29 AM (875, 23.2%) for males and 9:00 AM to 9:59 AM (341, 15.6%) for females.
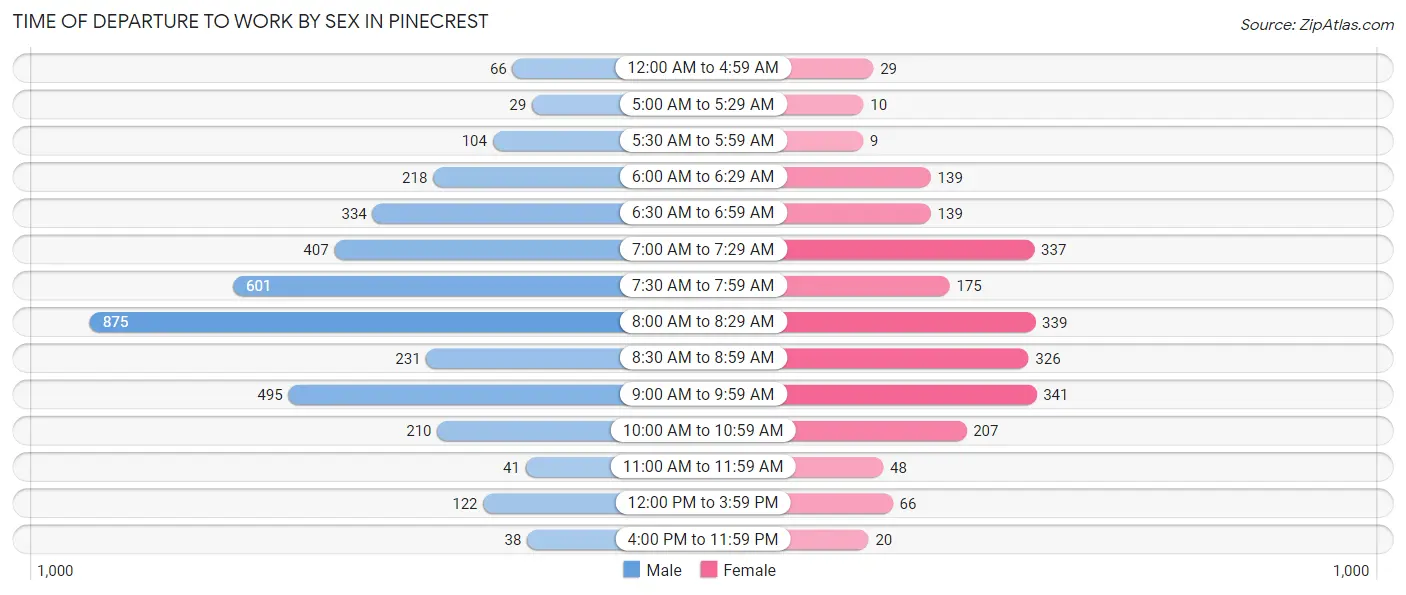
| Time of Departure | Male | Female |
| 12:00 AM to 4:59 AM | 66 (1.8%) | 29 (1.3%) |
| 5:00 AM to 5:29 AM | 29 (0.8%) | 10 (0.5%) |
| 5:30 AM to 5:59 AM | 104 (2.8%) | 9 (0.4%) |
| 6:00 AM to 6:29 AM | 218 (5.8%) | 139 (6.4%) |
| 6:30 AM to 6:59 AM | 334 (8.9%) | 139 (6.4%) |
| 7:00 AM to 7:29 AM | 407 (10.8%) | 337 (15.4%) |
| 7:30 AM to 7:59 AM | 601 (15.9%) | 175 (8.0%) |
| 8:00 AM to 8:29 AM | 875 (23.2%) | 339 (15.5%) |
| 8:30 AM to 8:59 AM | 231 (6.1%) | 326 (14.9%) |
| 9:00 AM to 9:59 AM | 495 (13.1%) | 341 (15.6%) |
| 10:00 AM to 10:59 AM | 210 (5.6%) | 207 (9.5%) |
| 11:00 AM to 11:59 AM | 41 (1.1%) | 48 (2.2%) |
| 12:00 PM to 3:59 PM | 122 (3.2%) | 66 (3.0%) |
| 4:00 PM to 11:59 PM | 38 (1.0%) | 20 (0.9%) |
| Total | 3,771 (100.0%) | 2,185 (100.0%) |
Housing Occupancy in Pinecrest
Occupancy by Ownership in Pinecrest
Of the total 5,966 dwellings in Pinecrest, owner-occupied units account for 4,921 (82.5%), while renter-occupied units make up 1,045 (17.5%).
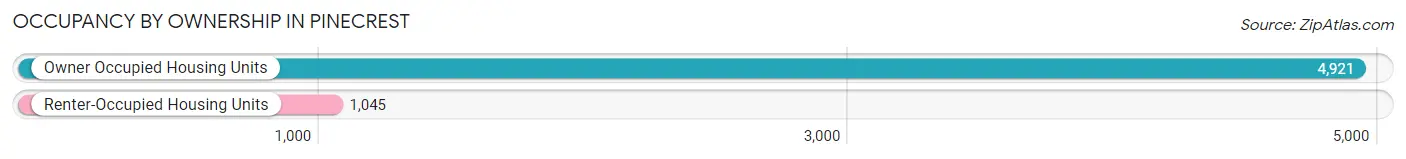
| Occupancy | # Housing Units | % Housing Units |
| Owner Occupied Housing Units | 4,921 | 82.5% |
| Renter-Occupied Housing Units | 1,045 | 17.5% |
| Total Occupied Housing Units | 5,966 | 100.0% |
Occupancy by Household Size in Pinecrest
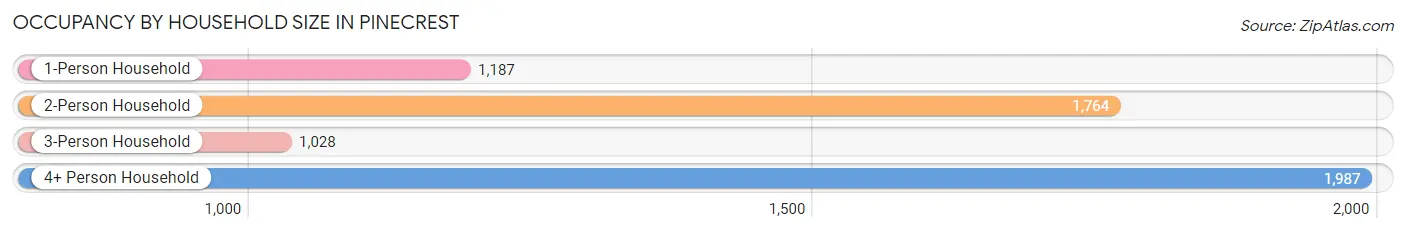
| Household Size | # Housing Units | % Housing Units |
| 1-Person Household | 1,187 | 19.9% |
| 2-Person Household | 1,764 | 29.6% |
| 3-Person Household | 1,028 | 17.2% |
| 4+ Person Household | 1,987 | 33.3% |
| Total Housing Units | 5,966 | 100.0% |
Occupancy by Ownership by Household Size in Pinecrest
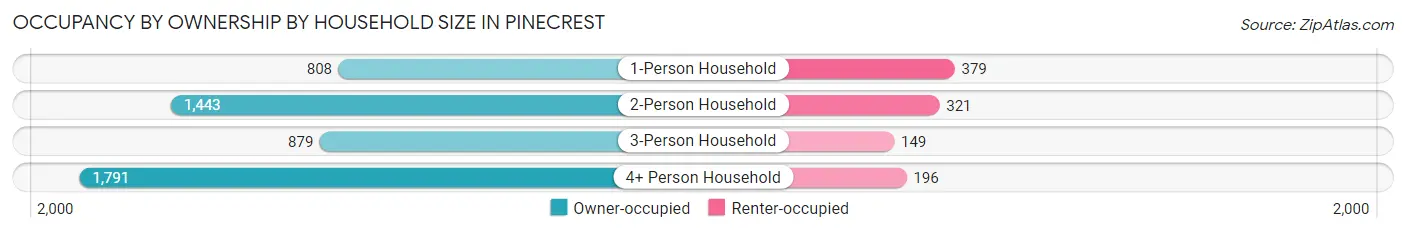
| Household Size | Owner-occupied | Renter-occupied |
| 1-Person Household | 808 (68.1%) | 379 (31.9%) |
| 2-Person Household | 1,443 (81.8%) | 321 (18.2%) |
| 3-Person Household | 879 (85.5%) | 149 (14.5%) |
| 4+ Person Household | 1,791 (90.1%) | 196 (9.9%) |
| Total Housing Units | 4,921 (82.5%) | 1,045 (17.5%) |
Occupancy by Educational Attainment in Pinecrest
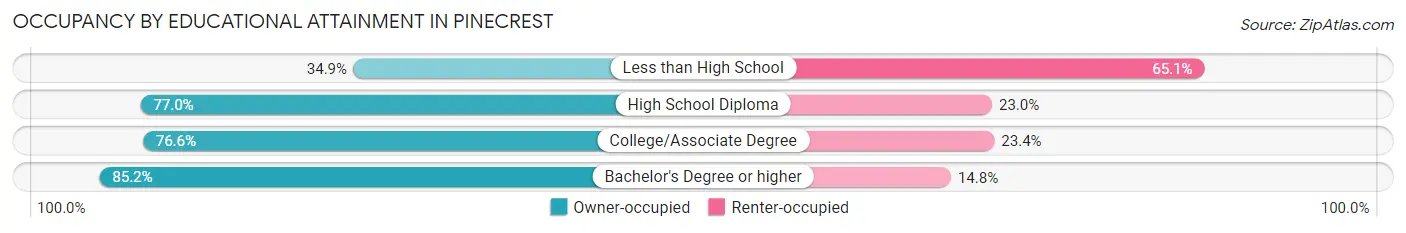
| Household Size | Owner-occupied | Renter-occupied |
| Less than High School | 22 (34.9%) | 41 (65.1%) |
| High School Diploma | 342 (77.0%) | 102 (23.0%) |
| College/Associate Degree | 823 (76.6%) | 252 (23.4%) |
| Bachelor's Degree or higher | 3,734 (85.2%) | 650 (14.8%) |
Occupancy by Age of Householder in Pinecrest
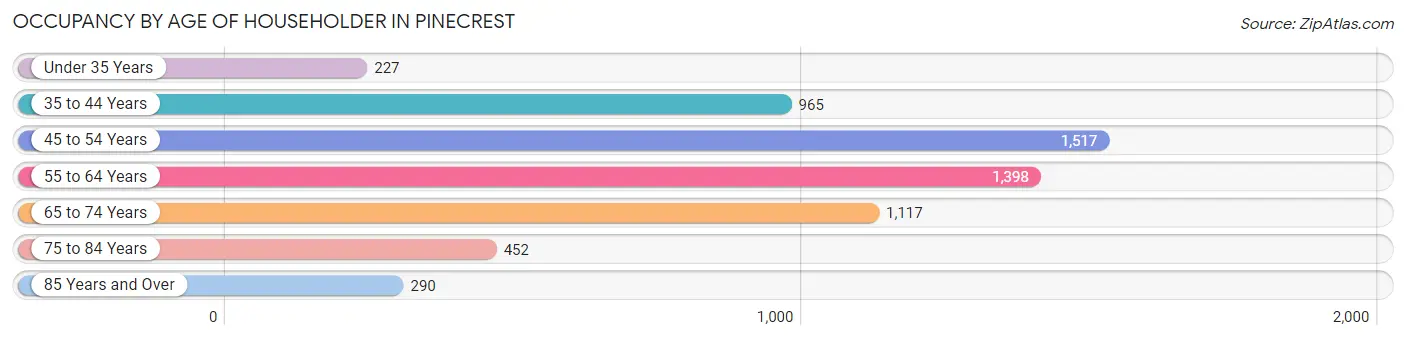
| Age Bracket | # Households | % Households |
| Under 35 Years | 227 | 3.8% |
| 35 to 44 Years | 965 | 16.2% |
| 45 to 54 Years | 1,517 | 25.4% |
| 55 to 64 Years | 1,398 | 23.4% |
| 65 to 74 Years | 1,117 | 18.7% |
| 75 to 84 Years | 452 | 7.6% |
| 85 Years and Over | 290 | 4.9% |
| Total | 5,966 | 100.0% |
Housing Finances in Pinecrest
Median Income by Occupancy in Pinecrest
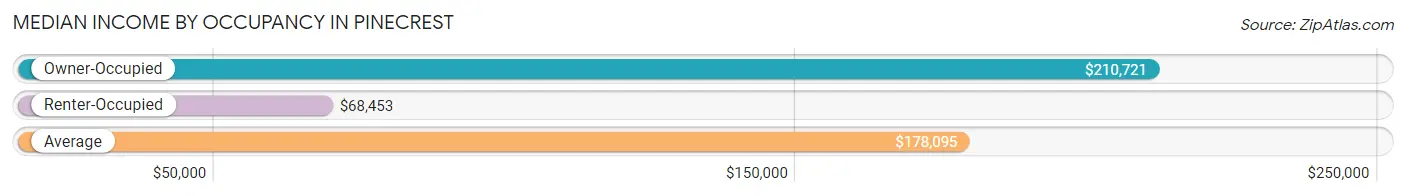
| Occupancy Type | # Households | Median Income |
| Owner-Occupied | 4,921 (82.5%) | $210,721 |
| Renter-Occupied | 1,045 (17.5%) | $68,453 |
| Average | 5,966 (100.0%) | $178,095 |
Occupancy by Householder Income Bracket in Pinecrest
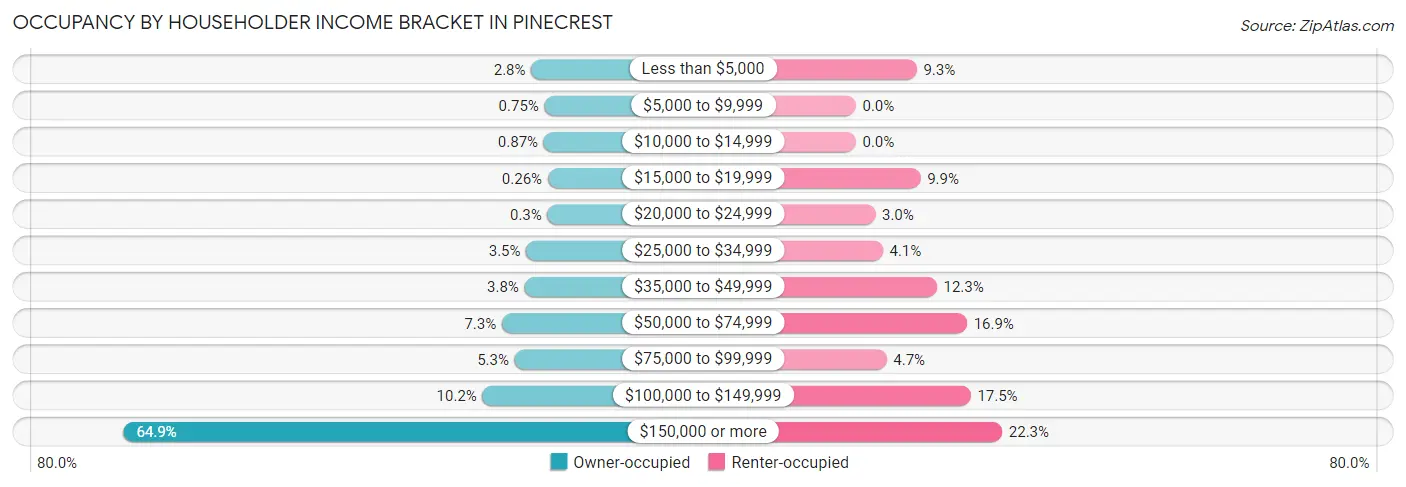
| Income Bracket | Owner-occupied | Renter-occupied |
| Less than $5,000 | 137 (2.8%) | 97 (9.3%) |
| $5,000 to $9,999 | 37 (0.7%) | 0 (0.0%) |
| $10,000 to $14,999 | 43 (0.9%) | 0 (0.0%) |
| $15,000 to $19,999 | 13 (0.3%) | 103 (9.9%) |
| $20,000 to $24,999 | 15 (0.3%) | 31 (3.0%) |
| $25,000 to $34,999 | 174 (3.5%) | 43 (4.1%) |
| $35,000 to $49,999 | 187 (3.8%) | 129 (12.3%) |
| $50,000 to $74,999 | 357 (7.2%) | 177 (16.9%) |
| $75,000 to $99,999 | 261 (5.3%) | 49 (4.7%) |
| $100,000 to $149,999 | 502 (10.2%) | 183 (17.5%) |
| $150,000 or more | 3,195 (64.9%) | 233 (22.3%) |
| Total | 4,921 (100.0%) | 1,045 (100.0%) |
Monthly Housing Cost Tiers in Pinecrest
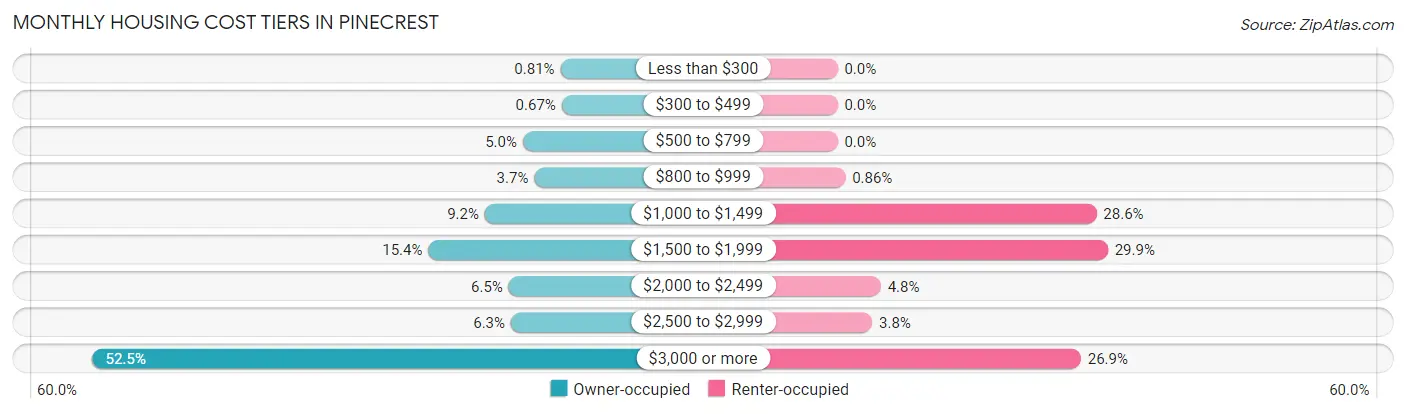
| Monthly Cost | Owner-occupied | Renter-occupied |
| Less than $300 | 40 (0.8%) | 0 (0.0%) |
| $300 to $499 | 33 (0.7%) | 0 (0.0%) |
| $500 to $799 | 244 (5.0%) | 0 (0.0%) |
| $800 to $999 | 182 (3.7%) | 9 (0.9%) |
| $1,000 to $1,499 | 451 (9.2%) | 299 (28.6%) |
| $1,500 to $1,999 | 758 (15.4%) | 312 (29.9%) |
| $2,000 to $2,499 | 321 (6.5%) | 50 (4.8%) |
| $2,500 to $2,999 | 309 (6.3%) | 40 (3.8%) |
| $3,000 or more | 2,583 (52.5%) | 281 (26.9%) |
| Total | 4,921 (100.0%) | 1,045 (100.0%) |
Physical Housing Characteristics in Pinecrest
Housing Structures in Pinecrest
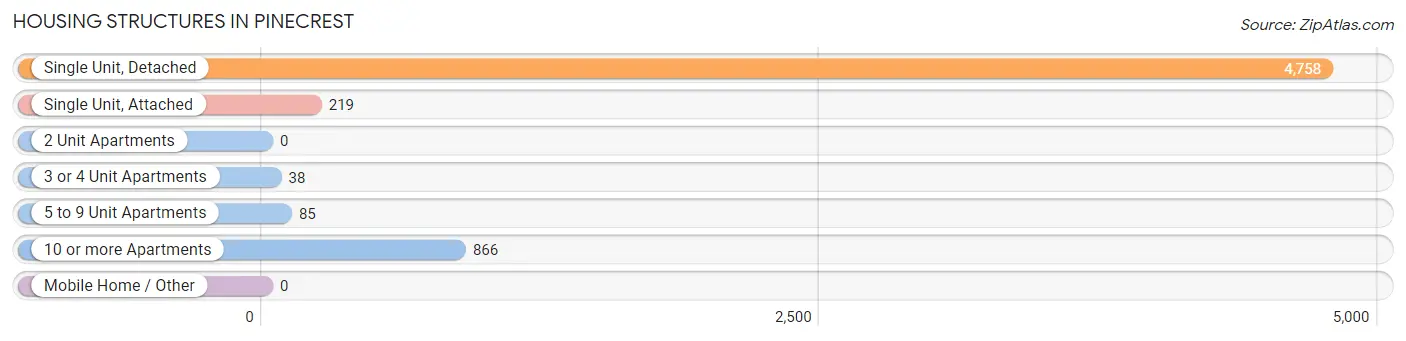
| Structure Type | # Housing Units | % Housing Units |
| Single Unit, Detached | 4,758 | 79.7% |
| Single Unit, Attached | 219 | 3.7% |
| 2 Unit Apartments | 0 | 0.0% |
| 3 or 4 Unit Apartments | 38 | 0.6% |
| 5 to 9 Unit Apartments | 85 | 1.4% |
| 10 or more Apartments | 866 | 14.5% |
| Mobile Home / Other | 0 | 0.0% |
| Total | 5,966 | 100.0% |
Housing Structures by Occupancy in Pinecrest
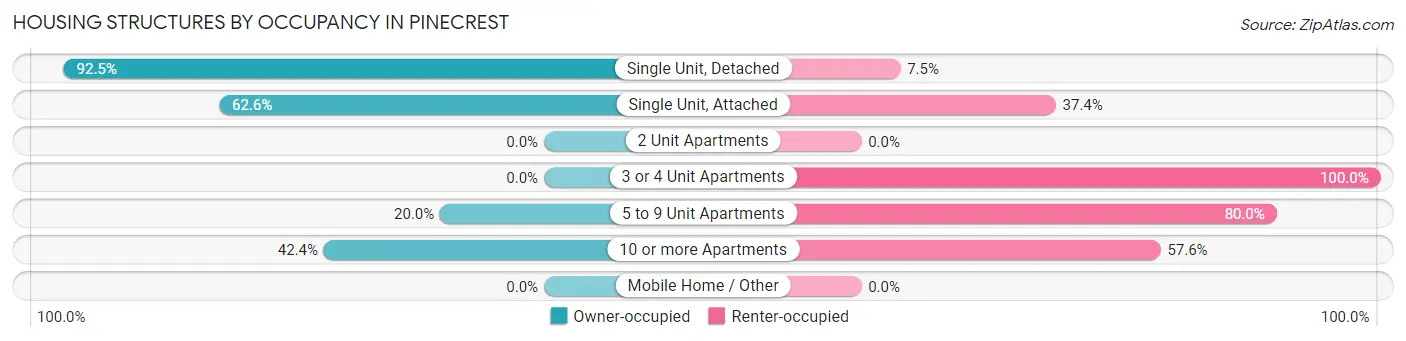
| Structure Type | Owner-occupied | Renter-occupied |
| Single Unit, Detached | 4,400 (92.5%) | 358 (7.5%) |
| Single Unit, Attached | 137 (62.6%) | 82 (37.4%) |
| 2 Unit Apartments | 0 (0.0%) | 0 (0.0%) |
| 3 or 4 Unit Apartments | 0 (0.0%) | 38 (100.0%) |
| 5 to 9 Unit Apartments | 17 (20.0%) | 68 (80.0%) |
| 10 or more Apartments | 367 (42.4%) | 499 (57.6%) |
| Mobile Home / Other | 0 (0.0%) | 0 (0.0%) |
| Total | 4,921 (82.5%) | 1,045 (17.5%) |
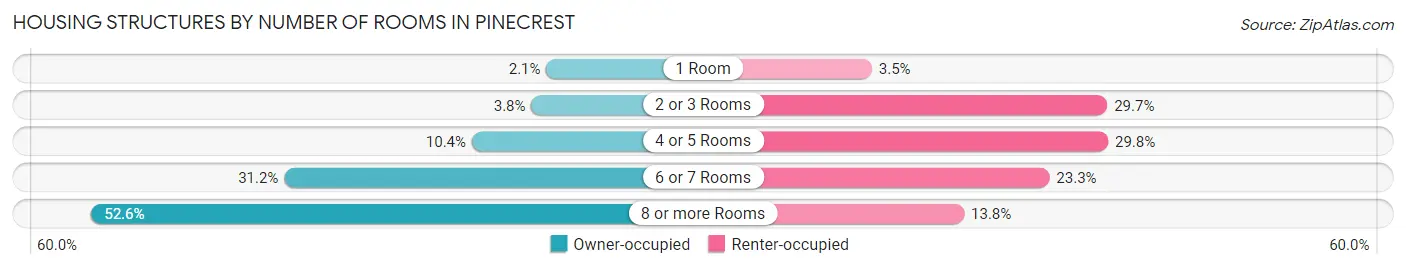
Housing Structures by Number of Rooms in Pinecrest
| Number of Rooms | Owner-occupied | Renter-occupied |
| 1 Room | 103 (2.1%) | 37 (3.5%) |
| 2 or 3 Rooms | 185 (3.8%) | 310 (29.7%) |
| 4 or 5 Rooms | 510 (10.4%) | 311 (29.8%) |
| 6 or 7 Rooms | 1,535 (31.2%) | 243 (23.3%) |
| 8 or more Rooms | 2,588 (52.6%) | 144 (13.8%) |
| Total | 4,921 (100.0%) | 1,045 (100.0%) |
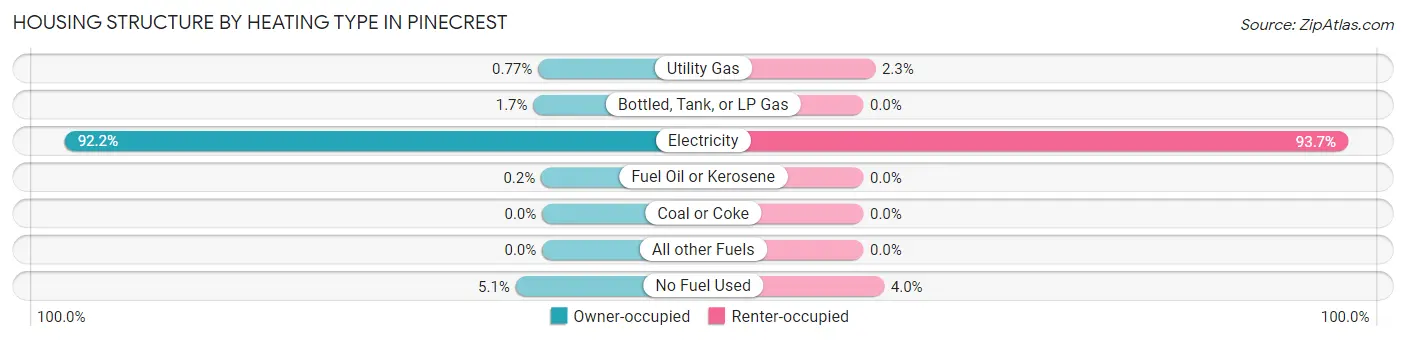
Housing Structure by Heating Type in Pinecrest
| Heating Type | Owner-occupied | Renter-occupied |
| Utility Gas | 38 (0.8%) | 24 (2.3%) |
| Bottled, Tank, or LP Gas | 83 (1.7%) | 0 (0.0%) |
| Electricity | 4,539 (92.2%) | 979 (93.7%) |
| Fuel Oil or Kerosene | 10 (0.2%) | 0 (0.0%) |
| Coal or Coke | 0 (0.0%) | 0 (0.0%) |
| All other Fuels | 0 (0.0%) | 0 (0.0%) |
| No Fuel Used | 251 (5.1%) | 42 (4.0%) |
| Total | 4,921 (100.0%) | 1,045 (100.0%) |
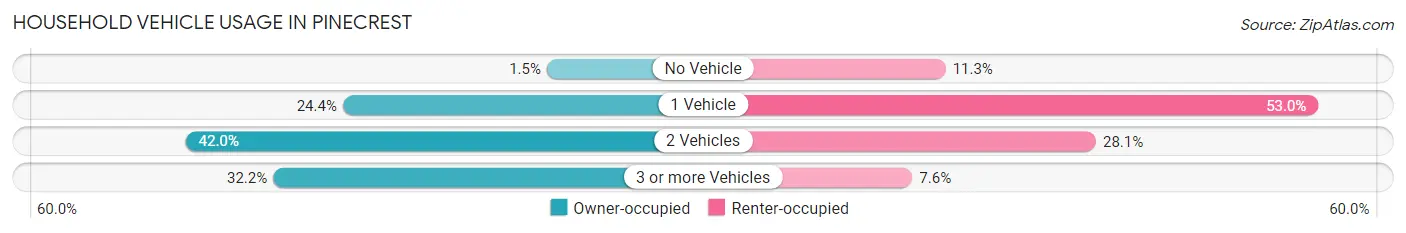
Household Vehicle Usage in Pinecrest
| Vehicles per Household | Owner-occupied | Renter-occupied |
| No Vehicle | 74 (1.5%) | 118 (11.3%) |
| 1 Vehicle | 1,199 (24.4%) | 554 (53.0%) |
| 2 Vehicles | 2,065 (42.0%) | 294 (28.1%) |
| 3 or more Vehicles | 1,583 (32.2%) | 79 (7.6%) |
| Total | 4,921 (100.0%) | 1,045 (100.0%) |
Real Estate & Mortgages in Pinecrest
Real Estate and Mortgage Overview in Pinecrest
| Characteristic | Without Mortgage | With Mortgage |
| Housing Units | 1,746 | 3,175 |
| Median Property Value | $1,095,300 | $1,147,300 |
| Median Household Income | $173,856 | $2,199 |
| Monthly Housing Costs | $1,501 | $2,353 |
| Real Estate Taxes | $9,058 | $26 |
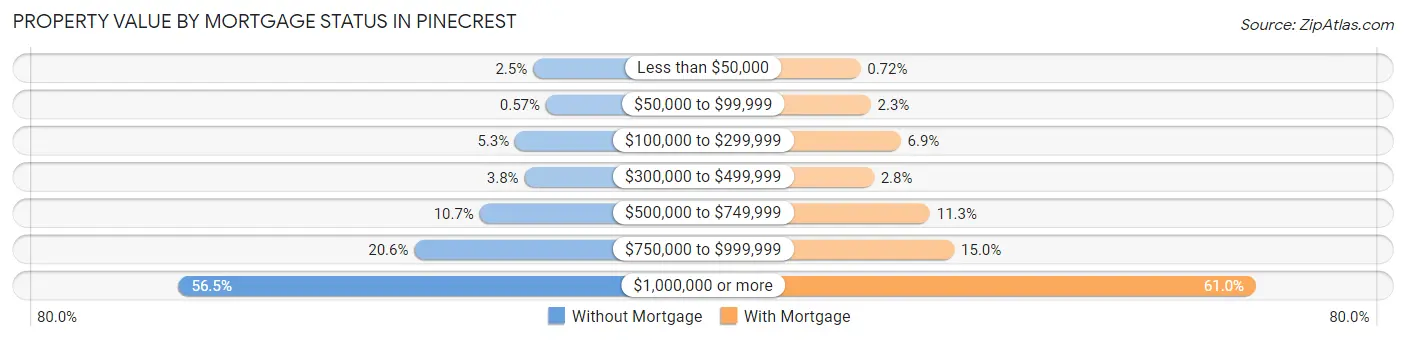
Property Value by Mortgage Status in Pinecrest
| Property Value | Without Mortgage | With Mortgage |
| Less than $50,000 | 44 (2.5%) | 23 (0.7%) |
| $50,000 to $99,999 | 10 (0.6%) | 73 (2.3%) |
| $100,000 to $299,999 | 92 (5.3%) | 218 (6.9%) |
| $300,000 to $499,999 | 67 (3.8%) | 88 (2.8%) |
| $500,000 to $749,999 | 186 (10.6%) | 359 (11.3%) |
| $750,000 to $999,999 | 360 (20.6%) | 477 (15.0%) |
| $1,000,000 or more | 987 (56.5%) | 1,937 (61.0%) |
| Total | 1,746 (100.0%) | 3,175 (100.0%) |
Household Income by Mortgage Status in Pinecrest
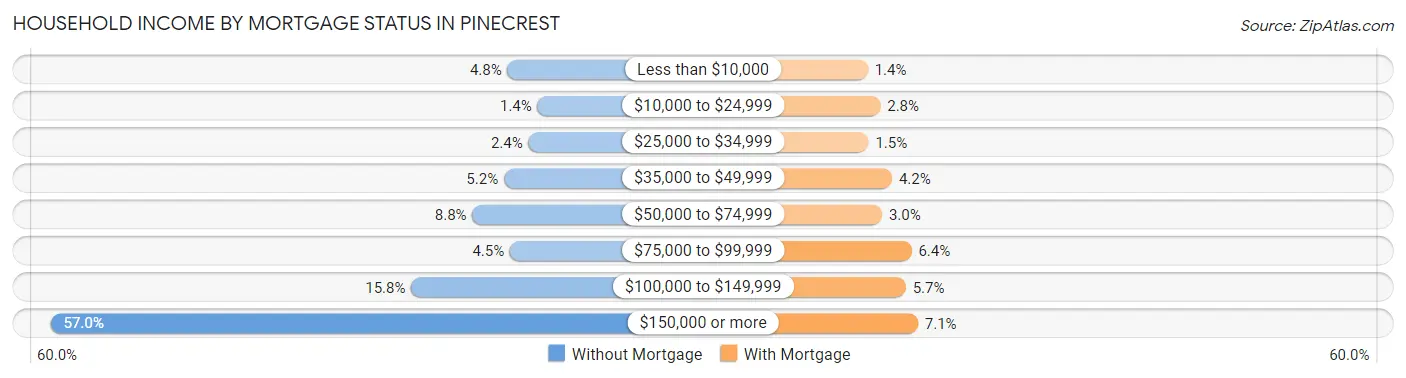
| Household Income | Without Mortgage | With Mortgage |
| Less than $10,000 | 84 (4.8%) | 44 (1.4%) |
| $10,000 to $24,999 | 24 (1.4%) | 90 (2.8%) |
| $25,000 to $34,999 | 42 (2.4%) | 47 (1.5%) |
| $35,000 to $49,999 | 91 (5.2%) | 132 (4.2%) |
| $50,000 to $74,999 | 154 (8.8%) | 96 (3.0%) |
| $75,000 to $99,999 | 79 (4.5%) | 203 (6.4%) |
| $100,000 to $149,999 | 276 (15.8%) | 182 (5.7%) |
| $150,000 or more | 996 (57.0%) | 226 (7.1%) |
| Total | 1,746 (100.0%) | 3,175 (100.0%) |
Property Value to Household Income Ratio in Pinecrest
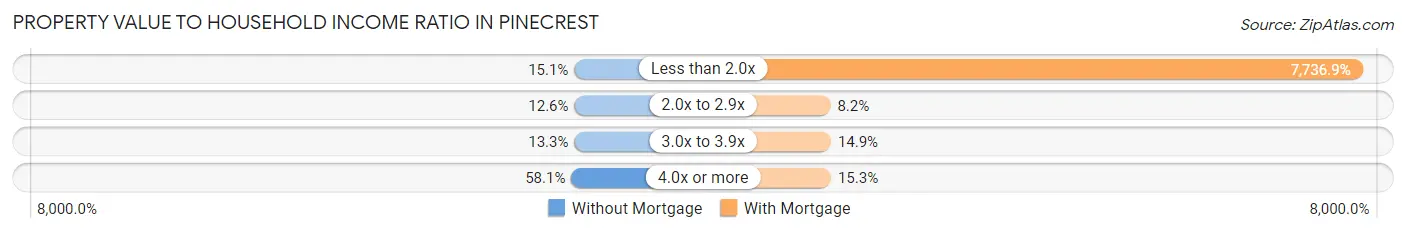
| Value-to-Income Ratio | Without Mortgage | With Mortgage |
| Less than 2.0x | 263 (15.1%) | 245,646 (7,736.9%) |
| 2.0x to 2.9x | 220 (12.6%) | 261 (8.2%) |
| 3.0x to 3.9x | 232 (13.3%) | 472 (14.9%) |
| 4.0x or more | 1,015 (58.1%) | 487 (15.3%) |
| Total | 1,746 (100.0%) | 3,175 (100.0%) |
Real Estate Taxes by Mortgage Status in Pinecrest
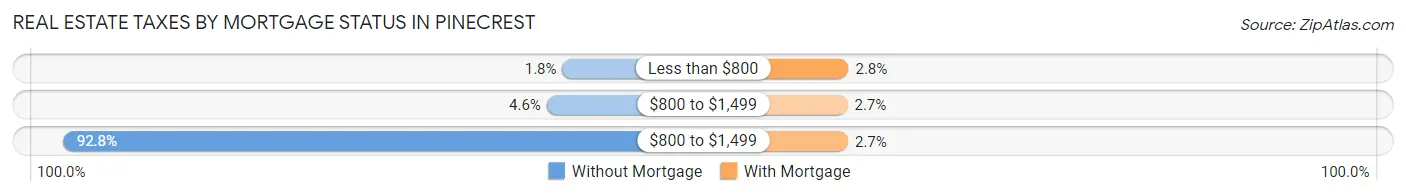
| Property Taxes | Without Mortgage | With Mortgage |
| Less than $800 | 31 (1.8%) | 90 (2.8%) |
| $800 to $1,499 | 81 (4.6%) | 84 (2.6%) |
| $800 to $1,499 | 1,621 (92.8%) | 87 (2.7%) |
| Total | 1,746 (100.0%) | 3,175 (100.0%) |
Health & Disability in Pinecrest
Health Insurance Coverage by Age in Pinecrest
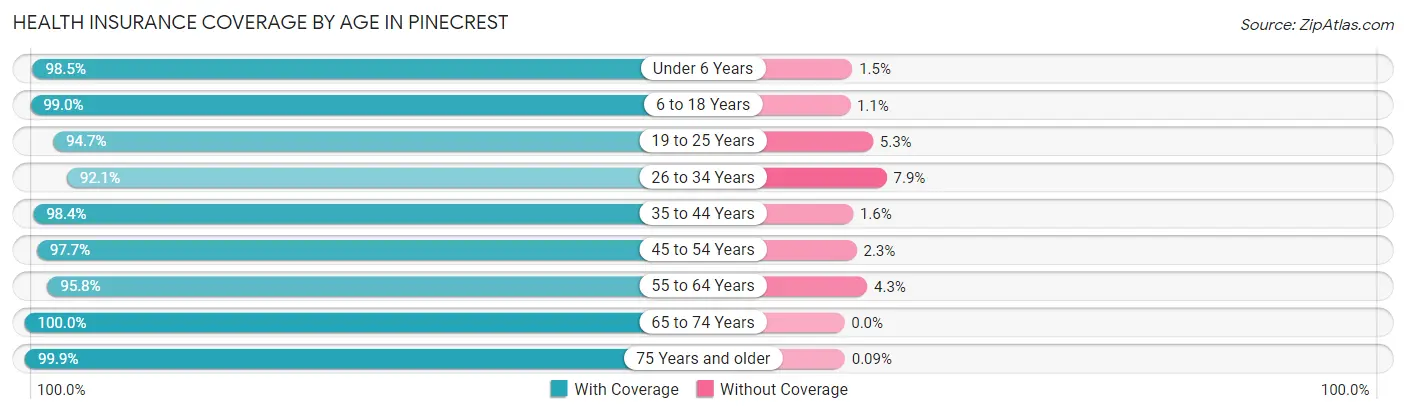
| Age Bracket | With Coverage | Without Coverage |
| Under 6 Years | 1,067 (98.5%) | 16 (1.5%) |
| 6 to 18 Years | 4,355 (99.0%) | 46 (1.1%) |
| 19 to 25 Years | 1,030 (94.7%) | 58 (5.3%) |
| 26 to 34 Years | 957 (92.1%) | 82 (7.9%) |
| 35 to 44 Years | 2,138 (98.4%) | 35 (1.6%) |
| 45 to 54 Years | 2,704 (97.7%) | 63 (2.3%) |
| 55 to 64 Years | 2,386 (95.8%) | 106 (4.3%) |
| 65 to 74 Years | 2,069 (100.0%) | 0 (0.0%) |
| 75 Years and older | 1,142 (99.9%) | 1 (0.1%) |
| Total | 17,848 (97.8%) | 407 (2.2%) |
Health Insurance Coverage by Citizenship Status in Pinecrest
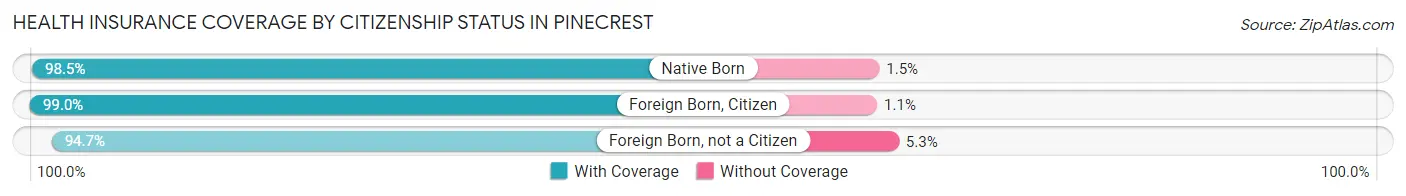
| Citizenship Status | With Coverage | Without Coverage |
| Native Born | 1,067 (98.5%) | 16 (1.5%) |
| Foreign Born, Citizen | 4,355 (99.0%) | 46 (1.1%) |
| Foreign Born, not a Citizen | 1,030 (94.7%) | 58 (5.3%) |
Health Insurance Coverage by Household Income in Pinecrest
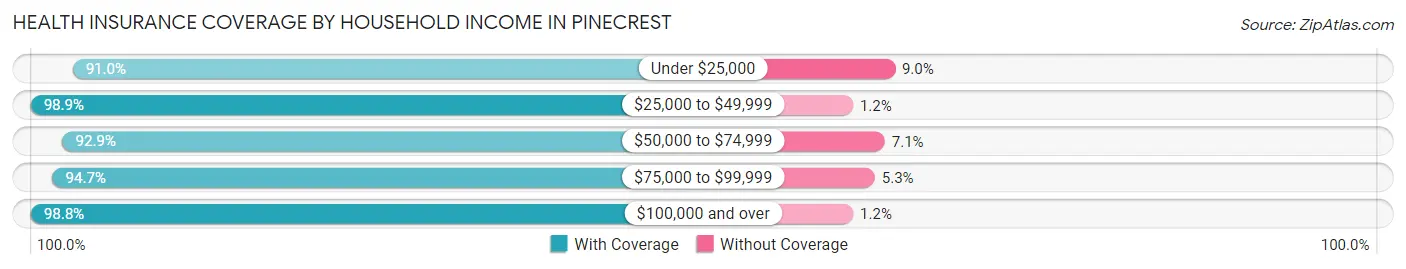
| Household Income | With Coverage | Without Coverage |
| Under $25,000 | 888 (91.0%) | 88 (9.0%) |
| $25,000 to $49,999 | 1,122 (98.9%) | 13 (1.1%) |
| $50,000 to $74,999 | 977 (92.9%) | 75 (7.1%) |
| $75,000 to $99,999 | 1,080 (94.7%) | 60 (5.3%) |
| $100,000 and over | 13,777 (98.8%) | 166 (1.2%) |
Public vs Private Health Insurance Coverage by Age in Pinecrest
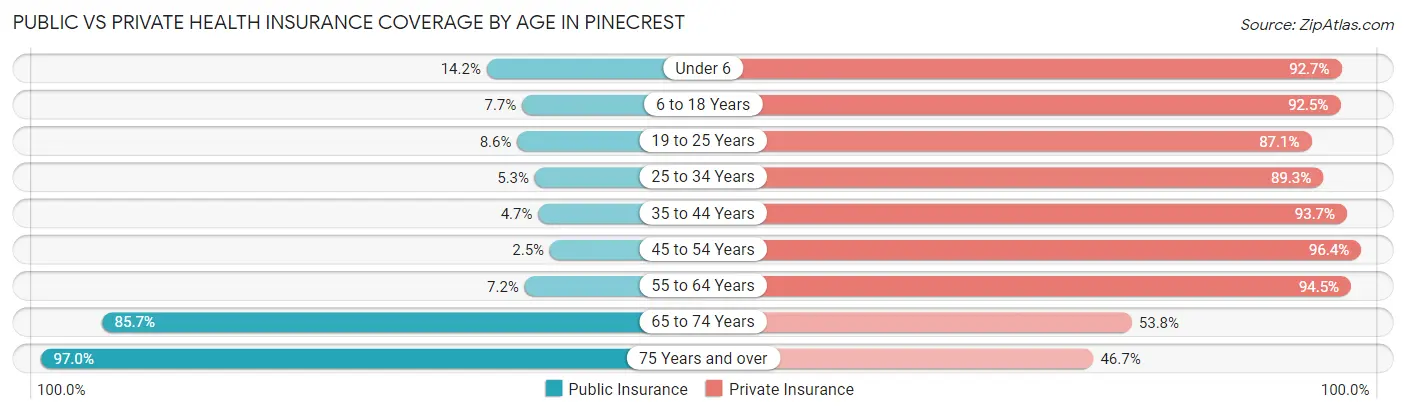
| Age Bracket | Public Insurance | Private Insurance |
| Under 6 | 154 (14.2%) | 1,004 (92.7%) |
| 6 to 18 Years | 337 (7.7%) | 4,071 (92.5%) |
| 19 to 25 Years | 93 (8.6%) | 948 (87.1%) |
| 25 to 34 Years | 55 (5.3%) | 928 (89.3%) |
| 35 to 44 Years | 101 (4.6%) | 2,037 (93.7%) |
| 45 to 54 Years | 69 (2.5%) | 2,667 (96.4%) |
| 55 to 64 Years | 179 (7.2%) | 2,355 (94.5%) |
| 65 to 74 Years | 1,773 (85.7%) | 1,114 (53.8%) |
| 75 Years and over | 1,109 (97.0%) | 534 (46.7%) |
| Total | 3,870 (21.2%) | 15,658 (85.8%) |
Disability Status by Sex by Age in Pinecrest
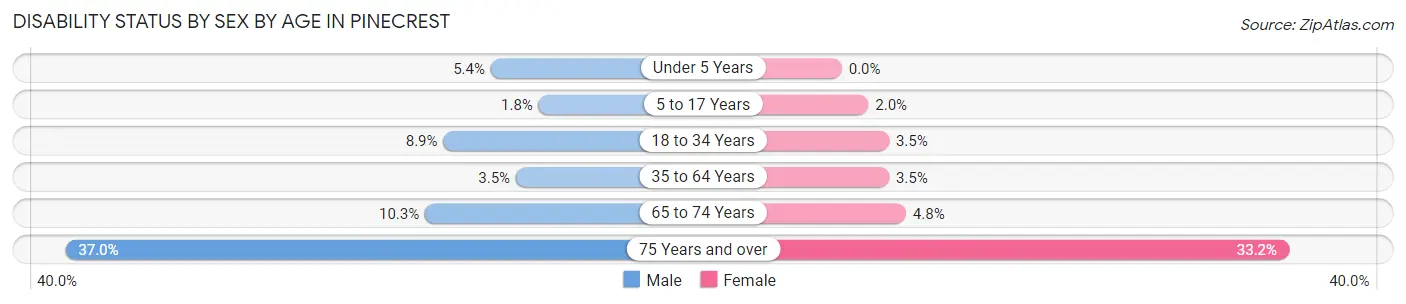
| Age Bracket | Male | Female |
| Under 5 Years | 27 (5.4%) | 0 (0.0%) |
| 5 to 17 Years | 45 (1.8%) | 36 (2.0%) |
| 18 to 34 Years | 127 (8.9%) | 33 (3.5%) |
| 35 to 64 Years | 129 (3.5%) | 132 (3.5%) |
| 65 to 74 Years | 111 (10.3%) | 47 (4.8%) |
| 75 Years and over | 173 (37.0%) | 224 (33.2%) |
Disability Class by Sex by Age in Pinecrest
Disability Class: Hearing Difficulty
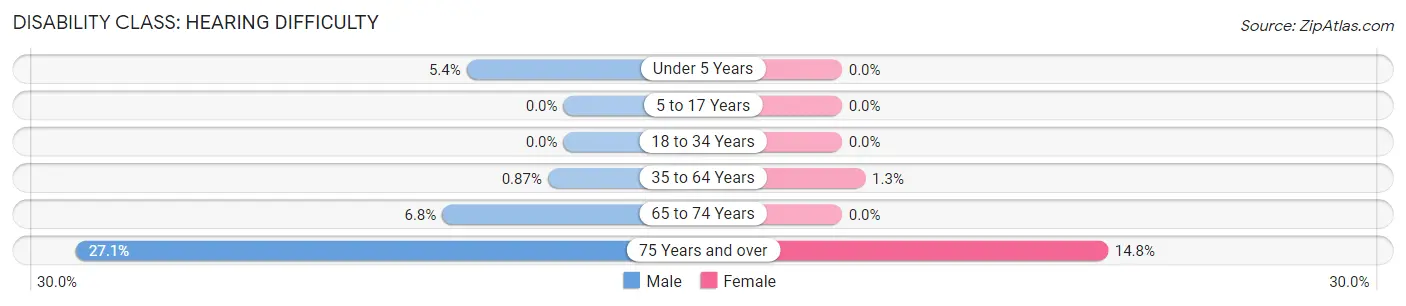
| Age Bracket | Male | Female |
| Under 5 Years | 27 (5.4%) | 0 (0.0%) |
| 5 to 17 Years | 0 (0.0%) | 0 (0.0%) |
| 18 to 34 Years | 0 (0.0%) | 0 (0.0%) |
| 35 to 64 Years | 32 (0.9%) | 49 (1.3%) |
| 65 to 74 Years | 73 (6.8%) | 0 (0.0%) |
| 75 Years and over | 127 (27.1%) | 100 (14.8%) |
Disability Class: Vision Difficulty
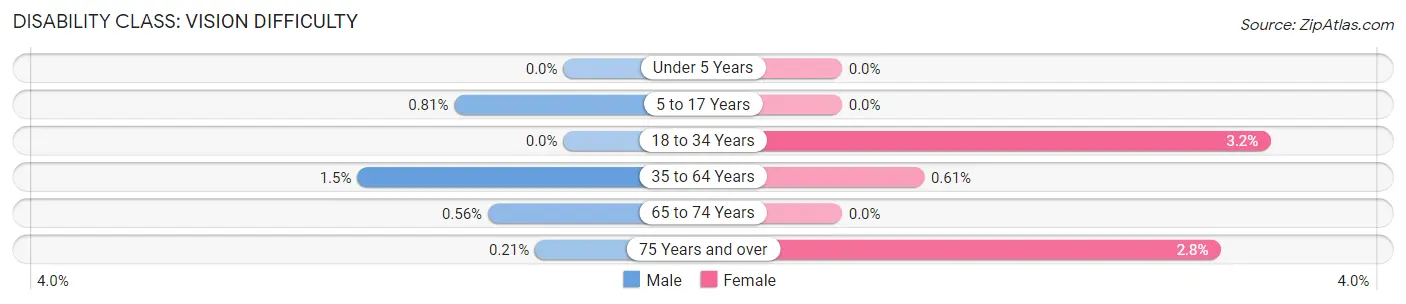
| Age Bracket | Male | Female |
| Under 5 Years | 0 (0.0%) | 0 (0.0%) |
| 5 to 17 Years | 20 (0.8%) | 0 (0.0%) |
| 18 to 34 Years | 0 (0.0%) | 30 (3.2%) |
| 35 to 64 Years | 56 (1.5%) | 23 (0.6%) |
| 65 to 74 Years | 6 (0.6%) | 0 (0.0%) |
| 75 Years and over | 1 (0.2%) | 19 (2.8%) |
Disability Class: Cognitive Difficulty
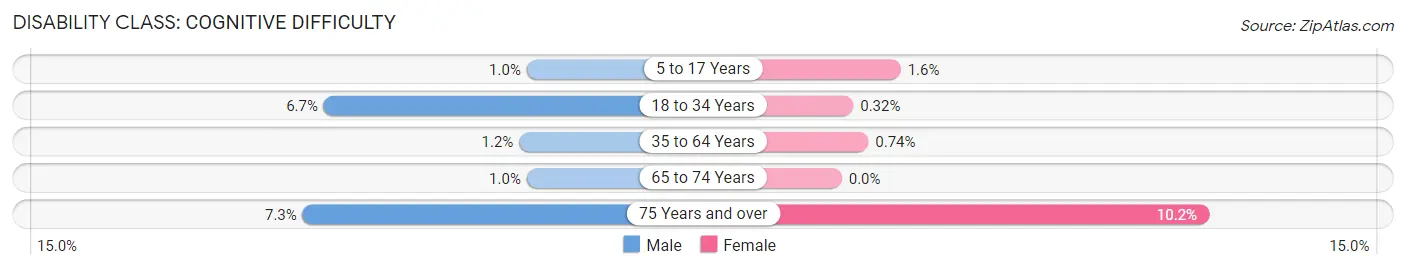
| Age Bracket | Male | Female |
| 5 to 17 Years | 25 (1.0%) | 30 (1.6%) |
| 18 to 34 Years | 95 (6.7%) | 3 (0.3%) |
| 35 to 64 Years | 45 (1.2%) | 28 (0.7%) |
| 65 to 74 Years | 11 (1.0%) | 0 (0.0%) |
| 75 Years and over | 34 (7.3%) | 69 (10.2%) |
Disability Class: Ambulatory Difficulty
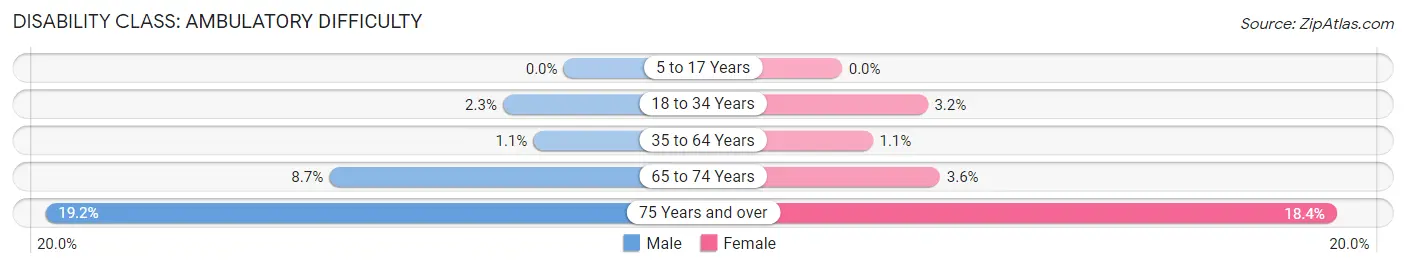
| Age Bracket | Male | Female |
| 5 to 17 Years | 0 (0.0%) | 0 (0.0%) |
| 18 to 34 Years | 32 (2.2%) | 30 (3.2%) |
| 35 to 64 Years | 41 (1.1%) | 43 (1.1%) |
| 65 to 74 Years | 94 (8.7%) | 36 (3.6%) |
| 75 Years and over | 90 (19.2%) | 124 (18.4%) |
Disability Class: Self-Care Difficulty
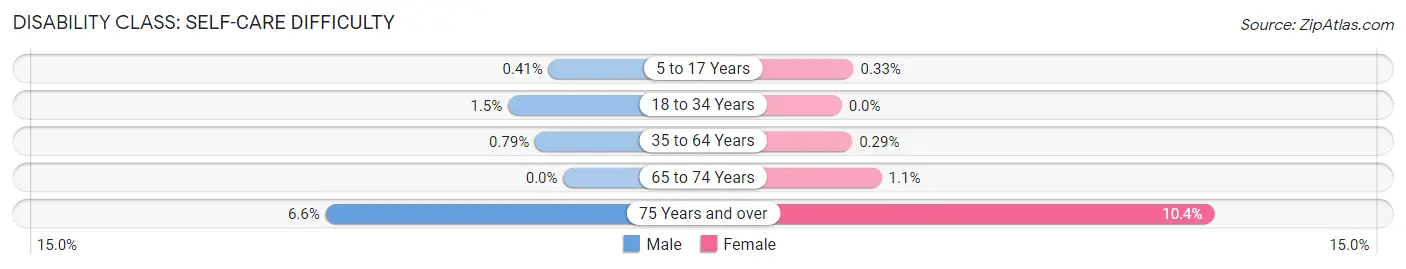
| Age Bracket | Male | Female |
| 5 to 17 Years | 10 (0.4%) | 6 (0.3%) |
| 18 to 34 Years | 22 (1.5%) | 0 (0.0%) |
| 35 to 64 Years | 29 (0.8%) | 11 (0.3%) |
| 65 to 74 Years | 0 (0.0%) | 11 (1.1%) |
| 75 Years and over | 31 (6.6%) | 70 (10.4%) |
Technology Access in Pinecrest
Computing Device Access in Pinecrest
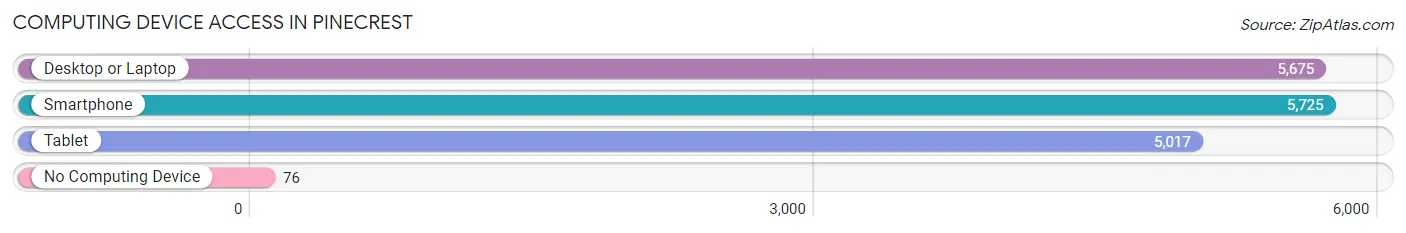
| Device Type | # Households | % Households |
| Desktop or Laptop | 5,675 | 95.1% |
| Smartphone | 5,725 | 96.0% |
| Tablet | 5,017 | 84.1% |
| No Computing Device | 76 | 1.3% |
| Total | 5,966 | 100.0% |
Internet Access in Pinecrest
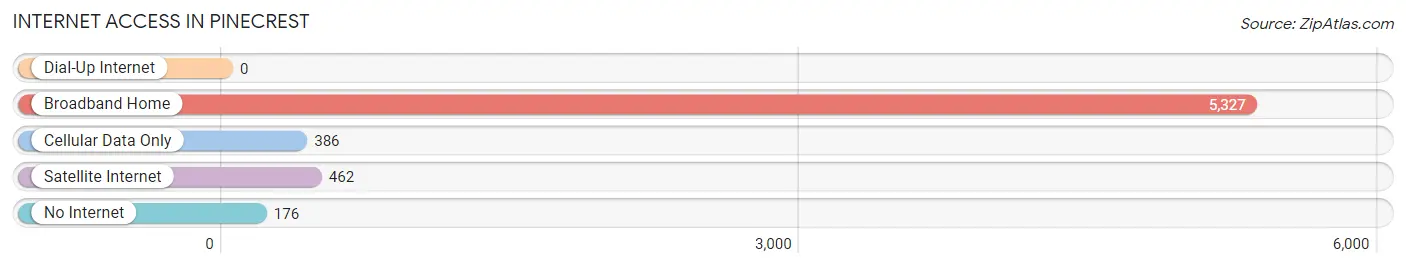
| Internet Type | # Households | % Households |
| Dial-Up Internet | 0 | 0.0% |
| Broadband Home | 5,327 | 89.3% |
| Cellular Data Only | 386 | 6.5% |
| Satellite Internet | 462 | 7.7% |
| No Internet | 176 | 2.9% |
| Total | 5,966 | 100.0% |
Pinecrest Summary
Pinecrest is a village located in Miami-Dade County, Florida, United States. It is located in the southern part of the county, just south of Miami. The village was incorporated in 1996 and has a population of approximately 19,000 people.
History
Pinecrest was originally part of the unincorporated area of Dade County, which was annexed by the City of Miami in 1925. The area was known as “Pinecrest” due to the abundance of pine trees in the area. In the 1950s, the area began to be developed as a residential community. The first homes were built in the area in the late 1950s and early 1960s.
In the 1970s, the area began to experience rapid growth and development. The population of Pinecrest increased from approximately 2,000 in 1970 to over 19,000 in 2000. The village was officially incorporated in 1996.
Geography
Pinecrest is located in the southern part of Miami-Dade County, just south of Miami. It is bordered by the cities of Miami, Coral Gables, and South Miami. The village covers an area of approximately 8.5 square miles. The terrain is mostly flat, with some areas of low hills. The village is located in the Miami metropolitan area.
Economy
Pinecrest has a diverse economy, with a mix of retail, professional services, and manufacturing businesses. The village is home to several large employers, including Baptist Health South Florida, the University of Miami, and the Miami-Dade County Public Schools.
The village also has a thriving retail sector, with several shopping centers and malls. The largest shopping center in the village is the Dadeland Mall, which is located in the heart of the village.
Demographics
As of the 2010 census, the population of Pinecrest was 19,223. The racial makeup of the village was 79.3% White, 8.2% African American, 0.2% Native American, 6.2% Asian, 0.1% Pacific Islander, and 5.2% from other races. Hispanic or Latino of any race were 22.3% of the population.
The median household income in Pinecrest was $90,845 in 2010. The per capita income for the village was $45,845. The median age of the population was 43.7 years.
Pinecrest is a diverse and vibrant community. The village is home to a variety of cultures and backgrounds, and is a great place to live, work, and play.
Common Questions
What is Per Capita Income in Pinecrest?
Per Capita income in Pinecrest is $100,270.
What is the Median Family Income in Pinecrest?
Median Family Income in Pinecrest is $217,917.
What is the Median Household income in Pinecrest?
Median Household Income in Pinecrest is $178,095.
What is Income or Wage Gap in Pinecrest?
Income or Wage Gap in Pinecrest is 51.1%.
Women in Pinecrest earn 48.9 cents for every dollar earned by a man.
What is Family Income Deficit in Pinecrest?
Family Income Deficit in Pinecrest is $15,227.
Families that are below poverty line in Pinecrest earn $15,227 less on average than the poverty threshold level.
What is Inequality or Gini Index in Pinecrest?
Inequality or Gini Index in Pinecrest is 0.57.
What is the Total Population of Pinecrest?
Total Population of Pinecrest is 18,279.
What is the Total Male Population of Pinecrest?
Total Male Population of Pinecrest is 9,620.
What is the Total Female Population of Pinecrest?
Total Female Population of Pinecrest is 8,659.
What is the Ratio of Males per 100 Females in Pinecrest?
There are 111.10 Males per 100 Females in Pinecrest.
What is the Ratio of Females per 100 Males in Pinecrest?
There are 90.01 Females per 100 Males in Pinecrest.
What is the Median Population Age in Pinecrest?
Median Population Age in Pinecrest is 42.0 Years.
What is the Average Family Size in Pinecrest
Average Family Size in Pinecrest is 3.6 People.
What is the Average Household Size in Pinecrest
Average Household Size in Pinecrest is 3.1 People.
How Large is the Labor Force in Pinecrest?
There are 8,465 People in the Labor Forcein in Pinecrest.
What is the Percentage of People in the Labor Force in Pinecrest?
61.9% of People are in the Labor Force in Pinecrest.
What is the Unemployment Rate in Pinecrest?
Unemployment Rate in Pinecrest is 4.9%.