Jay, FL Map & Demographics
Jay Map
Jay Overview
$21,871
PER CAPITA INCOME
$43,250
AVG FAMILY INCOME
$41,875
AVG HOUSEHOLD INCOME
36.2%
WAGE / INCOME GAP [ % ]
63.8¢/ $1
WAGE / INCOME GAP [ $ ]
0.46
INEQUALITY / GINI INDEX
773
TOTAL POPULATION
407
MALE POPULATION
366
FEMALE POPULATION
111.20
MALES / 100 FEMALES
89.93
FEMALES / 100 MALES
36.9
MEDIAN AGE
3.1
AVG FAMILY SIZE
2.9
AVG HOUSEHOLD SIZE
305
LABOR FORCE [ PEOPLE ]
52.5%
PERCENT IN LABOR FORCE
10.2%
UNEMPLOYMENT RATE
Jay Zip Codes
Jay Area Codes
Income in Jay
Income Overview in Jay
Per Capita Income in Jay is $21,871, while median incomes of families and households are $43,250 and $41,875 respectively.
| Characteristic | Number | Measure |
| Per Capita Income | 773 | $21,871 |
| Median Family Income | 193 | $43,250 |
| Mean Family Income | 193 | $62,340 |
| Median Household Income | 271 | $41,875 |
| Mean Household Income | 271 | $59,511 |
| Income Deficit | 193 | $0 |
| Wage / Income Gap (%) | 773 | 36.22% |
| Wage / Income Gap ($) | 773 | 63.78¢ per $1 |
| Gini / Inequality Index | 773 | 0.46 |
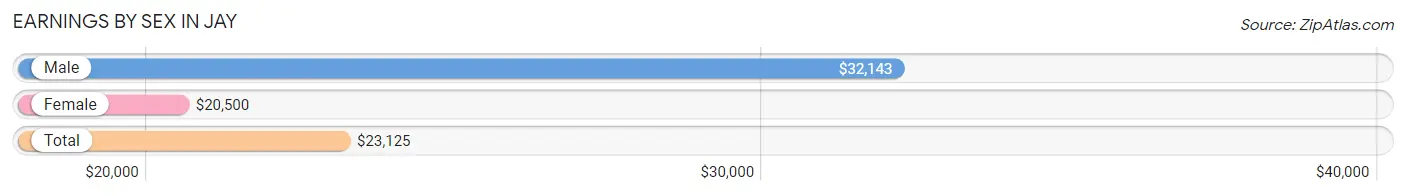
Earnings by Sex in Jay
Average Earnings in Jay are $23,125, $32,143 for men and $20,500 for women, a difference of 36.2%.
| Sex | Number | Average Earnings |
| Male | 198 (65.1%) | $32,143 |
| Female | 106 (34.9%) | $20,500 |
| Total | 304 (100.0%) | $23,125 |
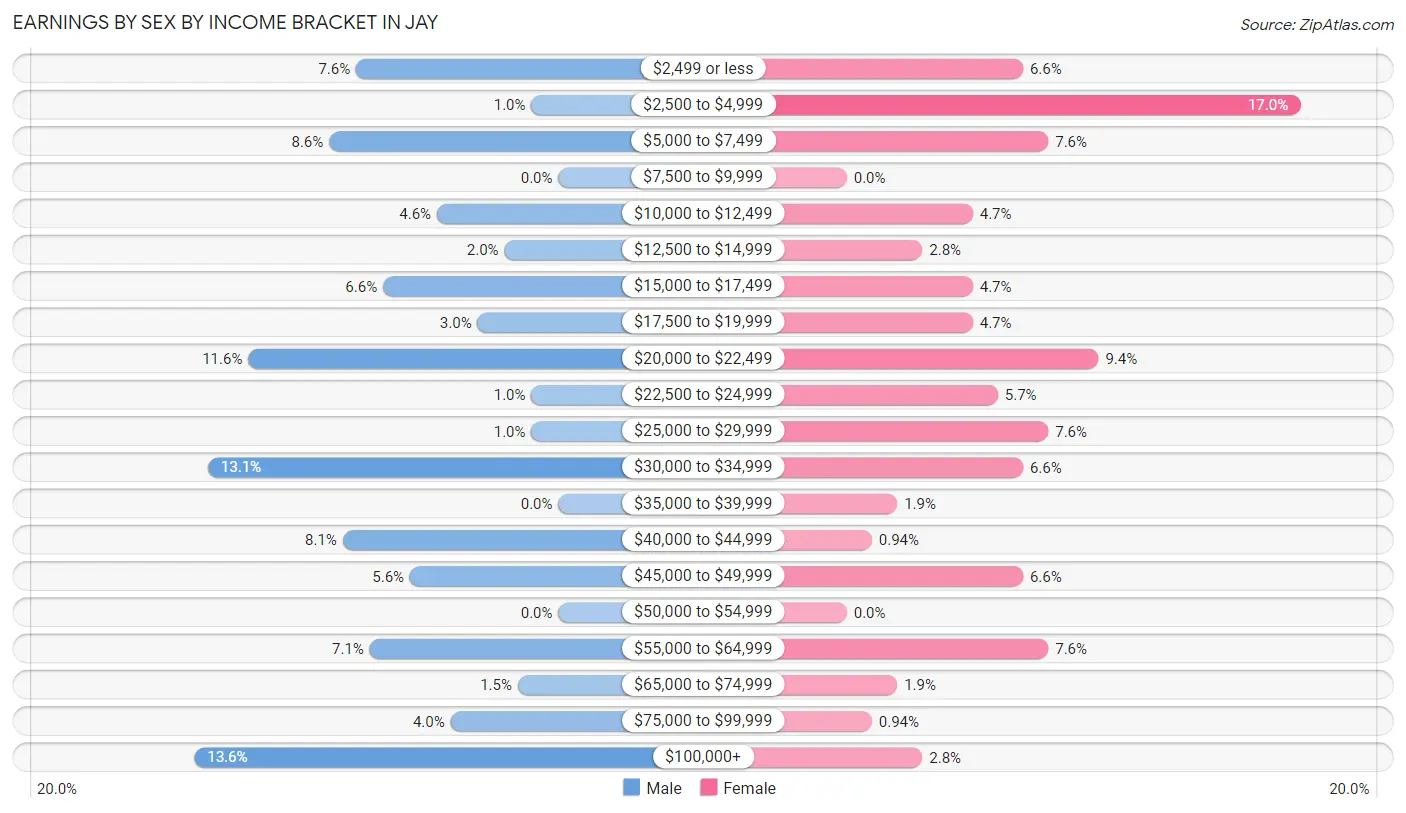
Earnings by Sex by Income Bracket in Jay
The most common earnings brackets in Jay are $100,000+ for men (27 | 13.6%) and $2,500 to $4,999 for women (18 | 17.0%).
| Income | Male | Female |
| $2,499 or less | 15 (7.6%) | 7 (6.6%) |
| $2,500 to $4,999 | 2 (1.0%) | 18 (17.0%) |
| $5,000 to $7,499 | 17 (8.6%) | 8 (7.5%) |
| $7,500 to $9,999 | 0 (0.0%) | 0 (0.0%) |
| $10,000 to $12,499 | 9 (4.5%) | 5 (4.7%) |
| $12,500 to $14,999 | 4 (2.0%) | 3 (2.8%) |
| $15,000 to $17,499 | 13 (6.6%) | 5 (4.7%) |
| $17,500 to $19,999 | 6 (3.0%) | 5 (4.7%) |
| $20,000 to $22,499 | 23 (11.6%) | 10 (9.4%) |
| $22,500 to $24,999 | 2 (1.0%) | 6 (5.7%) |
| $25,000 to $29,999 | 2 (1.0%) | 8 (7.5%) |
| $30,000 to $34,999 | 26 (13.1%) | 7 (6.6%) |
| $35,000 to $39,999 | 0 (0.0%) | 2 (1.9%) |
| $40,000 to $44,999 | 16 (8.1%) | 1 (0.9%) |
| $45,000 to $49,999 | 11 (5.6%) | 7 (6.6%) |
| $50,000 to $54,999 | 0 (0.0%) | 0 (0.0%) |
| $55,000 to $64,999 | 14 (7.1%) | 8 (7.5%) |
| $65,000 to $74,999 | 3 (1.5%) | 2 (1.9%) |
| $75,000 to $99,999 | 8 (4.0%) | 1 (0.9%) |
| $100,000+ | 27 (13.6%) | 3 (2.8%) |
| Total | 198 (100.0%) | 106 (100.0%) |
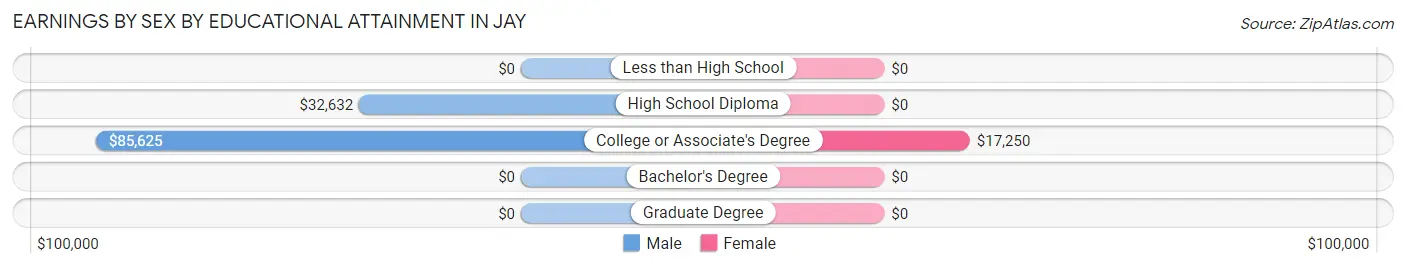
Earnings by Sex by Educational Attainment in Jay
Average earnings in Jay are $34,079 for men and $20,313 for women, a difference of 40.4%. Men with an educational attainment of college or associate's degree enjoy the highest average annual earnings of $85,625, while those with high school diploma education earn the least with $32,632. Women with an educational attainment of college or associate's degree earn the most with the average annual earnings of $17,250, while those with college or associate's degree education have the smallest earnings of $17,250.
| Educational Attainment | Male Income | Female Income |
| Less than High School | - | - |
| High School Diploma | $32,632 | $0 |
| College or Associate's Degree | $85,625 | $17,250 |
| Bachelor's Degree | - | - |
| Graduate Degree | - | - |
| Total | $34,079 | $20,313 |
Family Income in Jay
Family Income Brackets in Jay
According to the Jay family income data, there are 43 families falling into the $15,000 to $24,999 income range, which is the most common income bracket and makes up 22.3% of all families. Conversely, the $25,000 to $34,999 income bracket is the least frequent group with only 1 families (0.5%) belonging to this category.
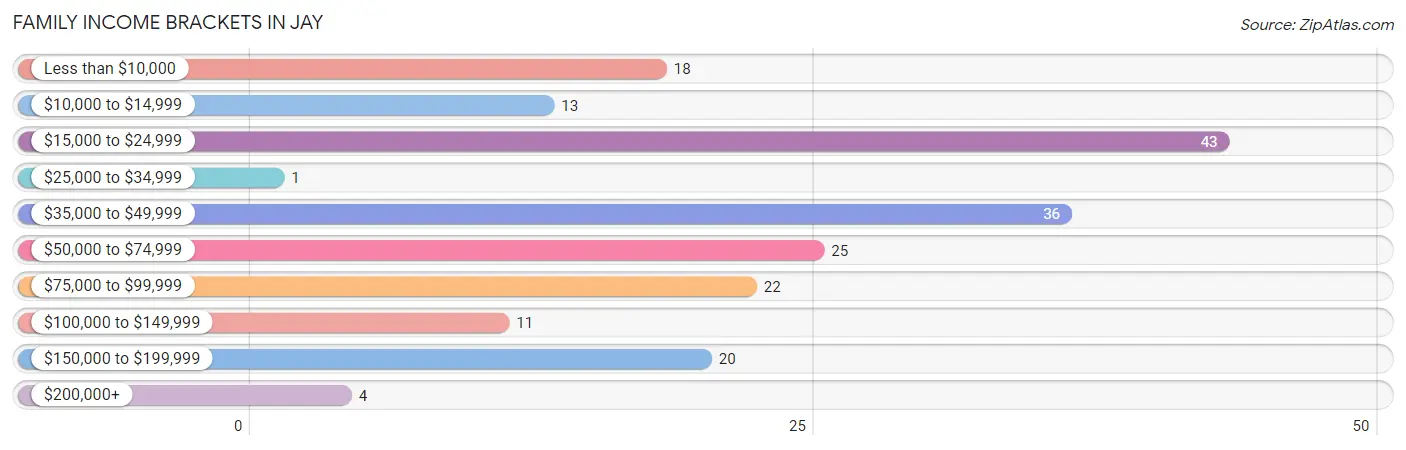
| Income Bracket | # Families | % Families |
| Less than $10,000 | 18 | 9.3% |
| $10,000 to $14,999 | 13 | 6.7% |
| $15,000 to $24,999 | 43 | 22.3% |
| $25,000 to $34,999 | 1 | 0.5% |
| $35,000 to $49,999 | 36 | 18.7% |
| $50,000 to $74,999 | 25 | 13.0% |
| $75,000 to $99,999 | 22 | 11.4% |
| $100,000 to $149,999 | 11 | 5.7% |
| $150,000 to $199,999 | 20 | 10.4% |
| $200,000+ | 4 | 2.1% |
Family Income by Famaliy Size in Jay
5-person families (18 | 9.3%) account for the highest median family income in Jay with $128,750 per family, while 5-person families (18 | 9.3%) have the highest median income of $25,750 per family member.
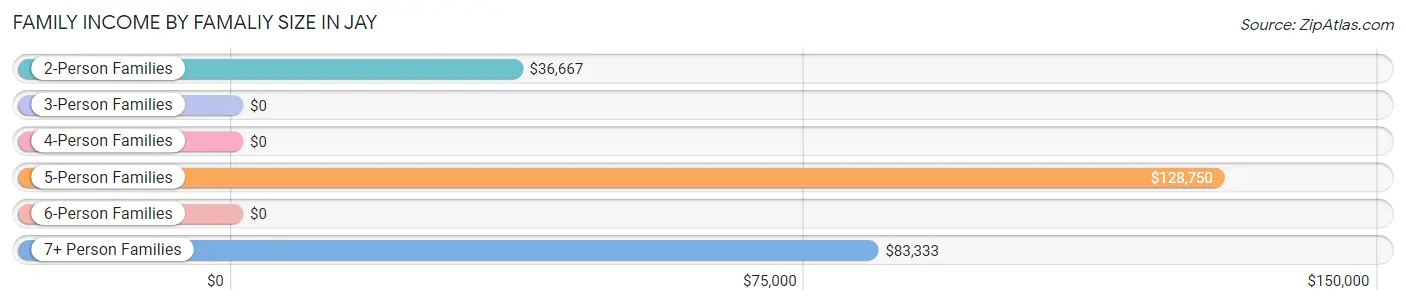
| Income Bracket | # Families | Median Income |
| 2-Person Families | 106 (54.9%) | $36,667 |
| 3-Person Families | 20 (10.4%) | $0 |
| 4-Person Families | 39 (20.2%) | $0 |
| 5-Person Families | 18 (9.3%) | $128,750 |
| 6-Person Families | 4 (2.1%) | $0 |
| 7+ Person Families | 6 (3.1%) | $83,333 |
| Total | 193 (100.0%) | $43,250 |
Family Income by Number of Earners in Jay
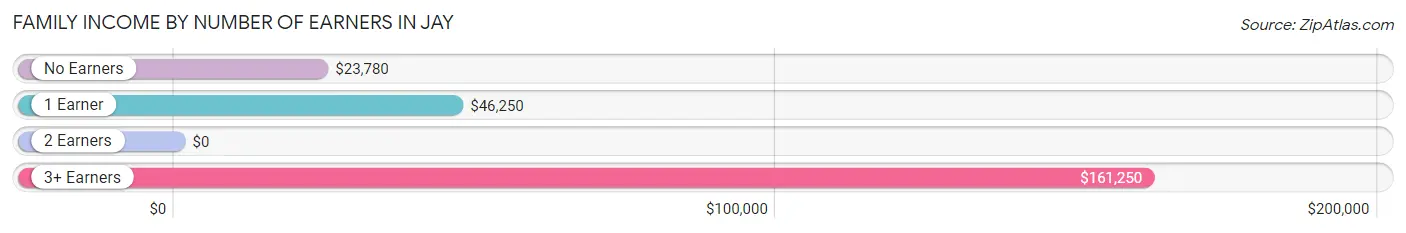
| Number of Earners | # Families | Median Income |
| No Earners | 66 (34.2%) | $23,780 |
| 1 Earner | 70 (36.3%) | $46,250 |
| 2 Earners | 42 (21.8%) | $0 |
| 3+ Earners | 15 (7.8%) | $161,250 |
| Total | 193 (100.0%) | $43,250 |
Household Income in Jay
Household Income Brackets in Jay
With 56 households falling in the category, the $15,000 to $24,999 income range is the most frequent in Jay, accounting for 20.7% of all households. In contrast, only 5 households (1.8%) fall into the $200,000+ income bracket, making it the least populous group.
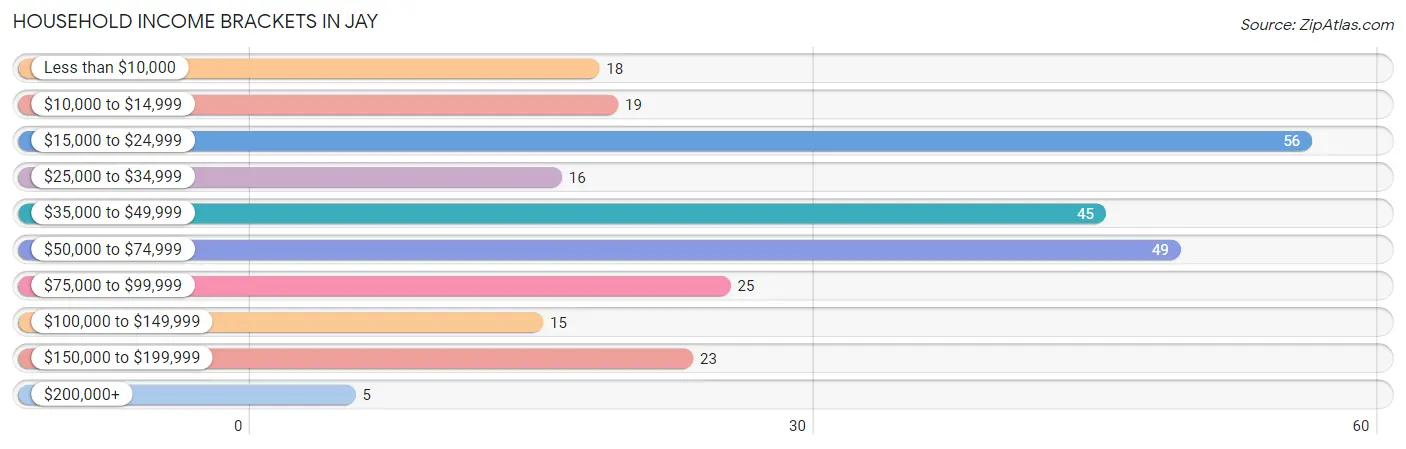
| Income Bracket | # Households | % Households |
| Less than $10,000 | 18 | 6.6% |
| $10,000 to $14,999 | 19 | 7.0% |
| $15,000 to $24,999 | 56 | 20.7% |
| $25,000 to $34,999 | 16 | 5.9% |
| $35,000 to $49,999 | 45 | 16.6% |
| $50,000 to $74,999 | 49 | 18.1% |
| $75,000 to $99,999 | 25 | 9.2% |
| $100,000 to $149,999 | 15 | 5.5% |
| $150,000 to $199,999 | 23 | 8.5% |
| $200,000+ | 5 | 1.8% |
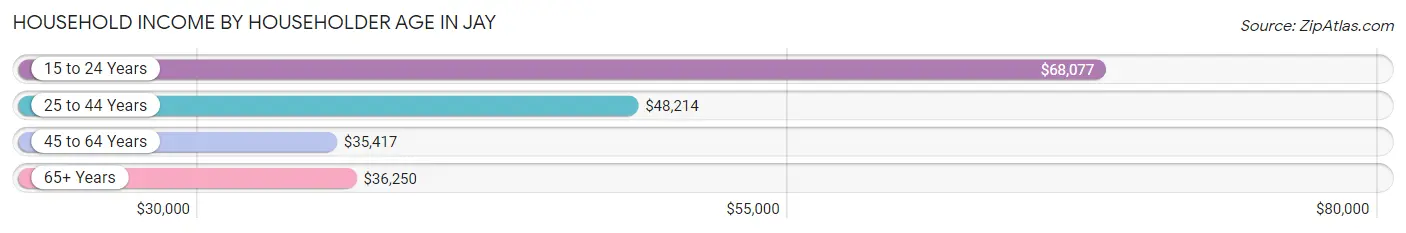
Household Income by Householder Age in Jay
The median household income in Jay is $41,875, with the highest median household income of $68,077 found in the 15 to 24 years age bracket for the primary householder. A total of 24 households (8.9%) fall into this category. Meanwhile, the 45 to 64 years age bracket for the primary householder has the lowest median household income of $35,417, with 119 households (43.9%) in this group.
| Income Bracket | # Households | Median Income |
| 15 to 24 Years | 24 (8.9%) | $68,077 |
| 25 to 44 Years | 82 (30.3%) | $48,214 |
| 45 to 64 Years | 119 (43.9%) | $35,417 |
| 65+ Years | 46 (17.0%) | $36,250 |
| Total | 271 (100.0%) | $41,875 |
Poverty in Jay
Income Below Poverty by Sex and Age in Jay
With 36.3% poverty level for males and 23.6% for females among the residents of Jay, 45 to 54 year old males and 16 and 17 year old females are the most vulnerable to poverty, with 39 males (73.6%) and 2 females (100.0%) in their respective age groups living below the poverty level.
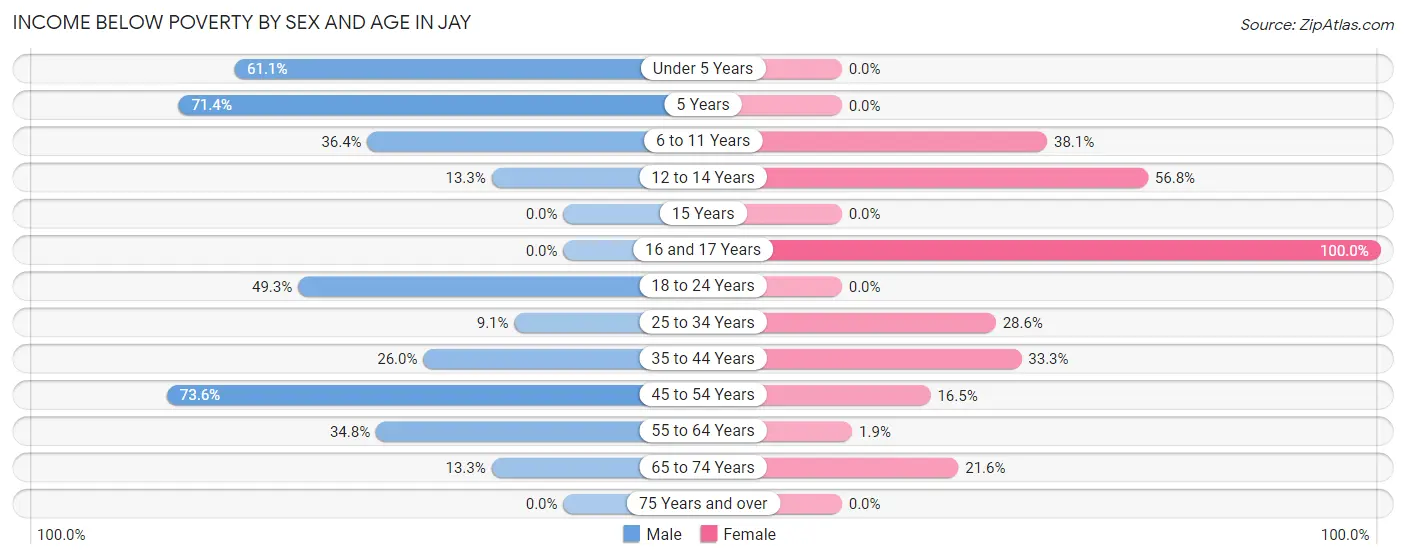
| Age Bracket | Male | Female |
| Under 5 Years | 22 (61.1%) | 0 (0.0%) |
| 5 Years | 5 (71.4%) | 0 (0.0%) |
| 6 to 11 Years | 16 (36.4%) | 8 (38.1%) |
| 12 to 14 Years | 2 (13.3%) | 25 (56.8%) |
| 15 Years | 0 (0.0%) | 0 (0.0%) |
| 16 and 17 Years | 0 (0.0%) | 2 (100.0%) |
| 18 to 24 Years | 33 (49.2%) | 0 (0.0%) |
| 25 to 34 Years | 5 (9.1%) | 8 (28.6%) |
| 35 to 44 Years | 13 (26.0%) | 21 (33.3%) |
| 45 to 54 Years | 39 (73.6%) | 13 (16.5%) |
| 55 to 64 Years | 8 (34.8%) | 1 (1.9%) |
| 65 to 74 Years | 4 (13.3%) | 8 (21.6%) |
| 75 Years and over | 0 (0.0%) | 0 (0.0%) |
| Total | 147 (36.3%) | 86 (23.6%) |
Income Above Poverty by Sex and Age in Jay
According to the poverty statistics in Jay, males aged 15 years and females aged under 5 years are the age groups that are most secure financially, with 100.0% of males and 100.0% of females in these age groups living above the poverty line.
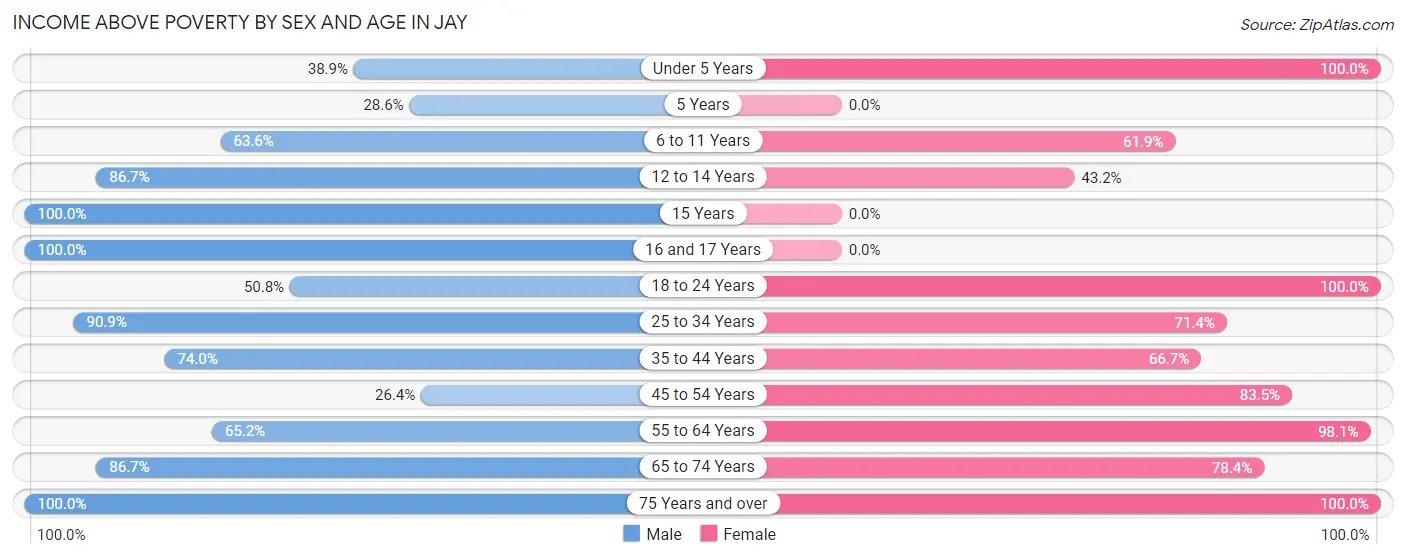
| Age Bracket | Male | Female |
| Under 5 Years | 14 (38.9%) | 14 (100.0%) |
| 5 Years | 2 (28.6%) | 0 (0.0%) |
| 6 to 11 Years | 28 (63.6%) | 13 (61.9%) |
| 12 to 14 Years | 13 (86.7%) | 19 (43.2%) |
| 15 Years | 7 (100.0%) | 0 (0.0%) |
| 16 and 17 Years | 9 (100.0%) | 0 (0.0%) |
| 18 to 24 Years | 34 (50.7%) | 11 (100.0%) |
| 25 to 34 Years | 50 (90.9%) | 20 (71.4%) |
| 35 to 44 Years | 37 (74.0%) | 42 (66.7%) |
| 45 to 54 Years | 14 (26.4%) | 66 (83.5%) |
| 55 to 64 Years | 15 (65.2%) | 51 (98.1%) |
| 65 to 74 Years | 26 (86.7%) | 29 (78.4%) |
| 75 Years and over | 9 (100.0%) | 13 (100.0%) |
| Total | 258 (63.7%) | 278 (76.4%) |
Income Below Poverty Among Married-Couple Families in Jay
The poverty statistics for married-couple families in Jay show that 7.3% or 7 of the total 96 families live below the poverty line. Families with 3 or 4 children have the highest poverty rate of 22.2%, comprising of 4 families. On the other hand, families with no children have the lowest poverty rate of 0.0%, which includes 0 families.
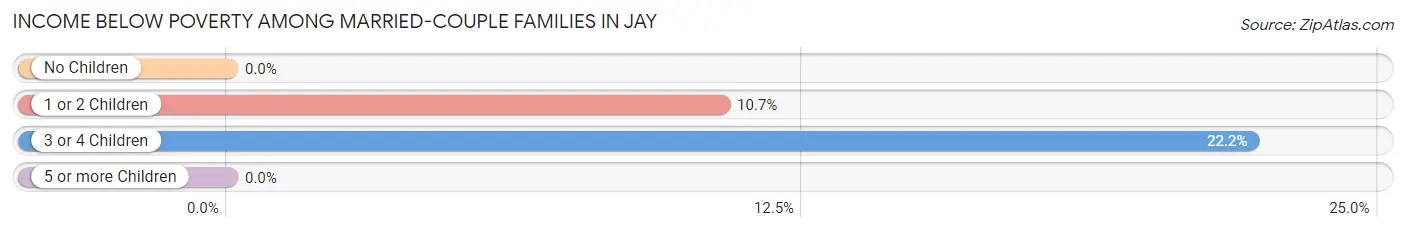
| Children | Above Poverty | Below Poverty |
| No Children | 48 (100.0%) | 0 (0.0%) |
| 1 or 2 Children | 25 (89.3%) | 3 (10.7%) |
| 3 or 4 Children | 14 (77.8%) | 4 (22.2%) |
| 5 or more Children | 2 (100.0%) | 0 (0.0%) |
| Total | 89 (92.7%) | 7 (7.3%) |
Income Below Poverty Among Single-Parent Households in Jay
According to the poverty data in Jay, 37.5% or 6 single-father households and 29.6% or 24 single-mother households are living below the poverty line. Among single-father households, those with no children have the highest poverty rate, with 6 households (37.5%) experiencing poverty. Likewise, among single-mother households, those with 3 or 4 children have the highest poverty rate, with 18 households (85.7%) falling below the poverty line.
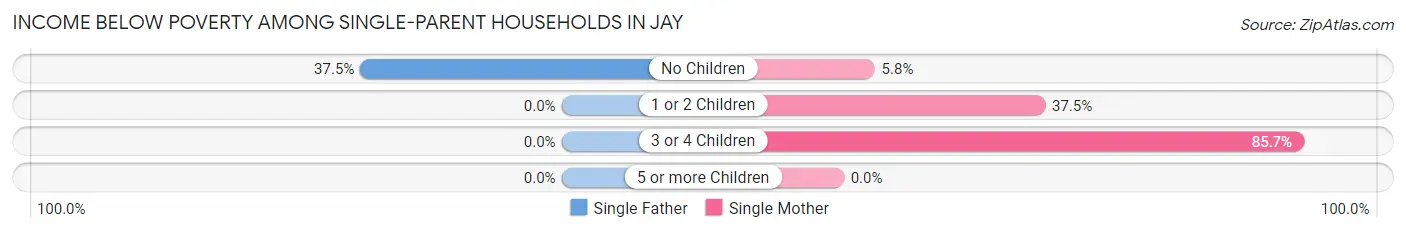
| Children | Single Father | Single Mother |
| No Children | 6 (37.5%) | 3 (5.8%) |
| 1 or 2 Children | 0 (0.0%) | 3 (37.5%) |
| 3 or 4 Children | 0 (0.0%) | 18 (85.7%) |
| 5 or more Children | 0 (0.0%) | 0 (0.0%) |
| Total | 6 (37.5%) | 24 (29.6%) |
Income Below Poverty Among Married-Couple vs Single-Parent Households in Jay
The poverty data for Jay shows that 7 of the married-couple family households (7.3%) and 30 of the single-parent households (30.9%) are living below the poverty level. Within the married-couple family households, those with 3 or 4 children have the highest poverty rate, with 4 households (22.2%) falling below the poverty line. Among the single-parent households, those with 3 or 4 children have the highest poverty rate, with 18 household (85.7%) living below poverty.
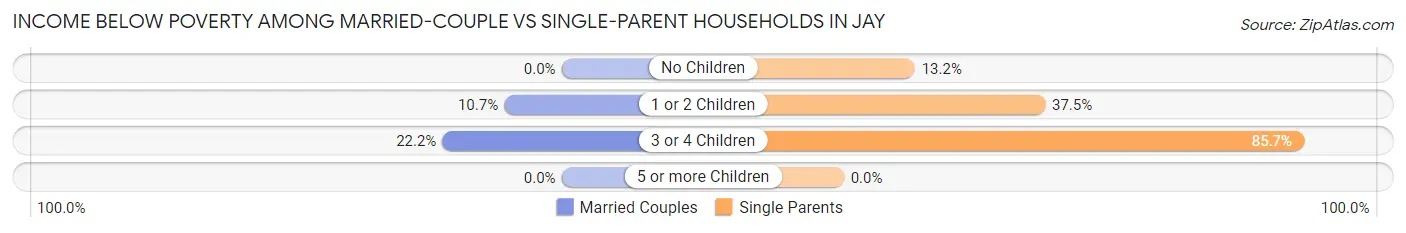
| Children | Married-Couple Families | Single-Parent Households |
| No Children | 0 (0.0%) | 9 (13.2%) |
| 1 or 2 Children | 3 (10.7%) | 3 (37.5%) |
| 3 or 4 Children | 4 (22.2%) | 18 (85.7%) |
| 5 or more Children | 0 (0.0%) | 0 (0.0%) |
| Total | 7 (7.3%) | 30 (30.9%) |
Race in Jay
The most populous races in Jay are White / Caucasian (706 | 91.3%), Two or more Races (39 | 5.1%), and Asian (26 | 3.4%).
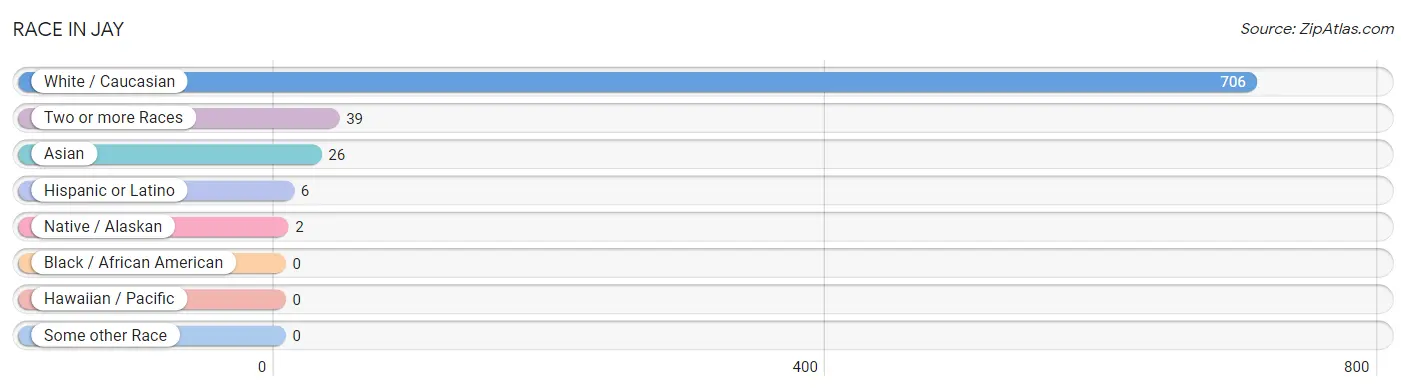
| Race | # Population | % Population |
| Asian | 26 | 3.4% |
| Black / African American | 0 | 0.0% |
| Hawaiian / Pacific | 0 | 0.0% |
| Hispanic or Latino | 6 | 0.8% |
| Native / Alaskan | 2 | 0.3% |
| White / Caucasian | 706 | 91.3% |
| Two or more Races | 39 | 5.1% |
| Some other Race | 0 | 0.0% |
| Total | 773 | 100.0% |
Ancestry in Jay
The most populous ancestries reported in Jay are German (95 | 12.3%), Irish (78 | 10.1%), English (66 | 8.5%), American (53 | 6.9%), and Creek (29 | 3.7%), together accounting for 41.5% of all Jay residents.
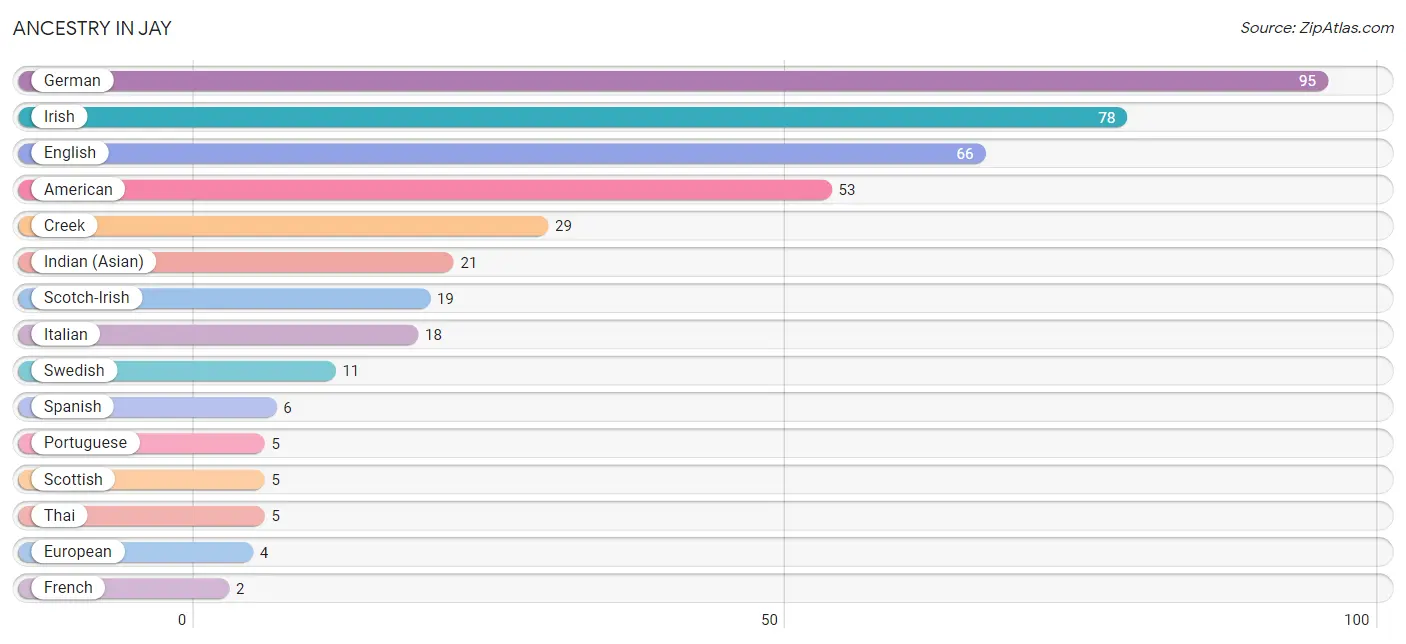
| Ancestry | # Population | % Population |
| American | 53 | 6.9% |
| Creek | 29 | 3.7% |
| Danish | 1 | 0.1% |
| Dutch | 1 | 0.1% |
| English | 66 | 8.5% |
| European | 4 | 0.5% |
| French | 2 | 0.3% |
| German | 95 | 12.3% |
| Indian (Asian) | 21 | 2.7% |
| Irish | 78 | 10.1% |
| Italian | 18 | 2.3% |
| Luxembourger | 2 | 0.3% |
| Native Hawaiian | 2 | 0.3% |
| Portuguese | 5 | 0.6% |
| Scotch-Irish | 19 | 2.5% |
| Scottish | 5 | 0.6% |
| Spanish | 6 | 0.8% |
| Swedish | 11 | 1.4% |
| Thai | 5 | 0.6% | View All 19 Rows |
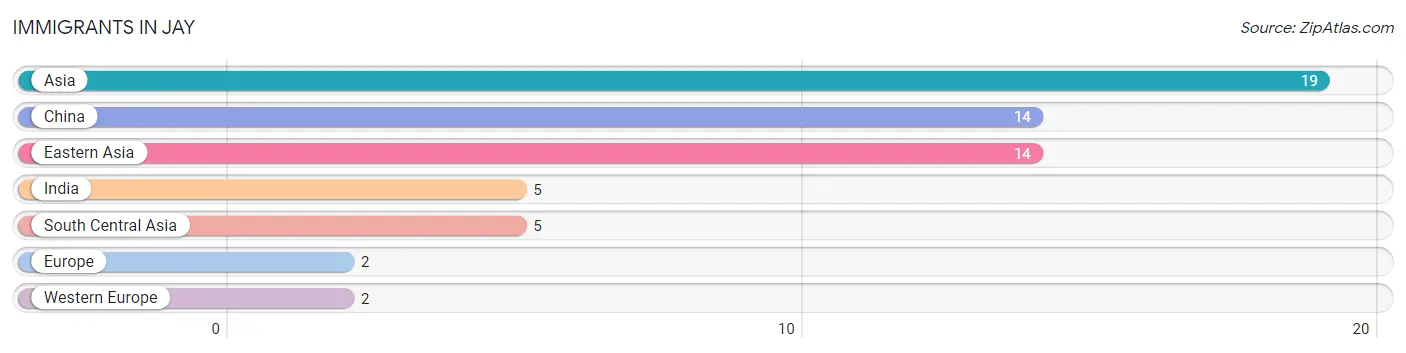
Immigrants in Jay
The most numerous immigrant groups reported in Jay came from Asia (19 | 2.5%), China (14 | 1.8%), Eastern Asia (14 | 1.8%), India (5 | 0.6%), and South Central Asia (5 | 0.6%), together accounting for 7.4% of all Jay residents.
| Immigration Origin | # Population | % Population |
| Asia | 19 | 2.5% |
| China | 14 | 1.8% |
| Eastern Asia | 14 | 1.8% |
| Europe | 2 | 0.3% |
| India | 5 | 0.6% |
| South Central Asia | 5 | 0.6% |
| Western Europe | 2 | 0.3% | View All 7 Rows |
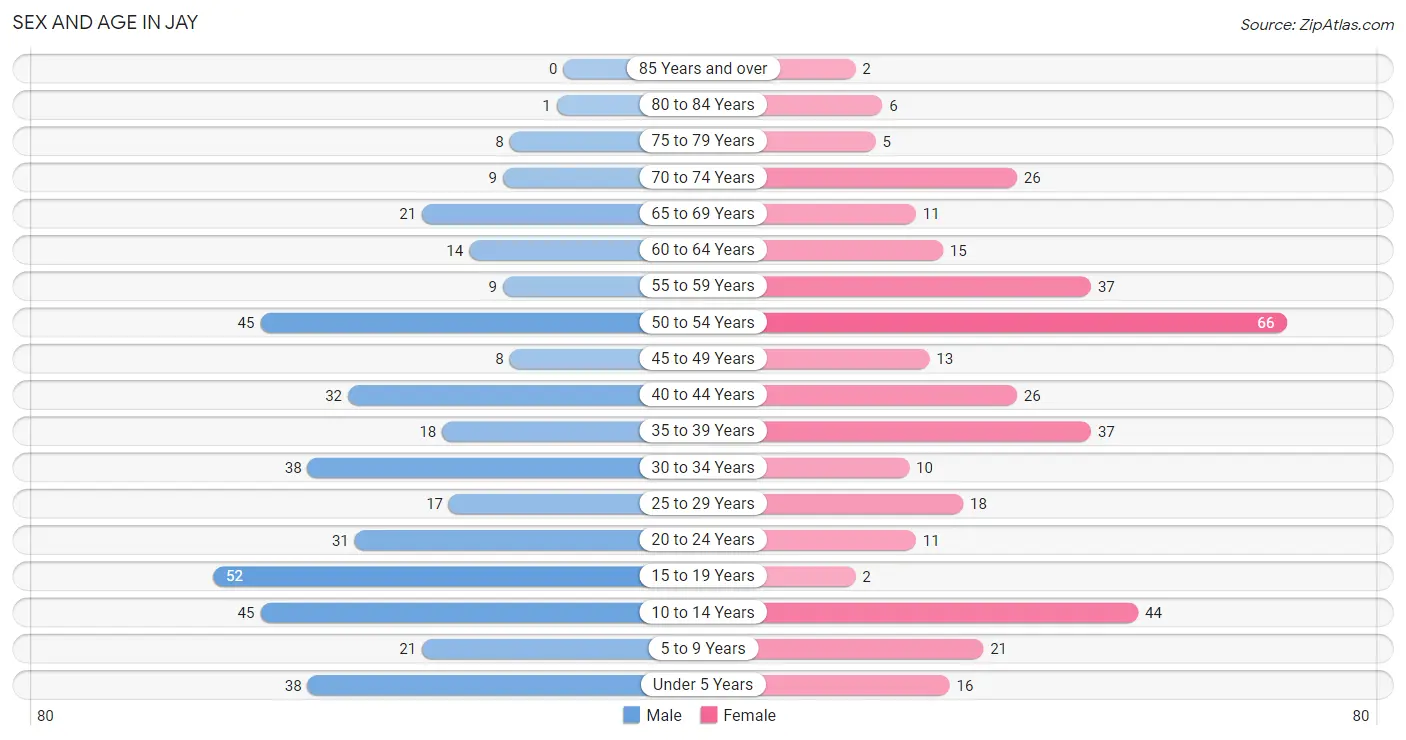
Sex and Age in Jay
Sex and Age in Jay
The most populous age groups in Jay are 15 to 19 Years (52 | 12.8%) for men and 50 to 54 Years (66 | 18.0%) for women.
| Age Bracket | Male | Female |
| Under 5 Years | 38 (9.3%) | 16 (4.4%) |
| 5 to 9 Years | 21 (5.2%) | 21 (5.7%) |
| 10 to 14 Years | 45 (11.1%) | 44 (12.0%) |
| 15 to 19 Years | 52 (12.8%) | 2 (0.5%) |
| 20 to 24 Years | 31 (7.6%) | 11 (3.0%) |
| 25 to 29 Years | 17 (4.2%) | 18 (4.9%) |
| 30 to 34 Years | 38 (9.3%) | 10 (2.7%) |
| 35 to 39 Years | 18 (4.4%) | 37 (10.1%) |
| 40 to 44 Years | 32 (7.9%) | 26 (7.1%) |
| 45 to 49 Years | 8 (2.0%) | 13 (3.5%) |
| 50 to 54 Years | 45 (11.1%) | 66 (18.0%) |
| 55 to 59 Years | 9 (2.2%) | 37 (10.1%) |
| 60 to 64 Years | 14 (3.4%) | 15 (4.1%) |
| 65 to 69 Years | 21 (5.2%) | 11 (3.0%) |
| 70 to 74 Years | 9 (2.2%) | 26 (7.1%) |
| 75 to 79 Years | 8 (2.0%) | 5 (1.4%) |
| 80 to 84 Years | 1 (0.3%) | 6 (1.6%) |
| 85 Years and over | 0 (0.0%) | 2 (0.5%) |
| Total | 407 (100.0%) | 366 (100.0%) |
Families and Households in Jay
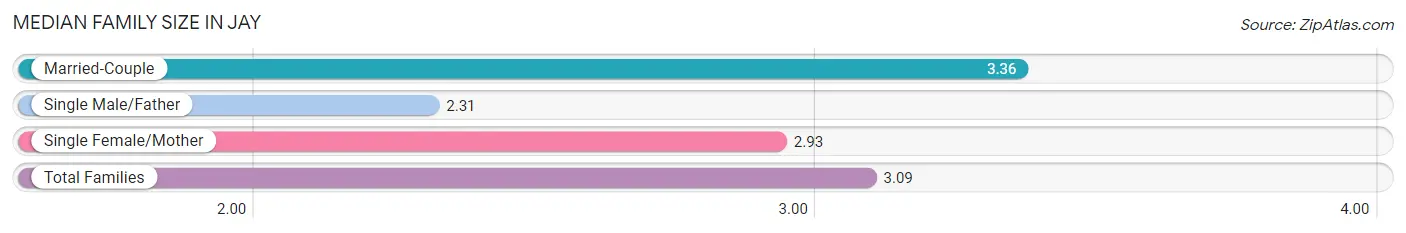
Median Family Size in Jay
The median family size in Jay is 3.09 persons per family, with married-couple families (96 | 49.7%) accounting for the largest median family size of 3.36 persons per family. On the other hand, single male/father families (16 | 8.3%) represent the smallest median family size with 2.31 persons per family.
| Family Type | # Families | Family Size |
| Married-Couple | 96 (49.7%) | 3.36 |
| Single Male/Father | 16 (8.3%) | 2.31 |
| Single Female/Mother | 81 (42.0%) | 2.93 |
| Total Families | 193 (100.0%) | 3.09 |
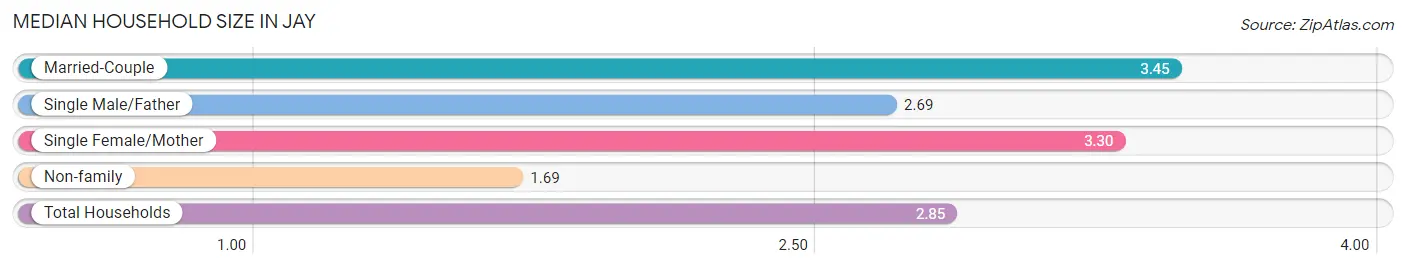
Median Household Size in Jay
The median household size in Jay is 2.85 persons per household, with married-couple households (96 | 35.4%) accounting for the largest median household size of 3.45 persons per household. non-family households (78 | 28.8%) represent the smallest median household size with 1.69 persons per household.
| Household Type | # Households | Household Size |
| Married-Couple | 96 (35.4%) | 3.45 |
| Single Male/Father | 16 (5.9%) | 2.69 |
| Single Female/Mother | 81 (29.9%) | 3.30 |
| Non-family | 78 (28.8%) | 1.69 |
| Total Households | 271 (100.0%) | 2.85 |
Household Size by Marriage Status in Jay
Out of a total of 271 households in Jay, 193 (71.2%) are family households, while 78 (28.8%) are nonfamily households. The most numerous type of family households are 3-person households, comprising 66, and the most common type of nonfamily households are 1-person households, comprising 43.
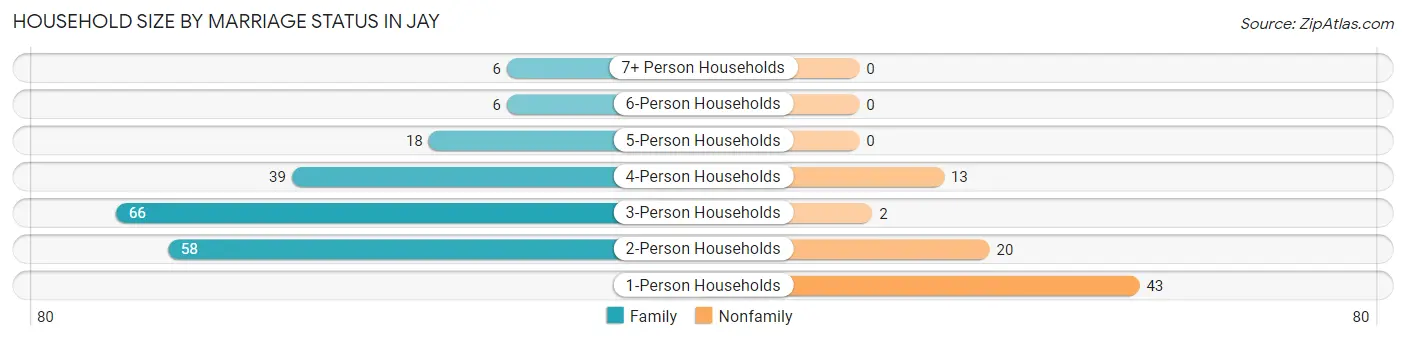
| Household Size | Family Households | Nonfamily Households |
| 1-Person Households | - | 43 (15.9%) |
| 2-Person Households | 58 (21.4%) | 20 (7.4%) |
| 3-Person Households | 66 (24.3%) | 2 (0.7%) |
| 4-Person Households | 39 (14.4%) | 13 (4.8%) |
| 5-Person Households | 18 (6.6%) | 0 (0.0%) |
| 6-Person Households | 6 (2.2%) | 0 (0.0%) |
| 7+ Person Households | 6 (2.2%) | 0 (0.0%) |
| Total | 193 (71.2%) | 78 (28.8%) |
Female Fertility in Jay
Fertility by Age in Jay
Average fertility rate in Jay is 42.0 births per 1,000 women. Women in the age bracket of 20 to 34 years have the highest fertility rate with 77.0 births per 1,000 women. Women in the age bracket of 20 to 34 years acount for 60.0% of all women with births.
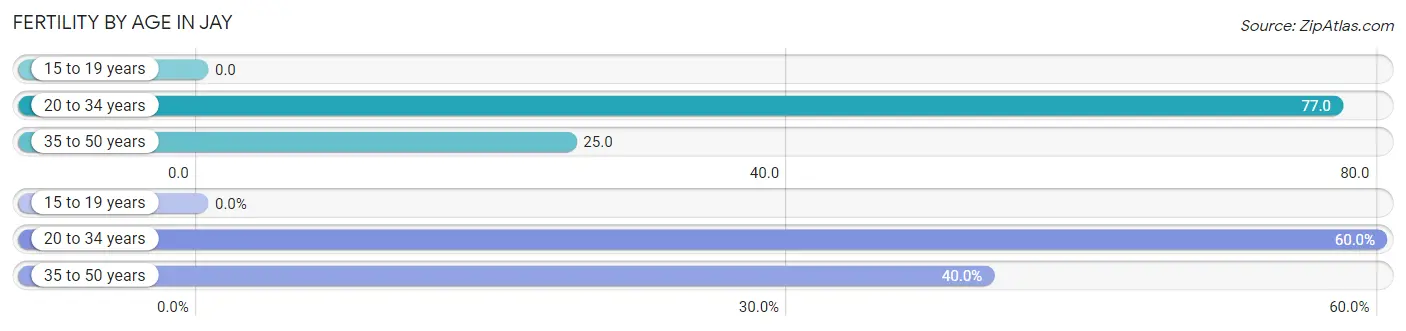
| Age Bracket | Women with Births | Births / 1,000 Women |
| 15 to 19 years | 0 (0.0%) | 0.0 |
| 20 to 34 years | 3 (60.0%) | 77.0 |
| 35 to 50 years | 2 (40.0%) | 25.0 |
| Total | 5 (100.0%) | 42.0 |
Fertility by Age by Marriage Status in Jay
40.0% of women with births (5) in Jay are married. The highest percentage of unmarried women with births falls into 35 to 50 years age bracket with 100.0% of them unmarried at the time of birth, while the lowest percentage of unmarried women with births belong to 20 to 34 years age bracket with 33.3% of them unmarried.
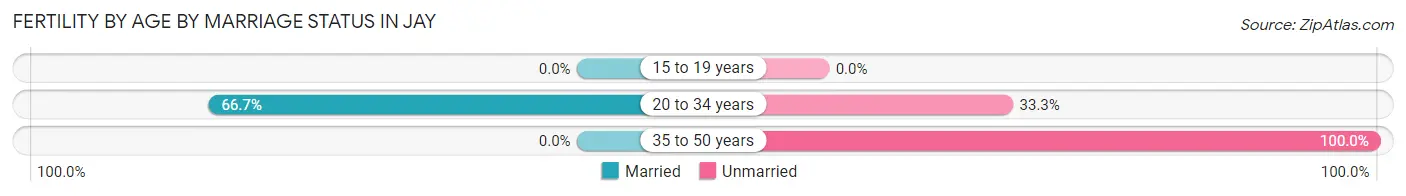
| Age Bracket | Married | Unmarried |
| 15 to 19 years | 0 (0.0%) | 0 (0.0%) |
| 20 to 34 years | 2 (66.7%) | 1 (33.3%) |
| 35 to 50 years | 0 (0.0%) | 2 (100.0%) |
| Total | 2 (40.0%) | 3 (60.0%) |
Fertility by Education in Jay
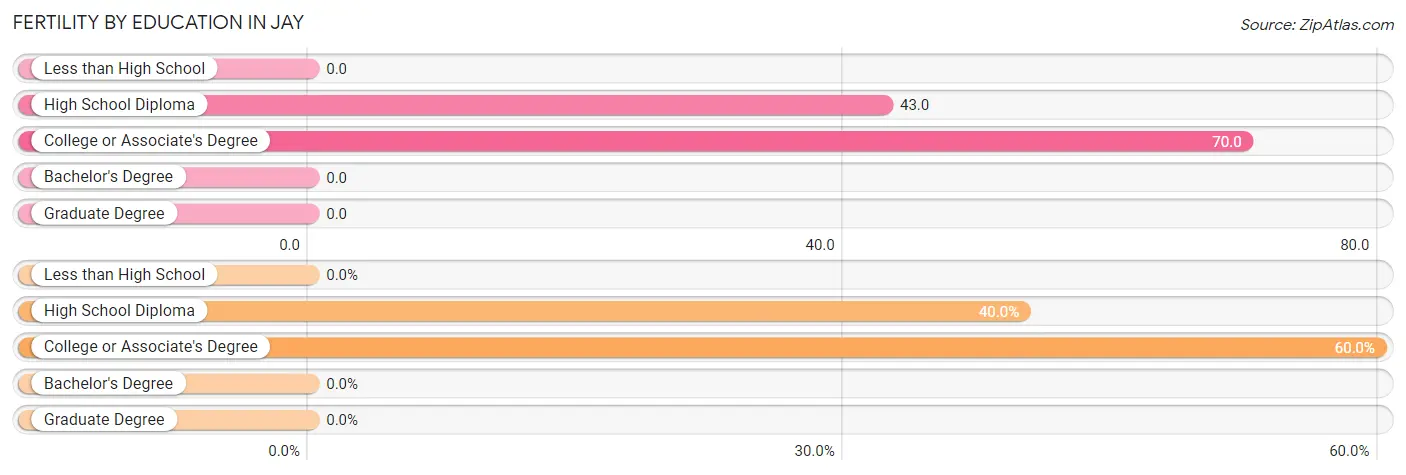
| Educational Attainment | Women with Births | Births / 1,000 Women |
| Less than High School | 0 (0.0%) | 0.0 |
| High School Diploma | 2 (40.0%) | 43.0 |
| College or Associate's Degree | 3 (60.0%) | 70.0 |
| Bachelor's Degree | 0 (0.0%) | 0.0 |
| Graduate Degree | 0 (0.0%) | 0.0 |
| Total | 5 (100.0%) | 42.0 |
Fertility by Education by Marriage Status in Jay
60.0% of women with births in Jay are unmarried. Women with the educational attainment of college or associate's degree are most likely to be married with 66.7% of them married at childbirth, while women with the educational attainment of high school diploma are least likely to be married with 100.0% of them unmarried at childbirth.
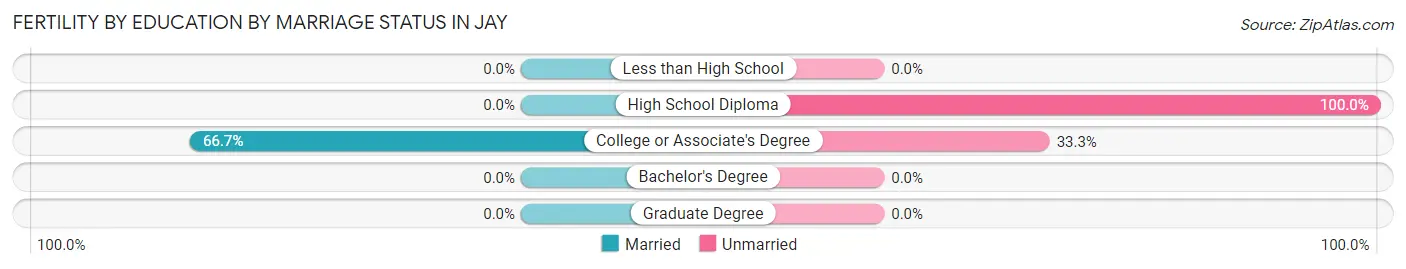
| Educational Attainment | Married | Unmarried |
| Less than High School | 0 (0.0%) | 0 (0.0%) |
| High School Diploma | 0 (0.0%) | 2 (100.0%) |
| College or Associate's Degree | 2 (66.7%) | 1 (33.3%) |
| Bachelor's Degree | 0 (0.0%) | 0 (0.0%) |
| Graduate Degree | 0 (0.0%) | 0 (0.0%) |
| Total | 2 (40.0%) | 3 (60.0%) |
Employment Characteristics in Jay
Employment by Class of Employer in Jay
Among the 256 employed individuals in Jay, private company employees (172 | 67.2%), self-employed (not incorporated) (27 | 10.5%), and not-for-profit organizations (20 | 7.8%) make up the most common classes of employment.
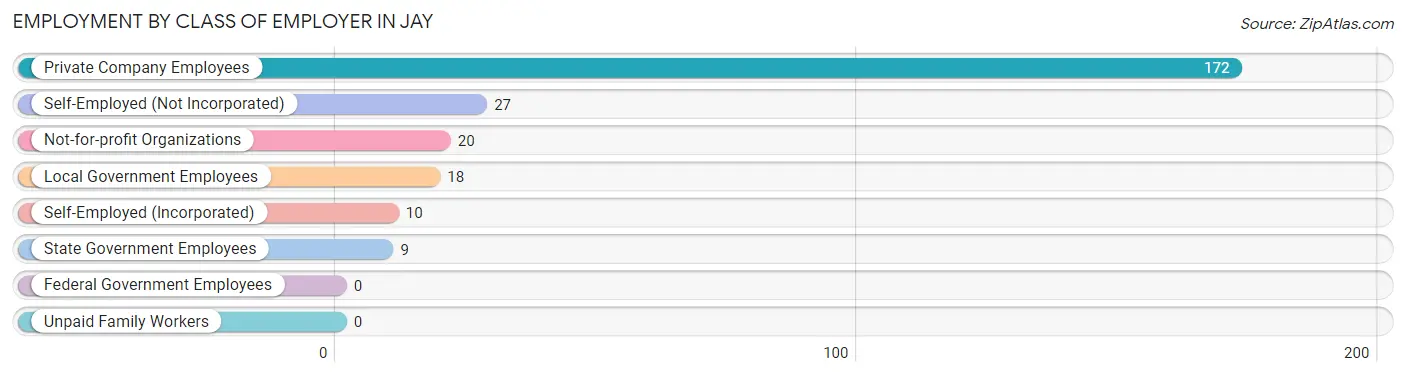
| Employer Class | # Employees | % Employees |
| Private Company Employees | 172 | 67.2% |
| Self-Employed (Incorporated) | 10 | 3.9% |
| Self-Employed (Not Incorporated) | 27 | 10.5% |
| Not-for-profit Organizations | 20 | 7.8% |
| Local Government Employees | 18 | 7.0% |
| State Government Employees | 9 | 3.5% |
| Federal Government Employees | 0 | 0.0% |
| Unpaid Family Workers | 0 | 0.0% |
| Total | 256 | 100.0% |
Employment Status by Age in Jay
According to the labor force statistics for Jay, out of the total population over 16 years of age (581), 52.5% or 305 individuals are in the labor force, with 10.2% or 31 of them unemployed. The age group with the highest labor force participation rate is 30 to 34 years, with 89.6% or 43 individuals in the labor force. Within the labor force, the 45 to 54 years age range has the highest percentage of unemployed individuals, with 37.7% or 26 of them being unemployed.
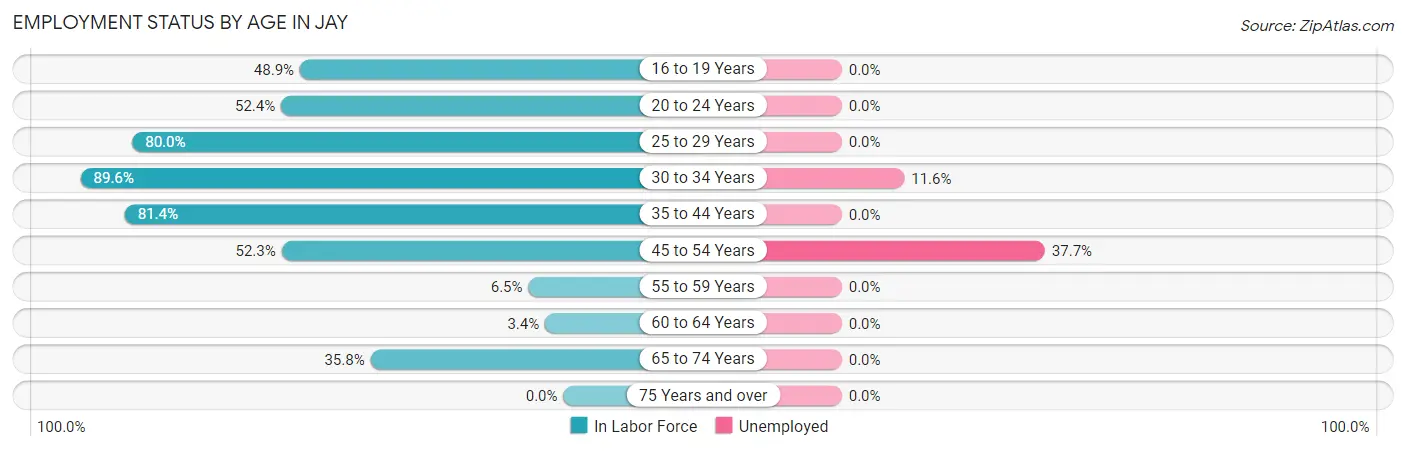
| Age Bracket | In Labor Force | Unemployed |
| 16 to 19 Years | 23 (48.9%) | 0 (0.0%) |
| 20 to 24 Years | 22 (52.4%) | 0 (0.0%) |
| 25 to 29 Years | 28 (80.0%) | 0 (0.0%) |
| 30 to 34 Years | 43 (89.6%) | 5 (11.6%) |
| 35 to 44 Years | 92 (81.4%) | 0 (0.0%) |
| 45 to 54 Years | 69 (52.3%) | 26 (37.7%) |
| 55 to 59 Years | 3 (6.5%) | 0 (0.0%) |
| 60 to 64 Years | 1 (3.4%) | 0 (0.0%) |
| 65 to 74 Years | 24 (35.8%) | 0 (0.0%) |
| 75 Years and over | 0 (0.0%) | 0 (0.0%) |
| Total | 305 (52.5%) | 31 (10.2%) |
Employment Status by Educational Attainment in Jay
According to labor force statistics for Jay, 58.6% of individuals (236) out of the total population between 25 and 64 years of age (403) are in the labor force, with 13.1% or 31 of them being unemployed. The group with the highest labor force participation rate are those with the educational attainment of bachelor's degree or higher, with 82.9% or 29 individuals in the labor force. Within the labor force, individuals with less than high school education have the highest percentage of unemployment, with 44.8% or 26 of them being unemployed.
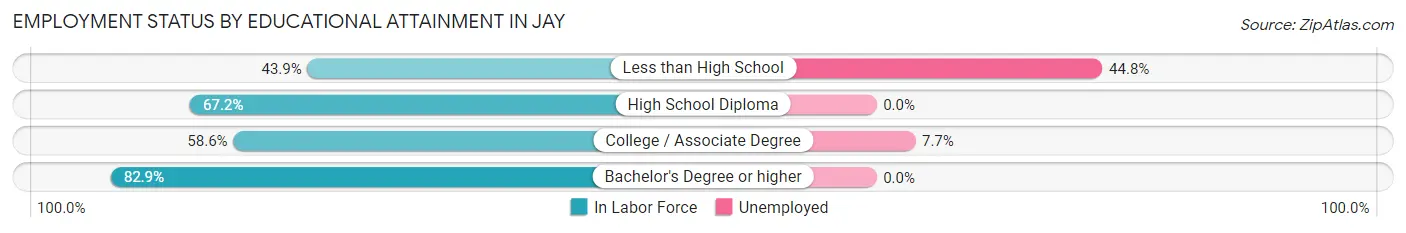
| Educational Attainment | In Labor Force | Unemployed |
| Less than High School | 58 (43.9%) | 59 (44.8%) |
| High School Diploma | 84 (67.2%) | 0 (0.0%) |
| College / Associate Degree | 65 (58.6%) | 9 (7.7%) |
| Bachelor's Degree or higher | 29 (82.9%) | 0 (0.0%) |
| Total | 236 (58.6%) | 53 (13.1%) |
Employment Occupations by Sex in Jay
Management, Business, Science and Arts Occupations
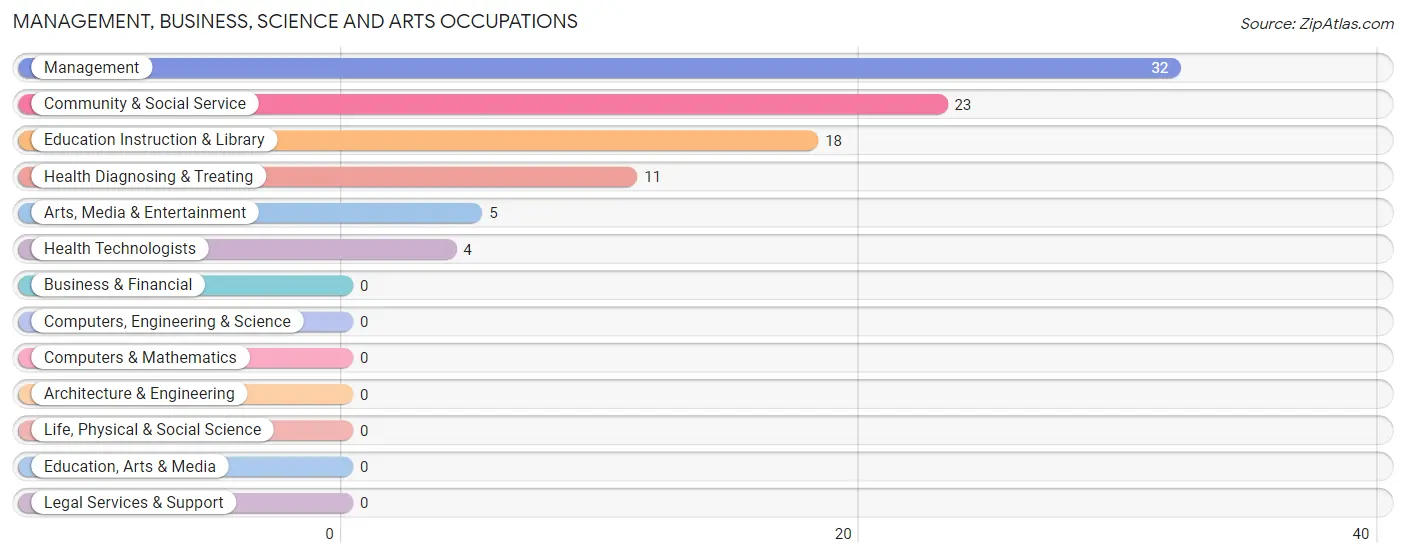
The most common Management, Business, Science and Arts occupations in Jay are Management (32 | 11.7%), Community & Social Service (23 | 8.4%), Education Instruction & Library (18 | 6.6%), Health Diagnosing & Treating (11 | 4.0%), and Arts, Media & Entertainment (5 | 1.8%).
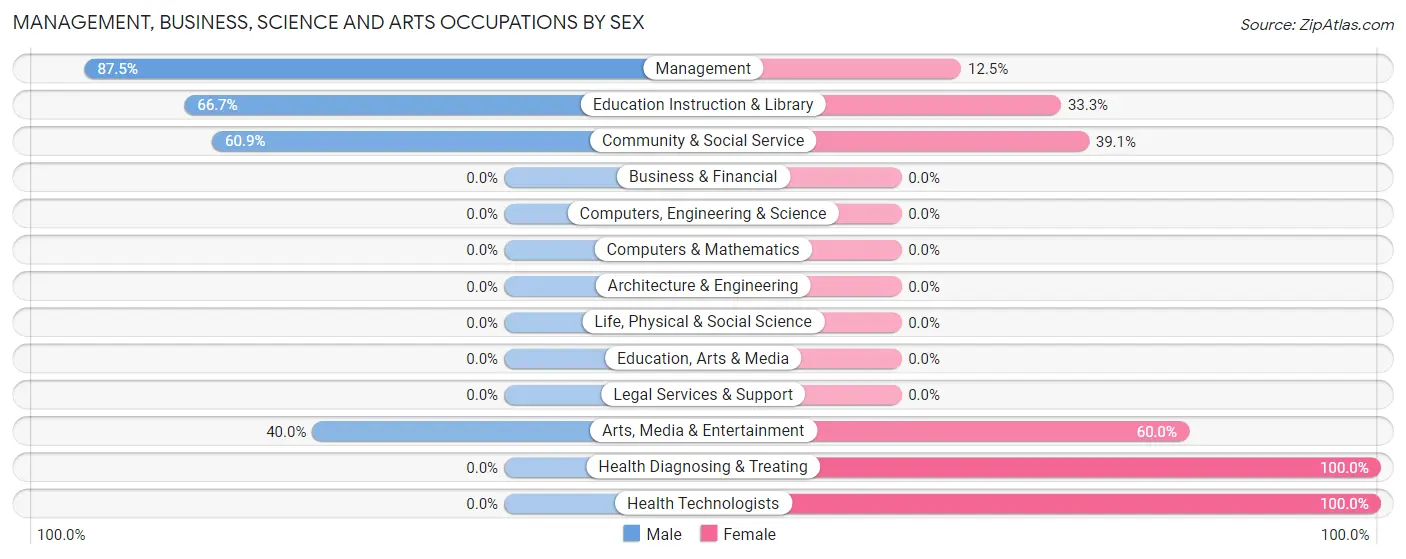
Management, Business, Science and Arts Occupations by Sex
Within the Management, Business, Science and Arts occupations in Jay, the most male-oriented occupations are Management (87.5%), Education Instruction & Library (66.7%), and Community & Social Service (60.9%), while the most female-oriented occupations are Health Diagnosing & Treating (100.0%), Health Technologists (100.0%), and Arts, Media & Entertainment (60.0%).
| Occupation | Male | Female |
| Management | 28 (87.5%) | 4 (12.5%) |
| Business & Financial | 0 (0.0%) | 0 (0.0%) |
| Computers, Engineering & Science | 0 (0.0%) | 0 (0.0%) |
| Computers & Mathematics | 0 (0.0%) | 0 (0.0%) |
| Architecture & Engineering | 0 (0.0%) | 0 (0.0%) |
| Life, Physical & Social Science | 0 (0.0%) | 0 (0.0%) |
| Community & Social Service | 14 (60.9%) | 9 (39.1%) |
| Education, Arts & Media | 0 (0.0%) | 0 (0.0%) |
| Legal Services & Support | 0 (0.0%) | 0 (0.0%) |
| Education Instruction & Library | 12 (66.7%) | 6 (33.3%) |
| Arts, Media & Entertainment | 2 (40.0%) | 3 (60.0%) |
| Health Diagnosing & Treating | 0 (0.0%) | 11 (100.0%) |
| Health Technologists | 0 (0.0%) | 4 (100.0%) |
| Total (Category) | 42 (63.6%) | 24 (36.4%) |
| Total (Overall) | 179 (65.3%) | 95 (34.7%) |
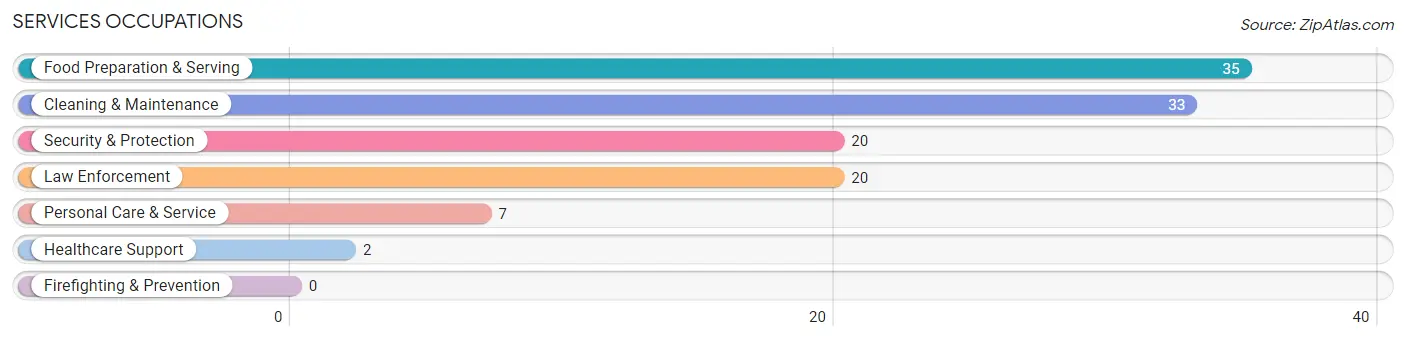
Services Occupations
The most common Services occupations in Jay are Food Preparation & Serving (35 | 12.8%), Cleaning & Maintenance (33 | 12.0%), Security & Protection (20 | 7.3%), Law Enforcement (20 | 7.3%), and Personal Care & Service (7 | 2.5%).
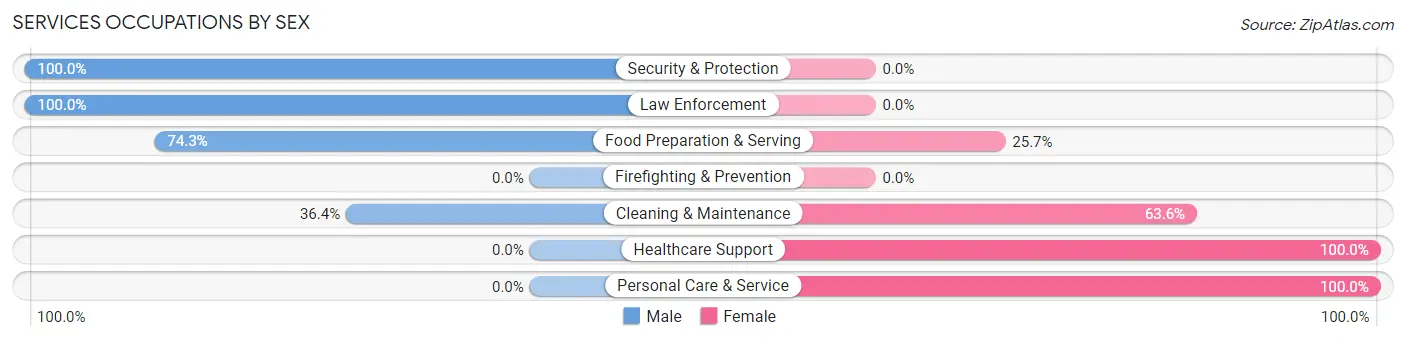
Services Occupations by Sex
Within the Services occupations in Jay, the most male-oriented occupations are Security & Protection (100.0%), Law Enforcement (100.0%), and Food Preparation & Serving (74.3%), while the most female-oriented occupations are Healthcare Support (100.0%), Personal Care & Service (100.0%), and Cleaning & Maintenance (63.6%).
| Occupation | Male | Female |
| Healthcare Support | 0 (0.0%) | 2 (100.0%) |
| Security & Protection | 20 (100.0%) | 0 (0.0%) |
| Firefighting & Prevention | 0 (0.0%) | 0 (0.0%) |
| Law Enforcement | 20 (100.0%) | 0 (0.0%) |
| Food Preparation & Serving | 26 (74.3%) | 9 (25.7%) |
| Cleaning & Maintenance | 12 (36.4%) | 21 (63.6%) |
| Personal Care & Service | 0 (0.0%) | 7 (100.0%) |
| Total (Category) | 58 (59.8%) | 39 (40.2%) |
| Total (Overall) | 179 (65.3%) | 95 (34.7%) |
Sales and Office Occupations
The most common Sales and Office occupations in Jay are Sales & Related (32 | 11.7%), and Office & Administration (23 | 8.4%).
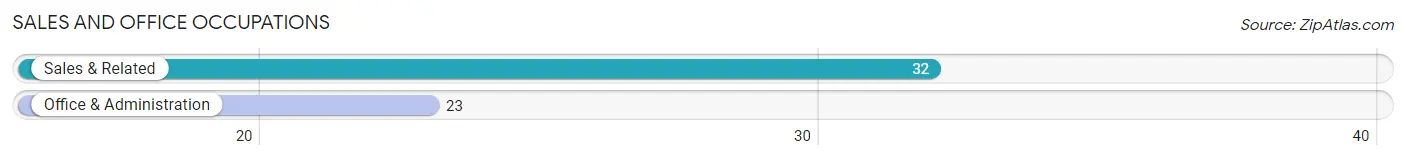
Sales and Office Occupations by Sex
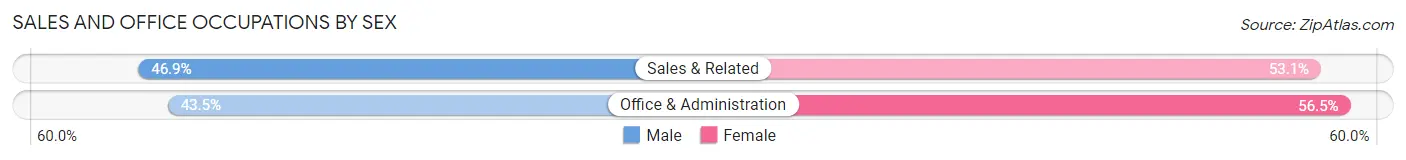
| Occupation | Male | Female |
| Sales & Related | 15 (46.9%) | 17 (53.1%) |
| Office & Administration | 10 (43.5%) | 13 (56.5%) |
| Total (Category) | 25 (45.5%) | 30 (54.5%) |
| Total (Overall) | 179 (65.3%) | 95 (34.7%) |
Natural Resources, Construction and Maintenance Occupations
The most common Natural Resources, Construction and Maintenance occupations in Jay are Construction & Extraction (18 | 6.6%), Installation, Maintenance & Repair (6 | 2.2%), and Farming, Fishing & Forestry (4 | 1.5%).
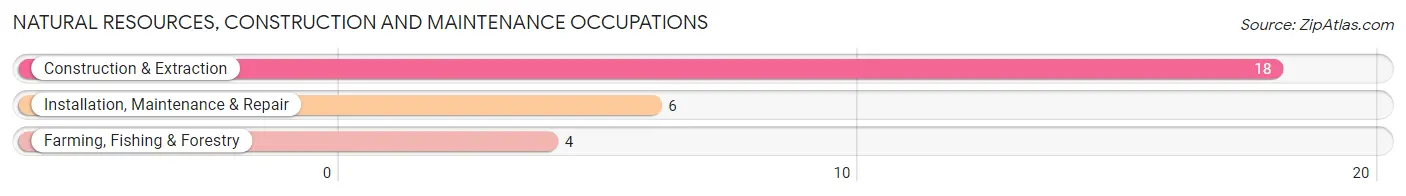
Natural Resources, Construction and Maintenance Occupations by Sex
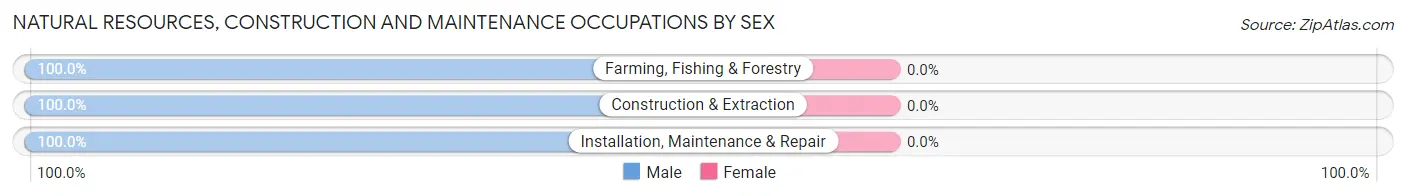
| Occupation | Male | Female |
| Farming, Fishing & Forestry | 4 (100.0%) | 0 (0.0%) |
| Construction & Extraction | 18 (100.0%) | 0 (0.0%) |
| Installation, Maintenance & Repair | 6 (100.0%) | 0 (0.0%) |
| Total (Category) | 28 (100.0%) | 0 (0.0%) |
| Total (Overall) | 179 (65.3%) | 95 (34.7%) |
Production, Transportation and Moving Occupations
The most common Production, Transportation and Moving occupations in Jay are Transportation (17 | 6.2%), Production (6 | 2.2%), and Material Moving (5 | 1.8%).
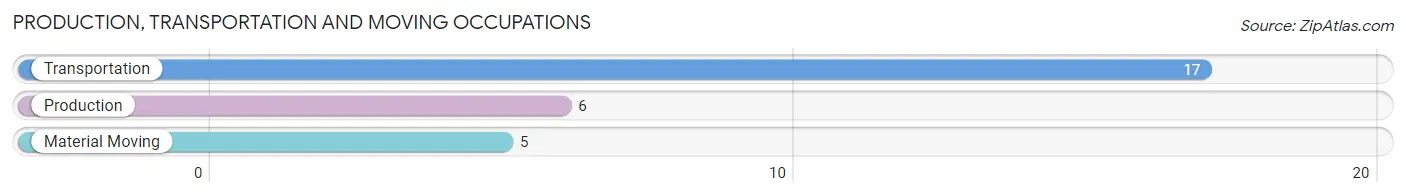
Production, Transportation and Moving Occupations by Sex
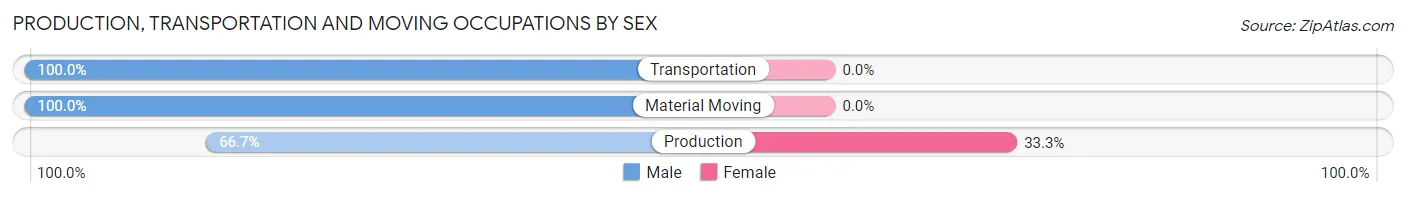
| Occupation | Male | Female |
| Production | 4 (66.7%) | 2 (33.3%) |
| Transportation | 17 (100.0%) | 0 (0.0%) |
| Material Moving | 5 (100.0%) | 0 (0.0%) |
| Total (Category) | 26 (92.9%) | 2 (7.1%) |
| Total (Overall) | 179 (65.3%) | 95 (34.7%) |
Employment Industries by Sex in Jay
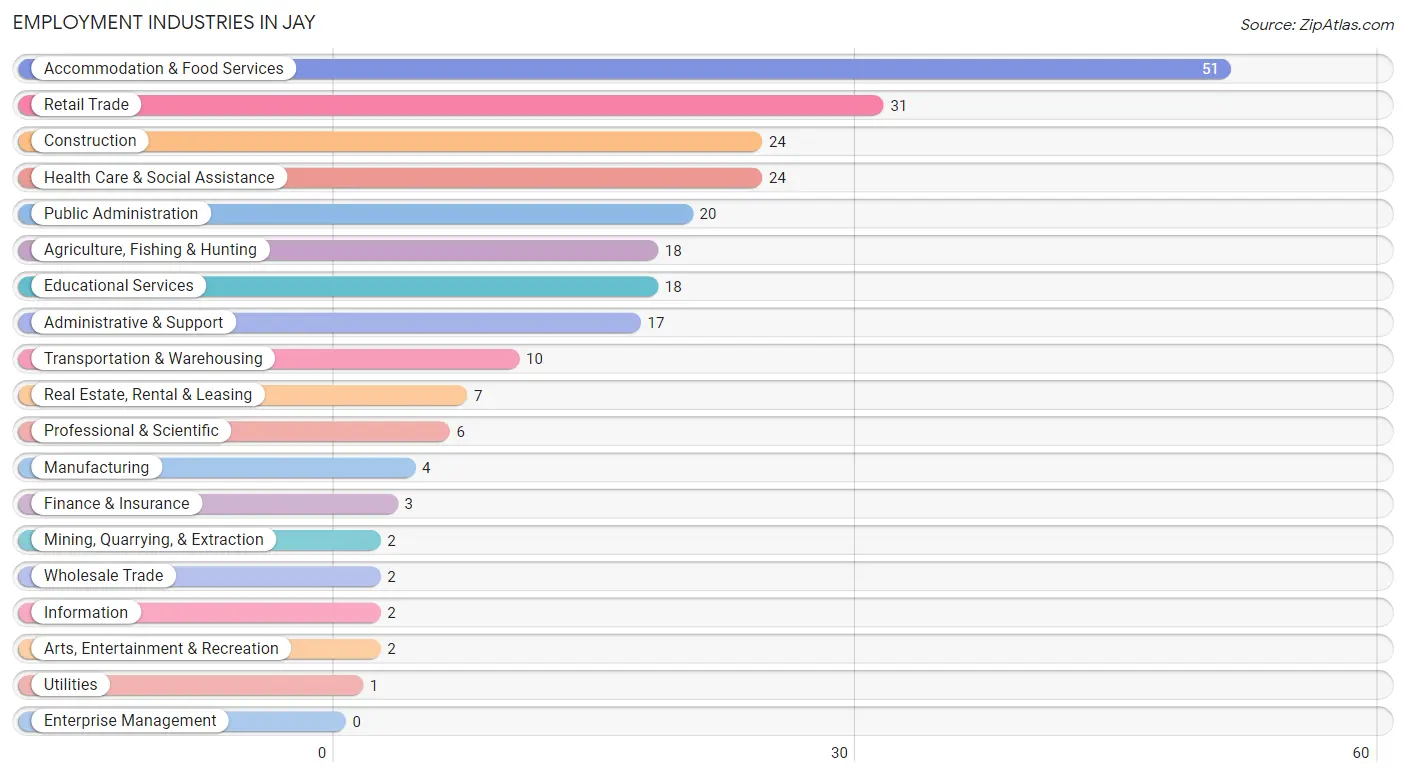
Employment Industries in Jay
The major employment industries in Jay include Accommodation & Food Services (51 | 18.6%), Retail Trade (31 | 11.3%), Construction (24 | 8.8%), Health Care & Social Assistance (24 | 8.8%), and Public Administration (20 | 7.3%).
Employment Industries by Sex in Jay
The Jay industries that see more men than women are Mining, Quarrying, & Extraction (100.0%), Construction (100.0%), and Manufacturing (100.0%), whereas the industries that tend to have a higher number of women are Utilities (100.0%), Finance & Insurance (100.0%), and Professional & Scientific (100.0%).
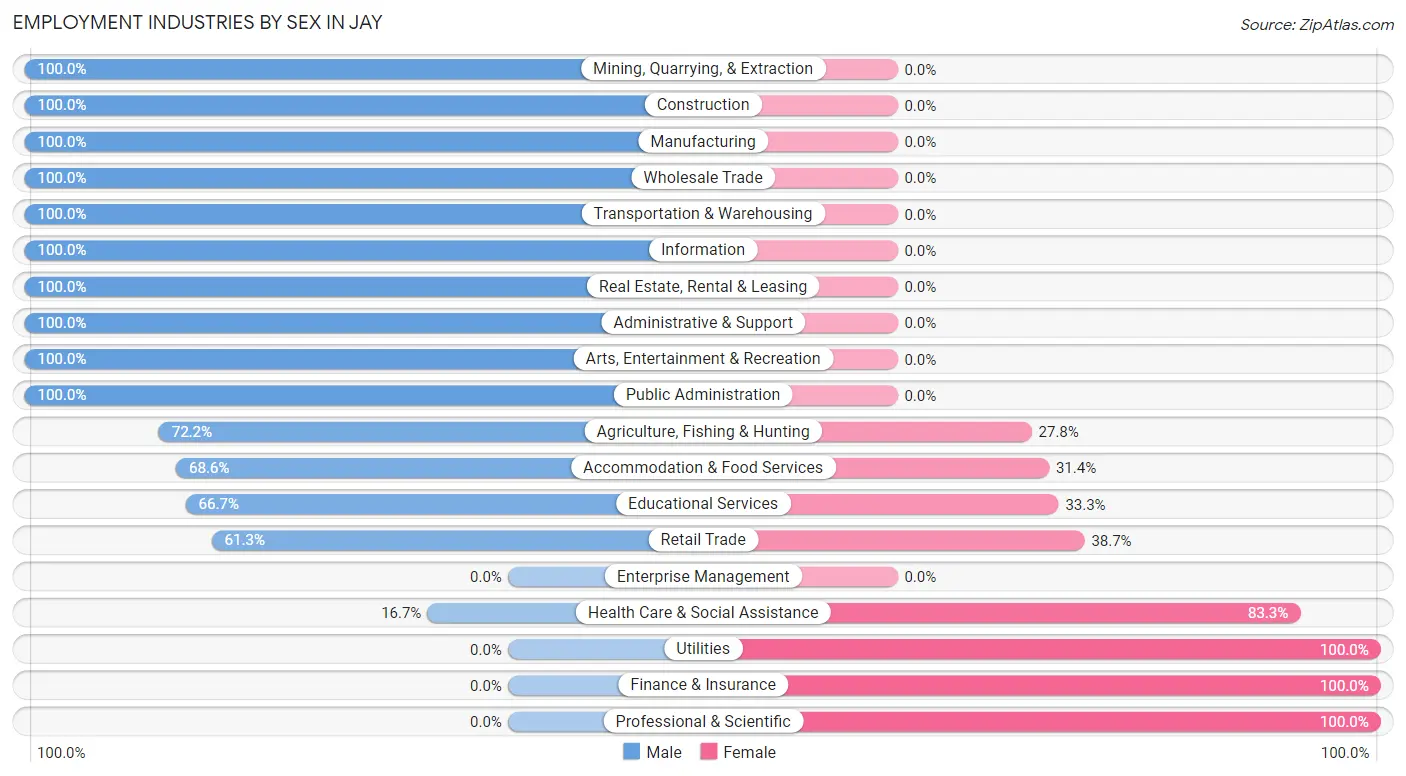
| Industry | Male | Female |
| Agriculture, Fishing & Hunting | 13 (72.2%) | 5 (27.8%) |
| Mining, Quarrying, & Extraction | 2 (100.0%) | 0 (0.0%) |
| Construction | 24 (100.0%) | 0 (0.0%) |
| Manufacturing | 4 (100.0%) | 0 (0.0%) |
| Wholesale Trade | 2 (100.0%) | 0 (0.0%) |
| Retail Trade | 19 (61.3%) | 12 (38.7%) |
| Transportation & Warehousing | 10 (100.0%) | 0 (0.0%) |
| Utilities | 0 (0.0%) | 1 (100.0%) |
| Information | 2 (100.0%) | 0 (0.0%) |
| Finance & Insurance | 0 (0.0%) | 3 (100.0%) |
| Real Estate, Rental & Leasing | 7 (100.0%) | 0 (0.0%) |
| Professional & Scientific | 0 (0.0%) | 6 (100.0%) |
| Enterprise Management | 0 (0.0%) | 0 (0.0%) |
| Administrative & Support | 17 (100.0%) | 0 (0.0%) |
| Educational Services | 12 (66.7%) | 6 (33.3%) |
| Health Care & Social Assistance | 4 (16.7%) | 20 (83.3%) |
| Arts, Entertainment & Recreation | 2 (100.0%) | 0 (0.0%) |
| Accommodation & Food Services | 35 (68.6%) | 16 (31.4%) |
| Public Administration | 20 (100.0%) | 0 (0.0%) |
| Total | 179 (65.3%) | 95 (34.7%) |
Education in Jay
School Enrollment in Jay
The most common levels of schooling among the 223 students in Jay are middle school (64 | 28.7%), elementary school (50 | 22.4%), and high school (44 | 19.7%).
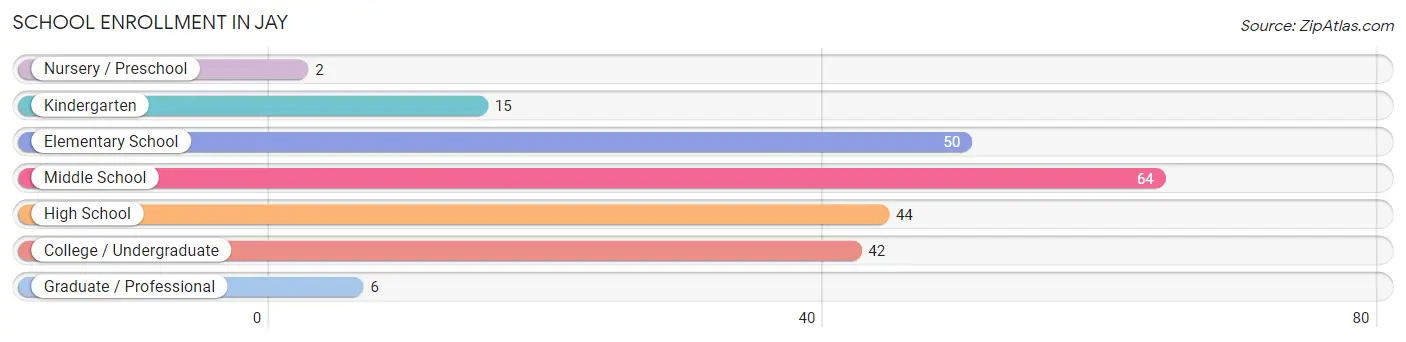
| School Level | # Students | % Students |
| Nursery / Preschool | 2 | 0.9% |
| Kindergarten | 15 | 6.7% |
| Elementary School | 50 | 22.4% |
| Middle School | 64 | 28.7% |
| High School | 44 | 19.7% |
| College / Undergraduate | 42 | 18.8% |
| Graduate / Professional | 6 | 2.7% |
| Total | 223 | 100.0% |
School Enrollment by Age by Funding Source in Jay
Out of a total of 223 students who are enrolled in schools in Jay, 57 (25.6%) attend a private institution, while the remaining 166 (74.4%) are enrolled in public schools. The age group of 3 to 4 year olds has the highest likelihood of being enrolled in private schools, with 2 (100.0% in the age bracket) enrolled. Conversely, the age group of 15 to 17 year olds has the lowest likelihood of being enrolled in a private school, with 18 (100.0% in the age bracket) attending a public institution.
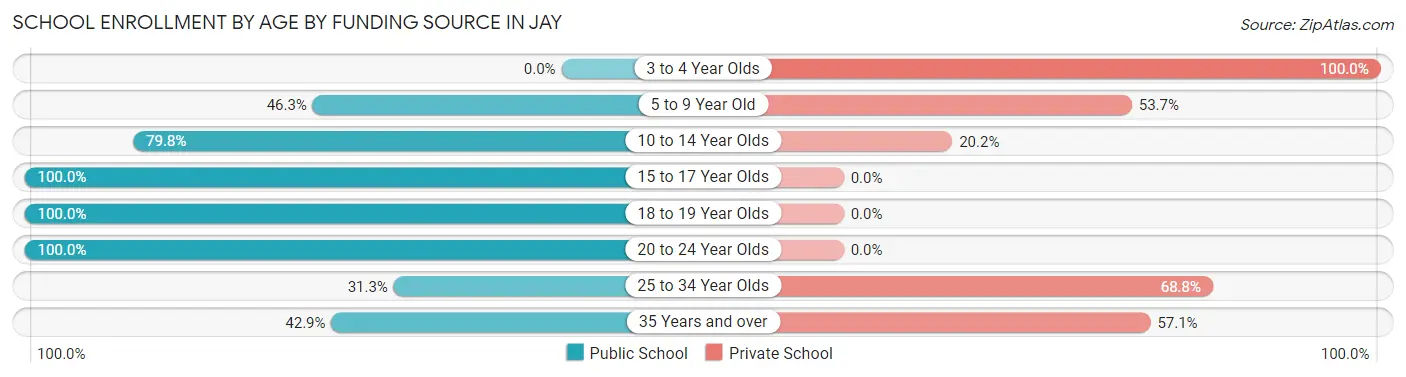
| Age Bracket | Public School | Private School |
| 3 to 4 Year Olds | 0 (0.0%) | 2 (100.0%) |
| 5 to 9 Year Old | 19 (46.3%) | 22 (53.7%) |
| 10 to 14 Year Olds | 71 (79.8%) | 18 (20.2%) |
| 15 to 17 Year Olds | 18 (100.0%) | 0 (0.0%) |
| 18 to 19 Year Olds | 32 (100.0%) | 0 (0.0%) |
| 20 to 24 Year Olds | 18 (100.0%) | 0 (0.0%) |
| 25 to 34 Year Olds | 5 (31.2%) | 11 (68.8%) |
| 35 Years and over | 3 (42.9%) | 4 (57.1%) |
| Total | 166 (74.4%) | 57 (25.6%) |
Educational Attainment by Field of Study in Jay
Education (19 | 36.5%), liberal arts & history (8 | 15.4%), computers & mathematics (5 | 9.6%), physical & health sciences (4 | 7.7%), and arts & humanities (4 | 7.7%) are the most common fields of study among 52 individuals in Jay who have obtained a bachelor's degree or higher.
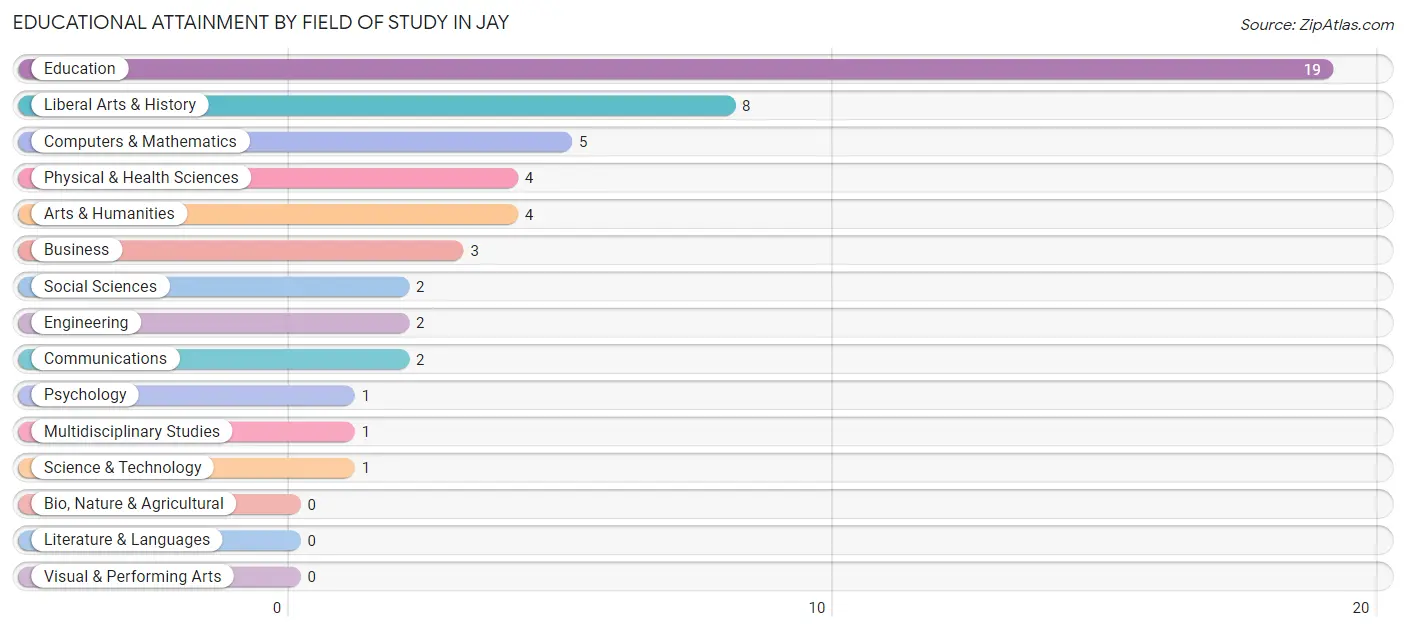
| Field of Study | # Graduates | % Graduates |
| Computers & Mathematics | 5 | 9.6% |
| Bio, Nature & Agricultural | 0 | 0.0% |
| Physical & Health Sciences | 4 | 7.7% |
| Psychology | 1 | 1.9% |
| Social Sciences | 2 | 3.8% |
| Engineering | 2 | 3.8% |
| Multidisciplinary Studies | 1 | 1.9% |
| Science & Technology | 1 | 1.9% |
| Business | 3 | 5.8% |
| Education | 19 | 36.5% |
| Literature & Languages | 0 | 0.0% |
| Liberal Arts & History | 8 | 15.4% |
| Visual & Performing Arts | 0 | 0.0% |
| Communications | 2 | 3.8% |
| Arts & Humanities | 4 | 7.7% |
| Total | 52 | 100.0% |
Transportation & Commute in Jay
Vehicle Availability by Sex in Jay
The most prevalent vehicle ownership categories in Jay are males with 2 vehicles (64, accounting for 35.7%) and females with 2 vehicles (29, making up 83.1%).
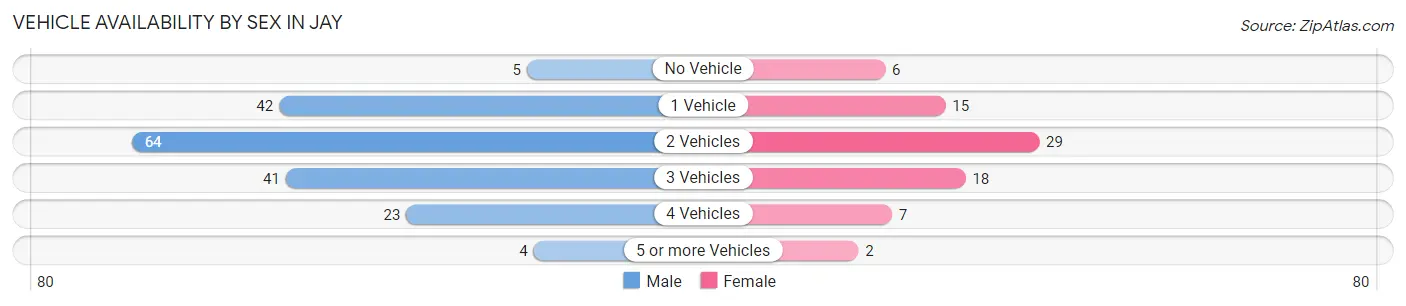
| Vehicles Available | Male | Female |
| No Vehicle | 5 (2.8%) | 6 (7.8%) |
| 1 Vehicle | 42 (23.5%) | 15 (19.5%) |
| 2 Vehicles | 64 (35.7%) | 29 (37.7%) |
| 3 Vehicles | 41 (22.9%) | 18 (23.4%) |
| 4 Vehicles | 23 (12.9%) | 7 (9.1%) |
| 5 or more Vehicles | 4 (2.2%) | 2 (2.6%) |
| Total | 179 (100.0%) | 77 (100.0%) |
Commute Time in Jay
The most frequently occuring commute durations in Jay are 20 to 24 minutes (40 commuters, 16.9%), less than 5 minutes (35 commuters, 14.8%), and 5 to 9 minutes (32 commuters, 13.5%).
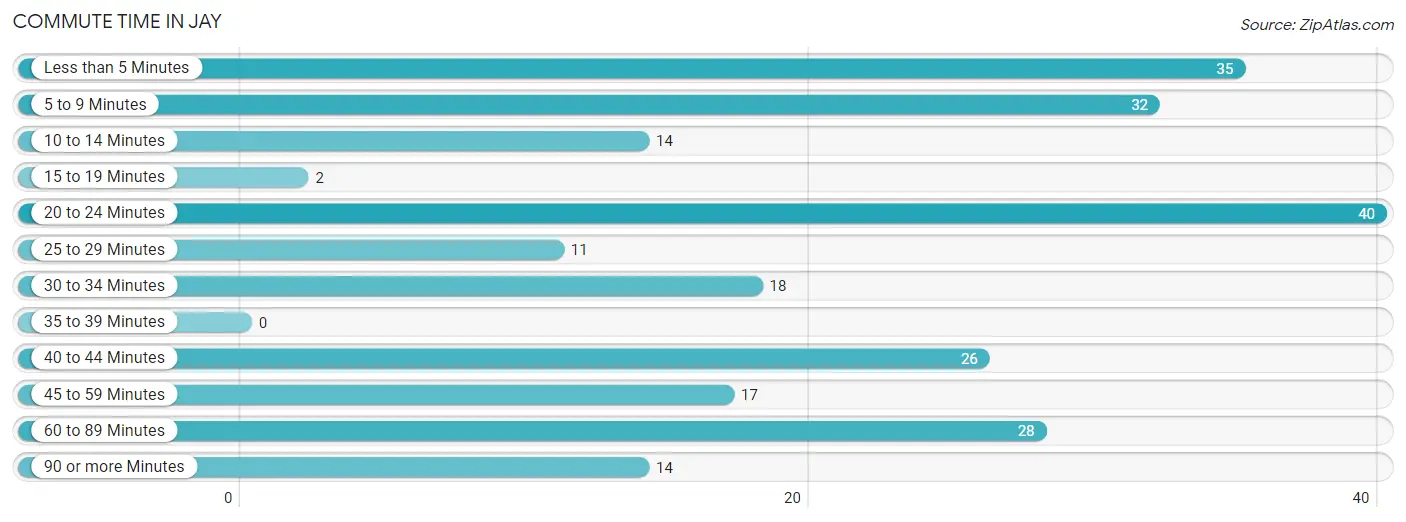
| Commute Time | # Commuters | % Commuters |
| Less than 5 Minutes | 35 | 14.8% |
| 5 to 9 Minutes | 32 | 13.5% |
| 10 to 14 Minutes | 14 | 5.9% |
| 15 to 19 Minutes | 2 | 0.8% |
| 20 to 24 Minutes | 40 | 16.9% |
| 25 to 29 Minutes | 11 | 4.6% |
| 30 to 34 Minutes | 18 | 7.6% |
| 35 to 39 Minutes | 0 | 0.0% |
| 40 to 44 Minutes | 26 | 11.0% |
| 45 to 59 Minutes | 17 | 7.2% |
| 60 to 89 Minutes | 28 | 11.8% |
| 90 or more Minutes | 14 | 5.9% |
Commute Time by Sex in Jay
The most common commute times in Jay are 20 to 24 minutes (38 commuters, 22.1%) for males and 60 to 89 minutes (16 commuters, 24.6%) for females.
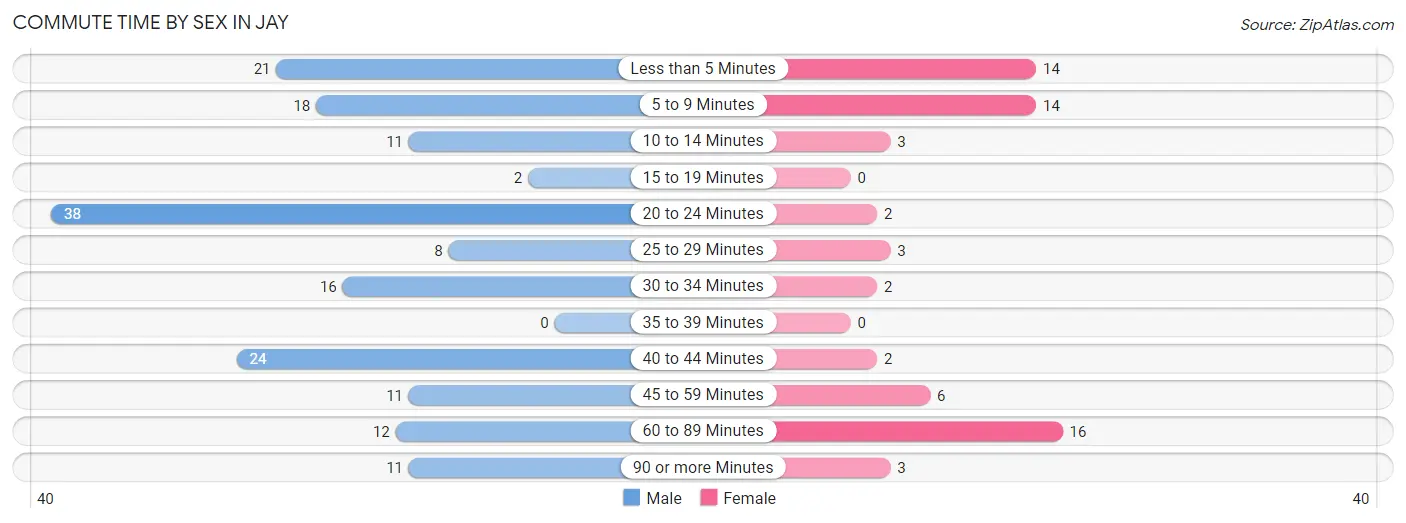
| Commute Time | Male | Female |
| Less than 5 Minutes | 21 (12.2%) | 14 (21.5%) |
| 5 to 9 Minutes | 18 (10.5%) | 14 (21.5%) |
| 10 to 14 Minutes | 11 (6.4%) | 3 (4.6%) |
| 15 to 19 Minutes | 2 (1.2%) | 0 (0.0%) |
| 20 to 24 Minutes | 38 (22.1%) | 2 (3.1%) |
| 25 to 29 Minutes | 8 (4.6%) | 3 (4.6%) |
| 30 to 34 Minutes | 16 (9.3%) | 2 (3.1%) |
| 35 to 39 Minutes | 0 (0.0%) | 0 (0.0%) |
| 40 to 44 Minutes | 24 (14.0%) | 2 (3.1%) |
| 45 to 59 Minutes | 11 (6.4%) | 6 (9.2%) |
| 60 to 89 Minutes | 12 (7.0%) | 16 (24.6%) |
| 90 or more Minutes | 11 (6.4%) | 3 (4.6%) |
Time of Departure to Work by Sex in Jay
The most frequent times of departure to work in Jay are 7:00 AM to 7:29 AM (27, 15.7%) for males and 7:00 AM to 7:29 AM (15, 23.1%) for females.
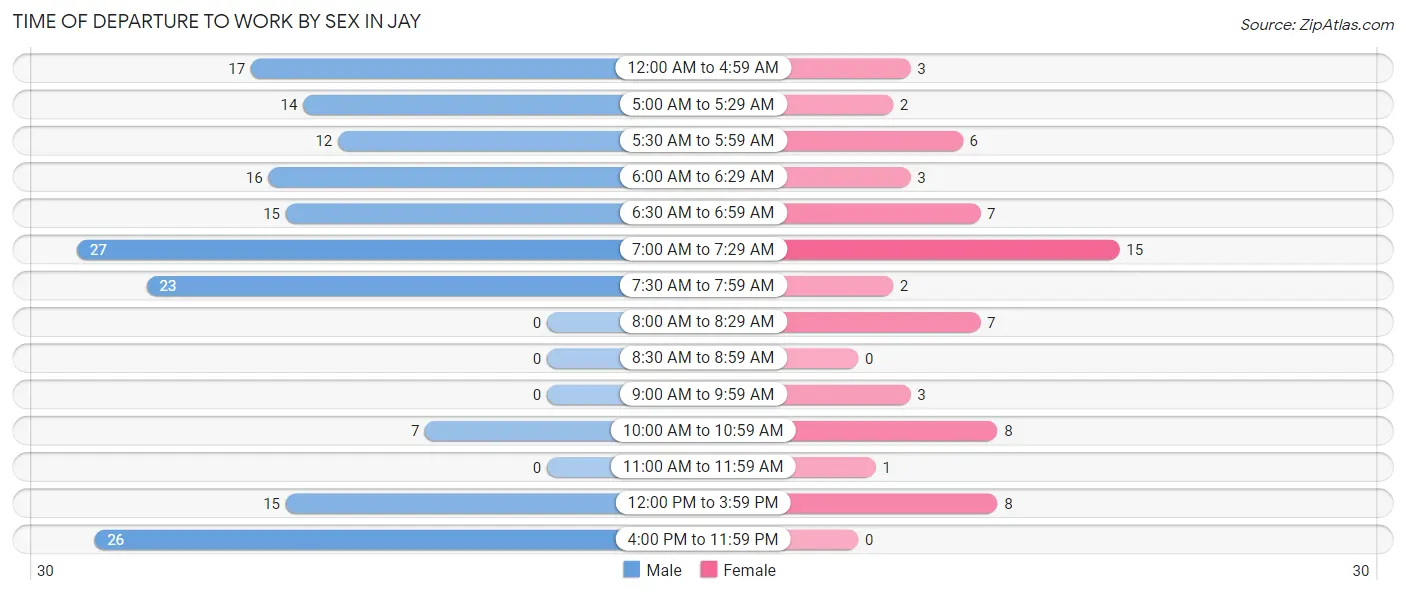
| Time of Departure | Male | Female |
| 12:00 AM to 4:59 AM | 17 (9.9%) | 3 (4.6%) |
| 5:00 AM to 5:29 AM | 14 (8.1%) | 2 (3.1%) |
| 5:30 AM to 5:59 AM | 12 (7.0%) | 6 (9.2%) |
| 6:00 AM to 6:29 AM | 16 (9.3%) | 3 (4.6%) |
| 6:30 AM to 6:59 AM | 15 (8.7%) | 7 (10.8%) |
| 7:00 AM to 7:29 AM | 27 (15.7%) | 15 (23.1%) |
| 7:30 AM to 7:59 AM | 23 (13.4%) | 2 (3.1%) |
| 8:00 AM to 8:29 AM | 0 (0.0%) | 7 (10.8%) |
| 8:30 AM to 8:59 AM | 0 (0.0%) | 0 (0.0%) |
| 9:00 AM to 9:59 AM | 0 (0.0%) | 3 (4.6%) |
| 10:00 AM to 10:59 AM | 7 (4.1%) | 8 (12.3%) |
| 11:00 AM to 11:59 AM | 0 (0.0%) | 1 (1.5%) |
| 12:00 PM to 3:59 PM | 15 (8.7%) | 8 (12.3%) |
| 4:00 PM to 11:59 PM | 26 (15.1%) | 0 (0.0%) |
| Total | 172 (100.0%) | 65 (100.0%) |
Housing Occupancy in Jay
Occupancy by Ownership in Jay
Of the total 271 dwellings in Jay, owner-occupied units account for 118 (43.5%), while renter-occupied units make up 153 (56.5%).
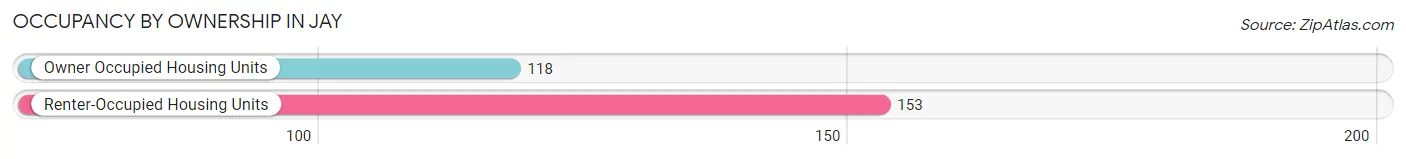
| Occupancy | # Housing Units | % Housing Units |
| Owner Occupied Housing Units | 118 | 43.5% |
| Renter-Occupied Housing Units | 153 | 56.5% |
| Total Occupied Housing Units | 271 | 100.0% |
Occupancy by Household Size in Jay
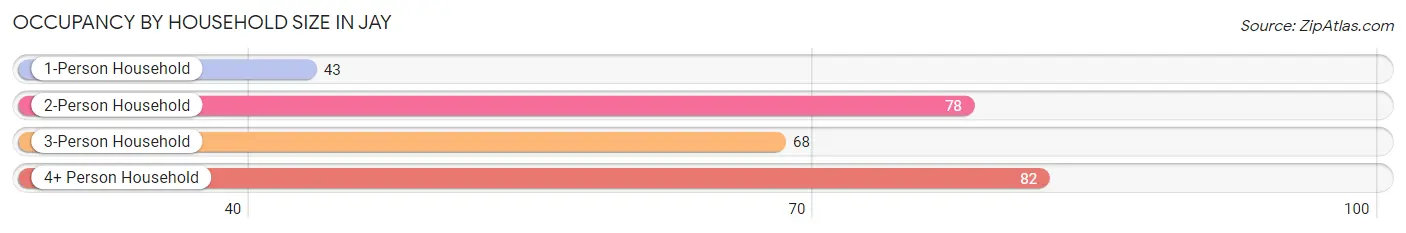
| Household Size | # Housing Units | % Housing Units |
| 1-Person Household | 43 | 15.9% |
| 2-Person Household | 78 | 28.8% |
| 3-Person Household | 68 | 25.1% |
| 4+ Person Household | 82 | 30.3% |
| Total Housing Units | 271 | 100.0% |
Occupancy by Ownership by Household Size in Jay
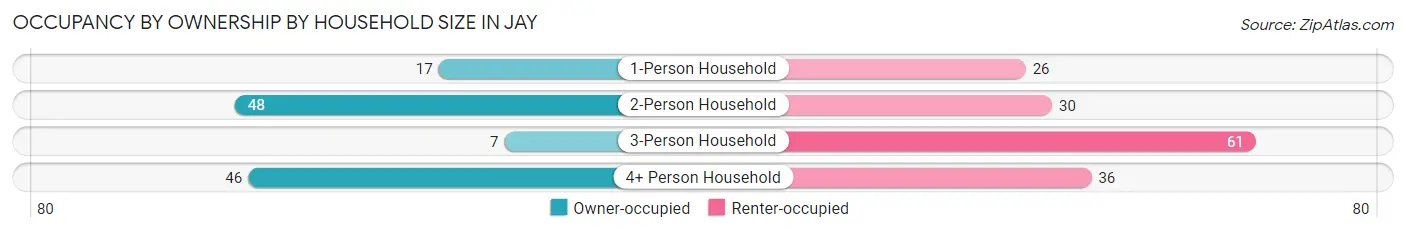
| Household Size | Owner-occupied | Renter-occupied |
| 1-Person Household | 17 (39.5%) | 26 (60.5%) |
| 2-Person Household | 48 (61.5%) | 30 (38.5%) |
| 3-Person Household | 7 (10.3%) | 61 (89.7%) |
| 4+ Person Household | 46 (56.1%) | 36 (43.9%) |
| Total Housing Units | 118 (43.5%) | 153 (56.5%) |
Occupancy by Educational Attainment in Jay
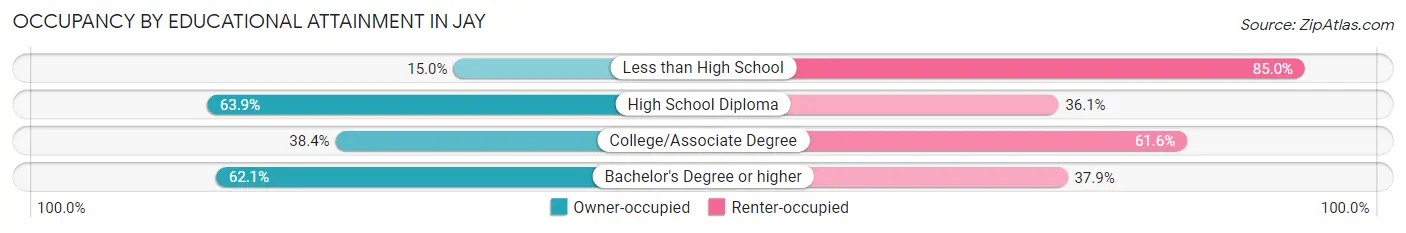
| Household Size | Owner-occupied | Renter-occupied |
| Less than High School | 9 (15.0%) | 51 (85.0%) |
| High School Diploma | 53 (63.9%) | 30 (36.1%) |
| College/Associate Degree | 38 (38.4%) | 61 (61.6%) |
| Bachelor's Degree or higher | 18 (62.1%) | 11 (37.9%) |
Occupancy by Age of Householder in Jay
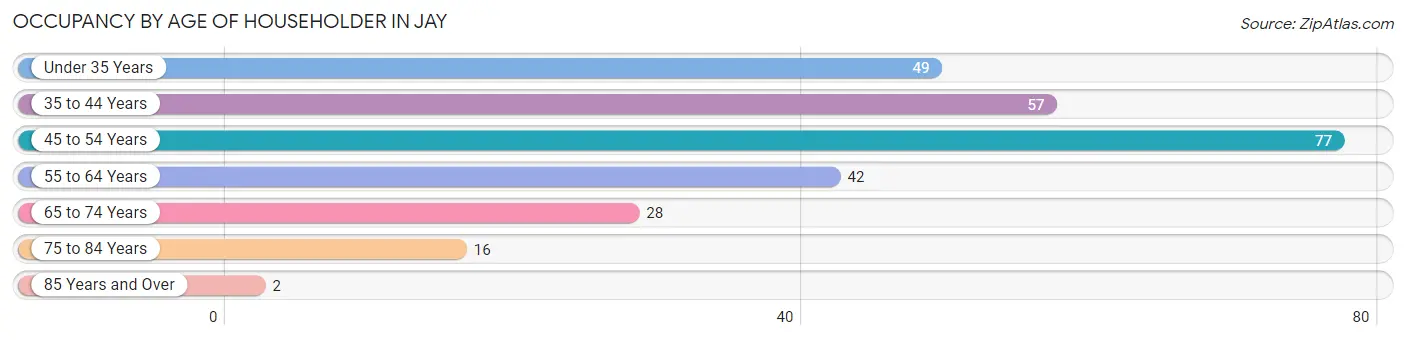
| Age Bracket | # Households | % Households |
| Under 35 Years | 49 | 18.1% |
| 35 to 44 Years | 57 | 21.0% |
| 45 to 54 Years | 77 | 28.4% |
| 55 to 64 Years | 42 | 15.5% |
| 65 to 74 Years | 28 | 10.3% |
| 75 to 84 Years | 16 | 5.9% |
| 85 Years and Over | 2 | 0.7% |
| Total | 271 | 100.0% |
Housing Finances in Jay
Median Income by Occupancy in Jay
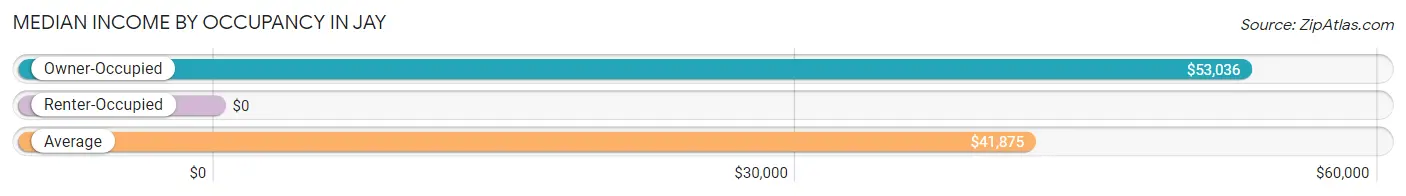
| Occupancy Type | # Households | Median Income |
| Owner-Occupied | 118 (43.5%) | $53,036 |
| Renter-Occupied | 153 (56.5%) | $0 |
| Average | 271 (100.0%) | $41,875 |
Occupancy by Householder Income Bracket in Jay
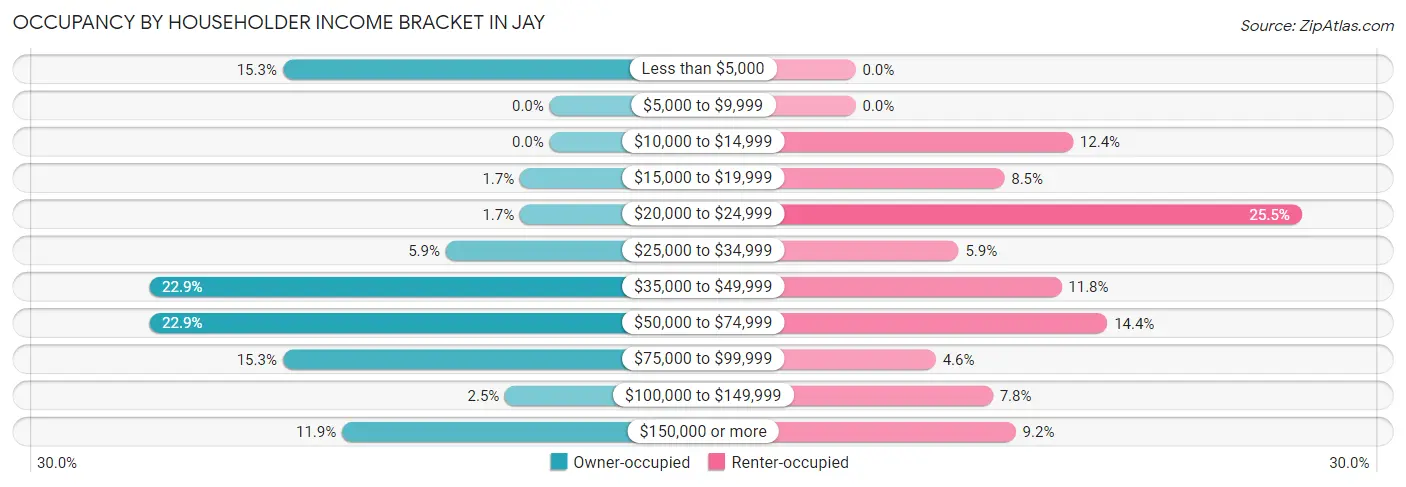
| Income Bracket | Owner-occupied | Renter-occupied |
| Less than $5,000 | 18 (15.2%) | 0 (0.0%) |
| $5,000 to $9,999 | 0 (0.0%) | 0 (0.0%) |
| $10,000 to $14,999 | 0 (0.0%) | 19 (12.4%) |
| $15,000 to $19,999 | 2 (1.7%) | 13 (8.5%) |
| $20,000 to $24,999 | 2 (1.7%) | 39 (25.5%) |
| $25,000 to $34,999 | 7 (5.9%) | 9 (5.9%) |
| $35,000 to $49,999 | 27 (22.9%) | 18 (11.8%) |
| $50,000 to $74,999 | 27 (22.9%) | 22 (14.4%) |
| $75,000 to $99,999 | 18 (15.2%) | 7 (4.6%) |
| $100,000 to $149,999 | 3 (2.5%) | 12 (7.8%) |
| $150,000 or more | 14 (11.9%) | 14 (9.1%) |
| Total | 118 (100.0%) | 153 (100.0%) |
Monthly Housing Cost Tiers in Jay
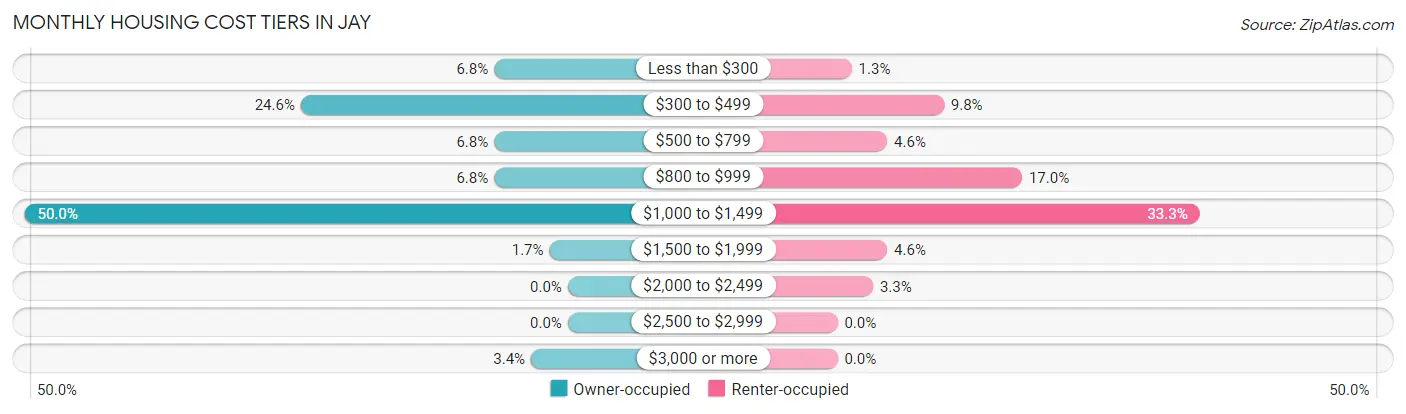
| Monthly Cost | Owner-occupied | Renter-occupied |
| Less than $300 | 8 (6.8%) | 2 (1.3%) |
| $300 to $499 | 29 (24.6%) | 15 (9.8%) |
| $500 to $799 | 8 (6.8%) | 7 (4.6%) |
| $800 to $999 | 8 (6.8%) | 26 (17.0%) |
| $1,000 to $1,499 | 59 (50.0%) | 51 (33.3%) |
| $1,500 to $1,999 | 2 (1.7%) | 7 (4.6%) |
| $2,000 to $2,499 | 0 (0.0%) | 5 (3.3%) |
| $2,500 to $2,999 | 0 (0.0%) | 0 (0.0%) |
| $3,000 or more | 4 (3.4%) | 0 (0.0%) |
| Total | 118 (100.0%) | 153 (100.0%) |
Physical Housing Characteristics in Jay
Housing Structures in Jay
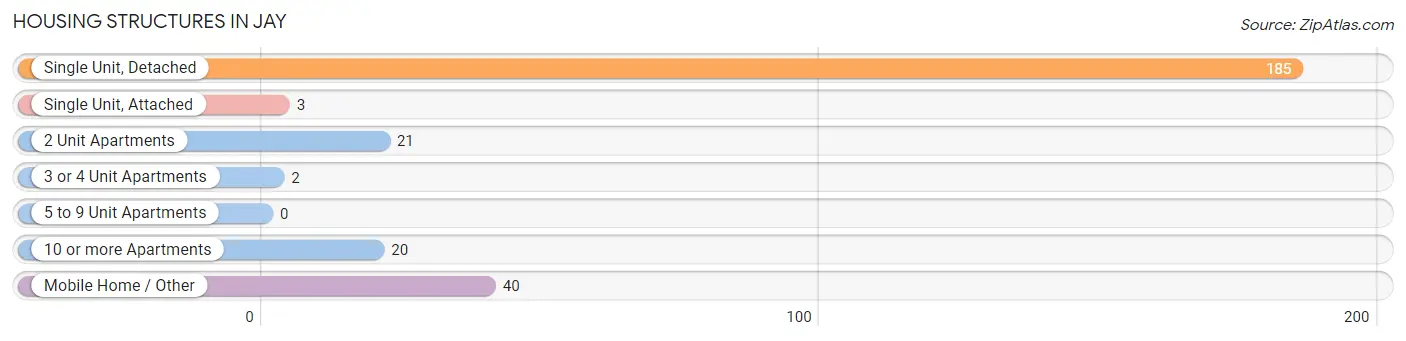
| Structure Type | # Housing Units | % Housing Units |
| Single Unit, Detached | 185 | 68.3% |
| Single Unit, Attached | 3 | 1.1% |
| 2 Unit Apartments | 21 | 7.7% |
| 3 or 4 Unit Apartments | 2 | 0.7% |
| 5 to 9 Unit Apartments | 0 | 0.0% |
| 10 or more Apartments | 20 | 7.4% |
| Mobile Home / Other | 40 | 14.8% |
| Total | 271 | 100.0% |
Housing Structures by Occupancy in Jay
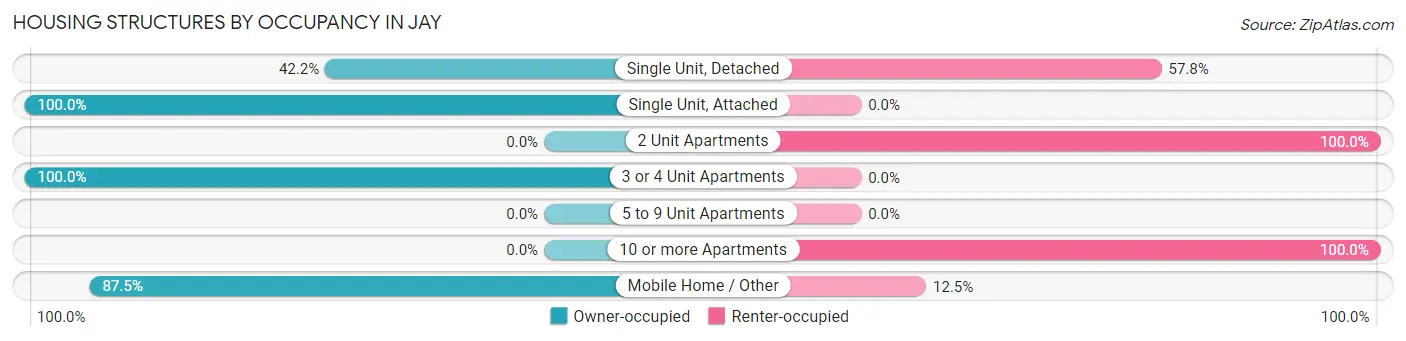
| Structure Type | Owner-occupied | Renter-occupied |
| Single Unit, Detached | 78 (42.2%) | 107 (57.8%) |
| Single Unit, Attached | 3 (100.0%) | 0 (0.0%) |
| 2 Unit Apartments | 0 (0.0%) | 21 (100.0%) |
| 3 or 4 Unit Apartments | 2 (100.0%) | 0 (0.0%) |
| 5 to 9 Unit Apartments | 0 (0.0%) | 0 (0.0%) |
| 10 or more Apartments | 0 (0.0%) | 20 (100.0%) |
| Mobile Home / Other | 35 (87.5%) | 5 (12.5%) |
| Total | 118 (43.5%) | 153 (56.5%) |
Housing Structures by Number of Rooms in Jay
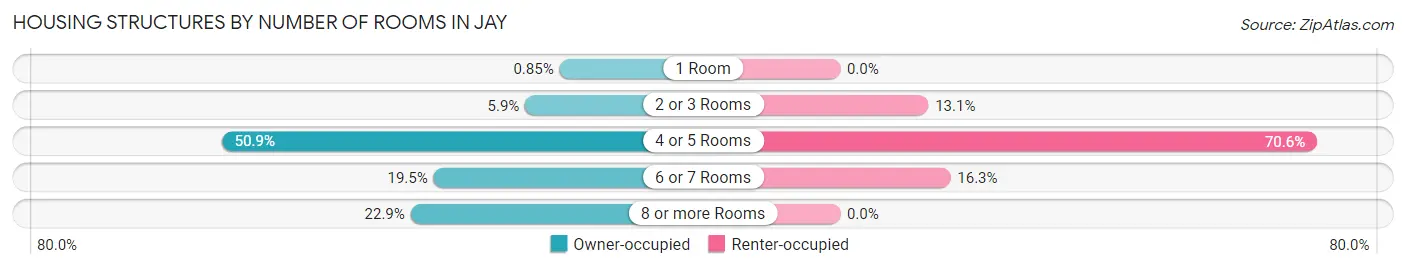
| Number of Rooms | Owner-occupied | Renter-occupied |
| 1 Room | 1 (0.9%) | 0 (0.0%) |
| 2 or 3 Rooms | 7 (5.9%) | 20 (13.1%) |
| 4 or 5 Rooms | 60 (50.8%) | 108 (70.6%) |
| 6 or 7 Rooms | 23 (19.5%) | 25 (16.3%) |
| 8 or more Rooms | 27 (22.9%) | 0 (0.0%) |
| Total | 118 (100.0%) | 153 (100.0%) |
Housing Structure by Heating Type in Jay
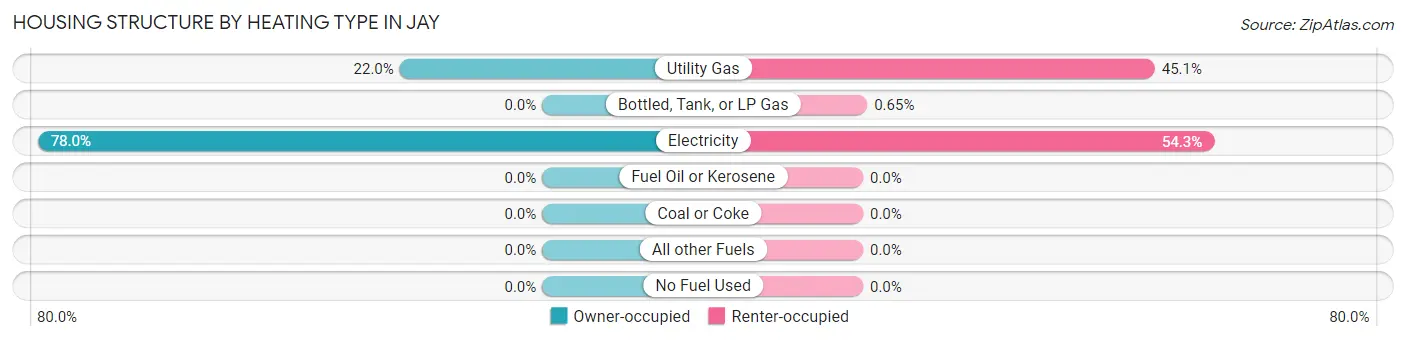
| Heating Type | Owner-occupied | Renter-occupied |
| Utility Gas | 26 (22.0%) | 69 (45.1%) |
| Bottled, Tank, or LP Gas | 0 (0.0%) | 1 (0.6%) |
| Electricity | 92 (78.0%) | 83 (54.2%) |
| Fuel Oil or Kerosene | 0 (0.0%) | 0 (0.0%) |
| Coal or Coke | 0 (0.0%) | 0 (0.0%) |
| All other Fuels | 0 (0.0%) | 0 (0.0%) |
| No Fuel Used | 0 (0.0%) | 0 (0.0%) |
| Total | 118 (100.0%) | 153 (100.0%) |
Household Vehicle Usage in Jay
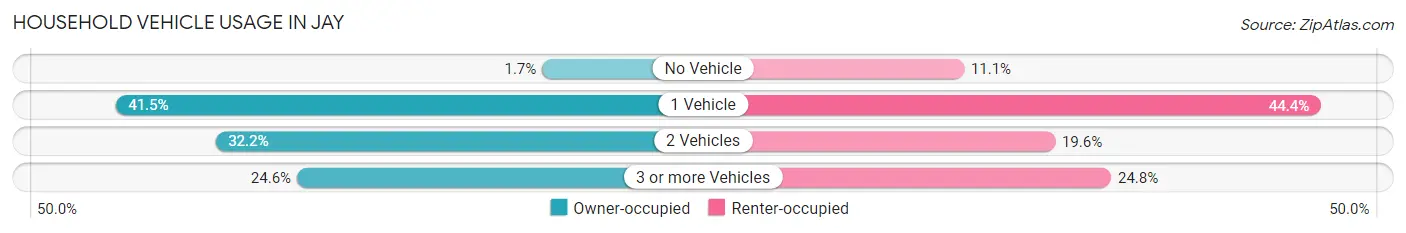
| Vehicles per Household | Owner-occupied | Renter-occupied |
| No Vehicle | 2 (1.7%) | 17 (11.1%) |
| 1 Vehicle | 49 (41.5%) | 68 (44.4%) |
| 2 Vehicles | 38 (32.2%) | 30 (19.6%) |
| 3 or more Vehicles | 29 (24.6%) | 38 (24.8%) |
| Total | 118 (100.0%) | 153 (100.0%) |
Real Estate & Mortgages in Jay
Real Estate and Mortgage Overview in Jay
| Characteristic | Without Mortgage | With Mortgage |
| Housing Units | 70 | 48 |
| Median Property Value | - | - |
| Median Household Income | $40,000 | $10 |
| Monthly Housing Costs | $480 | $4 |
| Real Estate Taxes | - | - |
Property Value by Mortgage Status in Jay
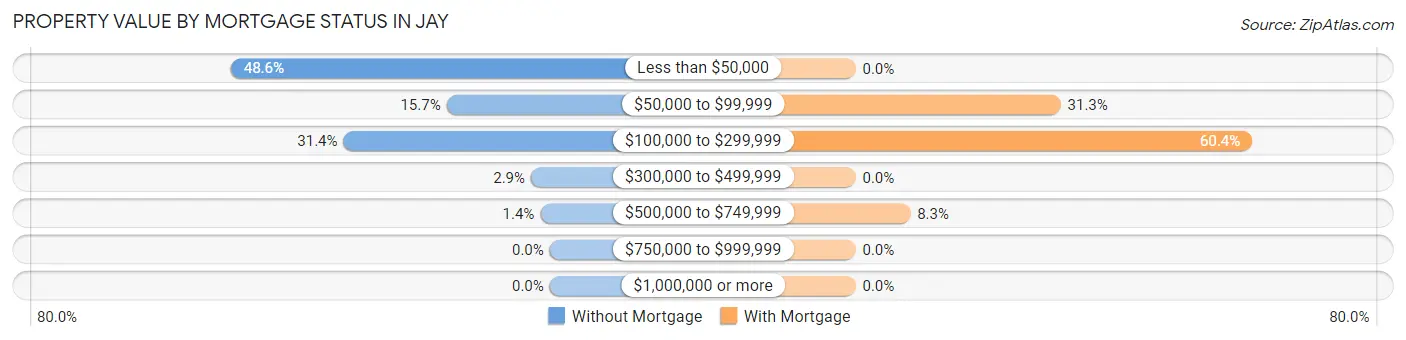
| Property Value | Without Mortgage | With Mortgage |
| Less than $50,000 | 34 (48.6%) | 0 (0.0%) |
| $50,000 to $99,999 | 11 (15.7%) | 15 (31.2%) |
| $100,000 to $299,999 | 22 (31.4%) | 29 (60.4%) |
| $300,000 to $499,999 | 2 (2.9%) | 0 (0.0%) |
| $500,000 to $749,999 | 1 (1.4%) | 4 (8.3%) |
| $750,000 to $999,999 | 0 (0.0%) | 0 (0.0%) |
| $1,000,000 or more | 0 (0.0%) | 0 (0.0%) |
| Total | 70 (100.0%) | 48 (100.0%) |
Household Income by Mortgage Status in Jay
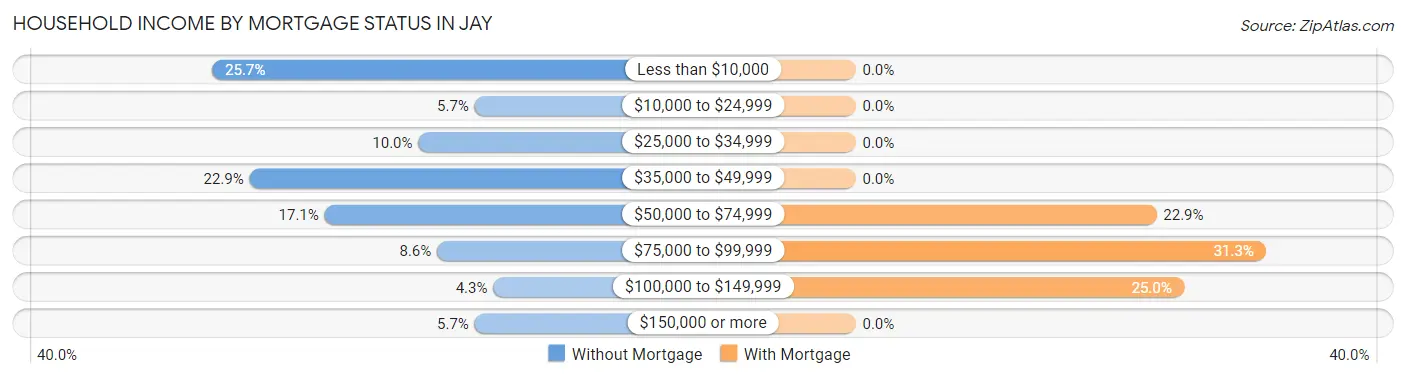
| Household Income | Without Mortgage | With Mortgage |
| Less than $10,000 | 18 (25.7%) | 0 (0.0%) |
| $10,000 to $24,999 | 4 (5.7%) | 0 (0.0%) |
| $25,000 to $34,999 | 7 (10.0%) | 0 (0.0%) |
| $35,000 to $49,999 | 16 (22.9%) | 0 (0.0%) |
| $50,000 to $74,999 | 12 (17.1%) | 11 (22.9%) |
| $75,000 to $99,999 | 6 (8.6%) | 15 (31.2%) |
| $100,000 to $149,999 | 3 (4.3%) | 12 (25.0%) |
| $150,000 or more | 4 (5.7%) | 0 (0.0%) |
| Total | 70 (100.0%) | 48 (100.0%) |
Property Value to Household Income Ratio in Jay
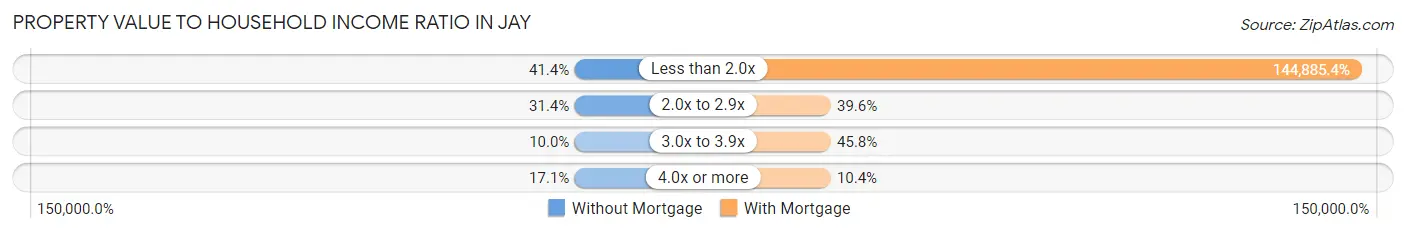
| Value-to-Income Ratio | Without Mortgage | With Mortgage |
| Less than 2.0x | 29 (41.4%) | 69,545 (144,885.4%) |
| 2.0x to 2.9x | 22 (31.4%) | 19 (39.6%) |
| 3.0x to 3.9x | 7 (10.0%) | 22 (45.8%) |
| 4.0x or more | 12 (17.1%) | 5 (10.4%) |
| Total | 70 (100.0%) | 48 (100.0%) |
Real Estate Taxes by Mortgage Status in Jay
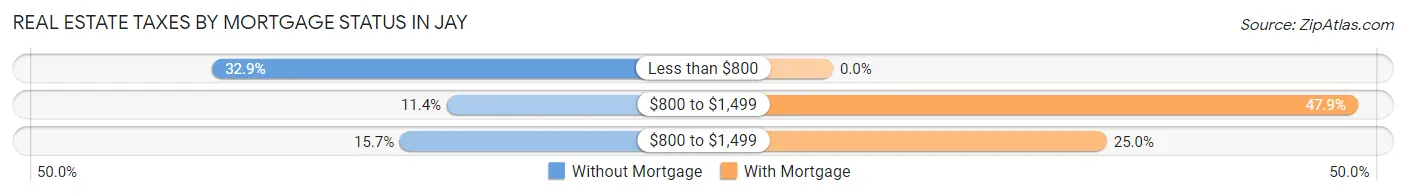
| Property Taxes | Without Mortgage | With Mortgage |
| Less than $800 | 23 (32.9%) | 0 (0.0%) |
| $800 to $1,499 | 8 (11.4%) | 23 (47.9%) |
| $800 to $1,499 | 11 (15.7%) | 12 (25.0%) |
| Total | 70 (100.0%) | 48 (100.0%) |
Health & Disability in Jay
Health Insurance Coverage by Age in Jay
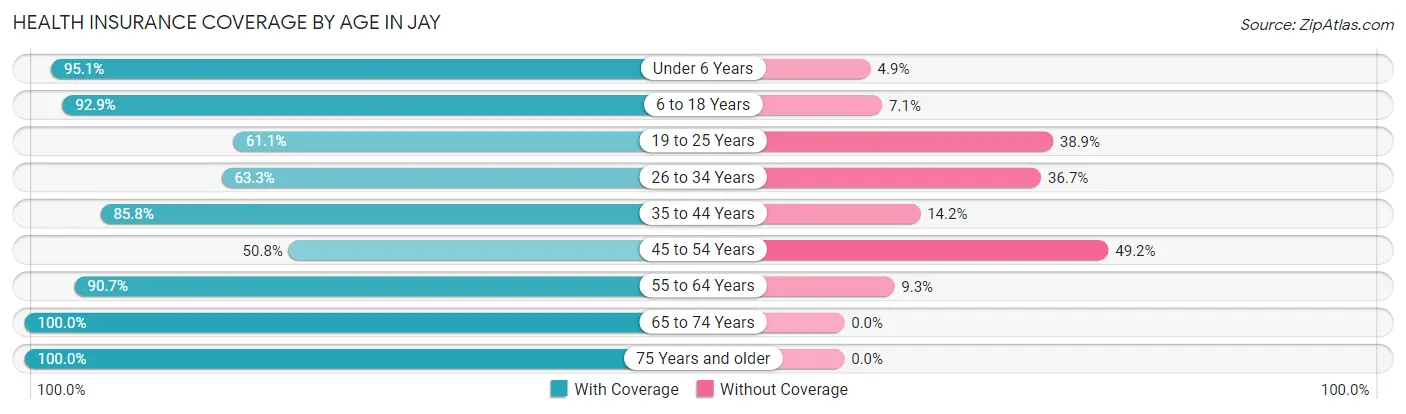
| Age Bracket | With Coverage | Without Coverage |
| Under 6 Years | 58 (95.1%) | 3 (4.9%) |
| 6 to 18 Years | 158 (92.9%) | 12 (7.1%) |
| 19 to 25 Years | 33 (61.1%) | 21 (38.9%) |
| 26 to 34 Years | 50 (63.3%) | 29 (36.7%) |
| 35 to 44 Years | 97 (85.8%) | 16 (14.2%) |
| 45 to 54 Years | 67 (50.8%) | 65 (49.2%) |
| 55 to 64 Years | 68 (90.7%) | 7 (9.3%) |
| 65 to 74 Years | 67 (100.0%) | 0 (0.0%) |
| 75 Years and older | 22 (100.0%) | 0 (0.0%) |
| Total | 620 (80.2%) | 153 (19.8%) |
Health Insurance Coverage by Citizenship Status in Jay
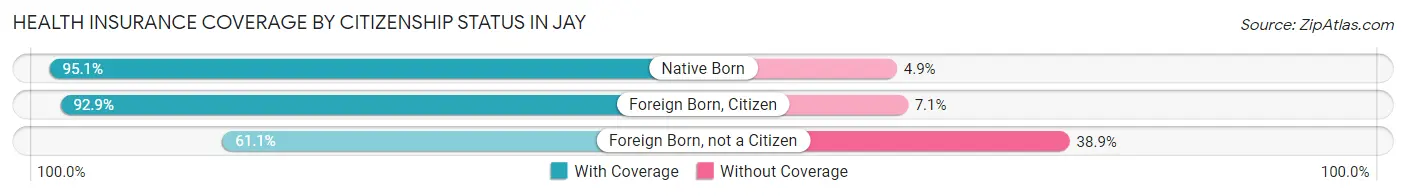
| Citizenship Status | With Coverage | Without Coverage |
| Native Born | 58 (95.1%) | 3 (4.9%) |
| Foreign Born, Citizen | 158 (92.9%) | 12 (7.1%) |
| Foreign Born, not a Citizen | 33 (61.1%) | 21 (38.9%) |
Health Insurance Coverage by Household Income in Jay
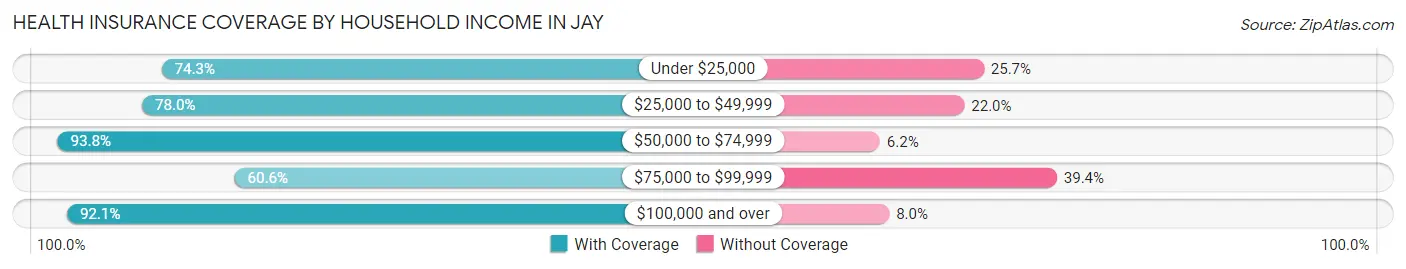
| Household Income | With Coverage | Without Coverage |
| Under $25,000 | 165 (74.3%) | 57 (25.7%) |
| $25,000 to $49,999 | 138 (78.0%) | 39 (22.0%) |
| $50,000 to $74,999 | 121 (93.8%) | 8 (6.2%) |
| $75,000 to $99,999 | 57 (60.6%) | 37 (39.4%) |
| $100,000 and over | 139 (92.0%) | 12 (8.0%) |
Public vs Private Health Insurance Coverage by Age in Jay
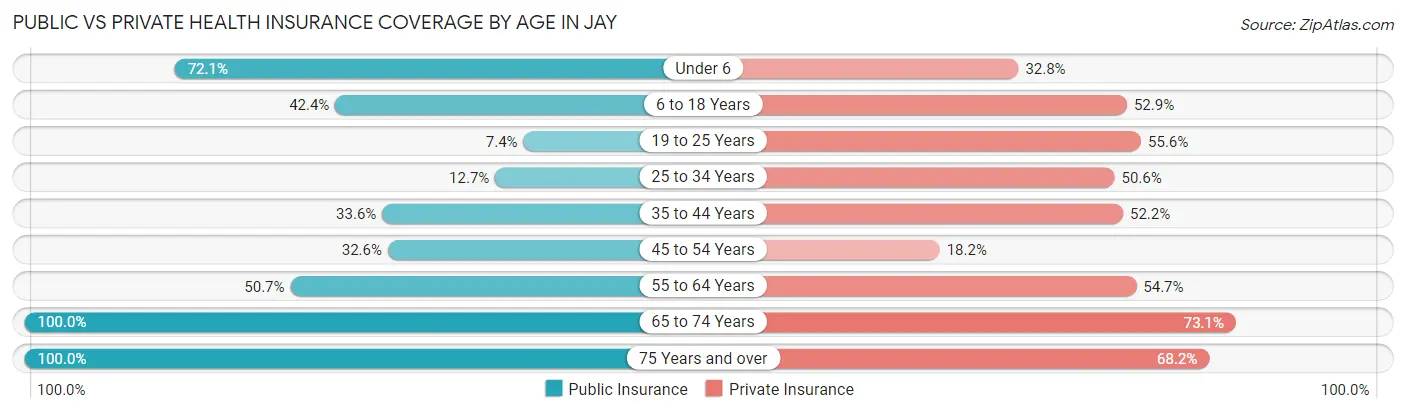
| Age Bracket | Public Insurance | Private Insurance |
| Under 6 | 44 (72.1%) | 20 (32.8%) |
| 6 to 18 Years | 72 (42.3%) | 90 (52.9%) |
| 19 to 25 Years | 4 (7.4%) | 30 (55.6%) |
| 25 to 34 Years | 10 (12.7%) | 40 (50.6%) |
| 35 to 44 Years | 38 (33.6%) | 59 (52.2%) |
| 45 to 54 Years | 43 (32.6%) | 24 (18.2%) |
| 55 to 64 Years | 38 (50.7%) | 41 (54.7%) |
| 65 to 74 Years | 67 (100.0%) | 49 (73.1%) |
| 75 Years and over | 22 (100.0%) | 15 (68.2%) |
| Total | 338 (43.7%) | 368 (47.6%) |
Disability Status by Sex by Age in Jay
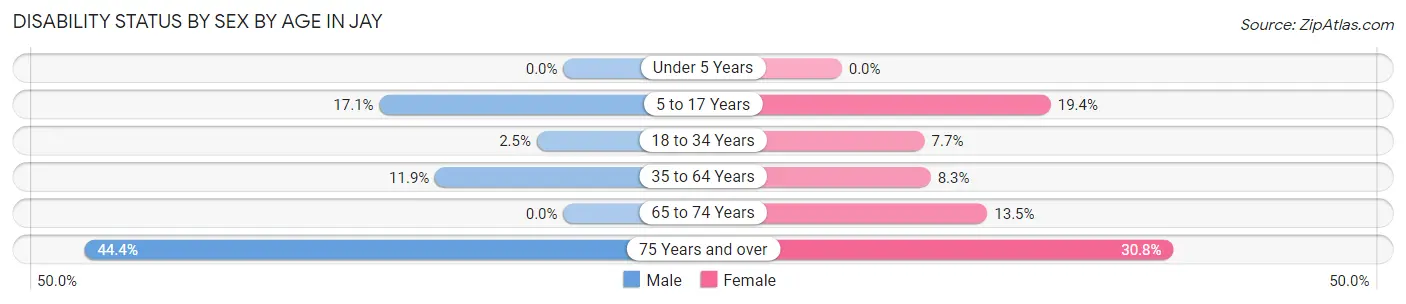
| Age Bracket | Male | Female |
| Under 5 Years | 0 (0.0%) | 0 (0.0%) |
| 5 to 17 Years | 14 (17.1%) | 13 (19.4%) |
| 18 to 34 Years | 3 (2.5%) | 3 (7.7%) |
| 35 to 64 Years | 15 (11.9%) | 16 (8.3%) |
| 65 to 74 Years | 0 (0.0%) | 5 (13.5%) |
| 75 Years and over | 4 (44.4%) | 4 (30.8%) |
Disability Class by Sex by Age in Jay
Disability Class: Hearing Difficulty
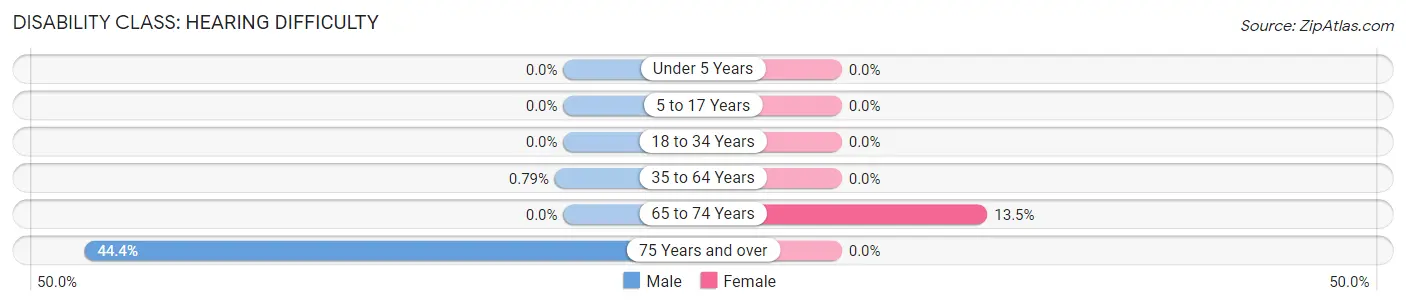
| Age Bracket | Male | Female |
| Under 5 Years | 0 (0.0%) | 0 (0.0%) |
| 5 to 17 Years | 0 (0.0%) | 0 (0.0%) |
| 18 to 34 Years | 0 (0.0%) | 0 (0.0%) |
| 35 to 64 Years | 1 (0.8%) | 0 (0.0%) |
| 65 to 74 Years | 0 (0.0%) | 5 (13.5%) |
| 75 Years and over | 4 (44.4%) | 0 (0.0%) |
Disability Class: Vision Difficulty
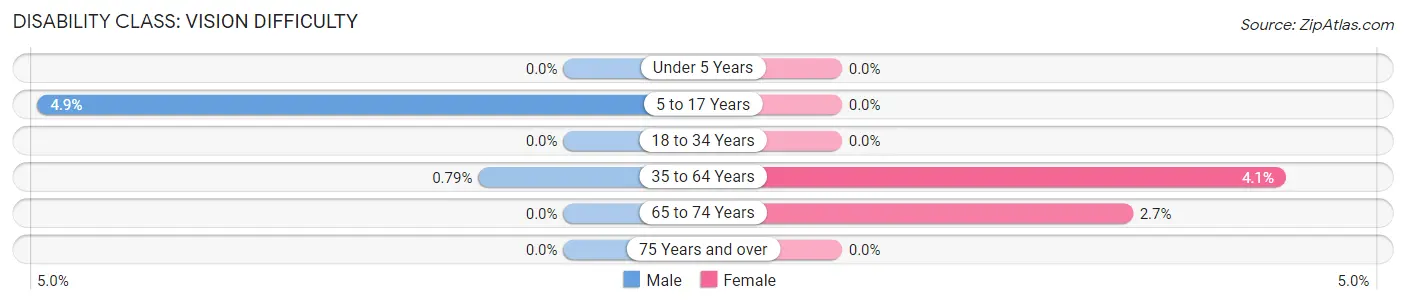
| Age Bracket | Male | Female |
| Under 5 Years | 0 (0.0%) | 0 (0.0%) |
| 5 to 17 Years | 4 (4.9%) | 0 (0.0%) |
| 18 to 34 Years | 0 (0.0%) | 0 (0.0%) |
| 35 to 64 Years | 1 (0.8%) | 8 (4.1%) |
| 65 to 74 Years | 0 (0.0%) | 1 (2.7%) |
| 75 Years and over | 0 (0.0%) | 0 (0.0%) |
Disability Class: Cognitive Difficulty
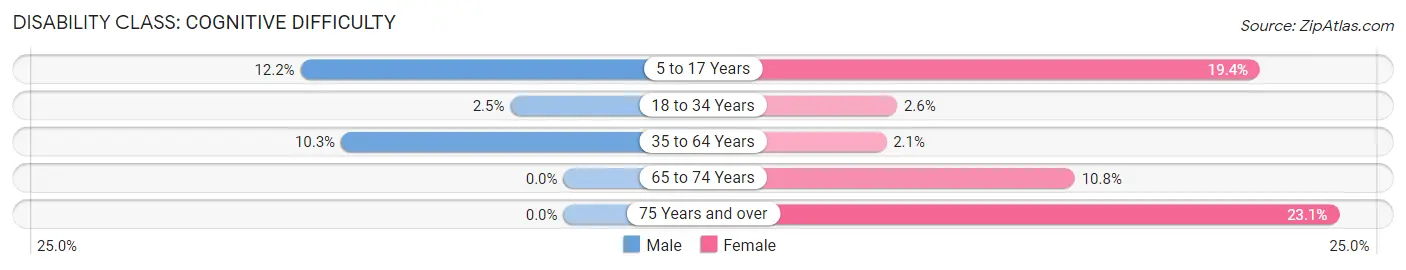
| Age Bracket | Male | Female |
| 5 to 17 Years | 10 (12.2%) | 13 (19.4%) |
| 18 to 34 Years | 3 (2.5%) | 1 (2.6%) |
| 35 to 64 Years | 13 (10.3%) | 4 (2.1%) |
| 65 to 74 Years | 0 (0.0%) | 4 (10.8%) |
| 75 Years and over | 0 (0.0%) | 3 (23.1%) |
Disability Class: Ambulatory Difficulty
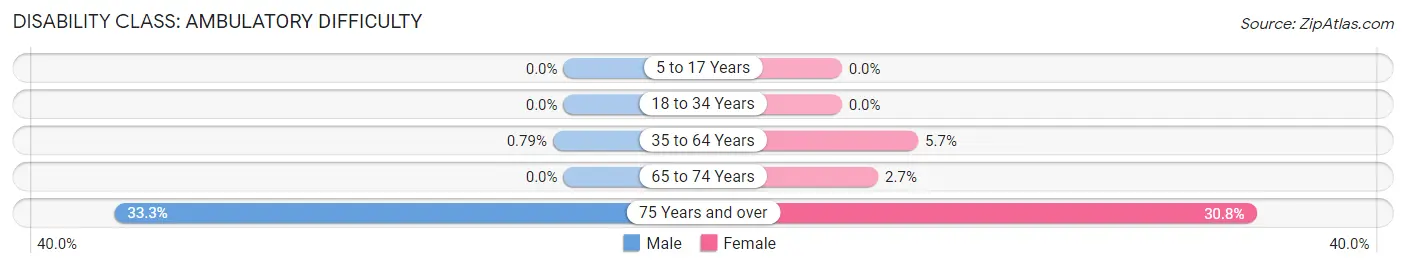
| Age Bracket | Male | Female |
| 5 to 17 Years | 0 (0.0%) | 0 (0.0%) |
| 18 to 34 Years | 0 (0.0%) | 0 (0.0%) |
| 35 to 64 Years | 1 (0.8%) | 11 (5.7%) |
| 65 to 74 Years | 0 (0.0%) | 1 (2.7%) |
| 75 Years and over | 3 (33.3%) | 4 (30.8%) |
Disability Class: Self-Care Difficulty
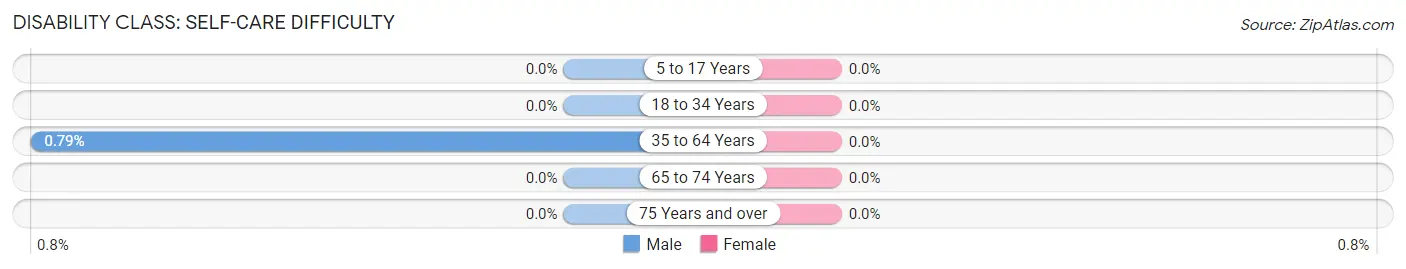
| Age Bracket | Male | Female |
| 5 to 17 Years | 0 (0.0%) | 0 (0.0%) |
| 18 to 34 Years | 0 (0.0%) | 0 (0.0%) |
| 35 to 64 Years | 1 (0.8%) | 0 (0.0%) |
| 65 to 74 Years | 0 (0.0%) | 0 (0.0%) |
| 75 Years and over | 0 (0.0%) | 0 (0.0%) |
Technology Access in Jay
Computing Device Access in Jay
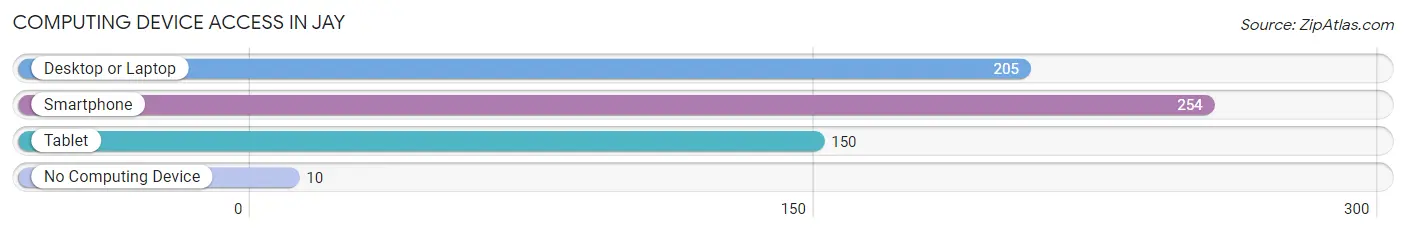
| Device Type | # Households | % Households |
| Desktop or Laptop | 205 | 75.6% |
| Smartphone | 254 | 93.7% |
| Tablet | 150 | 55.3% |
| No Computing Device | 10 | 3.7% |
| Total | 271 | 100.0% |
Internet Access in Jay
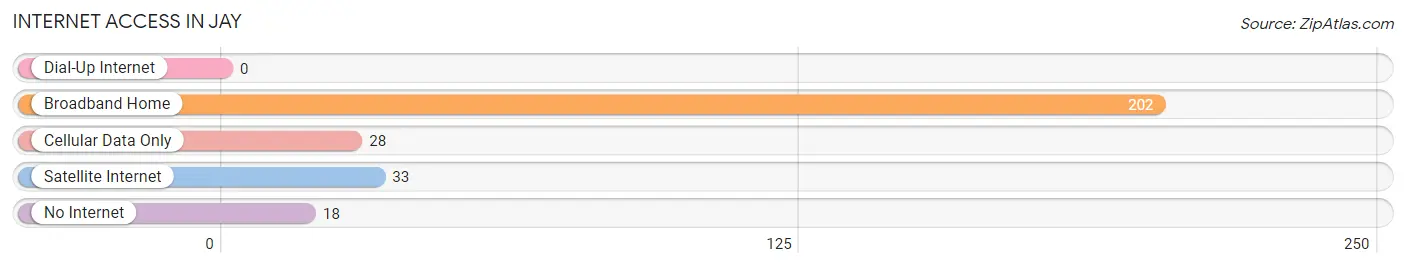
| Internet Type | # Households | % Households |
| Dial-Up Internet | 0 | 0.0% |
| Broadband Home | 202 | 74.5% |
| Cellular Data Only | 28 | 10.3% |
| Satellite Internet | 33 | 12.2% |
| No Internet | 18 | 6.6% |
| Total | 271 | 100.0% |
Jay Summary
Florida is a state located in the southeastern United States. It is bordered by Alabama to the northwest, Georgia to the north, and the Gulf of Mexico to the south and west. Florida is the 22nd most populous state in the United States, with a population of 21.3 million in 2019. It is the third most populous state in the country after California and Texas.
History
Florida was first explored by Spanish explorers in the 16th century. The first permanent European settlement in the region was established in 1565 by Spanish explorer Pedro Menéndez de Avilés. The settlement was named St. Augustine and is the oldest continuously occupied European-established settlement in the continental United States.
In 1763, Florida was ceded to Great Britain as part of the Treaty of Paris. The British divided the region into two colonies, East Florida and West Florida. In 1821, the United States acquired Florida from Spain as part of the Adams-Onís Treaty. Florida was admitted to the Union as the 27th state in 1845.
Geography
Florida is the 22nd largest state in the United States, covering an area of 65,755 square miles. It is the third largest state in the country after Alaska and Texas. The state is bordered by Alabama to the northwest, Georgia to the north, and the Gulf of Mexico to the south and west.
Florida is divided into 67 counties and contains 482 municipalities. The state capital is Tallahassee, located in Leon County. Other major cities include Jacksonville, Miami, Tampa, St. Petersburg, and Orlando.
Florida is home to a variety of landscapes, including beaches, swamps, and forests. The highest point in the state is Britton Hill, located in Walton County, which has an elevation of 345 feet. The state also has a number of rivers, including the St. Johns River, the Apalachicola River, and the Suwannee River.
Economy
Florida has a diversified economy, with a gross state product of $1.1 trillion in 2019. The state’s main industries include tourism, agriculture, manufacturing, and finance.
Tourism is a major industry in Florida, with over 112 million visitors in 2019. The state is home to a number of popular tourist destinations, including Walt Disney World, Universal Studios, and the Kennedy Space Center.
Agriculture is also an important part of the state’s economy, with crops such as oranges, tomatoes, and sugarcane being grown in the state. Florida is the second largest producer of oranges in the United States, behind California.
Manufacturing is also a major industry in Florida, with products such as electronics, aircraft, and pharmaceuticals being produced in the state.
Demographics
As of 2019, Florida had a population of 21.3 million, making it the third most populous state in the United States. The state has a population density of 350 people per square mile.
The largest racial group in Florida is White, making up 57.9% of the population. The second largest racial group is Hispanic or Latino, making up 25.7% of the population. Other racial groups include African American (16.7%), Asian (3.2%), and Native American (0.5%).
The median household income in Florida is $53,267, and the median age is 41. The state has a poverty rate of 14.3%. The largest religious group in the state is Christian, making up 68.7% of the population. Other religious groups include Jewish (2.2%), Muslim (1.2%), and Buddhist (0.4%).
Common Questions
What is Per Capita Income in Jay?
Per Capita income in Jay is $21,871.
What is the Median Family Income in Jay?
Median Family Income in Jay is $43,250.
What is the Median Household income in Jay?
Median Household Income in Jay is $41,875.
What is Income or Wage Gap in Jay?
Income or Wage Gap in Jay is 36.2%.
Women in Jay earn 63.8 cents for every dollar earned by a man.
What is Inequality or Gini Index in Jay?
Inequality or Gini Index in Jay is 0.46.
What is the Total Population of Jay?
Total Population of Jay is 773.
What is the Total Male Population of Jay?
Total Male Population of Jay is 407.
What is the Total Female Population of Jay?
Total Female Population of Jay is 366.
What is the Ratio of Males per 100 Females in Jay?
There are 111.20 Males per 100 Females in Jay.
What is the Ratio of Females per 100 Males in Jay?
There are 89.93 Females per 100 Males in Jay.
What is the Median Population Age in Jay?
Median Population Age in Jay is 36.9 Years.
What is the Average Family Size in Jay
Average Family Size in Jay is 3.1 People.
What is the Average Household Size in Jay
Average Household Size in Jay is 2.9 People.
How Large is the Labor Force in Jay?
There are 305 People in the Labor Forcein in Jay.
What is the Percentage of People in the Labor Force in Jay?
52.5% of People are in the Labor Force in Jay.
What is the Unemployment Rate in Jay?
Unemployment Rate in Jay is 10.2%.