Cities with the Highest Percentage of Immigrants from Northern Europe in Florida
RELATED REPORTS & OPTIONS
Northern Europe
Florida
Compare Cities
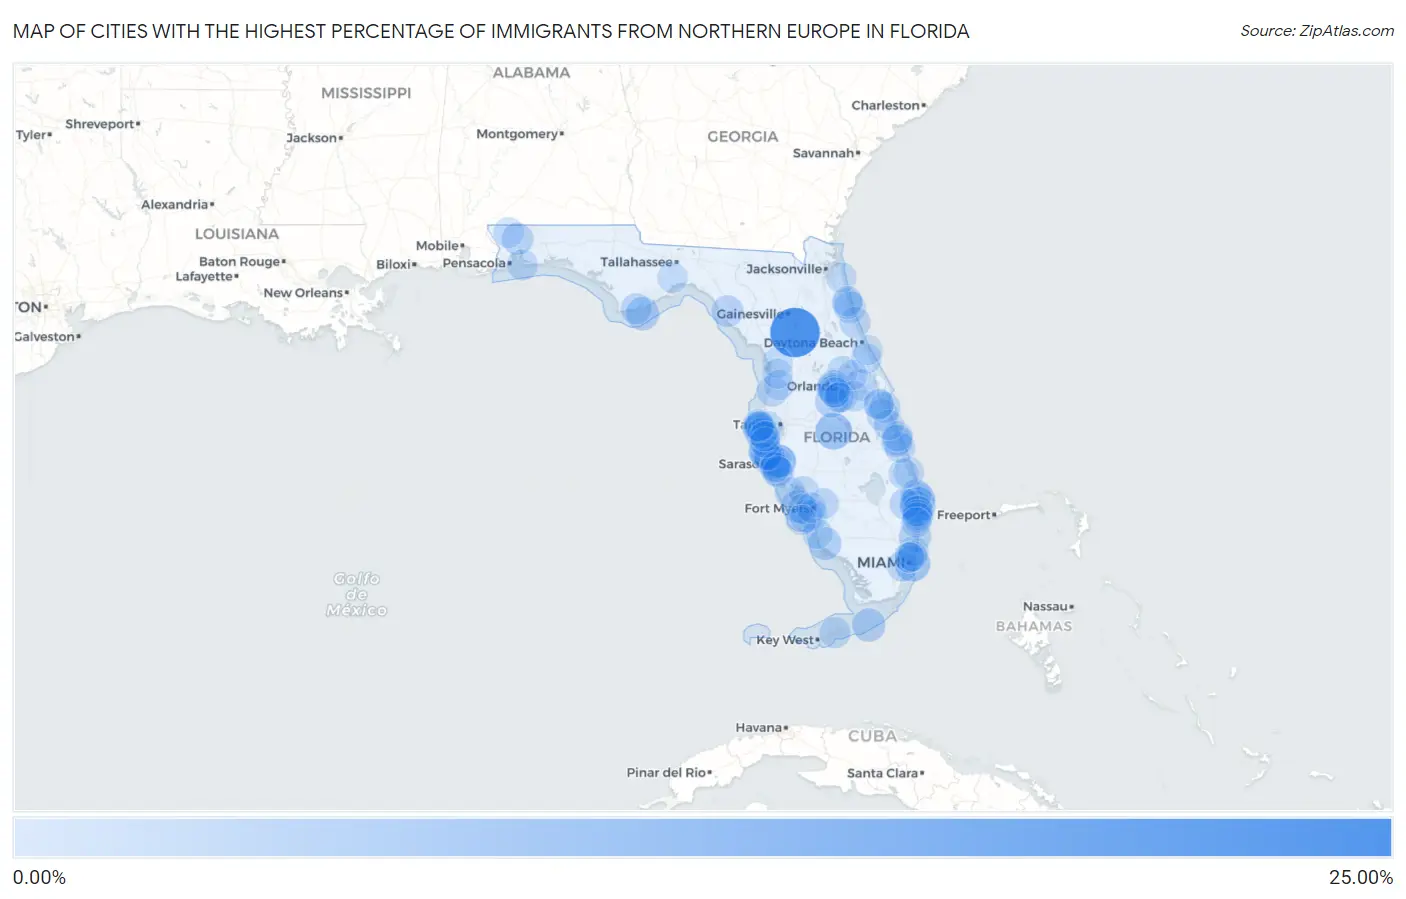
Map of Cities with the Highest Percentage of Immigrants from Northern Europe in Florida
0.00%
25.00%
Cities with the Highest Percentage of Immigrants from Northern Europe in Florida
| City | Northern Europe | vs State | vs National | |
| 1. | Reddick | 21.19% | 0.46%(+20.7)#1 | 0.29%(+20.9)#5 |
| 2. | Babson Park | 7.56% | 0.46%(+7.11)#2 | 0.29%(+7.28)#45 |
| 3. | Palm Beach | 6.99% | 0.46%(+6.53)#3 | 0.29%(+6.70)#53 |
| 4. | Fisher Island | 6.61% | 0.46%(+6.15)#4 | 0.29%(+6.32)#60 |
| 5. | Holmes Beach | 4.78% | 0.46%(+4.32)#5 | 0.29%(+4.49)#101 |
| 6. | Desoto Lakes | 4.55% | 0.46%(+4.09)#6 | 0.29%(+4.26)#116 |
| 7. | Belleair Shore | 4.48% | 0.46%(+4.02)#7 | 0.29%(+4.19)#123 |
| 8. | Duck Key | 4.38% | 0.46%(+3.92)#8 | 0.29%(+4.09)#129 |
| 9. | St George Island | 4.33% | 0.46%(+3.87)#9 | 0.29%(+4.04)#133 |
| 10. | Anna Maria | 4.12% | 0.46%(+3.66)#10 | 0.29%(+3.84)#149 |
| 11. | Palm Beach Shores | 3.94% | 0.46%(+3.49)#11 | 0.29%(+3.66)#162 |
| 12. | Verona Walk | 3.87% | 0.46%(+3.41)#12 | 0.29%(+3.58)#168 |
| 13. | South Palm Beach | 3.82% | 0.46%(+3.37)#13 | 0.29%(+3.54)#174 |
| 14. | Pineland | 3.69% | 0.46%(+3.24)#14 | 0.29%(+3.41)#192 |
| 15. | Punta Rassa | 3.58% | 0.46%(+3.12)#15 | 0.29%(+3.29)#202 |
| 16. | Celebration | 3.57% | 0.46%(+3.11)#16 | 0.29%(+3.28)#204 |
| 17. | Gotha | 3.54% | 0.46%(+3.08)#17 | 0.29%(+3.25)#210 |
| 18. | Sea Ranch Lakes | 3.39% | 0.46%(+2.93)#18 | 0.29%(+3.10)#226 |
| 19. | St Pete Beach | 3.14% | 0.46%(+2.69)#19 | 0.29%(+2.86)#253 |
| 20. | Bay Hill | 3.09% | 0.46%(+2.64)#20 | 0.29%(+2.81)#262 |
| 21. | Steinhatchee | 2.92% | 0.46%(+2.46)#21 | 0.29%(+2.63)#285 |
| 22. | Longboat Key | 2.79% | 0.46%(+2.34)#22 | 0.29%(+2.51)#316 |
| 23. | Indian Shores | 2.79% | 0.46%(+2.33)#23 | 0.29%(+2.51)#317 |
| 24. | The Meadows | 2.78% | 0.46%(+2.32)#24 | 0.29%(+2.50)#323 |
| 25. | Allentown | 2.72% | 0.46%(+2.26)#25 | 0.29%(+2.43)#338 |
| 26. | Southchase | 2.72% | 0.46%(+2.26)#26 | 0.29%(+2.43)#339 |
| 27. | Melbourne Village | 2.68% | 0.46%(+2.22)#27 | 0.29%(+2.39)#345 |
| 28. | Windermere | 2.60% | 0.46%(+2.14)#28 | 0.29%(+2.31)#367 |
| 29. | Crescent Beach | 2.56% | 0.46%(+2.11)#29 | 0.29%(+2.28)#376 |
| 30. | Vilano Beach | 2.44% | 0.46%(+1.99)#30 | 0.29%(+2.16)#403 |
| 31. | North Sarasota | 2.33% | 0.46%(+1.87)#31 | 0.29%(+2.05)#421 |
| 32. | Glen Ridge | 2.28% | 0.46%(+1.83)#32 | 0.29%(+2.00)#433 |
| 33. | Cudjoe Key | 2.28% | 0.46%(+1.82)#33 | 0.29%(+1.99)#434 |
| 34. | Gifford | 2.26% | 0.46%(+1.80)#34 | 0.29%(+1.97)#441 |
| 35. | Christmas | 2.20% | 0.46%(+1.74)#35 | 0.29%(+1.92)#460 |
| 36. | South Patrick Shores | 2.15% | 0.46%(+1.69)#36 | 0.29%(+1.86)#475 |
| 37. | Apalachicola | 2.12% | 0.46%(+1.66)#37 | 0.29%(+1.83)#483 |
| 38. | Juno Ridge | 2.09% | 0.46%(+1.63)#38 | 0.29%(+1.80)#499 |
| 39. | Pelican Marsh | 2.08% | 0.46%(+1.63)#39 | 0.29%(+1.80)#501 |
| 40. | Osprey | 2.07% | 0.46%(+1.61)#40 | 0.29%(+1.78)#508 |
| 41. | Timber Pines | 2.06% | 0.46%(+1.60)#41 | 0.29%(+1.77)#513 |
| 42. | Loxahatchee Groves | 2.04% | 0.46%(+1.58)#42 | 0.29%(+1.75)#521 |
| 43. | Palmer Ranch | 2.04% | 0.46%(+1.58)#43 | 0.29%(+1.75)#523 |
| 44. | Beverly Beach | 2.02% | 0.46%(+1.56)#44 | 0.29%(+1.73)#528 |
| 45. | Cortez | 1.99% | 0.46%(+1.53)#45 | 0.29%(+1.70)#539 |
| 46. | Pine Ridge Cdp Collier County | 1.95% | 0.46%(+1.49)#46 | 0.29%(+1.67)#560 |
| 47. | Sewall S Point | 1.93% | 0.46%(+1.47)#47 | 0.29%(+1.64)#570 |
| 48. | Woodlawn Beach | 1.92% | 0.46%(+1.46)#48 | 0.29%(+1.63)#573 |
| 49. | Glenvar Heights | 1.87% | 0.46%(+1.41)#49 | 0.29%(+1.59)#594 |
| 50. | South Sarasota | 1.81% | 0.46%(+1.35)#50 | 0.29%(+1.53)#621 |
| 51. | Rotonda | 1.72% | 0.46%(+1.26)#51 | 0.29%(+1.43)#673 |
| 52. | Indian River Shores | 1.71% | 0.46%(+1.25)#52 | 0.29%(+1.43)#678 |
| 53. | Madeira Beach | 1.70% | 0.46%(+1.25)#53 | 0.29%(+1.42)#680 |
| 54. | South Beach | 1.70% | 0.46%(+1.24)#54 | 0.29%(+1.41)#683 |
| 55. | Cypress Lake | 1.67% | 0.46%(+1.22)#55 | 0.29%(+1.39)#701 |
| 56. | Heathrow | 1.67% | 0.46%(+1.21)#56 | 0.29%(+1.38)#706 |
| 57. | Lake Mary Jane | 1.65% | 0.46%(+1.19)#57 | 0.29%(+1.36)#711 |
| 58. | Olga | 1.63% | 0.46%(+1.18)#58 | 0.29%(+1.35)#727 |
| 59. | Bradenton Beach | 1.63% | 0.46%(+1.17)#59 | 0.29%(+1.34)#731 |
| 60. | Ocean Ridge | 1.58% | 0.46%(+1.12)#60 | 0.29%(+1.29)#768 |
| 61. | Brownsdale | 1.54% | 0.46%(+1.08)#61 | 0.29%(+1.26)#790 |
| 62. | Bay Pines | 1.51% | 0.46%(+1.05)#62 | 0.29%(+1.22)#817 |
| 63. | Black Diamond | 1.51% | 0.46%(+1.05)#63 | 0.29%(+1.22)#821 |
| 64. | Pelican Bay | 1.50% | 0.46%(+1.05)#64 | 0.29%(+1.22)#823 |
| 65. | Rainbow Springs | 1.50% | 0.46%(+1.05)#65 | 0.29%(+1.22)#824 |
| 66. | Butler Beach | 1.47% | 0.46%(+1.01)#66 | 0.29%(+1.18)#856 |
| 67. | Crawfordville | 1.46% | 0.46%(+1.00)#67 | 0.29%(+1.18)#860 |
| 68. | Edgewater | 1.46% | 0.46%(+1.00)#68 | 0.29%(+1.18)#864 |
| 69. | Golden Beach | 1.46% | 0.46%(+1.00)#69 | 0.29%(+1.17)#865 |
| 70. | Brookridge | 1.44% | 0.46%(+0.985)#70 | 0.29%(+1.16)#874 |
| 71. | Palm Valley | 1.44% | 0.46%(+0.979)#71 | 0.29%(+1.15)#878 |
| 72. | Gulf Stream | 1.42% | 0.46%(+0.957)#72 | 0.29%(+1.13)#894 |
| 73. | Palm City | 1.41% | 0.46%(+0.956)#73 | 0.29%(+1.13)#895 |
| 74. | Punta Gorda | 1.41% | 0.46%(+0.955)#74 | 0.29%(+1.13)#896 |
| 75. | Lantana | 1.41% | 0.46%(+0.952)#75 | 0.29%(+1.12)#898 |
| 76. | Black Hammock | 1.40% | 0.46%(+0.946)#76 | 0.29%(+1.12)#904 |
| 77. | Feather Sound | 1.40% | 0.46%(+0.941)#77 | 0.29%(+1.11)#912 |
| 78. | Vamo | 1.39% | 0.46%(+0.935)#78 | 0.29%(+1.11)#918 |
| 79. | Wabasso Beach | 1.38% | 0.46%(+0.923)#79 | 0.29%(+1.09)#928 |
| 80. | Grant Valkaria | 1.37% | 0.46%(+0.914)#80 | 0.29%(+1.09)#934 |
| 81. | Ponce Inlet | 1.34% | 0.46%(+0.880)#81 | 0.29%(+1.05)#969 |
| 82. | Siesta Key | 1.34% | 0.46%(+0.879)#82 | 0.29%(+1.05)#970 |
| 83. | Viera West | 1.33% | 0.46%(+0.877)#83 | 0.29%(+1.05)#973 |
| 84. | Indian Rocks Beach | 1.33% | 0.46%(+0.871)#84 | 0.29%(+1.04)#979 |
| 85. | Viera East | 1.32% | 0.46%(+0.857)#85 | 0.29%(+1.03)#995 |
| 86. | Miami Shores | 1.31% | 0.46%(+0.857)#86 | 0.29%(+1.03)#996 |
| 87. | Matlacha | 1.31% | 0.46%(+0.857)#87 | 0.29%(+1.03)#997 |
| 88. | St Augustine Beach | 1.30% | 0.46%(+0.841)#88 | 0.29%(+1.01)#1,011 |
| 89. | Belleair Bluffs | 1.29% | 0.46%(+0.835)#89 | 0.29%(+1.01)#1,020 |
| 90. | Highland Beach | 1.29% | 0.46%(+0.833)#90 | 0.29%(+1.01)#1,021 |
| 91. | Doctor Phillips | 1.26% | 0.46%(+0.805)#91 | 0.29%(+0.977)#1,052 |
| 92. | Hunters Creek | 1.26% | 0.46%(+0.804)#92 | 0.29%(+0.976)#1,058 |
| 93. | El Portal | 1.26% | 0.46%(+0.803)#93 | 0.29%(+0.975)#1,061 |
| 94. | Belleair Beach | 1.26% | 0.46%(+0.799)#94 | 0.29%(+0.971)#1,065 |
| 95. | Tierra Verde | 1.25% | 0.46%(+0.795)#95 | 0.29%(+0.967)#1,068 |
| 96. | Bay Harbor Islands | 1.25% | 0.46%(+0.792)#96 | 0.29%(+0.964)#1,070 |
| 97. | Lochmoor Waterway Estates | 1.24% | 0.46%(+0.781)#97 | 0.29%(+0.954)#1,080 |
| 98. | Sugarmill Woods | 1.23% | 0.46%(+0.771)#98 | 0.29%(+0.944)#1,098 |
| 99. | Bear Creek | 1.21% | 0.46%(+0.752)#99 | 0.29%(+0.925)#1,121 |
| 100. | Sanibel | 1.18% | 0.46%(+0.726)#100 | 0.29%(+0.898)#1,154 |
Common Questions
What are the Top 10 Cities with the Highest Percentage of Immigrants from Northern Europe in Florida?
Top 10 Cities with the Highest Percentage of Immigrants from Northern Europe in Florida are:
#1
21.19%
#2
7.56%
#3
6.99%
#4
6.61%
#5
4.78%
#6
4.55%
#7
4.48%
#8
4.38%
#9
4.33%
#10
4.12%
What city has the Highest Percentage of Immigrants from Northern Europe in Florida?
Reddick has the Highest Percentage of Immigrants from Northern Europe in Florida with 21.19%.
What is the Percentage of Immigrants from Northern Europe in the State of Florida?
Percentage of Immigrants from Northern Europe in Florida is 0.46%.
What is the Percentage of Immigrants from Northern Europe in the United States?
Percentage of Immigrants from Northern Europe in the United States is 0.29%.