Immigrants from Saudi Arabia vs Albanian Disability Age Under 5

COMPARE

Immigrants from Saudi Arabia
Race
Ancestry
AfghanAfricanAlaska NativeAlaskan AthabascanAleutAlsatianAmericanApacheArabArapahoArgentineanArmenianAssyrian/Chaldean/SyriacAustralianAustrianBahamianBangladeshiBarbadianBasqueBelgianBelizeanBermudanBhutaneseBlackfeetBolivianBrazilianBritishBritish West IndianBulgarianBurmeseCajunCambodianCanadianCape VerdeanCarpatho RusynCelticCentral AmericanCentral American IndianCherokeeCheyenneChickasawChileanChineseChippewaChoctawColombianColvilleComancheCosta RicanCreeCreekCroatianCrowCubanCypriotCzechCzechoslovakianDanishDelawareDominicanDutchDutch West IndianEastern EuropeanEcuadorianEgyptianEnglishEstonianEthiopianEuropeanFijianFilipinoFinnishFrenchFrench American IndianFrench CanadianGermanGerman RussianGhanaianGreekGuamanian/ChamorroGuatemalanGuyaneseHaitianHmongHonduranHopiHoumaHungarianIcelanderIndian (Asian)IndonesianInupiatIranianIraqiIrishIroquoisIsraeliItalianJamaicanJapaneseJordanianKenyanKiowaKoreanLaotianLatvianLebaneseLiberianLithuanianLumbeeLuxembourgerMacedonianMalaysianMalteseMarshalleseMenomineeMexicanMexican American IndianMongolianMoroccanNative HawaiianNavajoNepaleseNew ZealanderNicaraguanNigerianNorthern EuropeanNorwegianOkinawanOsageOttawaPaiutePakistaniPalestinianPanamanianParaguayanPennsylvania GermanPeruvianPimaPolishPortuguesePotawatomiPuebloPuerto RicanPuget Sound SalishRomanianRussianSalvadoranSamoanScandinavianScotch-IrishScottishSeminoleSenegaleseSerbianShoshoneSierra LeoneanSiouxSlavicSlovakSloveneSomaliSouth AfricanSouth AmericanSouth American IndianSoviet UnionSpaniardSpanishSpanish AmericanSpanish American IndianSri LankanSubsaharan AfricanSudaneseSwedishSwissSyrianTaiwaneseThaiTlingit-HaidaTohono O'OdhamTonganTrinidadian and TobagonianTsimshianTurkishU.S. Virgin IslanderUgandanUkrainianUruguayanUteVenezuelanVietnameseWelshWest IndianYakamaYaquiYugoslavianYumanYup'ikZimbabwean
Immigration
NonimmigrantsImmigrantsAfghanistanAfricaAlbaniaArgentinaArmeniaAsiaAustraliaAustriaBahamasBangladeshBarbadosBelarusBelgiumBelizeBoliviaBosnia and HerzegovinaBrazilBulgariaBurma/MyanmarCabo VerdeCambodiaCameroonCanadaCaribbeanCentral AmericaChileChinaColombiaCongoCosta RicaCroatiaCubaCzechoslovakiaDenmarkDominicaDominican RepublicEastern AfricaEastern AsiaEastern EuropeEcuadorEgyptEl SalvadorEnglandEritreaEthiopiaEuropeFijiFranceGermanyGhanaGreeceGrenadaGuatemalaGuyanaHaitiHondurasHong KongHungaryIndiaIndonesiaIranIraqIrelandIsraelItalyJamaicaJapanJordanKazakhstanKenyaKoreaKuwaitLaosLatin AmericaLatviaLebanonLiberiaLithuaniaMalaysiaMexicoMicronesiaMiddle AfricaMoldovaMoroccoNepalNetherlandsNicaraguaNigeriaNorth AmericaNorth MacedoniaNorthern AfricaNorthern EuropeNorwayOceaniaPakistanPanamaPeruPhilippinesPolandPortugalRomaniaRussiaSaudi ArabiaScotlandSenegalSerbiaSierra LeoneSingaporeSomaliaSouth AfricaSouth AmericaSouth Central AsiaSouth Eastern AsiaSouthern EuropeSpainSri LankaSt. Vincent and the GrenadinesSudanSwedenSwitzerlandSyriaTaiwanThailandTrinidad and TobagoTurkeyUgandaUkraineUruguayUzbekistanVenezuelaVietnamWest IndiesWestern AfricaWestern AsiaWestern EuropeYemenZaireZimbabweAzores
Albanian
Race
Ancestry
AfghanAfricanAlaska NativeAlaskan AthabascanAlbanianAleutAlsatianAmericanApacheArabArapahoArgentineanArmenianAssyrian/Chaldean/SyriacAustralianAustrianBahamianBangladeshiBarbadianBasqueBelgianBelizeanBermudanBhutaneseBlackfeetBolivianBrazilianBritishBritish West IndianBulgarianBurmeseCajunCambodianCanadianCape VerdeanCarpatho RusynCelticCentral AmericanCentral American IndianCherokeeCheyenneChickasawChileanChineseChippewaChoctawColombianColvilleComancheCosta RicanCreeCreekCroatianCrowCubanCypriotCzechCzechoslovakianDanishDelawareDominicanDutchDutch West IndianEastern EuropeanEcuadorianEgyptianEnglishEstonianEthiopianEuropeanFijianFilipinoFinnishFrenchFrench American IndianFrench CanadianGermanGerman RussianGhanaianGreekGuamanian/ChamorroGuatemalanGuyaneseHaitianHmongHonduranHopiHoumaHungarianIcelanderIndian (Asian)IndonesianInupiatIranianIraqiIrishIroquoisIsraeliItalianJamaicanJapaneseJordanianKenyanKiowaKoreanLaotianLatvianLebaneseLiberianLithuanianLumbeeLuxembourgerMacedonianMalaysianMalteseMarshalleseMenomineeMexicanMexican American IndianMongolianMoroccanNative HawaiianNavajoNepaleseNew ZealanderNicaraguanNigerianNorthern EuropeanNorwegianOkinawanOsageOttawaPaiutePakistaniPalestinianPanamanianParaguayanPennsylvania GermanPeruvianPimaPolishPortuguesePotawatomiPuebloPuerto RicanPuget Sound SalishRomanianRussianSalvadoranSamoanScandinavianScotch-IrishScottishSeminoleSenegaleseSerbianShoshoneSierra LeoneanSiouxSlavicSlovakSloveneSomaliSouth AfricanSouth AmericanSouth American IndianSoviet UnionSpaniardSpanishSpanish AmericanSpanish American IndianSri LankanSubsaharan AfricanSudaneseSwedishSwissSyrianTaiwaneseThaiTlingit-HaidaTohono O'OdhamTonganTrinidadian and TobagonianTsimshianTurkishU.S. Virgin IslanderUgandanUkrainianUruguayanUteVenezuelanVietnameseWelshWest IndianYakamaYaquiYugoslavianYumanYup'ikZimbabwean
Immigration
NonimmigrantsImmigrantsAfghanistanAfricaAlbaniaArgentinaArmeniaAsiaAustraliaAustriaBahamasBangladeshBarbadosBelarusBelgiumBelizeBoliviaBosnia and HerzegovinaBrazilBulgariaBurma/MyanmarCabo VerdeCambodiaCameroonCanadaCaribbeanCentral AmericaChileChinaColombiaCongoCosta RicaCroatiaCubaCzechoslovakiaDenmarkDominicaDominican RepublicEastern AfricaEastern AsiaEastern EuropeEcuadorEgyptEl SalvadorEnglandEritreaEthiopiaEuropeFijiFranceGermanyGhanaGreeceGrenadaGuatemalaGuyanaHaitiHondurasHong KongHungaryIndiaIndonesiaIranIraqIrelandIsraelItalyJamaicaJapanJordanKazakhstanKenyaKoreaKuwaitLaosLatin AmericaLatviaLebanonLiberiaLithuaniaMalaysiaMexicoMicronesiaMiddle AfricaMoldovaMoroccoNepalNetherlandsNicaraguaNigeriaNorth AmericaNorth MacedoniaNorthern AfricaNorthern EuropeNorwayOceaniaPakistanPanamaPeruPhilippinesPolandPortugalRomaniaRussiaScotlandSenegalSerbiaSierra LeoneSingaporeSomaliaSouth AfricaSouth AmericaSouth Central AsiaSouth Eastern AsiaSouthern EuropeSpainSri LankaSt. Vincent and the GrenadinesSudanSwedenSwitzerlandSyriaTaiwanThailandTrinidad and TobagoTurkeyUgandaUkraineUruguayUzbekistanVenezuelaVietnamWest IndiesWestern AfricaWestern AsiaWestern EuropeYemenZaireZimbabweAzores
Disability Age Under 5
Income
Poverty
Unemployment
Labor Participation
Family Structure
Vehicle Availability
Education Level
Disability

Disability Age Under 5 Comparison

Immigrants from Saudi Arabia

Albanians

Average
Exceptional
1.2%
DISABILITY AGE UNDER 5
43.3/ 100
METRIC RATING
183rd/ 347
METRIC RANK
1.1%
DISABILITY AGE UNDER 5
97.2/ 100
METRIC RATING
91st/ 347
METRIC RANK

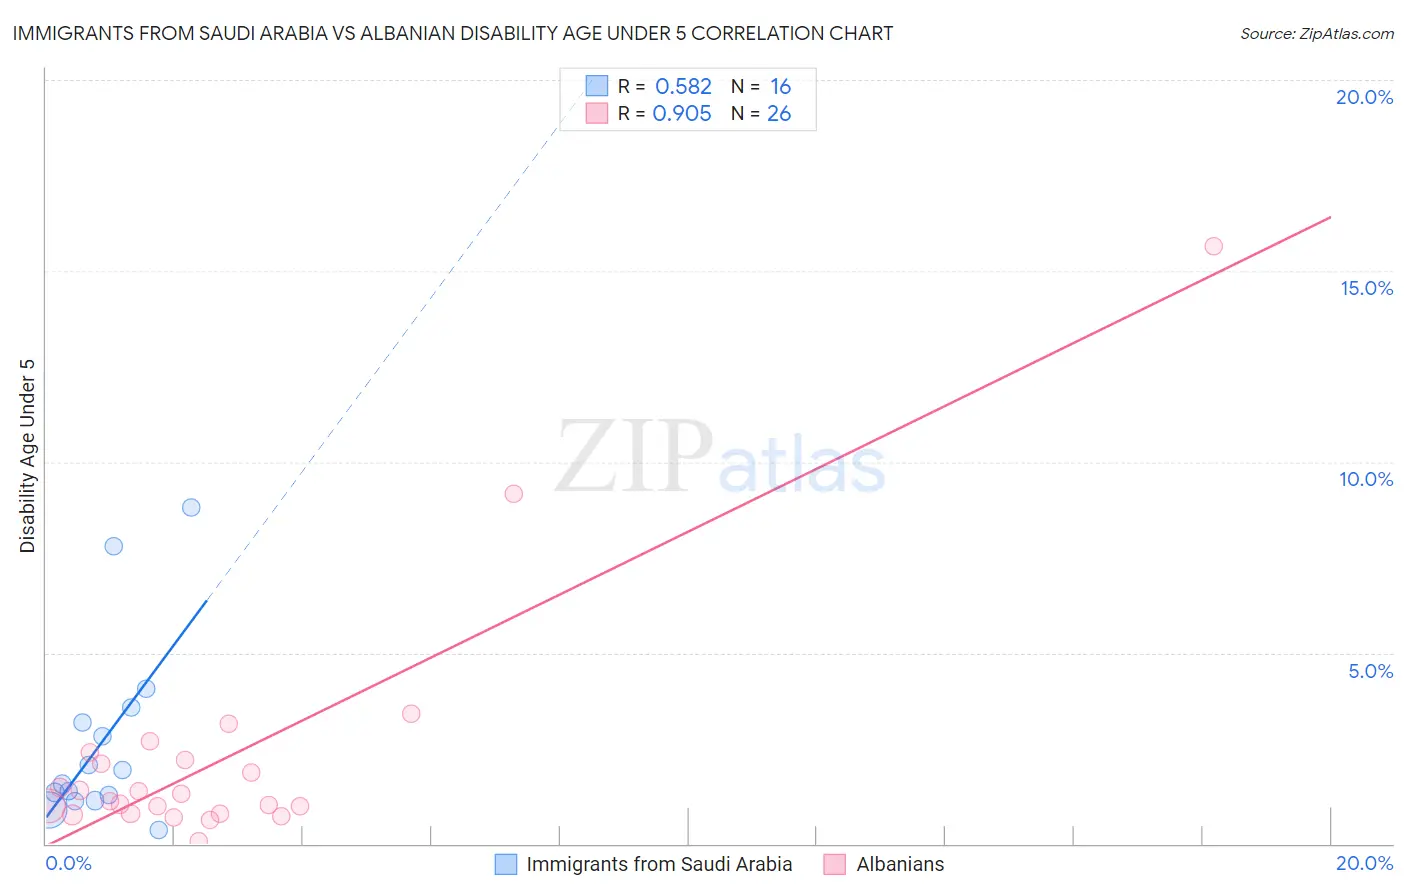
Immigrants from Saudi Arabia vs Albanian Disability Age Under 5 Correlation Chart

The statistical analysis conducted on geographies consisting of 116,171,188 people shows a substantial positive correlation between the proportion of Immigrants from Saudi Arabia and percentage of population with a disability under the age of 5 in the United States with a correlation coefficient (R) of 0.582 and weighted average of 1.2%. Similarly, the statistical analysis conducted on geographies consisting of 123,207,813 people shows a near-perfect positive correlation between the proportion of Albanians and percentage of population with a disability under the age of 5 in the United States with a correlation coefficient (R) of 0.905 and weighted average of 1.1%, a difference of 9.3%.
Immigrants from Saudi Arabia vs Albanian Disability Age Under 5

Disability Age Under 5 Correlation Summary

MeasurementImmigrants from Saudi ArabiaAlbanian
Minimum0.35%0.063%
Maximum8.8%15.7%
Range8.5%15.6%
Mean2.7%2.3%
Median1.8%1.2%
Interquartile 25% (IQ1)1.2%0.78%
Interquartile 75% (IQ3)3.4%2.2%
Interquartile Range (IQR)2.2%1.4%
Standard Deviation (Sample)2.4%3.2%
Standard Deviation (Population)2.3%3.2%

Similar Demographics by Disability Age Under 5

Demographics Similar to Immigrants from Saudi Arabia by Disability Age Under 5

In terms of disability age under 5, the demographic groups most similar to Immigrants from Saudi Arabia are Palestinian (1.2%, a difference of 0.020%), Macedonian (1.2%, a difference of 0.040%), Immigrants from Peru (1.2%, a difference of 0.040%), Immigrants from Western Africa (1.2%, a difference of 0.070%), and Cuban (1.2%, a difference of 0.080%).
DemographicsRating | RankDisability Age Under 5
Immigrants | Kenya
48.6
/100
|
#176
Average
1.2%
Comanche
47.5
/100
|
#177
Average
1.2%
Venezuelans
47.1
/100
|
#178
Average
1.2%
Immigrants | Bahamas
45.2
/100
|
#179
Average
1.2%
Immigrants | Mexico
44.4
/100
|
#180
Average
1.2%
Macedonians
43.7
/100
|
#181
Average
1.2%
Immigrants | Peru
43.7
/100
|
#181
Average
1.2%
Immigrants | Saudi Arabia
43.3
/100
|
#183
Average
1.2%
Palestinians
43.0
/100
|
#184
Average
1.2%
Immigrants | Western Africa
42.5
/100
|
#185
Average
1.2%
Cubans
42.5
/100
|
#186
Average
1.2%
Immigrants | Haiti
40.2
/100
|
#187
Average
1.3%
Haitians
39.9
/100
|
#188
Fair
1.3%
Peruvians
37.6
/100
|
#189
Fair
1.3%
Immigrants | Laos
36.6
/100
|
#190
Fair
1.3%

Demographics Similar to Albanians by Disability Age Under 5

In terms of disability age under 5, the demographic groups most similar to Albanians are Chinese (1.1%, a difference of 0.040%), Ethiopian (1.1%, a difference of 0.070%), Immigrants from Cuba (1.1%, a difference of 0.17%), Spanish American (1.1%, a difference of 0.20%), and Sri Lankan (1.1%, a difference of 0.26%).
DemographicsRating | RankDisability Age Under 5
Immigrants | Zaire
97.8
/100
|
#84
Exceptional
1.1%
Sudanese
97.7
/100
|
#85
Exceptional
1.1%
Okinawans
97.6
/100
|
#86
Exceptional
1.1%
Ugandans
97.5
/100
|
#87
Exceptional
1.1%
Immigrants | Dominican Republic
97.5
/100
|
#88
Exceptional
1.1%
Ethiopians
97.2
/100
|
#89
Exceptional
1.1%
Chinese
97.2
/100
|
#90
Exceptional
1.1%
Albanians
97.2
/100
|
#91
Exceptional
1.1%
Immigrants | Cuba
97.0
/100
|
#92
Exceptional
1.1%
Spanish Americans
96.9
/100
|
#93
Exceptional
1.1%
Sri Lankans
96.8
/100
|
#94
Exceptional
1.1%
Immigrants | Moldova
96.8
/100
|
#95
Exceptional
1.1%
Mongolians
96.6
/100
|
#96
Exceptional
1.1%
Immigrants | Iraq
96.5
/100
|
#97
Exceptional
1.1%
Immigrants | South Eastern Asia
96.5
/100
|
#98
Exceptional
1.1%