Cities with the Highest Percentage of Population with a Degree in Liberal Arts and History in Delaware
RELATED REPORTS & OPTIONS
Liberal Arts and History
Delaware
Compare Cities
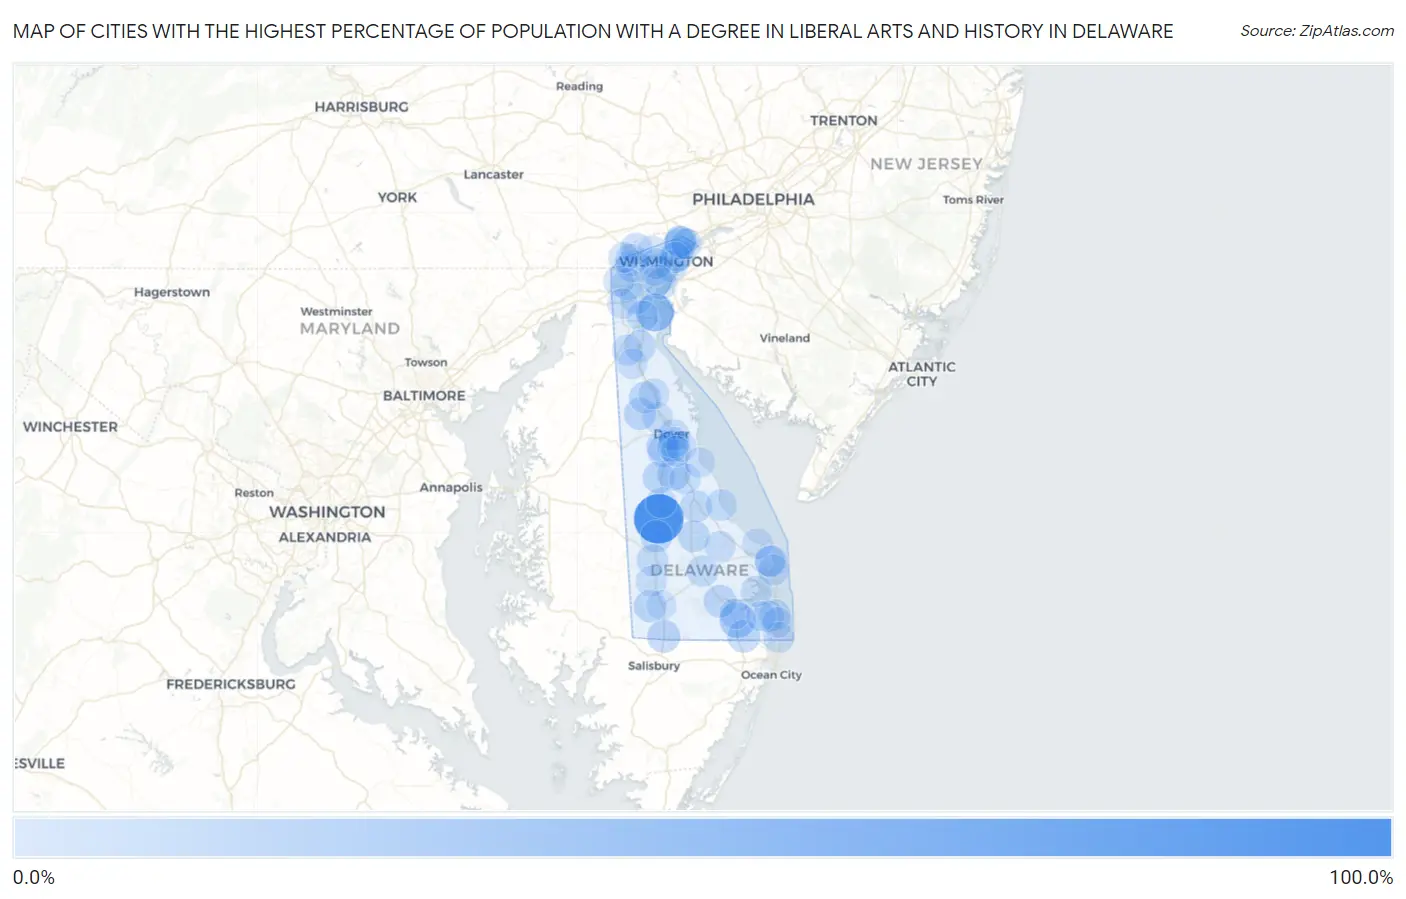
Map of Cities with the Highest Percentage of Population with a Degree in Liberal Arts and History in Delaware
0.0%
100.0%
Cities with the Highest Percentage of Population with a Degree in Liberal Arts and History in Delaware
| City | % Graduates | vs State | vs National | |
| 1. | Farmington | 93.4% | 5.5%(+88.0)#1 | 4.9%(+88.6)#93 |
| 2. | Delaware City | 36.7% | 5.5%(+31.3)#2 | 4.9%(+31.8)#442 |
| 3. | Frankford | 26.0% | 5.5%(+20.6)#3 | 4.9%(+21.2)#842 |
| 4. | Delmar | 13.5% | 5.5%(+8.09)#4 | 4.9%(+8.67)#2,444 |
| 5. | Riverview | 13.1% | 5.5%(+7.66)#5 | 4.9%(+8.24)#2,579 |
| 6. | Millsboro | 12.1% | 5.5%(+6.67)#6 | 4.9%(+7.25)#2,915 |
| 7. | Selbyville | 11.8% | 5.5%(+6.34)#7 | 4.9%(+6.92)#3,059 |
| 8. | Bethel | 10.6% | 5.5%(+5.13)#8 | 4.9%(+5.70)#3,651 |
| 9. | Bellefonte | 10.5% | 5.5%(+5.05)#9 | 4.9%(+5.63)#3,712 |
| 10. | Camden | 10.2% | 5.5%(+4.80)#10 | 4.9%(+5.38)#3,844 |
| 11. | Kenton | 10.0% | 5.5%(+4.55)#11 | 4.9%(+5.13)#3,992 |
| 12. | Henlopen Acres | 10.0% | 5.5%(+4.55)#12 | 4.9%(+5.13)#4,008 |
| 13. | Ardentown | 9.3% | 5.5%(+3.82)#13 | 4.9%(+4.40)#4,491 |
| 14. | Greenwood | 9.3% | 5.5%(+3.81)#14 | 4.9%(+4.39)#4,498 |
| 15. | Felton | 9.1% | 5.5%(+3.68)#15 | 4.9%(+4.26)#4,607 |
| 16. | Pike Creek Valley | 8.8% | 5.5%(+3.32)#16 | 4.9%(+3.90)#4,902 |
| 17. | Milford | 8.5% | 5.5%(+3.04)#17 | 4.9%(+3.62)#5,148 |
| 18. | Wyoming | 8.4% | 5.5%(+3.00)#18 | 4.9%(+3.58)#5,170 |
| 19. | Clayton | 8.4% | 5.5%(+2.91)#19 | 4.9%(+3.49)#5,250 |
| 20. | Ellendale | 8.3% | 5.5%(+2.88)#20 | 4.9%(+3.46)#5,290 |
| 21. | Pike Creek | 8.2% | 5.5%(+2.78)#21 | 4.9%(+3.36)#5,424 |
| 22. | Wilmington | 7.8% | 5.5%(+2.38)#22 | 4.9%(+2.96)#5,839 |
| 23. | Odessa | 7.6% | 5.5%(+2.18)#23 | 4.9%(+2.76)#6,065 |
| 24. | Hockessin | 7.6% | 5.5%(+2.15)#24 | 4.9%(+2.73)#6,103 |
| 25. | Ardencroft | 7.3% | 5.5%(+1.89)#25 | 4.9%(+2.47)#6,417 |
| 26. | Bridgeville | 7.1% | 5.5%(+1.61)#26 | 4.9%(+2.19)#6,791 |
| 27. | Brookside | 6.5% | 5.5%(+1.01)#27 | 4.9%(+1.59)#7,634 |
| 28. | New Castle | 6.3% | 5.5%(+0.882)#28 | 4.9%(+1.46)#7,839 |
| 29. | Newport | 6.1% | 5.5%(+0.646)#29 | 4.9%(+1.23)#8,220 |
| 30. | Bethany Beach | 6.0% | 5.5%(+0.529)#30 | 4.9%(+1.11)#8,434 |
| 31. | Highland Acres | 6.0% | 5.5%(+0.525)#31 | 4.9%(+1.10)#8,439 |
| 32. | Georgetown | 5.7% | 5.5%(+0.278)#32 | 4.9%(+0.858)#8,903 |
| 33. | Bear | 5.7% | 5.5%(+0.219)#33 | 4.9%(+0.798)#9,026 |
| 34. | Dover | 5.7% | 5.5%(+0.201)#34 | 4.9%(+0.780)#9,063 |
| 35. | Slaughter Beach | 5.6% | 5.5%(+0.198)#35 | 4.9%(+0.778)#9,068 |
| 36. | St Georges | 5.5% | 5.5%(+0.075)#36 | 4.9%(+0.654)#9,321 |
| 37. | Arden | 5.5% | 5.5%(+0.021)#37 | 4.9%(+0.600)#9,416 |
| 38. | Edgemoor | 4.7% | 5.5%(-0.747)#38 | 4.9%(-0.168)#11,106 |
| 39. | Frederica | 4.5% | 5.5%(-0.957)#39 | 4.9%(-0.378)#11,566 |
| 40. | Ocean View | 4.5% | 5.5%(-0.980)#40 | 4.9%(-0.401)#11,618 |
| 41. | Long Neck | 4.4% | 5.5%(-1.05)#41 | 4.9%(-0.467)#11,780 |
| 42. | Kent Acres | 4.4% | 5.5%(-1.09)#42 | 4.9%(-0.507)#11,869 |
| 43. | Dewey Beach | 4.3% | 5.5%(-1.18)#43 | 4.9%(-0.599)#12,106 |
| 44. | Middletown | 4.2% | 5.5%(-1.30)#44 | 4.9%(-0.716)#12,401 |
| 45. | Seaford | 4.0% | 5.5%(-1.41)#45 | 4.9%(-0.826)#12,621 |
| 46. | Greenville | 3.8% | 5.5%(-1.67)#46 | 4.9%(-1.09)#13,256 |
| 47. | Cheswold | 3.7% | 5.5%(-1.71)#47 | 4.9%(-1.13)#13,354 |
| 48. | Elsmere | 3.5% | 5.5%(-1.95)#48 | 4.9%(-1.37)#13,960 |
| 49. | Newark | 3.5% | 5.5%(-1.97)#49 | 4.9%(-1.39)#14,003 |
| 50. | Wilmington Manor | 3.3% | 5.5%(-2.10)#50 | 4.9%(-1.52)#14,335 |
| 51. | Smyrna | 3.3% | 5.5%(-2.16)#51 | 4.9%(-1.58)#14,481 |
| 52. | Fenwick Island | 3.3% | 5.5%(-2.18)#52 | 4.9%(-1.60)#14,529 |
| 53. | Claymont | 3.2% | 5.5%(-2.23)#53 | 4.9%(-1.65)#14,643 |
| 54. | North Star | 3.2% | 5.5%(-2.29)#54 | 4.9%(-1.71)#14,778 |
| 55. | Milton | 2.9% | 5.5%(-2.57)#55 | 4.9%(-1.99)#15,426 |
| 56. | Lewes | 2.9% | 5.5%(-2.59)#56 | 4.9%(-2.02)#15,476 |
| 57. | Rehoboth Beach | 2.8% | 5.5%(-2.67)#57 | 4.9%(-2.09)#15,612 |
| 58. | Harrington | 2.7% | 5.5%(-2.79)#58 | 4.9%(-2.21)#15,882 |
| 59. | Dover Base Housing | 2.5% | 5.5%(-2.91)#59 | 4.9%(-2.33)#16,153 |
| 60. | Rising Sun Lebanon | 2.1% | 5.5%(-3.33)#60 | 4.9%(-2.75)#17,005 |
| 61. | South Bethany | 2.1% | 5.5%(-3.38)#61 | 4.9%(-2.80)#17,090 |
| 62. | Glasgow | 2.1% | 5.5%(-3.38)#62 | 4.9%(-2.80)#17,096 |
| 63. | Dagsboro | 1.9% | 5.5%(-3.58)#63 | 4.9%(-3.00)#17,447 |
| 64. | Townsend | 1.6% | 5.5%(-3.88)#64 | 4.9%(-3.30)#17,954 |
| 65. | Millville | 1.3% | 5.5%(-4.11)#65 | 4.9%(-3.53)#18,278 |
| 66. | Bowers | 1.1% | 5.5%(-4.38)#66 | 4.9%(-3.80)#18,598 |
| 67. | Laurel | 0.55% | 5.5%(-4.90)#67 | 4.9%(-4.32)#19,024 |
1
Common Questions
What are the Top 10 Cities with the Highest Percentage of Population with a Degree in Liberal Arts and History in Delaware?
Top 10 Cities with the Highest Percentage of Population with a Degree in Liberal Arts and History in Delaware are:
#1
93.4%
#2
36.7%
#3
26.0%
#4
13.5%
#5
13.1%
#6
12.1%
#7
11.8%
#8
10.6%
#9
10.5%
#10
10.2%
What city has the Highest Percentage of Population with a Degree in Liberal Arts and History in Delaware?
Farmington has the Highest Percentage of Population with a Degree in Liberal Arts and History in Delaware with 93.4%.
What is the Percentage of Population with a Degree in Liberal Arts and History in the State of Delaware?
Percentage of Population with a Degree in Liberal Arts and History in Delaware is 5.5%.
What is the Percentage of Population with a Degree in Liberal Arts and History in the United States?
Percentage of Population with a Degree in Liberal Arts and History in the United States is 4.9%.