Woodside, DE Map & Demographics
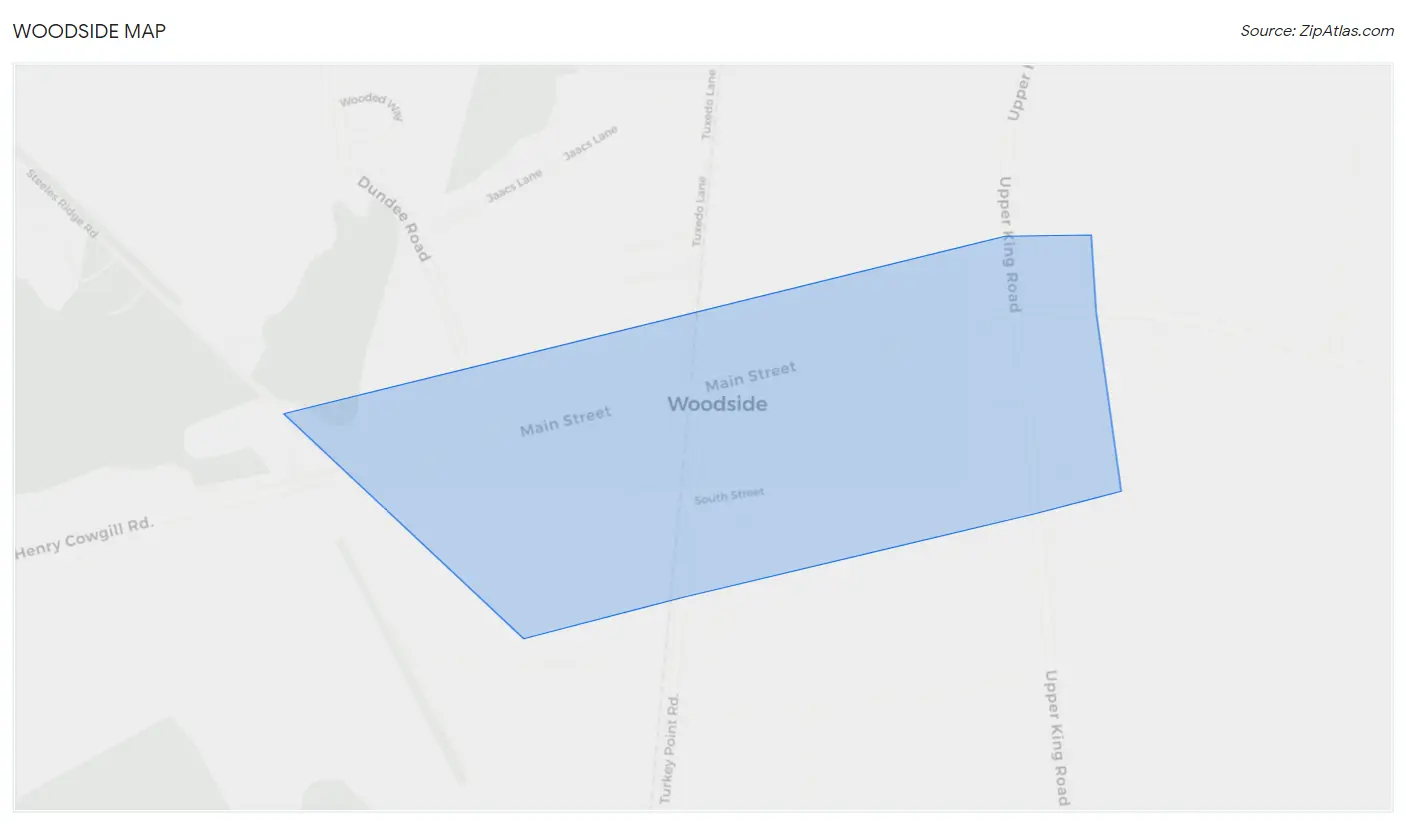
Woodside Map
Woodside Overview
$26,368
PER CAPITA INCOME
$80,938
AVG FAMILY INCOME
$77,500
AVG HOUSEHOLD INCOME
13.6%
WAGE / INCOME GAP [ % ]
86.4¢/ $1
WAGE / INCOME GAP [ $ ]
0.32
INEQUALITY / GINI INDEX
253
TOTAL POPULATION
120
MALE POPULATION
133
FEMALE POPULATION
90.23
MALES / 100 FEMALES
110.83
FEMALES / 100 MALES
49.9
MEDIAN AGE
2.8
AVG FAMILY SIZE
2.5
AVG HOUSEHOLD SIZE
116
LABOR FORCE [ PEOPLE ]
56.6%
PERCENT IN LABOR FORCE
3.4%
UNEMPLOYMENT RATE
Woodside Zip Codes
Woodside Area Codes
Income in Woodside
Income Overview in Woodside
Per Capita Income in Woodside is $26,368, while median incomes of families and households are $80,938 and $77,500 respectively.
| Characteristic | Number | Measure |
| Per Capita Income | 253 | $26,368 |
| Median Family Income | 76 | $80,938 |
| Mean Family Income | 76 | $76,711 |
| Median Household Income | 102 | $77,500 |
| Mean Household Income | 102 | $66,688 |
| Income Deficit | 76 | $0 |
| Wage / Income Gap (%) | 253 | 13.56% |
| Wage / Income Gap ($) | 253 | 86.44¢ per $1 |
| Gini / Inequality Index | 253 | 0.32 |
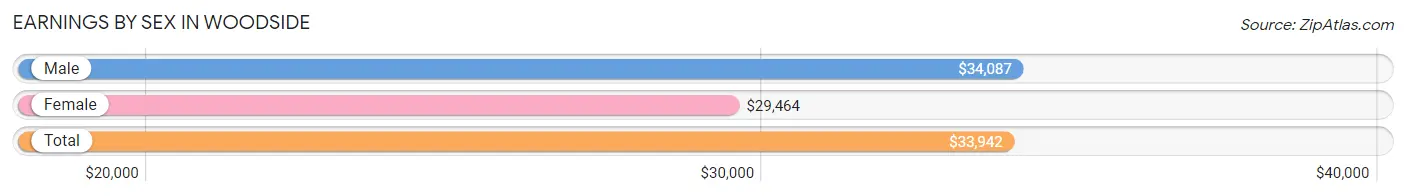
Earnings by Sex in Woodside
Average Earnings in Woodside are $33,942, $34,087 for men and $29,464 for women, a difference of 13.6%.
| Sex | Number | Average Earnings |
| Male | 79 (63.7%) | $34,087 |
| Female | 45 (36.3%) | $29,464 |
| Total | 124 (100.0%) | $33,942 |
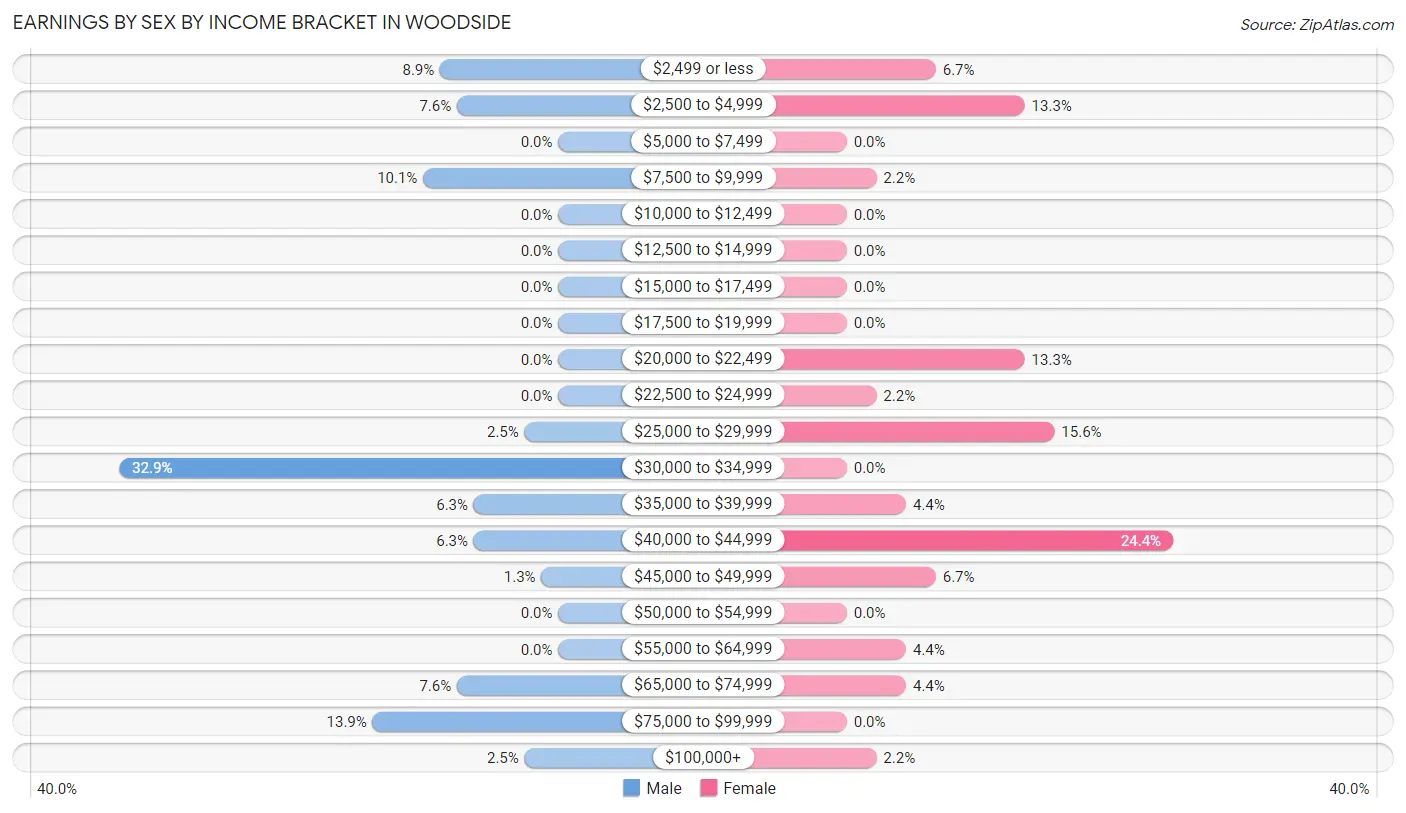
Earnings by Sex by Income Bracket in Woodside
The most common earnings brackets in Woodside are $30,000 to $34,999 for men (26 | 32.9%) and $40,000 to $44,999 for women (11 | 24.4%).
| Income | Male | Female |
| $2,499 or less | 7 (8.9%) | 3 (6.7%) |
| $2,500 to $4,999 | 6 (7.6%) | 6 (13.3%) |
| $5,000 to $7,499 | 0 (0.0%) | 0 (0.0%) |
| $7,500 to $9,999 | 8 (10.1%) | 1 (2.2%) |
| $10,000 to $12,499 | 0 (0.0%) | 0 (0.0%) |
| $12,500 to $14,999 | 0 (0.0%) | 0 (0.0%) |
| $15,000 to $17,499 | 0 (0.0%) | 0 (0.0%) |
| $17,500 to $19,999 | 0 (0.0%) | 0 (0.0%) |
| $20,000 to $22,499 | 0 (0.0%) | 6 (13.3%) |
| $22,500 to $24,999 | 0 (0.0%) | 1 (2.2%) |
| $25,000 to $29,999 | 2 (2.5%) | 7 (15.6%) |
| $30,000 to $34,999 | 26 (32.9%) | 0 (0.0%) |
| $35,000 to $39,999 | 5 (6.3%) | 2 (4.4%) |
| $40,000 to $44,999 | 5 (6.3%) | 11 (24.4%) |
| $45,000 to $49,999 | 1 (1.3%) | 3 (6.7%) |
| $50,000 to $54,999 | 0 (0.0%) | 0 (0.0%) |
| $55,000 to $64,999 | 0 (0.0%) | 2 (4.4%) |
| $65,000 to $74,999 | 6 (7.6%) | 2 (4.4%) |
| $75,000 to $99,999 | 11 (13.9%) | 0 (0.0%) |
| $100,000+ | 2 (2.5%) | 1 (2.2%) |
| Total | 79 (100.0%) | 45 (100.0%) |
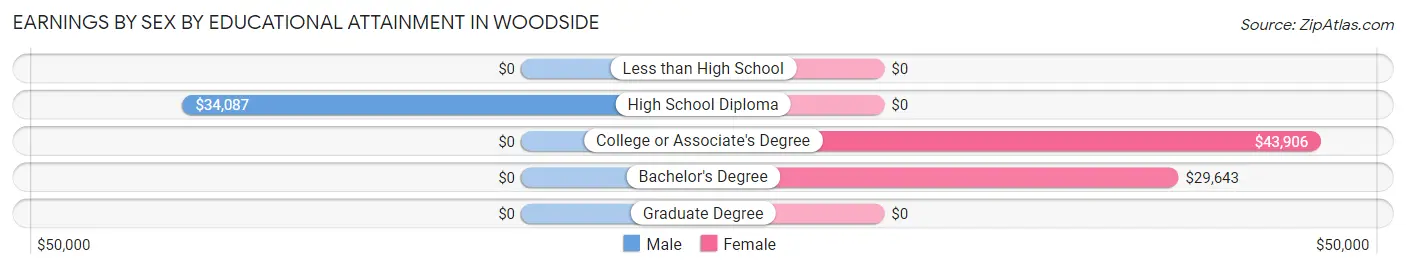
Earnings by Sex by Educational Attainment in Woodside
Average earnings in Woodside are $34,375 for men and $29,643 for women, a difference of 13.8%. Men with an educational attainment of high school diploma enjoy the highest average annual earnings of $34,087, while those with high school diploma education earn the least with $34,087. Women with an educational attainment of college or associate's degree earn the most with the average annual earnings of $43,906, while those with bachelor's degree education have the smallest earnings of $29,643.
| Educational Attainment | Male Income | Female Income |
| Less than High School | - | - |
| High School Diploma | $34,087 | $0 |
| College or Associate's Degree | - | - |
| Bachelor's Degree | - | - |
| Graduate Degree | - | - |
| Total | $34,375 | $29,643 |
Family Income in Woodside
Family Income Brackets in Woodside
According to the Woodside family income data, there are 34 families falling into the $75,000 to $99,999 income range, which is the most common income bracket and makes up 44.7% of all families.
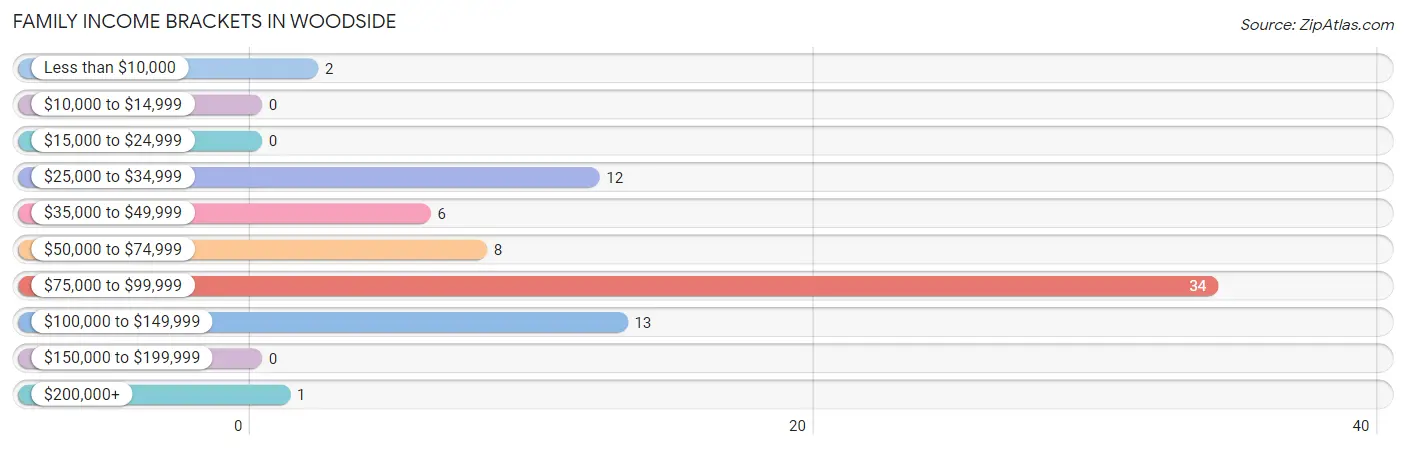
| Income Bracket | # Families | % Families |
| Less than $10,000 | 2 | 2.6% |
| $10,000 to $14,999 | 0 | 0.0% |
| $15,000 to $24,999 | 0 | 0.0% |
| $25,000 to $34,999 | 12 | 15.8% |
| $35,000 to $49,999 | 6 | 7.9% |
| $50,000 to $74,999 | 8 | 10.5% |
| $75,000 to $99,999 | 34 | 44.7% |
| $100,000 to $149,999 | 13 | 17.1% |
| $150,000 to $199,999 | 0 | 0.0% |
| $200,000+ | 1 | 1.3% |
Family Income by Famaliy Size in Woodside
2-person families (55 | 72.4%) account for the highest median family income in Woodside with $81,198 per family, while 2-person families (55 | 72.4%) have the highest median income of $40,599 per family member.
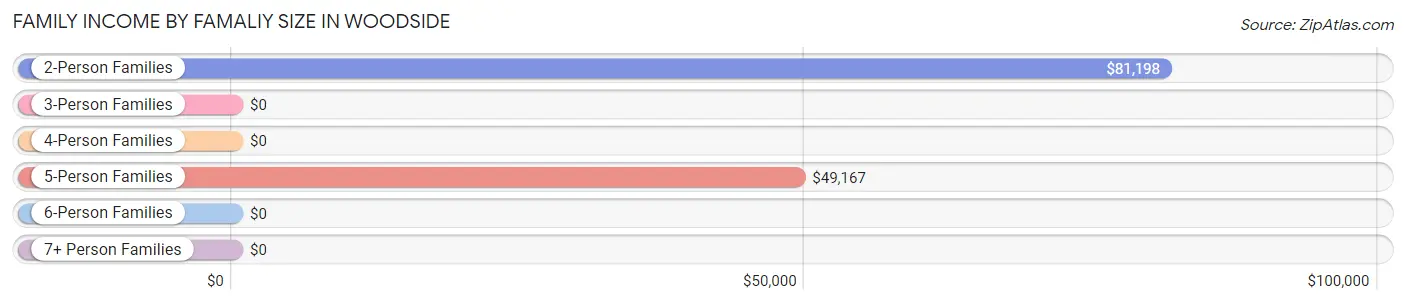
| Income Bracket | # Families | Median Income |
| 2-Person Families | 55 (72.4%) | $81,198 |
| 3-Person Families | 7 (9.2%) | $0 |
| 4-Person Families | 2 (2.6%) | $0 |
| 5-Person Families | 8 (10.5%) | $49,167 |
| 6-Person Families | 4 (5.3%) | $0 |
| 7+ Person Families | 0 (0.0%) | $0 |
| Total | 76 (100.0%) | $80,938 |
Family Income by Number of Earners in Woodside
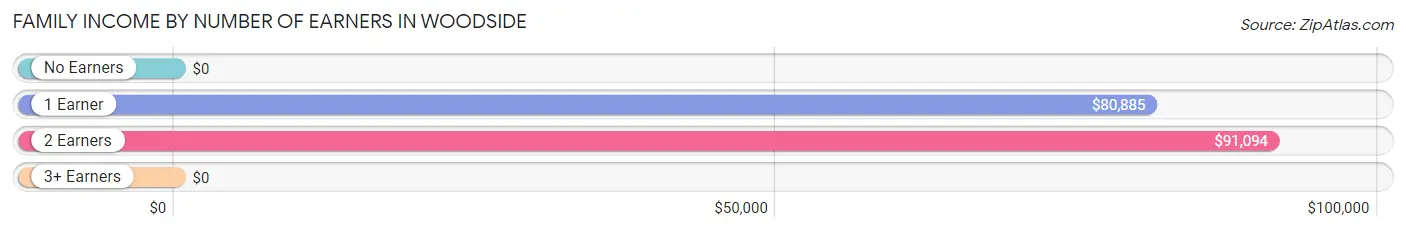
| Number of Earners | # Families | Median Income |
| No Earners | 6 (7.9%) | $0 |
| 1 Earner | 35 (46.1%) | $80,885 |
| 2 Earners | 33 (43.4%) | $91,094 |
| 3+ Earners | 2 (2.6%) | $0 |
| Total | 76 (100.0%) | $80,938 |
Household Income in Woodside
Household Income Brackets in Woodside
With 34 households falling in the category, the $75,000 to $99,999 income range is the most frequent in Woodside, accounting for 33.3% of all households.
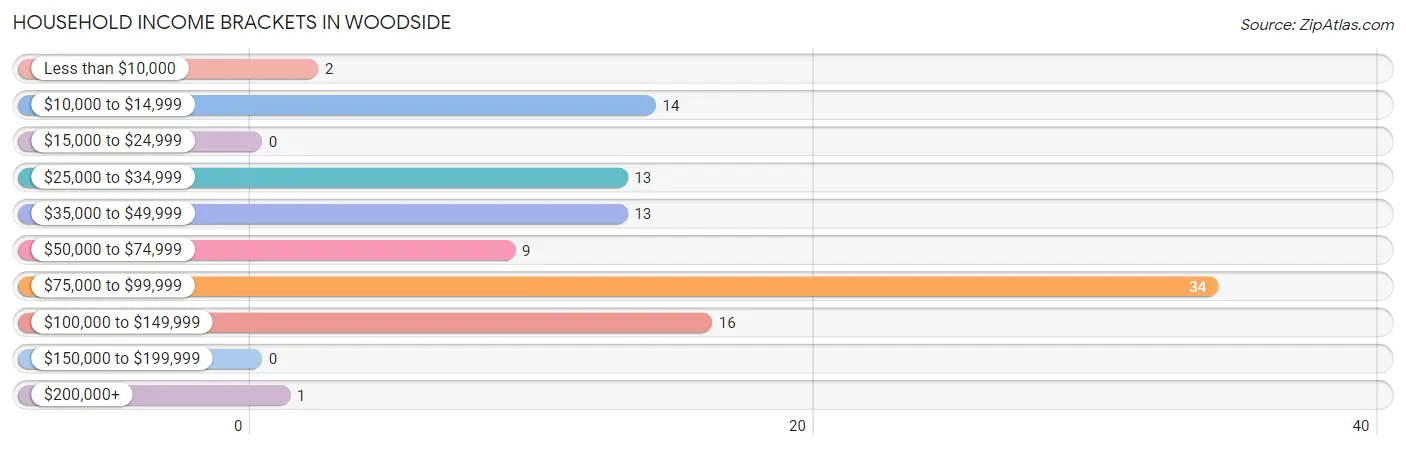
| Income Bracket | # Households | % Households |
| Less than $10,000 | 2 | 2.0% |
| $10,000 to $14,999 | 14 | 13.7% |
| $15,000 to $24,999 | 0 | 0.0% |
| $25,000 to $34,999 | 13 | 12.7% |
| $35,000 to $49,999 | 13 | 12.7% |
| $50,000 to $74,999 | 9 | 8.8% |
| $75,000 to $99,999 | 34 | 33.3% |
| $100,000 to $149,999 | 16 | 15.7% |
| $150,000 to $199,999 | 0 | 0.0% |
| $200,000+ | 1 | 1.0% |
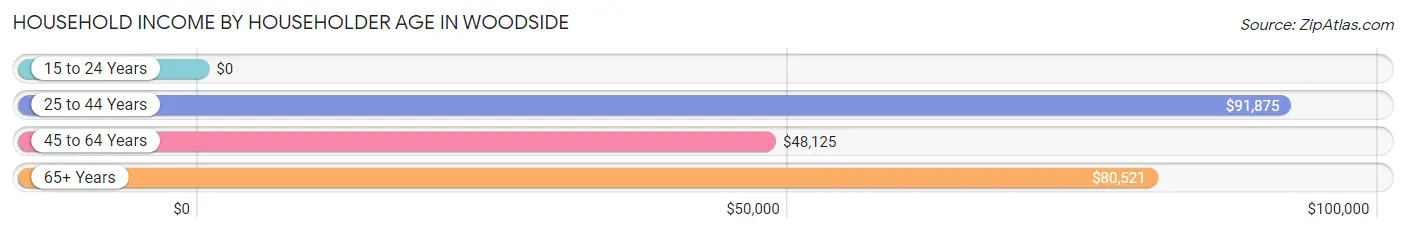
Household Income by Householder Age in Woodside
The median household income in Woodside is $77,500, with the highest median household income of $91,875 found in the 25 to 44 years age bracket for the primary householder. A total of 23 households (22.6%) fall into this category.
| Income Bracket | # Households | Median Income |
| 15 to 24 Years | 0 (0.0%) | $0 |
| 25 to 44 Years | 23 (22.6%) | $91,875 |
| 45 to 64 Years | 39 (38.2%) | $48,125 |
| 65+ Years | 40 (39.2%) | $80,521 |
| Total | 102 (100.0%) | $77,500 |
Poverty in Woodside
Income Below Poverty by Sex and Age in Woodside
With 15.0% poverty level for males and 12.8% for females among the residents of Woodside, 65 to 74 year old males and 55 to 64 year old females are the most vulnerable to poverty, with 5 males (62.5%) and 8 females (57.1%) in their respective age groups living below the poverty level.
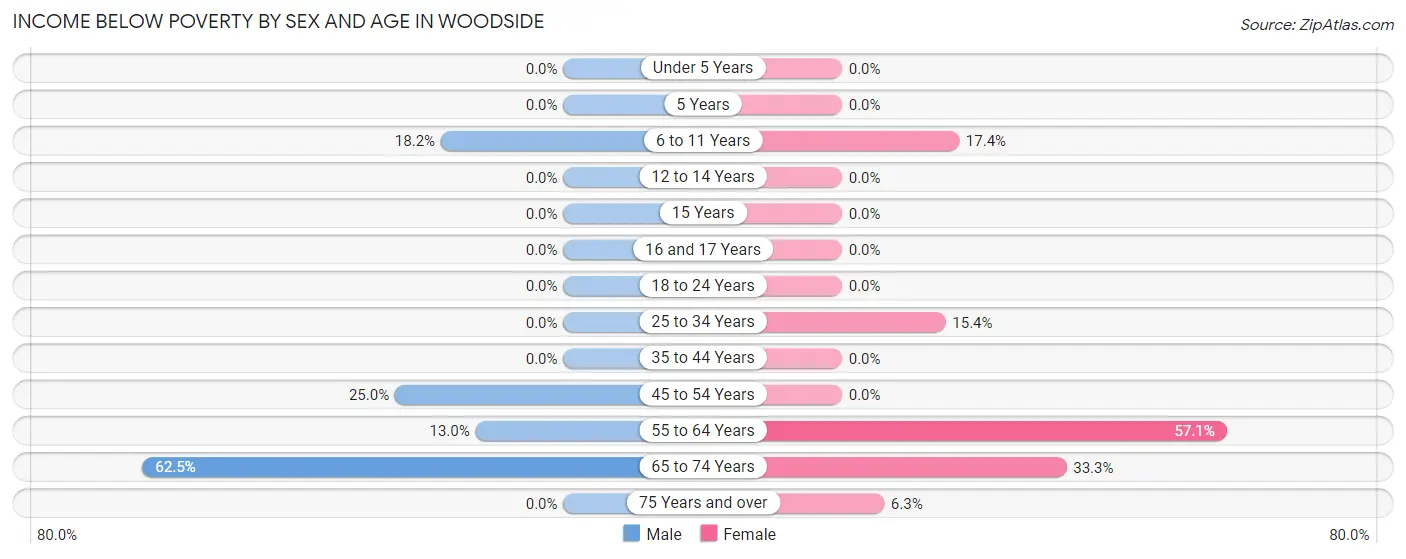
| Age Bracket | Male | Female |
| Under 5 Years | 0 (0.0%) | 0 (0.0%) |
| 5 Years | 0 (0.0%) | 0 (0.0%) |
| 6 to 11 Years | 2 (18.2%) | 4 (17.4%) |
| 12 to 14 Years | 0 (0.0%) | 0 (0.0%) |
| 15 Years | 0 (0.0%) | 0 (0.0%) |
| 16 and 17 Years | 0 (0.0%) | 0 (0.0%) |
| 18 to 24 Years | 0 (0.0%) | 0 (0.0%) |
| 25 to 34 Years | 0 (0.0%) | 2 (15.4%) |
| 35 to 44 Years | 0 (0.0%) | 0 (0.0%) |
| 45 to 54 Years | 5 (25.0%) | 0 (0.0%) |
| 55 to 64 Years | 6 (13.0%) | 8 (57.1%) |
| 65 to 74 Years | 5 (62.5%) | 1 (33.3%) |
| 75 Years and over | 0 (0.0%) | 2 (6.2%) |
| Total | 18 (15.0%) | 17 (12.8%) |
Income Above Poverty by Sex and Age in Woodside
According to the poverty statistics in Woodside, males aged 16 and 17 years and females aged under 5 years are the age groups that are most secure financially, with 100.0% of males and 100.0% of females in these age groups living above the poverty line.
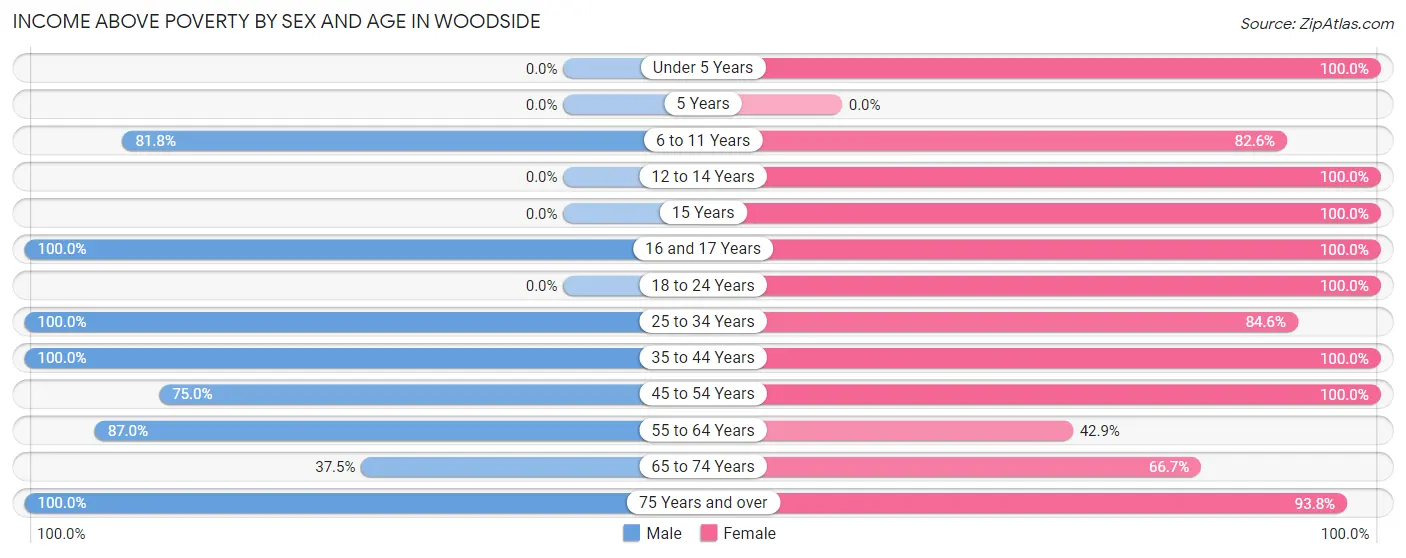
| Age Bracket | Male | Female |
| Under 5 Years | 0 (0.0%) | 6 (100.0%) |
| 5 Years | 0 (0.0%) | 0 (0.0%) |
| 6 to 11 Years | 9 (81.8%) | 19 (82.6%) |
| 12 to 14 Years | 0 (0.0%) | 1 (100.0%) |
| 15 Years | 0 (0.0%) | 7 (100.0%) |
| 16 and 17 Years | 6 (100.0%) | 2 (100.0%) |
| 18 to 24 Years | 0 (0.0%) | 1 (100.0%) |
| 25 to 34 Years | 16 (100.0%) | 11 (84.6%) |
| 35 to 44 Years | 6 (100.0%) | 12 (100.0%) |
| 45 to 54 Years | 15 (75.0%) | 19 (100.0%) |
| 55 to 64 Years | 40 (87.0%) | 6 (42.9%) |
| 65 to 74 Years | 3 (37.5%) | 2 (66.7%) |
| 75 Years and over | 7 (100.0%) | 30 (93.8%) |
| Total | 102 (85.0%) | 116 (87.2%) |
Income Below Poverty Among Married-Couple Families in Woodside
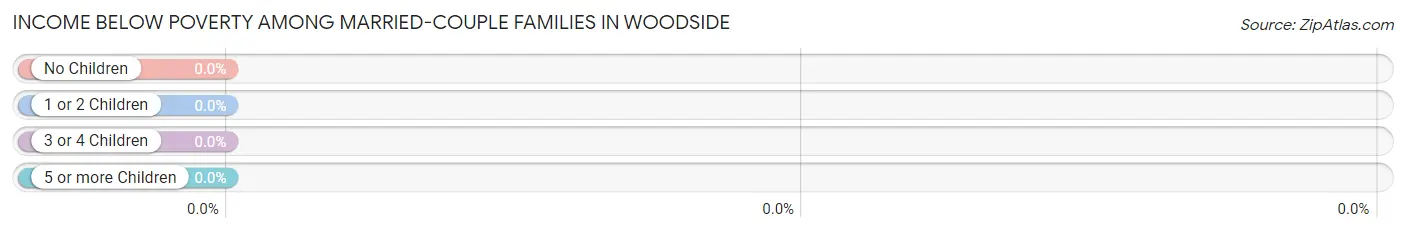
| Children | Above Poverty | Below Poverty |
| No Children | 22 (100.0%) | 0 (0.0%) |
| 1 or 2 Children | 14 (100.0%) | 0 (0.0%) |
| 3 or 4 Children | 4 (100.0%) | 0 (0.0%) |
| 5 or more Children | 0 (0.0%) | 0 (0.0%) |
| Total | 40 (100.0%) | 0 (0.0%) |
Income Below Poverty Among Single-Parent Households in Woodside
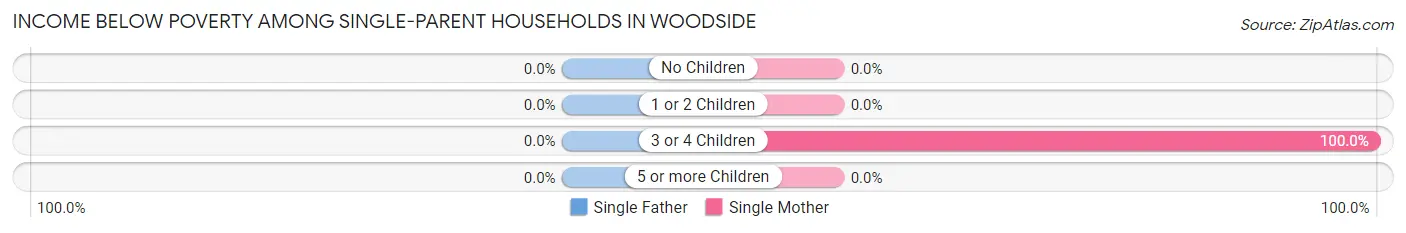
| Children | Single Father | Single Mother |
| No Children | 0 (0.0%) | 0 (0.0%) |
| 1 or 2 Children | 0 (0.0%) | 0 (0.0%) |
| 3 or 4 Children | 0 (0.0%) | 2 (100.0%) |
| 5 or more Children | 0 (0.0%) | 0 (0.0%) |
| Total | 0 (0.0%) | 2 (5.7%) |
Income Below Poverty Among Married-Couple vs Single-Parent Households in Woodside
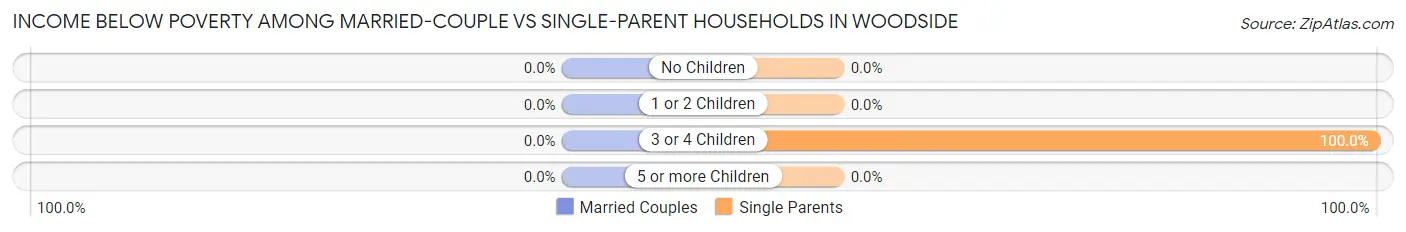
| Children | Married-Couple Families | Single-Parent Households |
| No Children | 0 (0.0%) | 0 (0.0%) |
| 1 or 2 Children | 0 (0.0%) | 0 (0.0%) |
| 3 or 4 Children | 0 (0.0%) | 2 (100.0%) |
| 5 or more Children | 0 (0.0%) | 0 (0.0%) |
| Total | 0 (0.0%) | 2 (5.6%) |
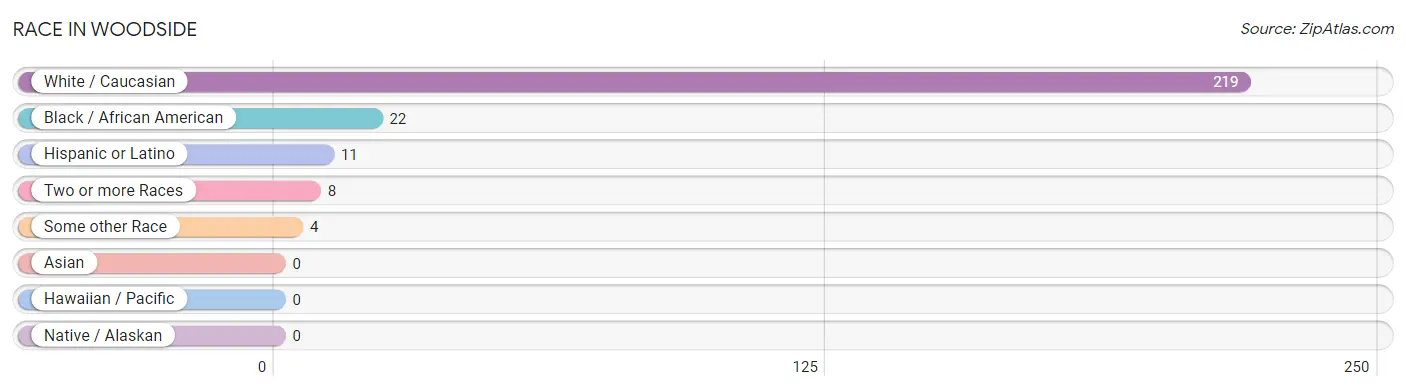
Race in Woodside
The most populous races in Woodside are White / Caucasian (219 | 86.6%), Black / African American (22 | 8.7%), and Hispanic or Latino (11 | 4.3%).
| Race | # Population | % Population |
| Asian | 0 | 0.0% |
| Black / African American | 22 | 8.7% |
| Hawaiian / Pacific | 0 | 0.0% |
| Hispanic or Latino | 11 | 4.3% |
| Native / Alaskan | 0 | 0.0% |
| White / Caucasian | 219 | 86.6% |
| Two or more Races | 8 | 3.2% |
| Some other Race | 4 | 1.6% |
| Total | 253 | 100.0% |
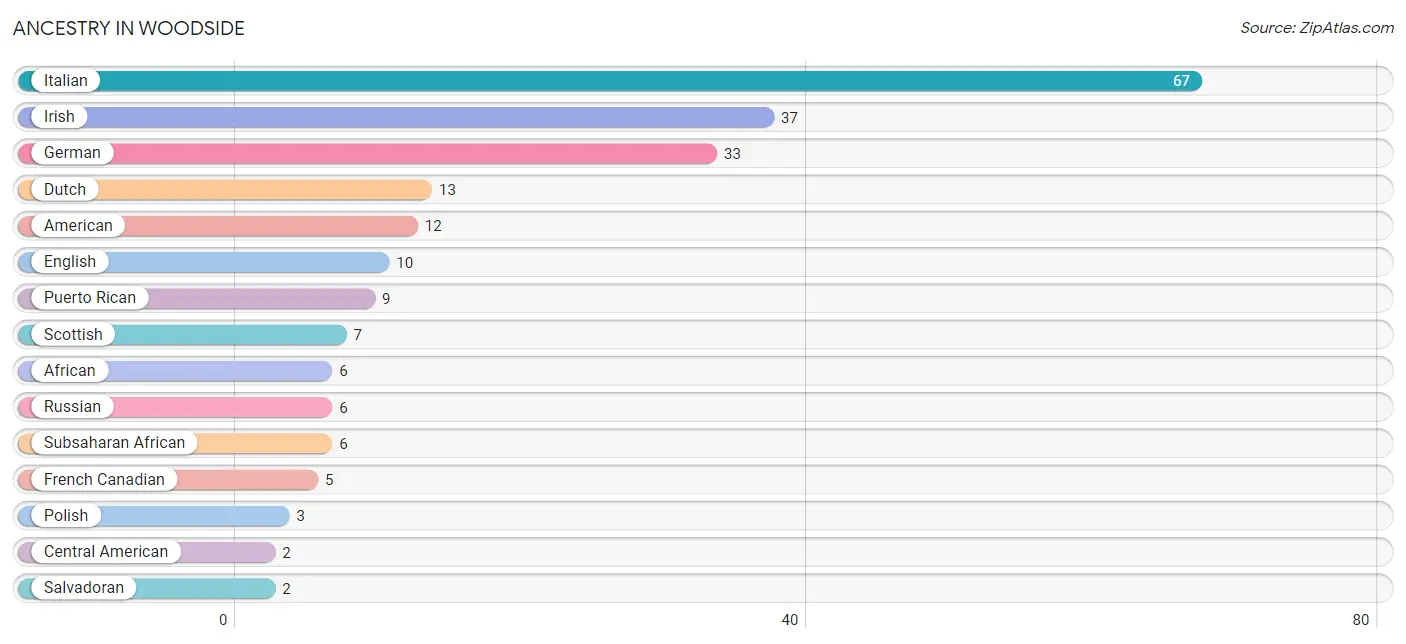
Ancestry in Woodside
The most populous ancestries reported in Woodside are Italian (67 | 26.5%), Irish (37 | 14.6%), German (33 | 13.0%), Dutch (13 | 5.1%), and American (12 | 4.7%), together accounting for 64.0% of all Woodside residents.
| Ancestry | # Population | % Population |
| African | 6 | 2.4% |
| American | 12 | 4.7% |
| British | 1 | 0.4% |
| Central American | 2 | 0.8% |
| Dutch | 13 | 5.1% |
| English | 10 | 4.0% |
| European | 1 | 0.4% |
| French Canadian | 5 | 2.0% |
| German | 33 | 13.0% |
| Irish | 37 | 14.6% |
| Italian | 67 | 26.5% |
| Polish | 3 | 1.2% |
| Puerto Rican | 9 | 3.6% |
| Russian | 6 | 2.4% |
| Salvadoran | 2 | 0.8% |
| Scottish | 7 | 2.8% |
| Subsaharan African | 6 | 2.4% | View All 17 Rows |
Immigrants in Woodside

| Immigration Origin | # Population | % Population | View All 0 Rows |
Sex and Age in Woodside
Sex and Age in Woodside
The most populous age groups in Woodside are 55 to 59 Years (44 | 36.7%) for men and 80 to 84 Years (24 | 18.0%) for women.
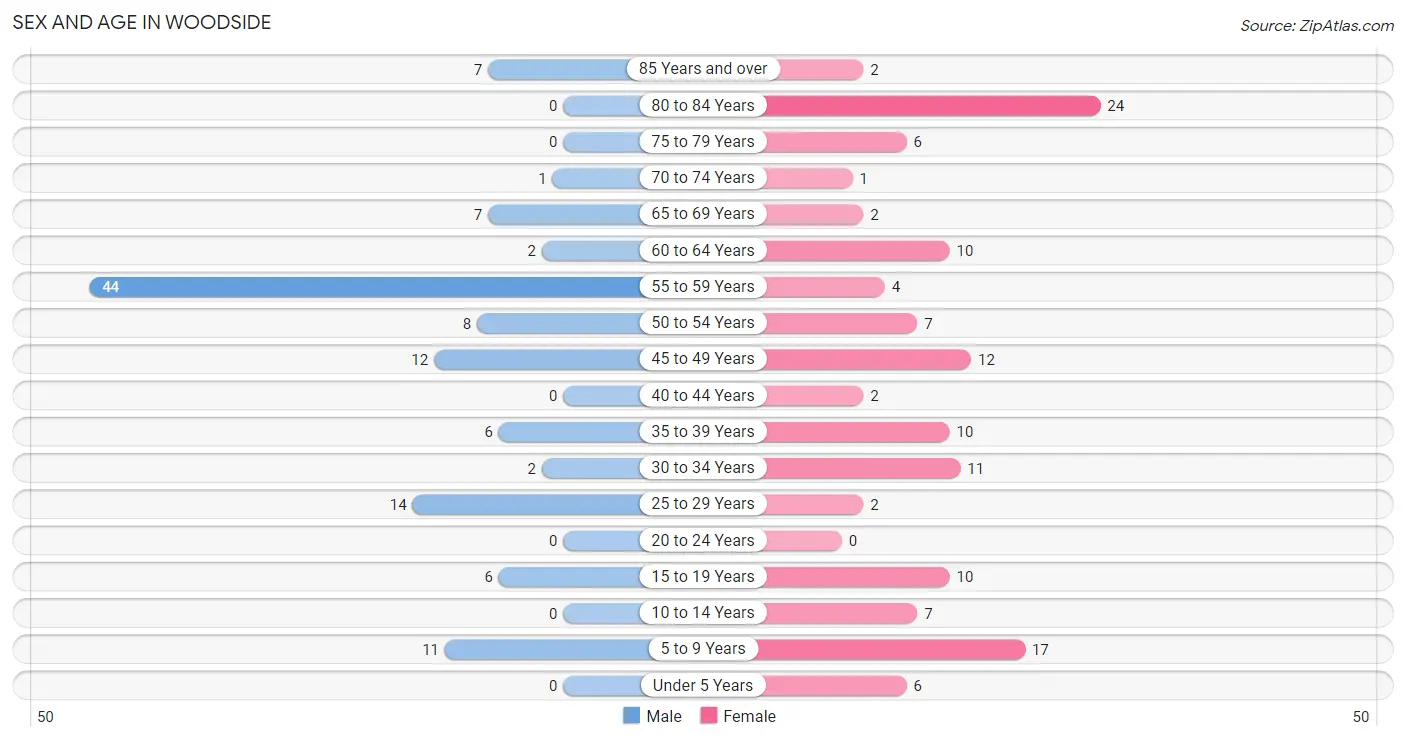
| Age Bracket | Male | Female |
| Under 5 Years | 0 (0.0%) | 6 (4.5%) |
| 5 to 9 Years | 11 (9.2%) | 17 (12.8%) |
| 10 to 14 Years | 0 (0.0%) | 7 (5.3%) |
| 15 to 19 Years | 6 (5.0%) | 10 (7.5%) |
| 20 to 24 Years | 0 (0.0%) | 0 (0.0%) |
| 25 to 29 Years | 14 (11.7%) | 2 (1.5%) |
| 30 to 34 Years | 2 (1.7%) | 11 (8.3%) |
| 35 to 39 Years | 6 (5.0%) | 10 (7.5%) |
| 40 to 44 Years | 0 (0.0%) | 2 (1.5%) |
| 45 to 49 Years | 12 (10.0%) | 12 (9.0%) |
| 50 to 54 Years | 8 (6.7%) | 7 (5.3%) |
| 55 to 59 Years | 44 (36.7%) | 4 (3.0%) |
| 60 to 64 Years | 2 (1.7%) | 10 (7.5%) |
| 65 to 69 Years | 7 (5.8%) | 2 (1.5%) |
| 70 to 74 Years | 1 (0.8%) | 1 (0.7%) |
| 75 to 79 Years | 0 (0.0%) | 6 (4.5%) |
| 80 to 84 Years | 0 (0.0%) | 24 (18.0%) |
| 85 Years and over | 7 (5.8%) | 2 (1.5%) |
| Total | 120 (100.0%) | 133 (100.0%) |
Families and Households in Woodside
Median Family Size in Woodside
The median family size in Woodside is 2.79 persons per family, with married-couple families (40 | 52.6%) accounting for the largest median family size of 3.1 persons per family. On the other hand, single male/father families (1 | 1.3%) represent the smallest median family size with 2.00 persons per family.
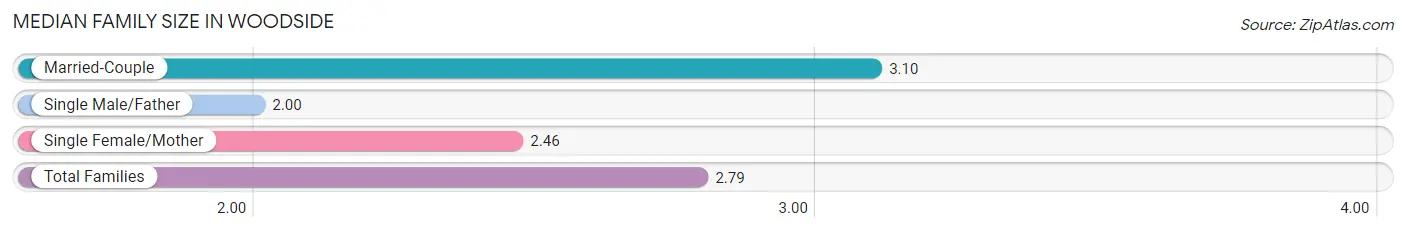
| Family Type | # Families | Family Size |
| Married-Couple | 40 (52.6%) | 3.10 |
| Single Male/Father | 1 (1.3%) | 2.00 |
| Single Female/Mother | 35 (46.1%) | 2.46 |
| Total Families | 76 (100.0%) | 2.79 |
Median Household Size in Woodside
The median household size in Woodside is 2.48 persons per household, with married-couple households (40 | 39.2%) accounting for the largest median household size of 3.1 persons per household. non-family households (26 | 25.5%) represent the smallest median household size with 1.54 persons per household.
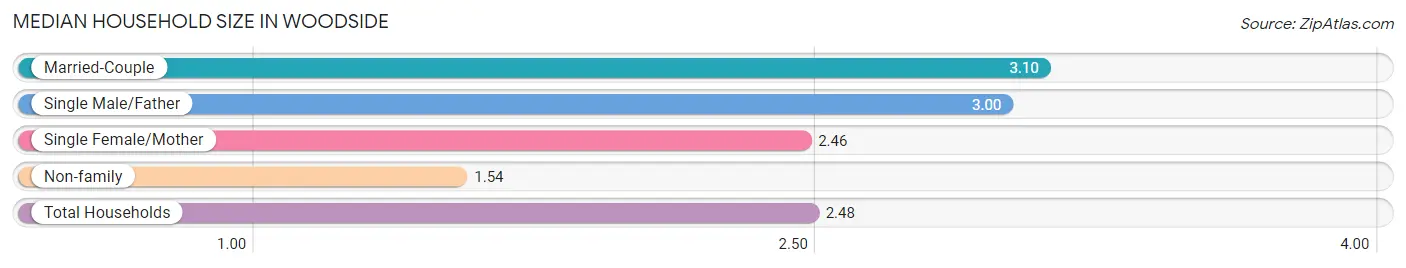
| Household Type | # Households | Household Size |
| Married-Couple | 40 (39.2%) | 3.10 |
| Single Male/Father | 1 (1.0%) | 3.00 |
| Single Female/Mother | 35 (34.3%) | 2.46 |
| Non-family | 26 (25.5%) | 1.54 |
| Total Households | 102 (100.0%) | 2.48 |
Household Size by Marriage Status in Woodside
Out of a total of 102 households in Woodside, 76 (74.5%) are family households, while 26 (25.5%) are nonfamily households. The most numerous type of family households are 2-person households, comprising 54, and the most common type of nonfamily households are 2-person households, comprising 15.
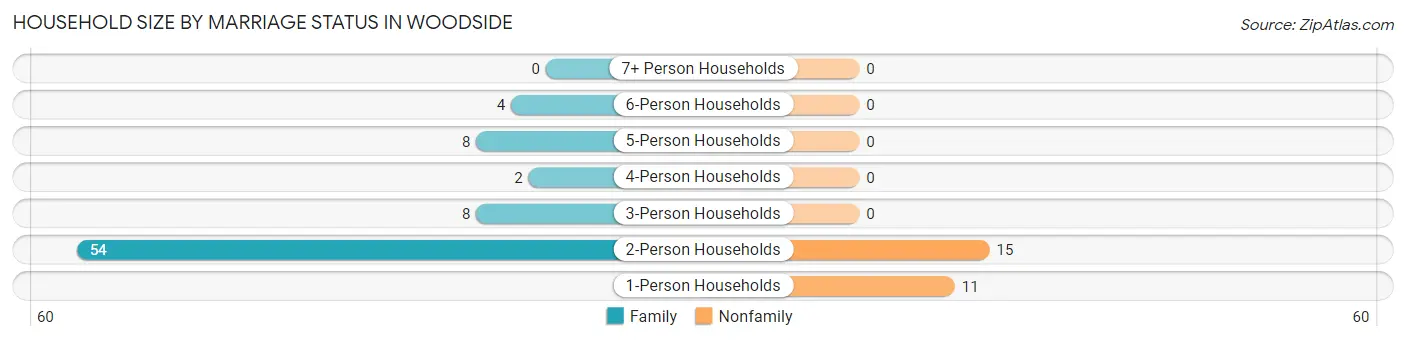
| Household Size | Family Households | Nonfamily Households |
| 1-Person Households | - | 11 (10.8%) |
| 2-Person Households | 54 (52.9%) | 15 (14.7%) |
| 3-Person Households | 8 (7.8%) | 0 (0.0%) |
| 4-Person Households | 2 (2.0%) | 0 (0.0%) |
| 5-Person Households | 8 (7.8%) | 0 (0.0%) |
| 6-Person Households | 4 (3.9%) | 0 (0.0%) |
| 7+ Person Households | 0 (0.0%) | 0 (0.0%) |
| Total | 76 (74.5%) | 26 (25.5%) |
Female Fertility in Woodside
Fertility by Age in Woodside
| Age Bracket | Women with Births | Births / 1,000 Women |
| 15 to 19 years | 0 (0.0%) | 0.0 |
| 20 to 34 years | 0 (0.0%) | 0.0 |
| 35 to 50 years | 0 (0.0%) | 0.0 |
| Total | 0 (0.0%) | 0.0 |
Fertility by Age by Marriage Status in Woodside
| Age Bracket | Married | Unmarried |
| 15 to 19 years | 0 (0.0%) | 0 (0.0%) |
| 20 to 34 years | 0 (0.0%) | 0 (0.0%) |
| 35 to 50 years | 0 (0.0%) | 0 (0.0%) |
| Total | 0 (0.0%) | 0 (0.0%) |
Fertility by Education in Woodside
| Educational Attainment | Women with Births | Births / 1,000 Women |
| Less than High School | 0 (0.0%) | 0.0 |
| High School Diploma | 0 (0.0%) | 0.0 |
| College or Associate's Degree | 0 (0.0%) | 0.0 |
| Bachelor's Degree | 0 (0.0%) | 0.0 |
| Graduate Degree | 0 (0.0%) | 0.0 |
| Total | 0 (0.0%) | 0.0 |
Fertility by Education by Marriage Status in Woodside
| Educational Attainment | Married | Unmarried |
| Less than High School | 0 (0.0%) | 0 (0.0%) |
| High School Diploma | 0 (0.0%) | 0 (0.0%) |
| College or Associate's Degree | 0 (0.0%) | 0 (0.0%) |
| Bachelor's Degree | 0 (0.0%) | 0 (0.0%) |
| Graduate Degree | 0 (0.0%) | 0 (0.0%) |
| Total | 0 (0.0%) | 0 (0.0%) |
Employment Characteristics in Woodside
Employment by Class of Employer in Woodside
Among the 106 employed individuals in Woodside, private company employees (88 | 83.0%), state government employees (9 | 8.5%), and self-employed (not incorporated) (3 | 2.8%) make up the most common classes of employment.
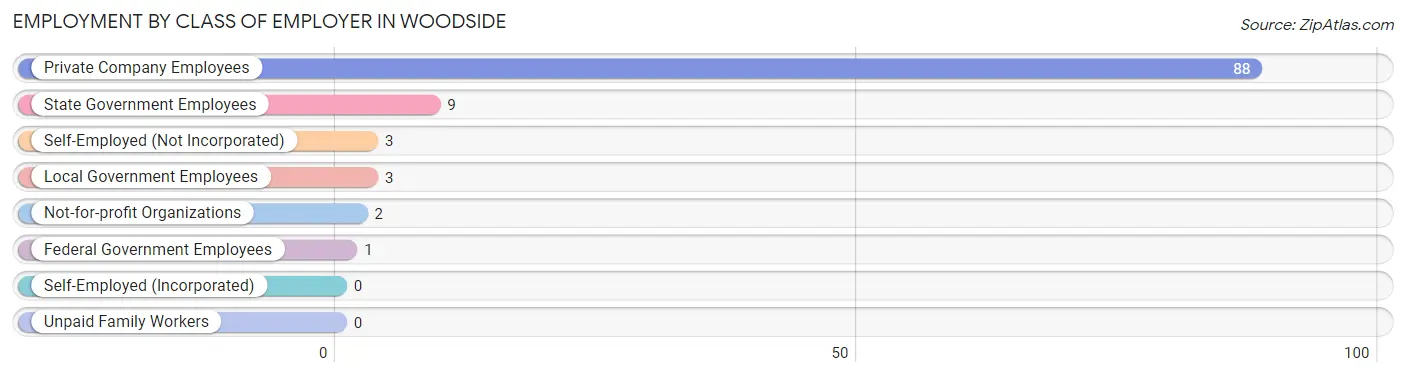
| Employer Class | # Employees | % Employees |
| Private Company Employees | 88 | 83.0% |
| Self-Employed (Incorporated) | 0 | 0.0% |
| Self-Employed (Not Incorporated) | 3 | 2.8% |
| Not-for-profit Organizations | 2 | 1.9% |
| Local Government Employees | 3 | 2.8% |
| State Government Employees | 9 | 8.5% |
| Federal Government Employees | 1 | 0.9% |
| Unpaid Family Workers | 0 | 0.0% |
| Total | 106 | 100.0% |
Employment Status by Age in Woodside
According to the labor force statistics for Woodside, out of the total population over 16 years of age (205), 56.6% or 116 individuals are in the labor force, with 3.4% or 4 of them unemployed. The age group with the highest labor force participation rate is 30 to 34 years, with 100.0% or 13 individuals in the labor force. Within the labor force, the 60 to 64 years age range has the highest percentage of unemployed individuals, with 25.0% or 1 of them being unemployed.
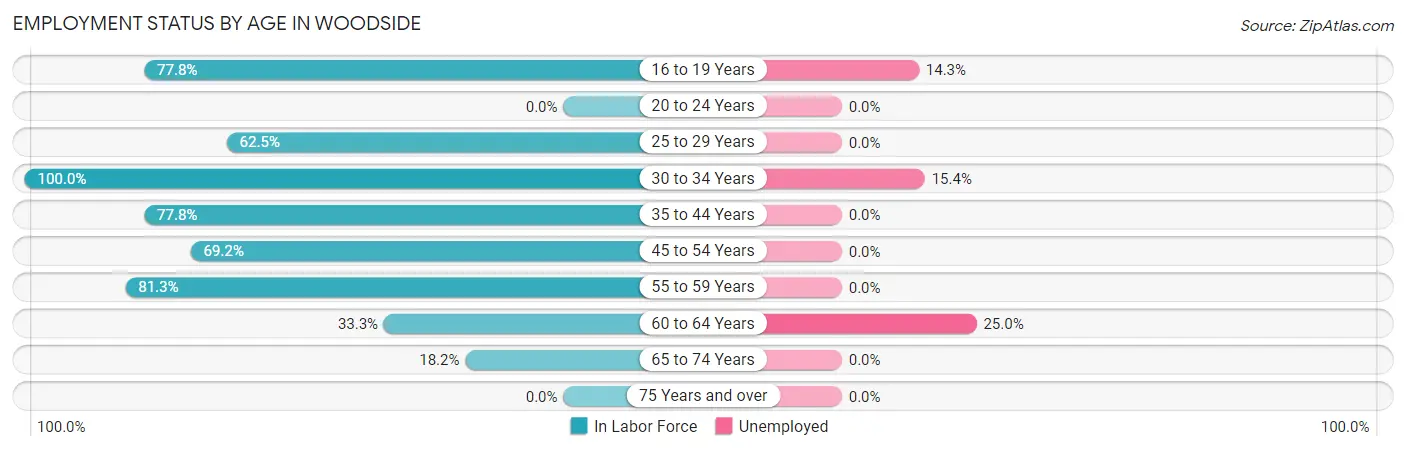
| Age Bracket | In Labor Force | Unemployed |
| 16 to 19 Years | 7 (77.8%) | 1 (14.3%) |
| 20 to 24 Years | 0 (0.0%) | 0 (0.0%) |
| 25 to 29 Years | 10 (62.5%) | 0 (0.0%) |
| 30 to 34 Years | 13 (100.0%) | 2 (15.4%) |
| 35 to 44 Years | 14 (77.8%) | 0 (0.0%) |
| 45 to 54 Years | 27 (69.2%) | 0 (0.0%) |
| 55 to 59 Years | 39 (81.3%) | 0 (0.0%) |
| 60 to 64 Years | 4 (33.3%) | 1 (25.0%) |
| 65 to 74 Years | 2 (18.2%) | 0 (0.0%) |
| 75 Years and over | 0 (0.0%) | 0 (0.0%) |
| Total | 116 (56.6%) | 4 (3.4%) |
Employment Status by Educational Attainment in Woodside
According to labor force statistics for Woodside, 73.3% of individuals (107) out of the total population between 25 and 64 years of age (146) are in the labor force, with 2.8% or 3 of them being unemployed. The group with the highest labor force participation rate are those with the educational attainment of high school diploma, with 87.1% or 54 individuals in the labor force. Within the labor force, individuals with college / associate degree education have the highest percentage of unemployment, with 3.8% or 1 of them being unemployed.
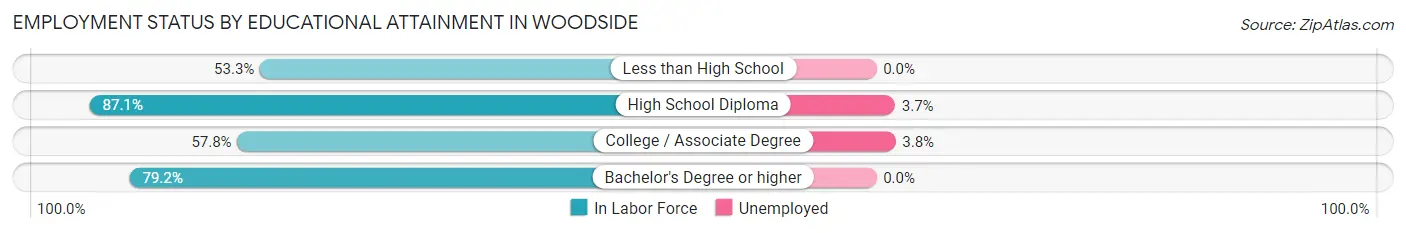
| Educational Attainment | In Labor Force | Unemployed |
| Less than High School | 8 (53.3%) | 0 (0.0%) |
| High School Diploma | 54 (87.1%) | 2 (3.7%) |
| College / Associate Degree | 26 (57.8%) | 2 (3.8%) |
| Bachelor's Degree or higher | 19 (79.2%) | 0 (0.0%) |
| Total | 107 (73.3%) | 4 (2.8%) |
Employment Occupations by Sex in Woodside
Management, Business, Science and Arts Occupations
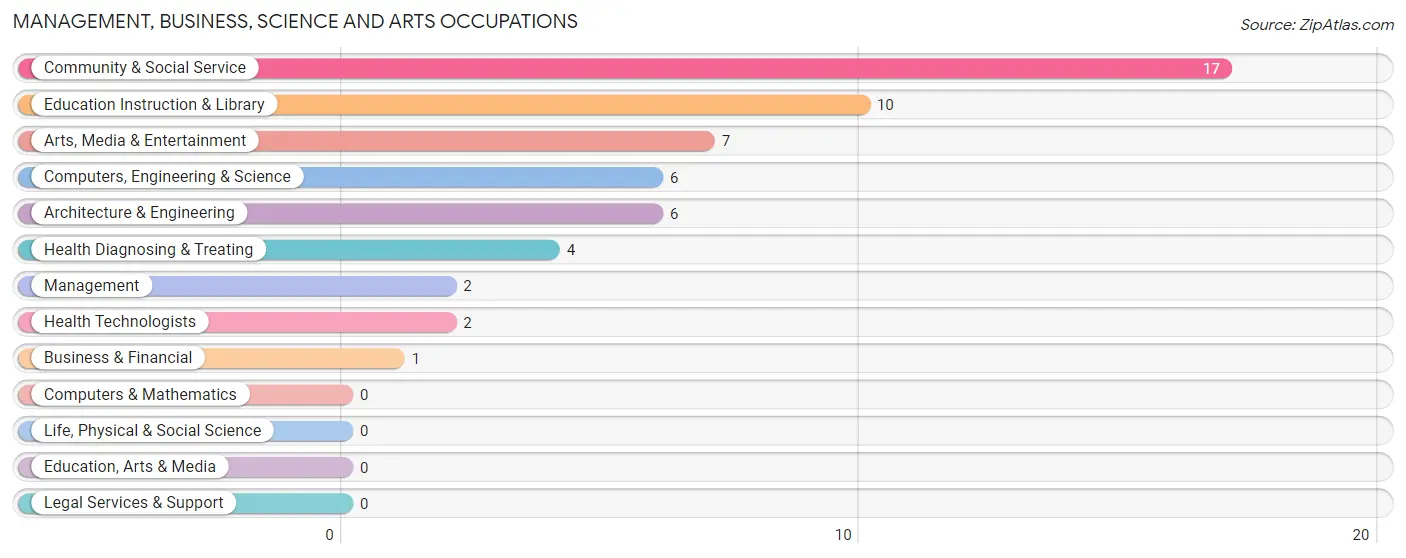
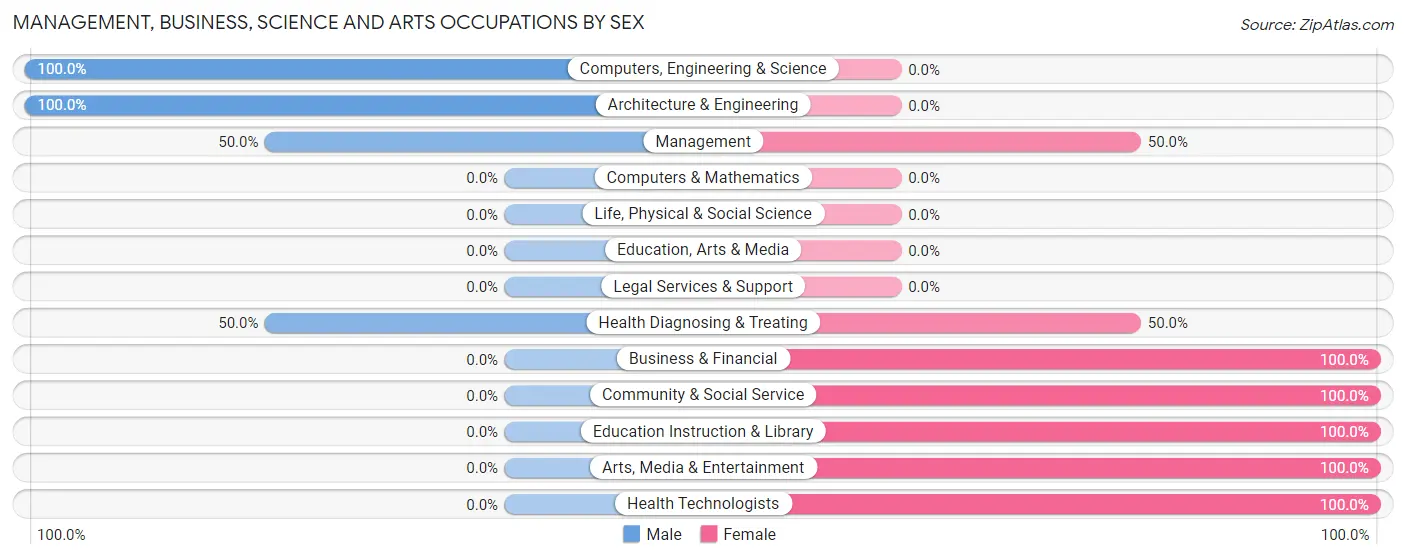
The most common Management, Business, Science and Arts occupations in Woodside are Community & Social Service (17 | 15.2%), Education Instruction & Library (10 | 8.9%), Arts, Media & Entertainment (7 | 6.2%), Computers, Engineering & Science (6 | 5.4%), and Architecture & Engineering (6 | 5.4%).
Management, Business, Science and Arts Occupations by Sex
Within the Management, Business, Science and Arts occupations in Woodside, the most male-oriented occupations are Computers, Engineering & Science (100.0%), Architecture & Engineering (100.0%), and Management (50.0%), while the most female-oriented occupations are Business & Financial (100.0%), Community & Social Service (100.0%), and Education Instruction & Library (100.0%).
| Occupation | Male | Female |
| Management | 1 (50.0%) | 1 (50.0%) |
| Business & Financial | 0 (0.0%) | 1 (100.0%) |
| Computers, Engineering & Science | 6 (100.0%) | 0 (0.0%) |
| Computers & Mathematics | 0 (0.0%) | 0 (0.0%) |
| Architecture & Engineering | 6 (100.0%) | 0 (0.0%) |
| Life, Physical & Social Science | 0 (0.0%) | 0 (0.0%) |
| Community & Social Service | 0 (0.0%) | 17 (100.0%) |
| Education, Arts & Media | 0 (0.0%) | 0 (0.0%) |
| Legal Services & Support | 0 (0.0%) | 0 (0.0%) |
| Education Instruction & Library | 0 (0.0%) | 10 (100.0%) |
| Arts, Media & Entertainment | 0 (0.0%) | 7 (100.0%) |
| Health Diagnosing & Treating | 2 (50.0%) | 2 (50.0%) |
| Health Technologists | 0 (0.0%) | 2 (100.0%) |
| Total (Category) | 9 (30.0%) | 21 (70.0%) |
| Total (Overall) | 70 (62.5%) | 42 (37.5%) |
Services Occupations
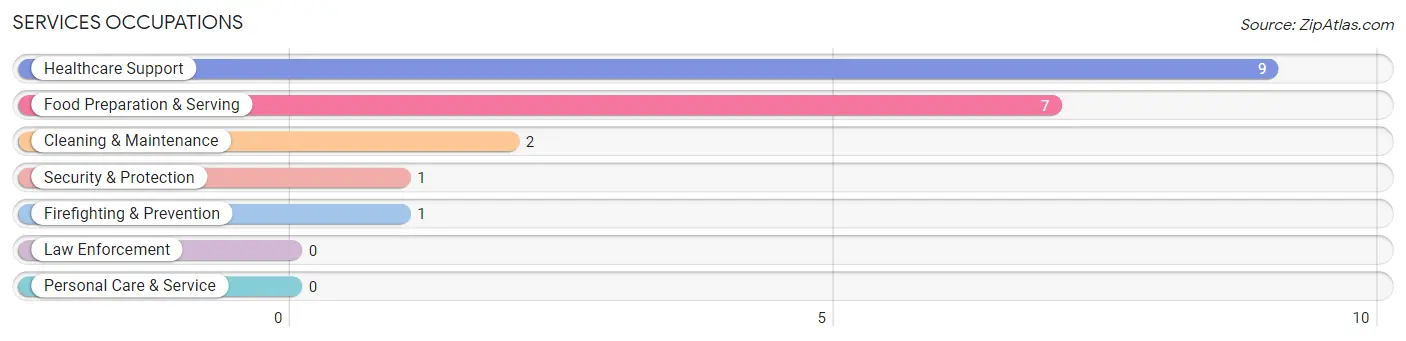
The most common Services occupations in Woodside are Healthcare Support (9 | 8.0%), Food Preparation & Serving (7 | 6.2%), Cleaning & Maintenance (2 | 1.8%), Security & Protection (1 | 0.9%), and Firefighting & Prevention (1 | 0.9%).
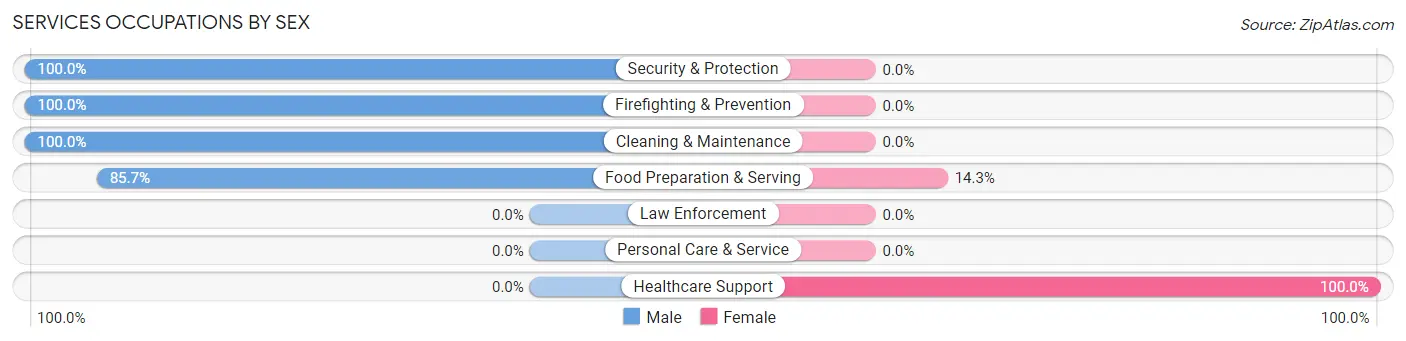
Services Occupations by Sex
Within the Services occupations in Woodside, the most male-oriented occupations are Security & Protection (100.0%), Firefighting & Prevention (100.0%), and Cleaning & Maintenance (100.0%), while the most female-oriented occupations are Healthcare Support (100.0%), and Food Preparation & Serving (14.3%).
| Occupation | Male | Female |
| Healthcare Support | 0 (0.0%) | 9 (100.0%) |
| Security & Protection | 1 (100.0%) | 0 (0.0%) |
| Firefighting & Prevention | 1 (100.0%) | 0 (0.0%) |
| Law Enforcement | 0 (0.0%) | 0 (0.0%) |
| Food Preparation & Serving | 6 (85.7%) | 1 (14.3%) |
| Cleaning & Maintenance | 2 (100.0%) | 0 (0.0%) |
| Personal Care & Service | 0 (0.0%) | 0 (0.0%) |
| Total (Category) | 9 (47.4%) | 10 (52.6%) |
| Total (Overall) | 70 (62.5%) | 42 (37.5%) |
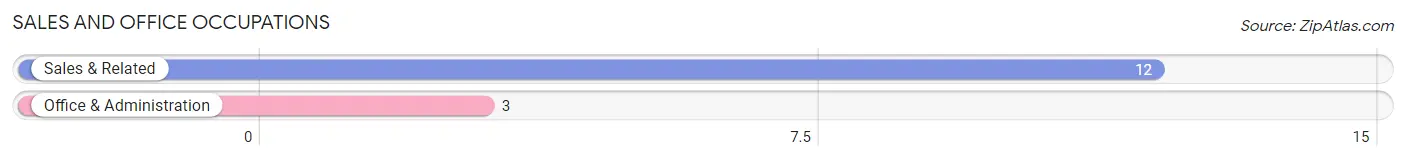
Sales and Office Occupations
The most common Sales and Office occupations in Woodside are Sales & Related (12 | 10.7%), and Office & Administration (3 | 2.7%).
Sales and Office Occupations by Sex

| Occupation | Male | Female |
| Sales & Related | 6 (50.0%) | 6 (50.0%) |
| Office & Administration | 0 (0.0%) | 3 (100.0%) |
| Total (Category) | 6 (40.0%) | 9 (60.0%) |
| Total (Overall) | 70 (62.5%) | 42 (37.5%) |
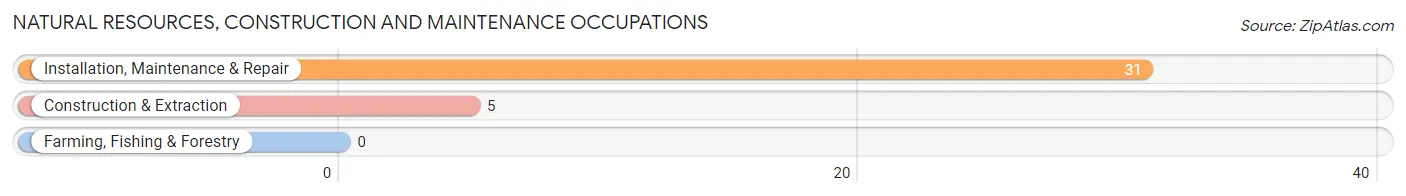
Natural Resources, Construction and Maintenance Occupations
The most common Natural Resources, Construction and Maintenance occupations in Woodside are Installation, Maintenance & Repair (31 | 27.7%), and Construction & Extraction (5 | 4.5%).
Natural Resources, Construction and Maintenance Occupations by Sex
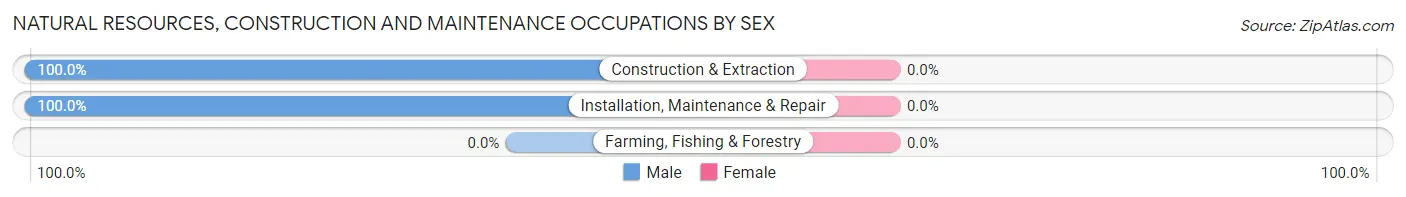
| Occupation | Male | Female |
| Farming, Fishing & Forestry | 0 (0.0%) | 0 (0.0%) |
| Construction & Extraction | 5 (100.0%) | 0 (0.0%) |
| Installation, Maintenance & Repair | 31 (100.0%) | 0 (0.0%) |
| Total (Category) | 36 (100.0%) | 0 (0.0%) |
| Total (Overall) | 70 (62.5%) | 42 (37.5%) |
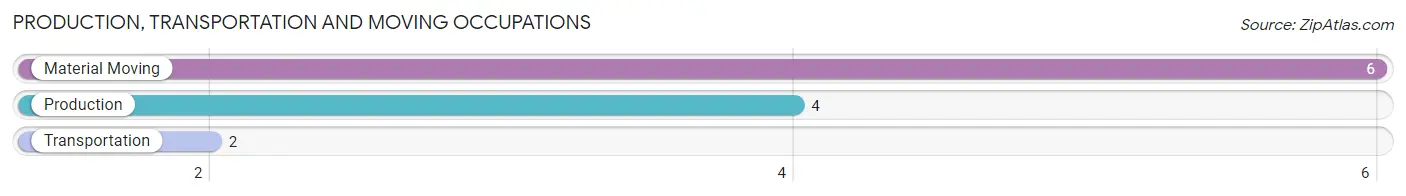
Production, Transportation and Moving Occupations
The most common Production, Transportation and Moving occupations in Woodside are Material Moving (6 | 5.4%), Production (4 | 3.6%), and Transportation (2 | 1.8%).
Production, Transportation and Moving Occupations by Sex
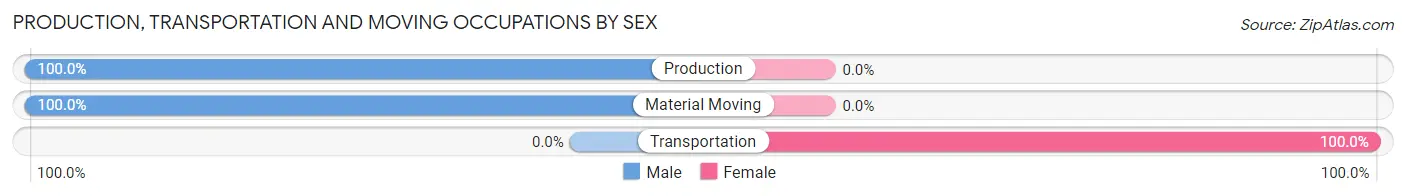
| Occupation | Male | Female |
| Production | 4 (100.0%) | 0 (0.0%) |
| Transportation | 0 (0.0%) | 2 (100.0%) |
| Material Moving | 6 (100.0%) | 0 (0.0%) |
| Total (Category) | 10 (83.3%) | 2 (16.7%) |
| Total (Overall) | 70 (62.5%) | 42 (37.5%) |
Employment Industries by Sex in Woodside
Employment Industries in Woodside
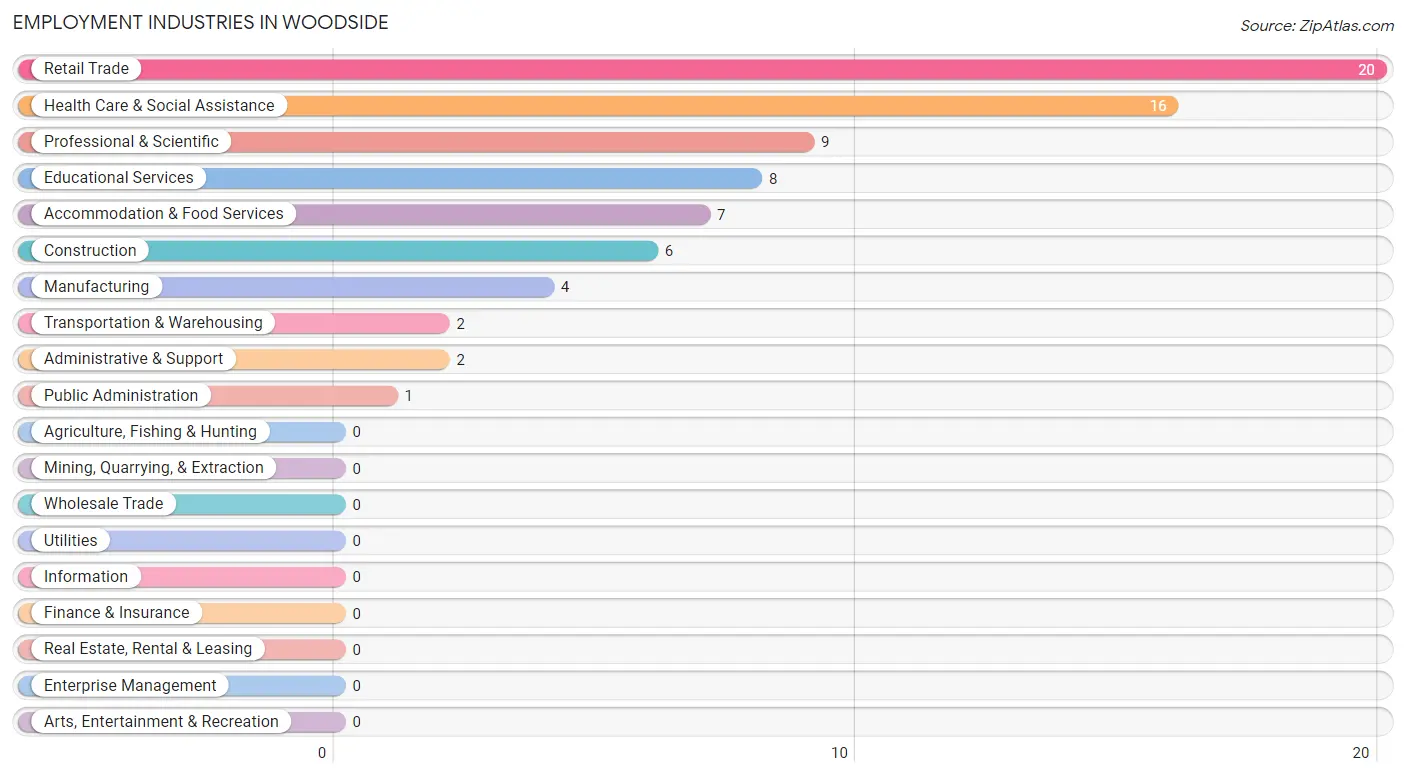
The major employment industries in Woodside include Retail Trade (20 | 17.9%), Health Care & Social Assistance (16 | 14.3%), Professional & Scientific (9 | 8.0%), Educational Services (8 | 7.1%), and Accommodation & Food Services (7 | 6.2%).
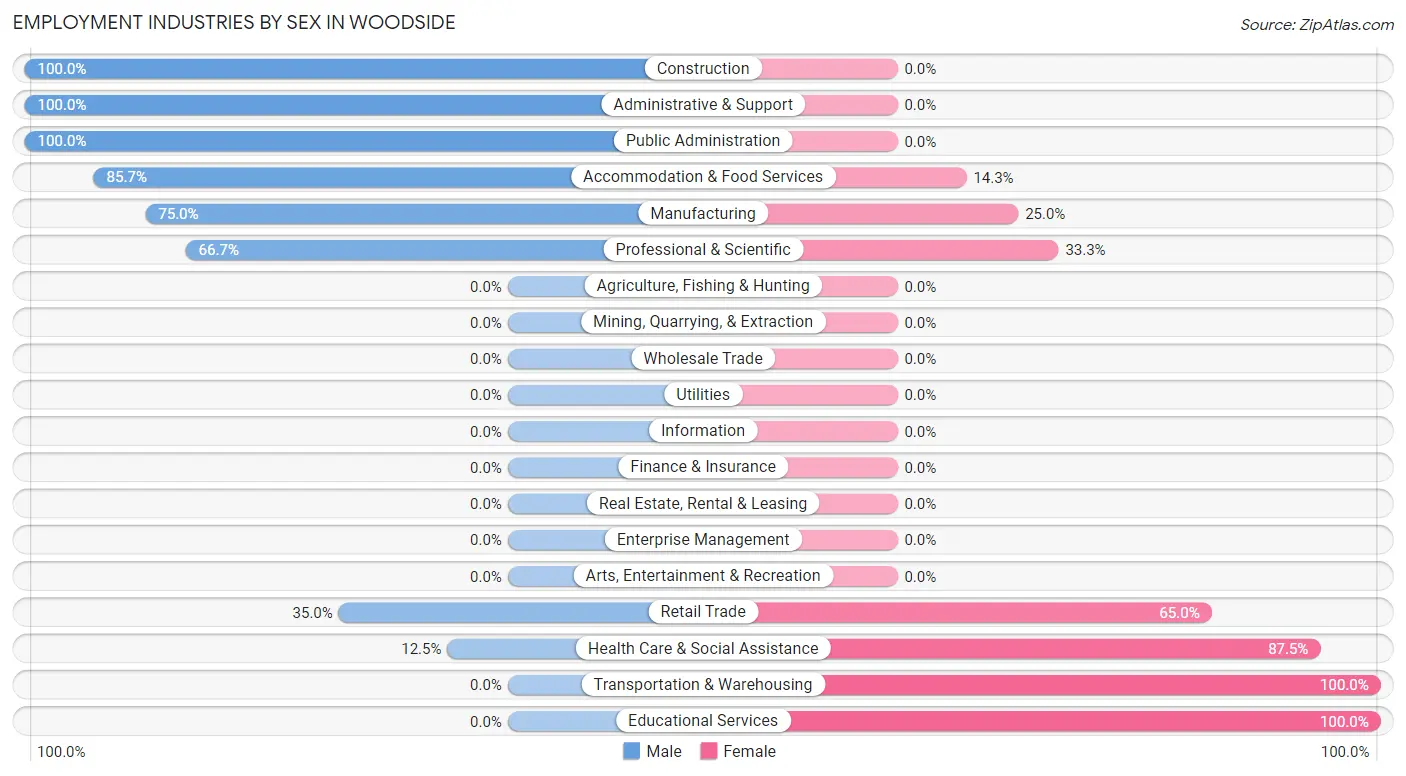
Employment Industries by Sex in Woodside
The Woodside industries that see more men than women are Construction (100.0%), Administrative & Support (100.0%), and Public Administration (100.0%), whereas the industries that tend to have a higher number of women are Transportation & Warehousing (100.0%), Educational Services (100.0%), and Health Care & Social Assistance (87.5%).
| Industry | Male | Female |
| Agriculture, Fishing & Hunting | 0 (0.0%) | 0 (0.0%) |
| Mining, Quarrying, & Extraction | 0 (0.0%) | 0 (0.0%) |
| Construction | 6 (100.0%) | 0 (0.0%) |
| Manufacturing | 3 (75.0%) | 1 (25.0%) |
| Wholesale Trade | 0 (0.0%) | 0 (0.0%) |
| Retail Trade | 7 (35.0%) | 13 (65.0%) |
| Transportation & Warehousing | 0 (0.0%) | 2 (100.0%) |
| Utilities | 0 (0.0%) | 0 (0.0%) |
| Information | 0 (0.0%) | 0 (0.0%) |
| Finance & Insurance | 0 (0.0%) | 0 (0.0%) |
| Real Estate, Rental & Leasing | 0 (0.0%) | 0 (0.0%) |
| Professional & Scientific | 6 (66.7%) | 3 (33.3%) |
| Enterprise Management | 0 (0.0%) | 0 (0.0%) |
| Administrative & Support | 2 (100.0%) | 0 (0.0%) |
| Educational Services | 0 (0.0%) | 8 (100.0%) |
| Health Care & Social Assistance | 2 (12.5%) | 14 (87.5%) |
| Arts, Entertainment & Recreation | 0 (0.0%) | 0 (0.0%) |
| Accommodation & Food Services | 6 (85.7%) | 1 (14.3%) |
| Public Administration | 1 (100.0%) | 0 (0.0%) |
| Total | 70 (62.5%) | 42 (37.5%) |
Education in Woodside
School Enrollment in Woodside
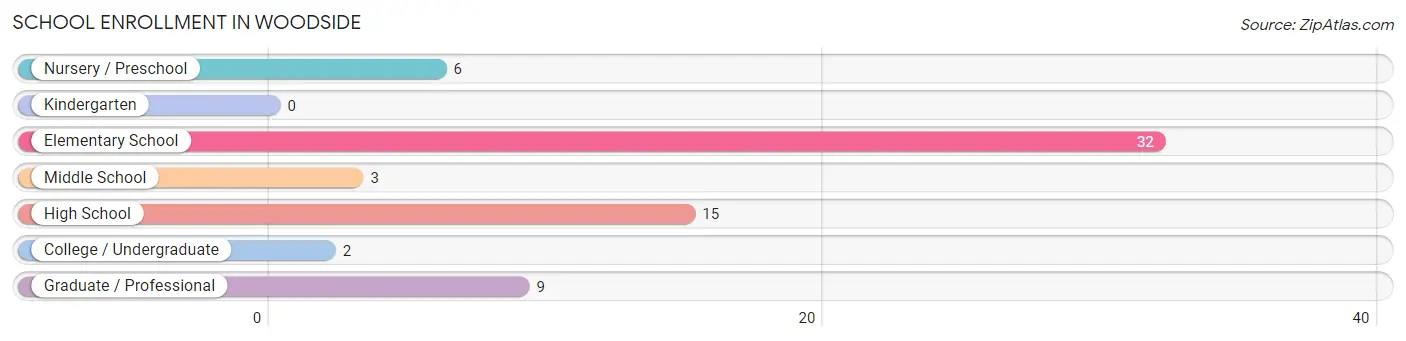
The most common levels of schooling among the 67 students in Woodside are elementary school (32 | 47.8%), high school (15 | 22.4%), and graduate / professional (9 | 13.4%).
| School Level | # Students | % Students |
| Nursery / Preschool | 6 | 9.0% |
| Kindergarten | 0 | 0.0% |
| Elementary School | 32 | 47.8% |
| Middle School | 3 | 4.5% |
| High School | 15 | 22.4% |
| College / Undergraduate | 2 | 3.0% |
| Graduate / Professional | 9 | 13.4% |
| Total | 67 | 100.0% |
School Enrollment by Age by Funding Source in Woodside
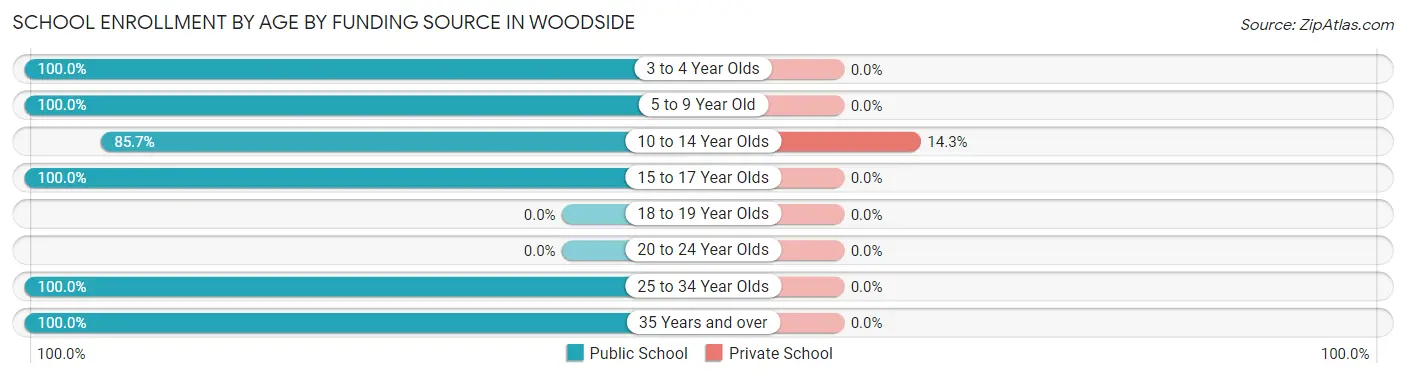
Out of a total of 67 students who are enrolled in schools in Woodside, 1 (1.5%) attend a private institution, while the remaining 66 (98.5%) are enrolled in public schools. The age group of 10 to 14 year olds has the highest likelihood of being enrolled in private schools, with 1 (14.3% in the age bracket) enrolled. Conversely, the age group of 3 to 4 year olds has the lowest likelihood of being enrolled in a private school, with 6 (100.0% in the age bracket) attending a public institution.
| Age Bracket | Public School | Private School |
| 3 to 4 Year Olds | 6 (100.0%) | 0 (0.0%) |
| 5 to 9 Year Old | 28 (100.0%) | 0 (0.0%) |
| 10 to 14 Year Olds | 6 (85.7%) | 1 (14.3%) |
| 15 to 17 Year Olds | 15 (100.0%) | 0 (0.0%) |
| 18 to 19 Year Olds | 0 (0.0%) | 0 (0.0%) |
| 20 to 24 Year Olds | 0 (0.0%) | 0 (0.0%) |
| 25 to 34 Year Olds | 9 (100.0%) | 0 (0.0%) |
| 35 Years and over | 2 (100.0%) | 0 (0.0%) |
| Total | 66 (98.5%) | 1 (1.5%) |
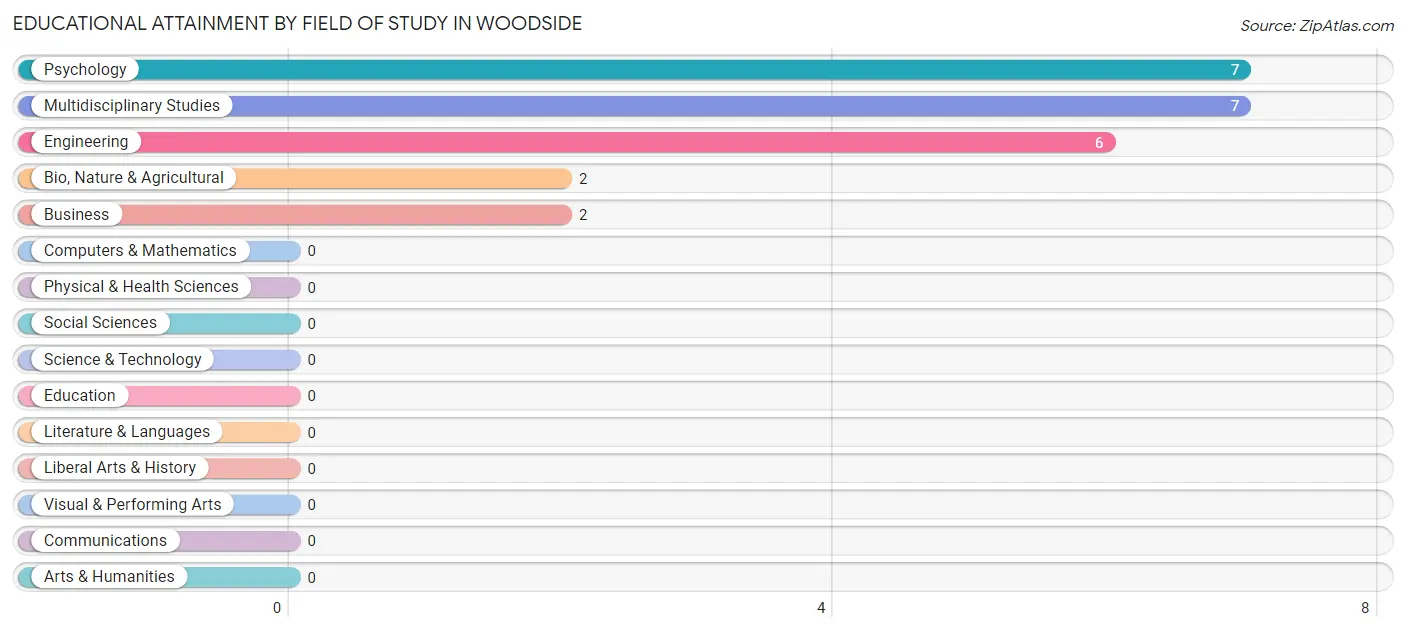
Educational Attainment by Field of Study in Woodside
Psychology (7 | 29.2%), multidisciplinary studies (7 | 29.2%), engineering (6 | 25.0%), bio, nature & agricultural (2 | 8.3%), and business (2 | 8.3%) are the most common fields of study among 24 individuals in Woodside who have obtained a bachelor's degree or higher.
| Field of Study | # Graduates | % Graduates |
| Computers & Mathematics | 0 | 0.0% |
| Bio, Nature & Agricultural | 2 | 8.3% |
| Physical & Health Sciences | 0 | 0.0% |
| Psychology | 7 | 29.2% |
| Social Sciences | 0 | 0.0% |
| Engineering | 6 | 25.0% |
| Multidisciplinary Studies | 7 | 29.2% |
| Science & Technology | 0 | 0.0% |
| Business | 2 | 8.3% |
| Education | 0 | 0.0% |
| Literature & Languages | 0 | 0.0% |
| Liberal Arts & History | 0 | 0.0% |
| Visual & Performing Arts | 0 | 0.0% |
| Communications | 0 | 0.0% |
| Arts & Humanities | 0 | 0.0% |
| Total | 24 | 100.0% |
Transportation & Commute in Woodside
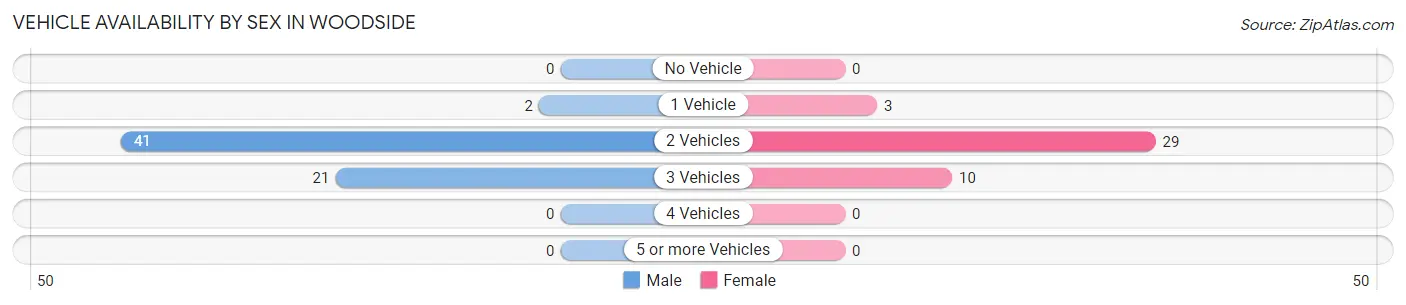
Vehicle Availability by Sex in Woodside
The most prevalent vehicle ownership categories in Woodside are males with 2 vehicles (41, accounting for 64.1%) and females with 2 vehicles (29, making up 97.6%).
| Vehicles Available | Male | Female |
| No Vehicle | 0 (0.0%) | 0 (0.0%) |
| 1 Vehicle | 2 (3.1%) | 3 (7.1%) |
| 2 Vehicles | 41 (64.1%) | 29 (69.1%) |
| 3 Vehicles | 21 (32.8%) | 10 (23.8%) |
| 4 Vehicles | 0 (0.0%) | 0 (0.0%) |
| 5 or more Vehicles | 0 (0.0%) | 0 (0.0%) |
| Total | 64 (100.0%) | 42 (100.0%) |
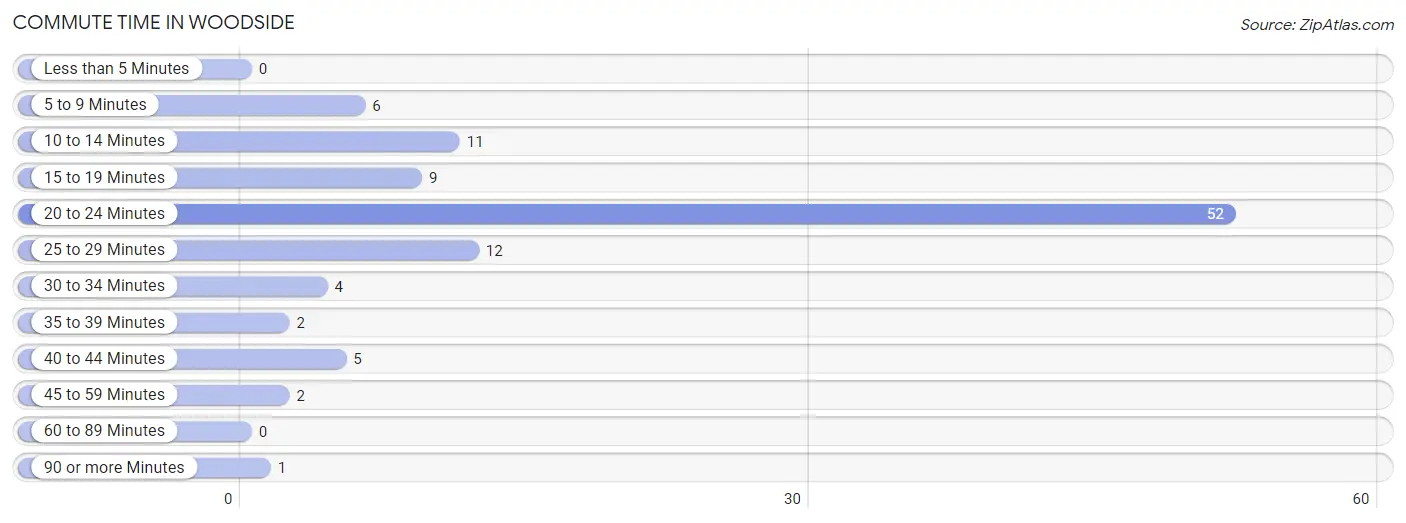
Commute Time in Woodside
The most frequently occuring commute durations in Woodside are 20 to 24 minutes (52 commuters, 50.0%), 25 to 29 minutes (12 commuters, 11.5%), and 10 to 14 minutes (11 commuters, 10.6%).
| Commute Time | # Commuters | % Commuters |
| Less than 5 Minutes | 0 | 0.0% |
| 5 to 9 Minutes | 6 | 5.8% |
| 10 to 14 Minutes | 11 | 10.6% |
| 15 to 19 Minutes | 9 | 8.6% |
| 20 to 24 Minutes | 52 | 50.0% |
| 25 to 29 Minutes | 12 | 11.5% |
| 30 to 34 Minutes | 4 | 3.8% |
| 35 to 39 Minutes | 2 | 1.9% |
| 40 to 44 Minutes | 5 | 4.8% |
| 45 to 59 Minutes | 2 | 1.9% |
| 60 to 89 Minutes | 0 | 0.0% |
| 90 or more Minutes | 1 | 1.0% |
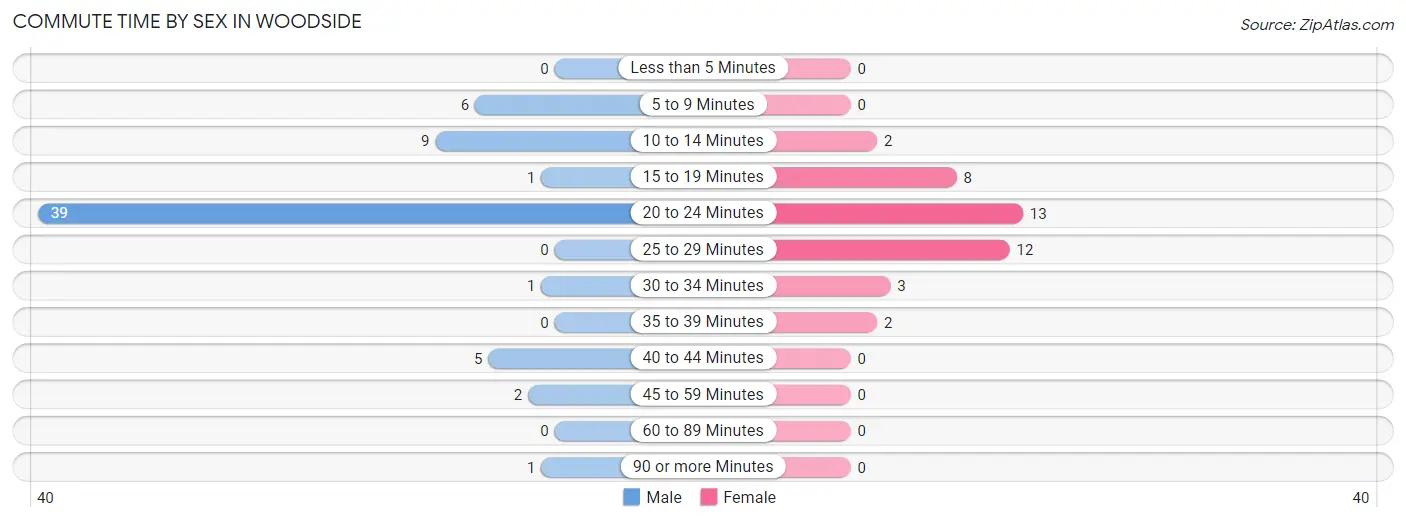
Commute Time by Sex in Woodside
The most common commute times in Woodside are 20 to 24 minutes (39 commuters, 60.9%) for males and 20 to 24 minutes (13 commuters, 32.5%) for females.
| Commute Time | Male | Female |
| Less than 5 Minutes | 0 (0.0%) | 0 (0.0%) |
| 5 to 9 Minutes | 6 (9.4%) | 0 (0.0%) |
| 10 to 14 Minutes | 9 (14.1%) | 2 (5.0%) |
| 15 to 19 Minutes | 1 (1.6%) | 8 (20.0%) |
| 20 to 24 Minutes | 39 (60.9%) | 13 (32.5%) |
| 25 to 29 Minutes | 0 (0.0%) | 12 (30.0%) |
| 30 to 34 Minutes | 1 (1.6%) | 3 (7.5%) |
| 35 to 39 Minutes | 0 (0.0%) | 2 (5.0%) |
| 40 to 44 Minutes | 5 (7.8%) | 0 (0.0%) |
| 45 to 59 Minutes | 2 (3.1%) | 0 (0.0%) |
| 60 to 89 Minutes | 0 (0.0%) | 0 (0.0%) |
| 90 or more Minutes | 1 (1.6%) | 0 (0.0%) |
Time of Departure to Work by Sex in Woodside
The most frequent times of departure to work in Woodside are 8:30 AM to 8:59 AM (26, 40.6%) for males and 10:00 AM to 10:59 AM (7, 17.5%) for females.
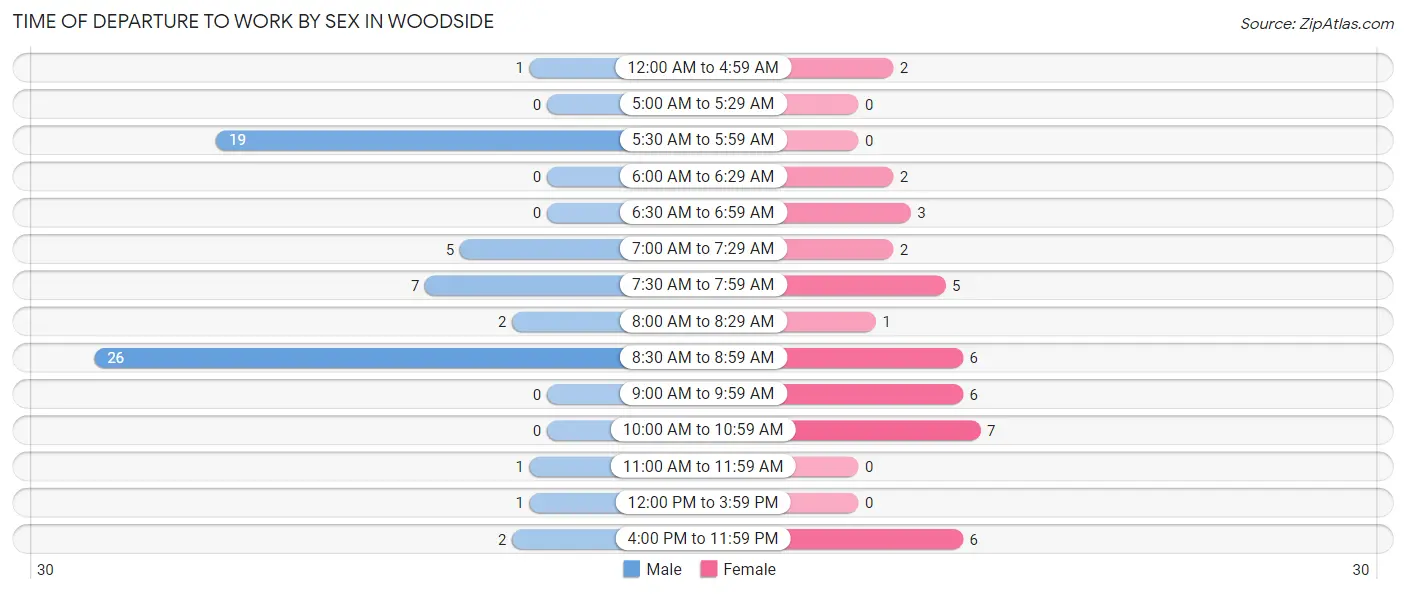
| Time of Departure | Male | Female |
| 12:00 AM to 4:59 AM | 1 (1.6%) | 2 (5.0%) |
| 5:00 AM to 5:29 AM | 0 (0.0%) | 0 (0.0%) |
| 5:30 AM to 5:59 AM | 19 (29.7%) | 0 (0.0%) |
| 6:00 AM to 6:29 AM | 0 (0.0%) | 2 (5.0%) |
| 6:30 AM to 6:59 AM | 0 (0.0%) | 3 (7.5%) |
| 7:00 AM to 7:29 AM | 5 (7.8%) | 2 (5.0%) |
| 7:30 AM to 7:59 AM | 7 (10.9%) | 5 (12.5%) |
| 8:00 AM to 8:29 AM | 2 (3.1%) | 1 (2.5%) |
| 8:30 AM to 8:59 AM | 26 (40.6%) | 6 (15.0%) |
| 9:00 AM to 9:59 AM | 0 (0.0%) | 6 (15.0%) |
| 10:00 AM to 10:59 AM | 0 (0.0%) | 7 (17.5%) |
| 11:00 AM to 11:59 AM | 1 (1.6%) | 0 (0.0%) |
| 12:00 PM to 3:59 PM | 1 (1.6%) | 0 (0.0%) |
| 4:00 PM to 11:59 PM | 2 (3.1%) | 6 (15.0%) |
| Total | 64 (100.0%) | 40 (100.0%) |
Housing Occupancy in Woodside
Occupancy by Ownership in Woodside
Of the total 102 dwellings in Woodside, owner-occupied units account for 73 (71.6%), while renter-occupied units make up 29 (28.4%).
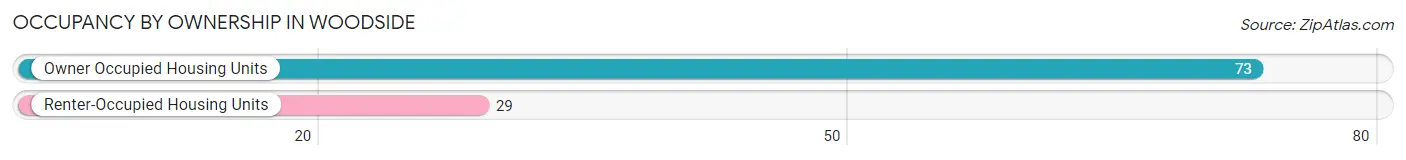
| Occupancy | # Housing Units | % Housing Units |
| Owner Occupied Housing Units | 73 | 71.6% |
| Renter-Occupied Housing Units | 29 | 28.4% |
| Total Occupied Housing Units | 102 | 100.0% |
Occupancy by Household Size in Woodside
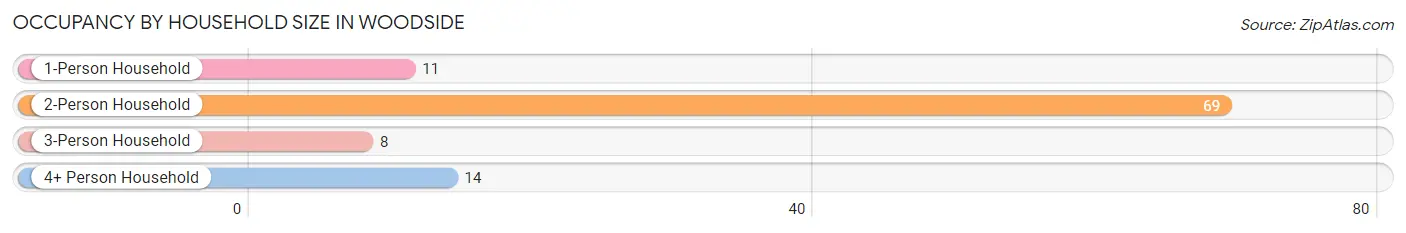
| Household Size | # Housing Units | % Housing Units |
| 1-Person Household | 11 | 10.8% |
| 2-Person Household | 69 | 67.6% |
| 3-Person Household | 8 | 7.8% |
| 4+ Person Household | 14 | 13.7% |
| Total Housing Units | 102 | 100.0% |
Occupancy by Ownership by Household Size in Woodside
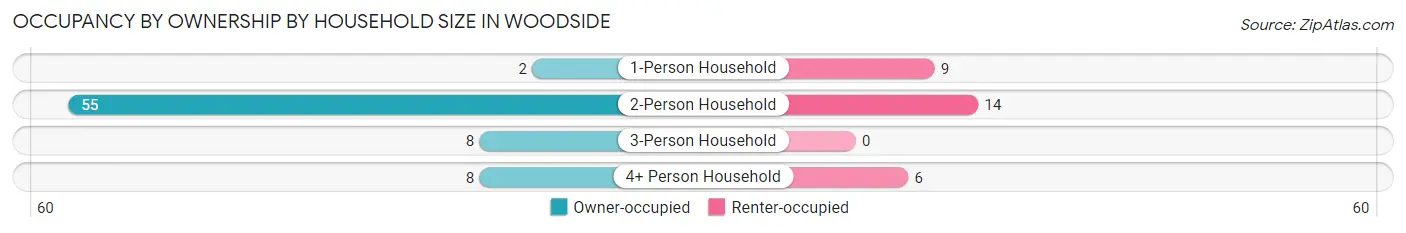
| Household Size | Owner-occupied | Renter-occupied |
| 1-Person Household | 2 (18.2%) | 9 (81.8%) |
| 2-Person Household | 55 (79.7%) | 14 (20.3%) |
| 3-Person Household | 8 (100.0%) | 0 (0.0%) |
| 4+ Person Household | 8 (57.1%) | 6 (42.9%) |
| Total Housing Units | 73 (71.6%) | 29 (28.4%) |
Occupancy by Educational Attainment in Woodside
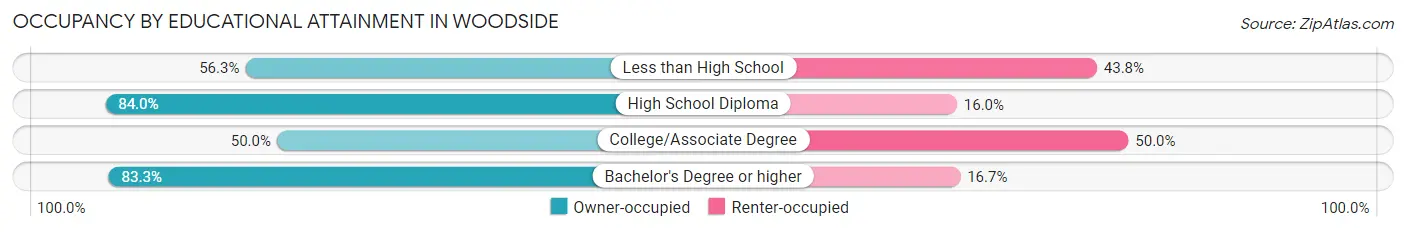
| Household Size | Owner-occupied | Renter-occupied |
| Less than High School | 9 (56.2%) | 7 (43.8%) |
| High School Diploma | 42 (84.0%) | 8 (16.0%) |
| College/Associate Degree | 12 (50.0%) | 12 (50.0%) |
| Bachelor's Degree or higher | 10 (83.3%) | 2 (16.7%) |
Occupancy by Age of Householder in Woodside
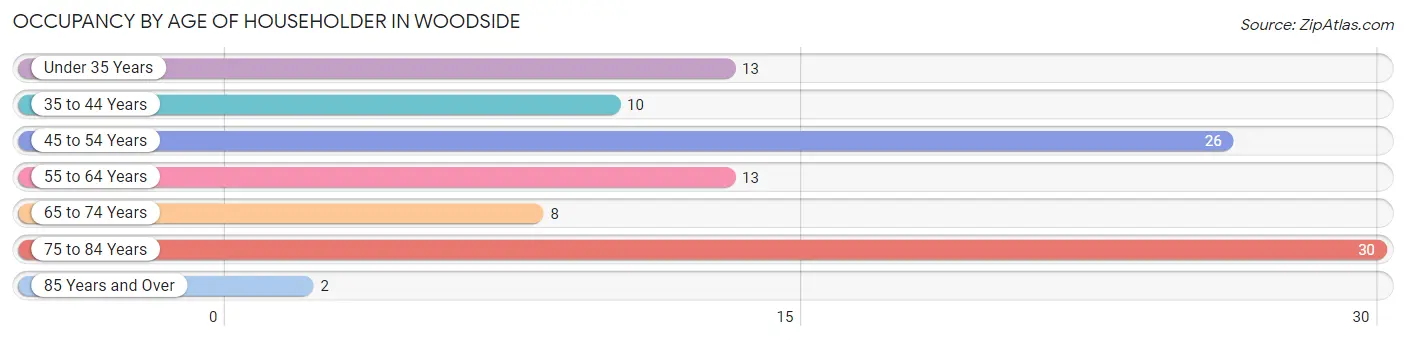
| Age Bracket | # Households | % Households |
| Under 35 Years | 13 | 12.8% |
| 35 to 44 Years | 10 | 9.8% |
| 45 to 54 Years | 26 | 25.5% |
| 55 to 64 Years | 13 | 12.8% |
| 65 to 74 Years | 8 | 7.8% |
| 75 to 84 Years | 30 | 29.4% |
| 85 Years and Over | 2 | 2.0% |
| Total | 102 | 100.0% |
Housing Finances in Woodside
Median Income by Occupancy in Woodside
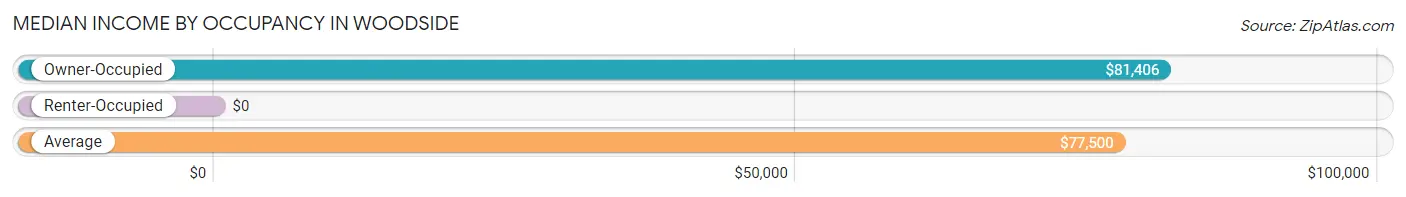
| Occupancy Type | # Households | Median Income |
| Owner-Occupied | 73 (71.6%) | $81,406 |
| Renter-Occupied | 29 (28.4%) | $0 |
| Average | 102 (100.0%) | $77,500 |
Occupancy by Householder Income Bracket in Woodside
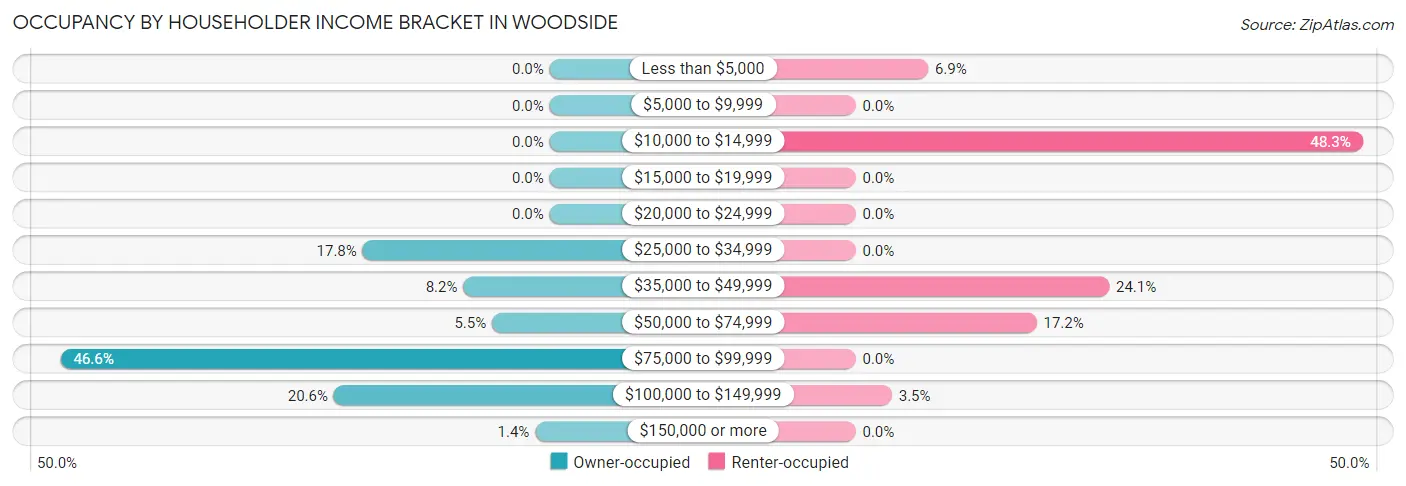
| Income Bracket | Owner-occupied | Renter-occupied |
| Less than $5,000 | 0 (0.0%) | 2 (6.9%) |
| $5,000 to $9,999 | 0 (0.0%) | 0 (0.0%) |
| $10,000 to $14,999 | 0 (0.0%) | 14 (48.3%) |
| $15,000 to $19,999 | 0 (0.0%) | 0 (0.0%) |
| $20,000 to $24,999 | 0 (0.0%) | 0 (0.0%) |
| $25,000 to $34,999 | 13 (17.8%) | 0 (0.0%) |
| $35,000 to $49,999 | 6 (8.2%) | 7 (24.1%) |
| $50,000 to $74,999 | 4 (5.5%) | 5 (17.2%) |
| $75,000 to $99,999 | 34 (46.6%) | 0 (0.0%) |
| $100,000 to $149,999 | 15 (20.5%) | 1 (3.5%) |
| $150,000 or more | 1 (1.4%) | 0 (0.0%) |
| Total | 73 (100.0%) | 29 (100.0%) |
Monthly Housing Cost Tiers in Woodside
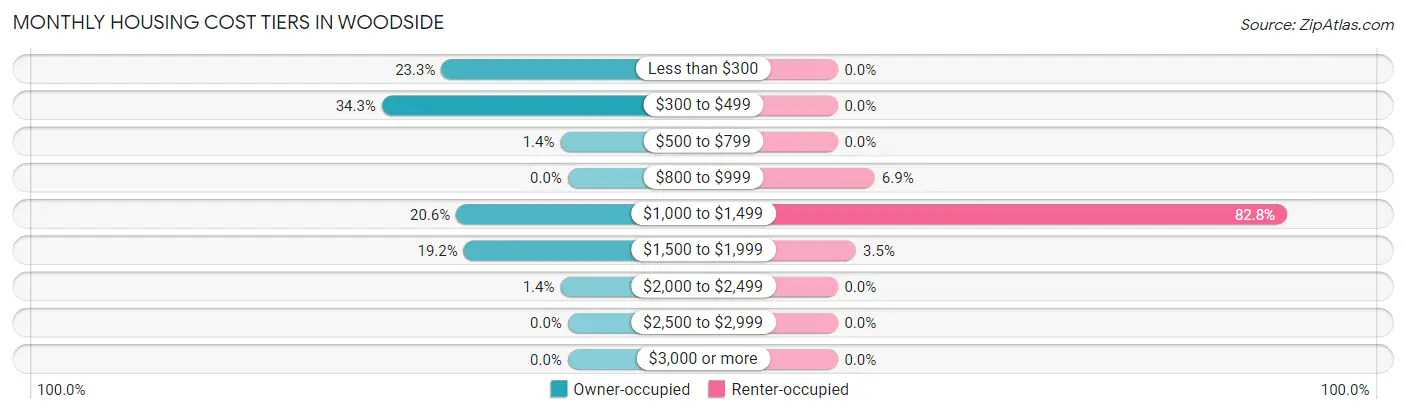
| Monthly Cost | Owner-occupied | Renter-occupied |
| Less than $300 | 17 (23.3%) | 0 (0.0%) |
| $300 to $499 | 25 (34.3%) | 0 (0.0%) |
| $500 to $799 | 1 (1.4%) | 0 (0.0%) |
| $800 to $999 | 0 (0.0%) | 2 (6.9%) |
| $1,000 to $1,499 | 15 (20.5%) | 24 (82.8%) |
| $1,500 to $1,999 | 14 (19.2%) | 1 (3.5%) |
| $2,000 to $2,499 | 1 (1.4%) | 0 (0.0%) |
| $2,500 to $2,999 | 0 (0.0%) | 0 (0.0%) |
| $3,000 or more | 0 (0.0%) | 0 (0.0%) |
| Total | 73 (100.0%) | 29 (100.0%) |
Physical Housing Characteristics in Woodside
Housing Structures in Woodside
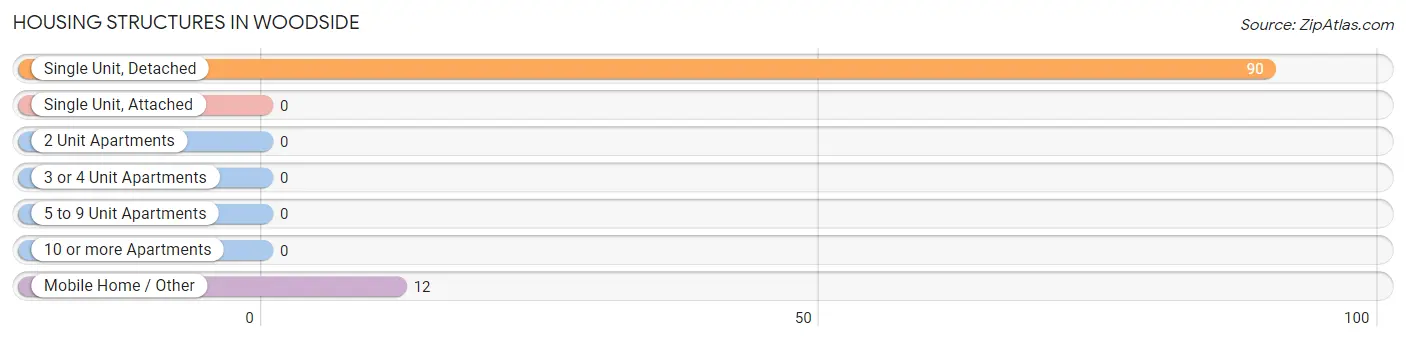
| Structure Type | # Housing Units | % Housing Units |
| Single Unit, Detached | 90 | 88.2% |
| Single Unit, Attached | 0 | 0.0% |
| 2 Unit Apartments | 0 | 0.0% |
| 3 or 4 Unit Apartments | 0 | 0.0% |
| 5 to 9 Unit Apartments | 0 | 0.0% |
| 10 or more Apartments | 0 | 0.0% |
| Mobile Home / Other | 12 | 11.8% |
| Total | 102 | 100.0% |
Housing Structures by Occupancy in Woodside
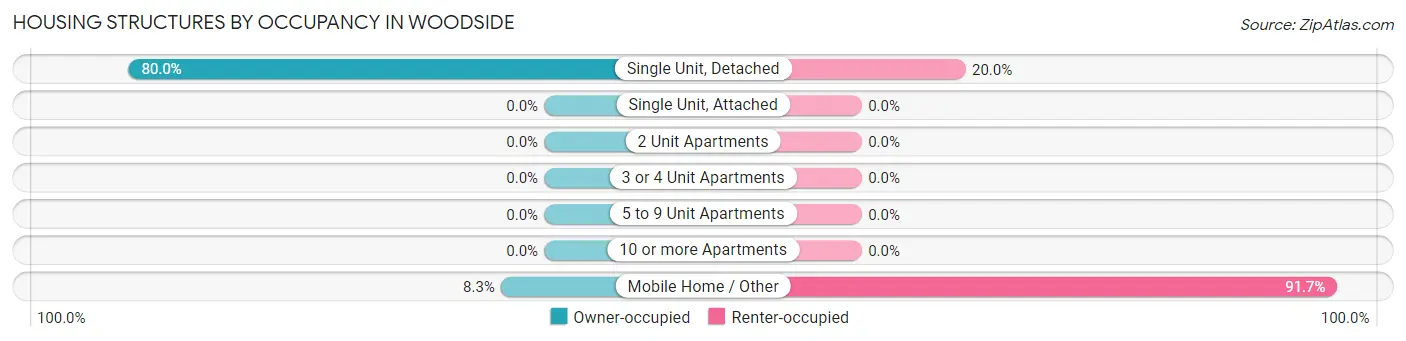
| Structure Type | Owner-occupied | Renter-occupied |
| Single Unit, Detached | 72 (80.0%) | 18 (20.0%) |
| Single Unit, Attached | 0 (0.0%) | 0 (0.0%) |
| 2 Unit Apartments | 0 (0.0%) | 0 (0.0%) |
| 3 or 4 Unit Apartments | 0 (0.0%) | 0 (0.0%) |
| 5 to 9 Unit Apartments | 0 (0.0%) | 0 (0.0%) |
| 10 or more Apartments | 0 (0.0%) | 0 (0.0%) |
| Mobile Home / Other | 1 (8.3%) | 11 (91.7%) |
| Total | 73 (71.6%) | 29 (28.4%) |
Housing Structures by Number of Rooms in Woodside
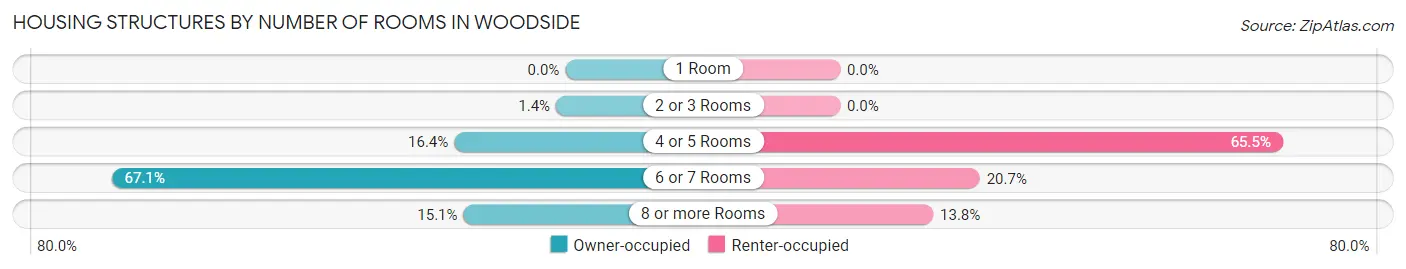
| Number of Rooms | Owner-occupied | Renter-occupied |
| 1 Room | 0 (0.0%) | 0 (0.0%) |
| 2 or 3 Rooms | 1 (1.4%) | 0 (0.0%) |
| 4 or 5 Rooms | 12 (16.4%) | 19 (65.5%) |
| 6 or 7 Rooms | 49 (67.1%) | 6 (20.7%) |
| 8 or more Rooms | 11 (15.1%) | 4 (13.8%) |
| Total | 73 (100.0%) | 29 (100.0%) |
Housing Structure by Heating Type in Woodside
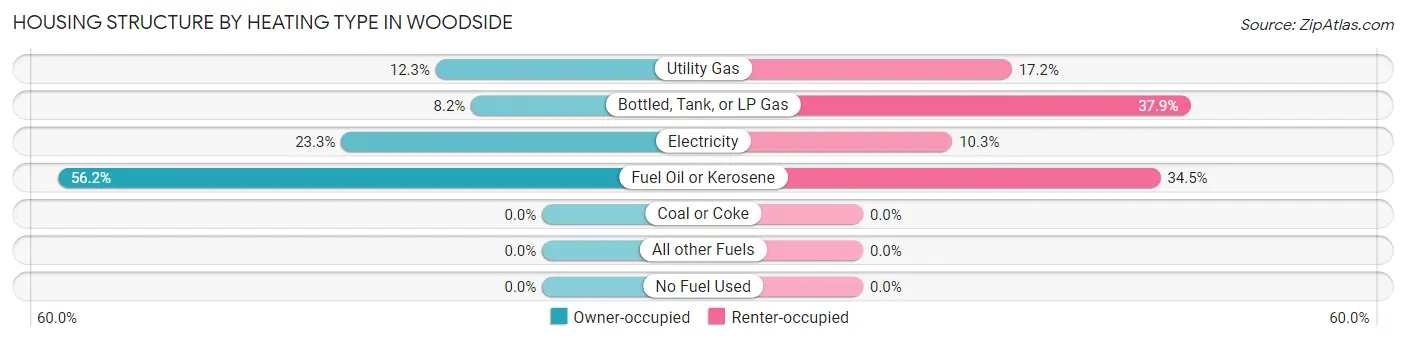
| Heating Type | Owner-occupied | Renter-occupied |
| Utility Gas | 9 (12.3%) | 5 (17.2%) |
| Bottled, Tank, or LP Gas | 6 (8.2%) | 11 (37.9%) |
| Electricity | 17 (23.3%) | 3 (10.3%) |
| Fuel Oil or Kerosene | 41 (56.2%) | 10 (34.5%) |
| Coal or Coke | 0 (0.0%) | 0 (0.0%) |
| All other Fuels | 0 (0.0%) | 0 (0.0%) |
| No Fuel Used | 0 (0.0%) | 0 (0.0%) |
| Total | 73 (100.0%) | 29 (100.0%) |
Household Vehicle Usage in Woodside
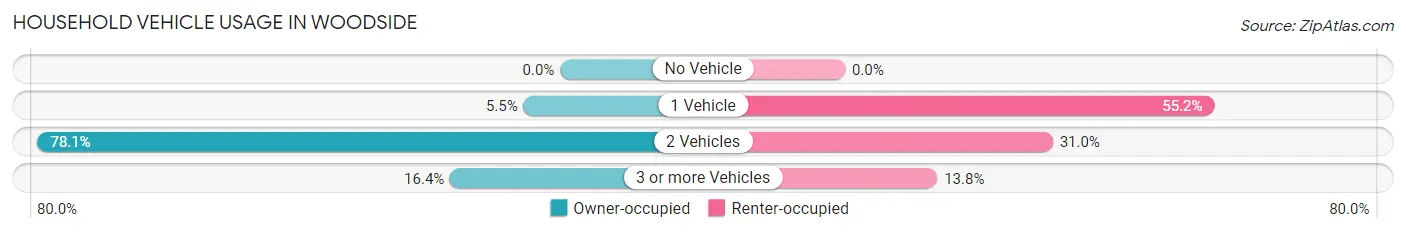
| Vehicles per Household | Owner-occupied | Renter-occupied |
| No Vehicle | 0 (0.0%) | 0 (0.0%) |
| 1 Vehicle | 4 (5.5%) | 16 (55.2%) |
| 2 Vehicles | 57 (78.1%) | 9 (31.0%) |
| 3 or more Vehicles | 12 (16.4%) | 4 (13.8%) |
| Total | 73 (100.0%) | 29 (100.0%) |
Real Estate & Mortgages in Woodside
Real Estate and Mortgage Overview in Woodside
| Characteristic | Without Mortgage | With Mortgage |
| Housing Units | 42 | 31 |
| Median Property Value | $256,300 | $245,000 |
| Median Household Income | $80,521 | $1 |
| Monthly Housing Costs | $308 | $0 |
| Real Estate Taxes | $484 | $0 |
Property Value by Mortgage Status in Woodside
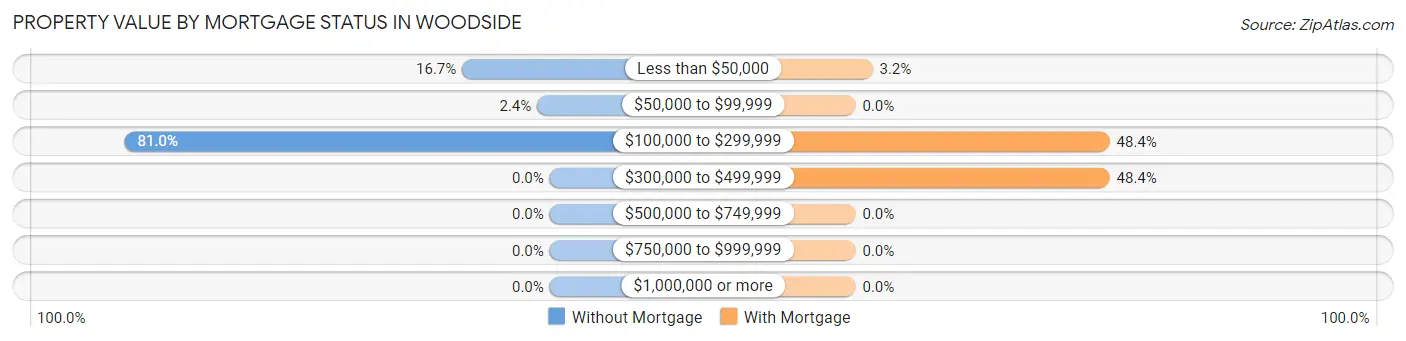
| Property Value | Without Mortgage | With Mortgage |
| Less than $50,000 | 7 (16.7%) | 1 (3.2%) |
| $50,000 to $99,999 | 1 (2.4%) | 0 (0.0%) |
| $100,000 to $299,999 | 34 (80.9%) | 15 (48.4%) |
| $300,000 to $499,999 | 0 (0.0%) | 15 (48.4%) |
| $500,000 to $749,999 | 0 (0.0%) | 0 (0.0%) |
| $750,000 to $999,999 | 0 (0.0%) | 0 (0.0%) |
| $1,000,000 or more | 0 (0.0%) | 0 (0.0%) |
| Total | 42 (100.0%) | 31 (100.0%) |
Household Income by Mortgage Status in Woodside
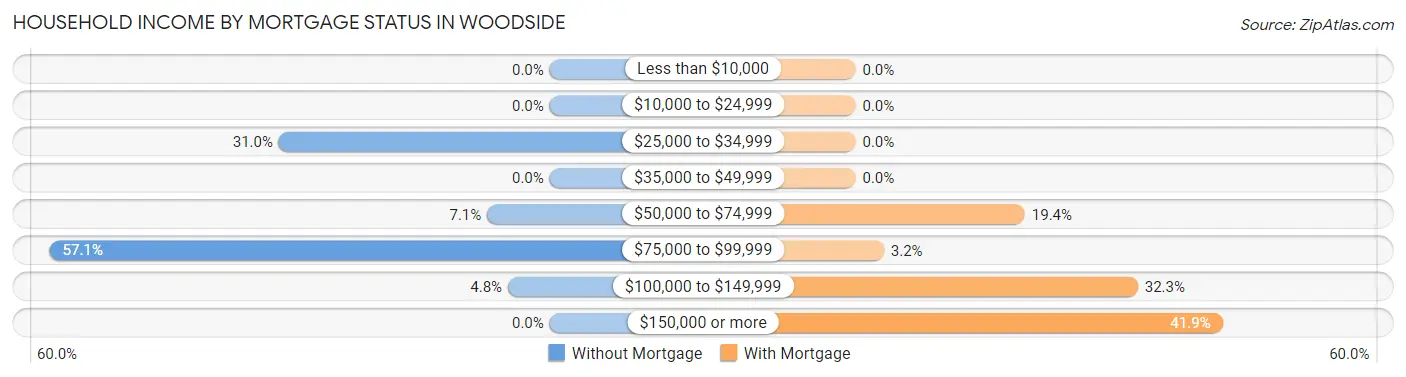
| Household Income | Without Mortgage | With Mortgage |
| Less than $10,000 | 0 (0.0%) | 0 (0.0%) |
| $10,000 to $24,999 | 0 (0.0%) | 0 (0.0%) |
| $25,000 to $34,999 | 13 (30.9%) | 0 (0.0%) |
| $35,000 to $49,999 | 0 (0.0%) | 0 (0.0%) |
| $50,000 to $74,999 | 3 (7.1%) | 6 (19.4%) |
| $75,000 to $99,999 | 24 (57.1%) | 1 (3.2%) |
| $100,000 to $149,999 | 2 (4.8%) | 10 (32.3%) |
| $150,000 or more | 0 (0.0%) | 13 (41.9%) |
| Total | 42 (100.0%) | 31 (100.0%) |
Property Value to Household Income Ratio in Woodside
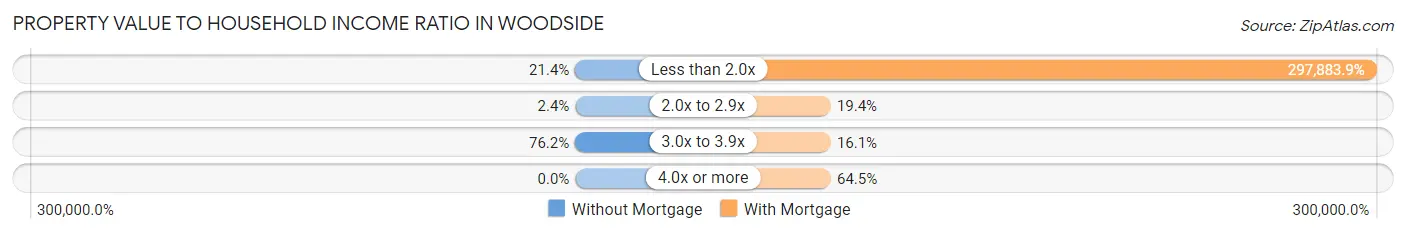
| Value-to-Income Ratio | Without Mortgage | With Mortgage |
| Less than 2.0x | 9 (21.4%) | 92,344 (297,883.9%) |
| 2.0x to 2.9x | 1 (2.4%) | 6 (19.4%) |
| 3.0x to 3.9x | 32 (76.2%) | 5 (16.1%) |
| 4.0x or more | 0 (0.0%) | 20 (64.5%) |
| Total | 42 (100.0%) | 31 (100.0%) |
Real Estate Taxes by Mortgage Status in Woodside
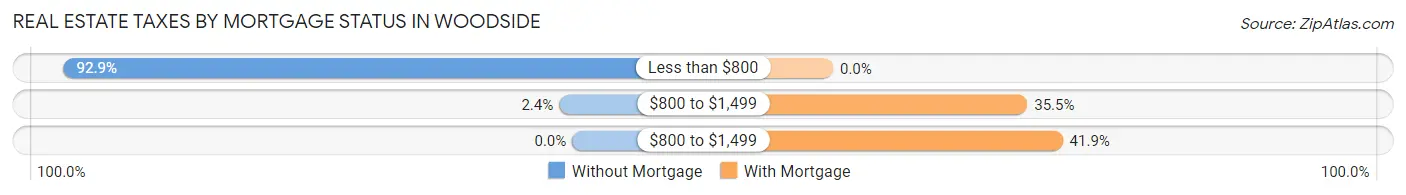
| Property Taxes | Without Mortgage | With Mortgage |
| Less than $800 | 39 (92.9%) | 0 (0.0%) |
| $800 to $1,499 | 1 (2.4%) | 11 (35.5%) |
| $800 to $1,499 | 0 (0.0%) | 13 (41.9%) |
| Total | 42 (100.0%) | 31 (100.0%) |
Health & Disability in Woodside
Health Insurance Coverage by Age in Woodside
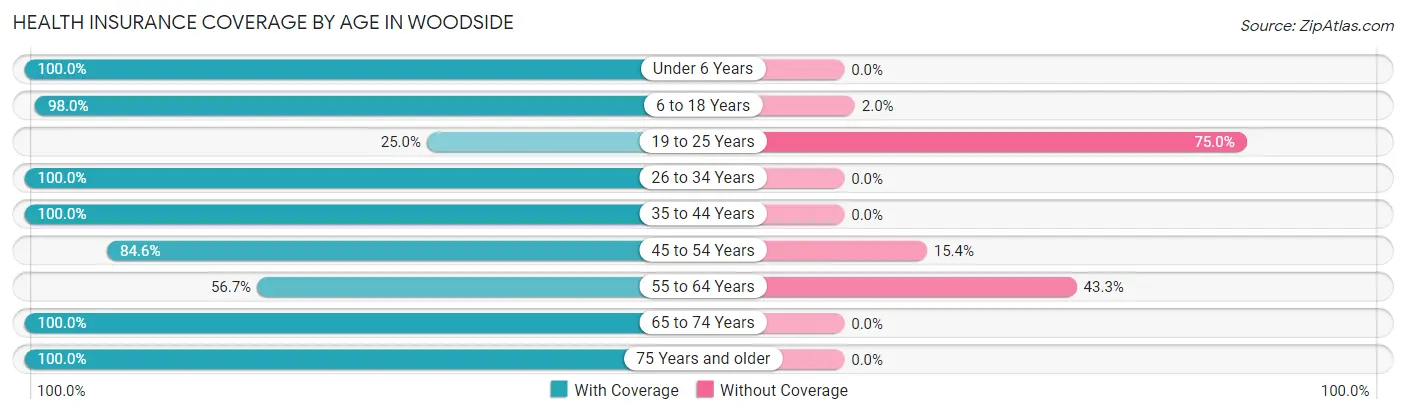
| Age Bracket | With Coverage | Without Coverage |
| Under 6 Years | 6 (100.0%) | 0 (0.0%) |
| 6 to 18 Years | 50 (98.0%) | 1 (2.0%) |
| 19 to 25 Years | 2 (25.0%) | 6 (75.0%) |
| 26 to 34 Years | 21 (100.0%) | 0 (0.0%) |
| 35 to 44 Years | 18 (100.0%) | 0 (0.0%) |
| 45 to 54 Years | 33 (84.6%) | 6 (15.4%) |
| 55 to 64 Years | 34 (56.7%) | 26 (43.3%) |
| 65 to 74 Years | 11 (100.0%) | 0 (0.0%) |
| 75 Years and older | 39 (100.0%) | 0 (0.0%) |
| Total | 214 (84.6%) | 39 (15.4%) |
Health Insurance Coverage by Citizenship Status in Woodside
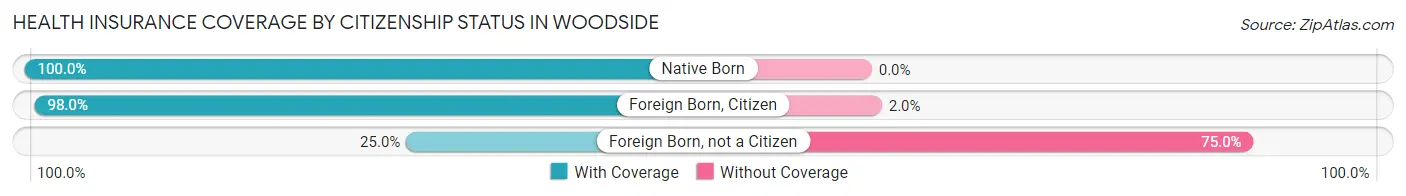
| Citizenship Status | With Coverage | Without Coverage |
| Native Born | 6 (100.0%) | 0 (0.0%) |
| Foreign Born, Citizen | 50 (98.0%) | 1 (2.0%) |
| Foreign Born, not a Citizen | 2 (25.0%) | 6 (75.0%) |
Health Insurance Coverage by Household Income in Woodside
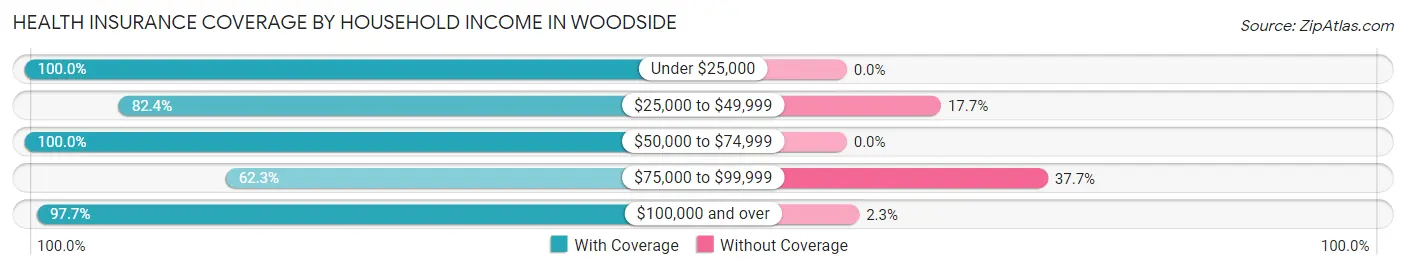
| Household Income | With Coverage | Without Coverage |
| Under $25,000 | 28 (100.0%) | 0 (0.0%) |
| $25,000 to $49,999 | 56 (82.4%) | 12 (17.6%) |
| $50,000 to $74,999 | 45 (100.0%) | 0 (0.0%) |
| $75,000 to $99,999 | 43 (62.3%) | 26 (37.7%) |
| $100,000 and over | 42 (97.7%) | 1 (2.3%) |
Public vs Private Health Insurance Coverage by Age in Woodside
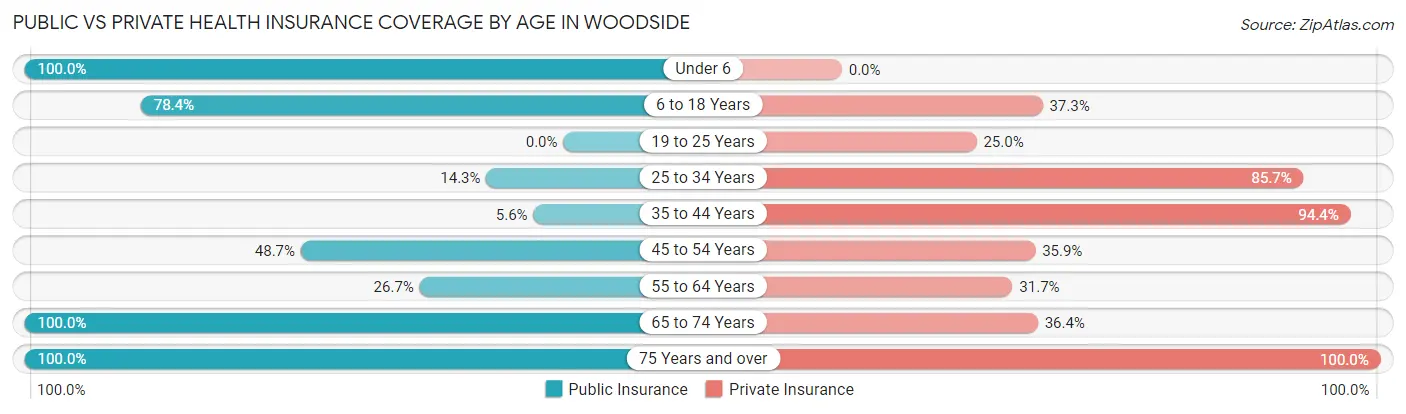
| Age Bracket | Public Insurance | Private Insurance |
| Under 6 | 6 (100.0%) | 0 (0.0%) |
| 6 to 18 Years | 40 (78.4%) | 19 (37.2%) |
| 19 to 25 Years | 0 (0.0%) | 2 (25.0%) |
| 25 to 34 Years | 3 (14.3%) | 18 (85.7%) |
| 35 to 44 Years | 1 (5.6%) | 17 (94.4%) |
| 45 to 54 Years | 19 (48.7%) | 14 (35.9%) |
| 55 to 64 Years | 16 (26.7%) | 19 (31.7%) |
| 65 to 74 Years | 11 (100.0%) | 4 (36.4%) |
| 75 Years and over | 39 (100.0%) | 39 (100.0%) |
| Total | 135 (53.4%) | 132 (52.2%) |
Disability Status by Sex by Age in Woodside
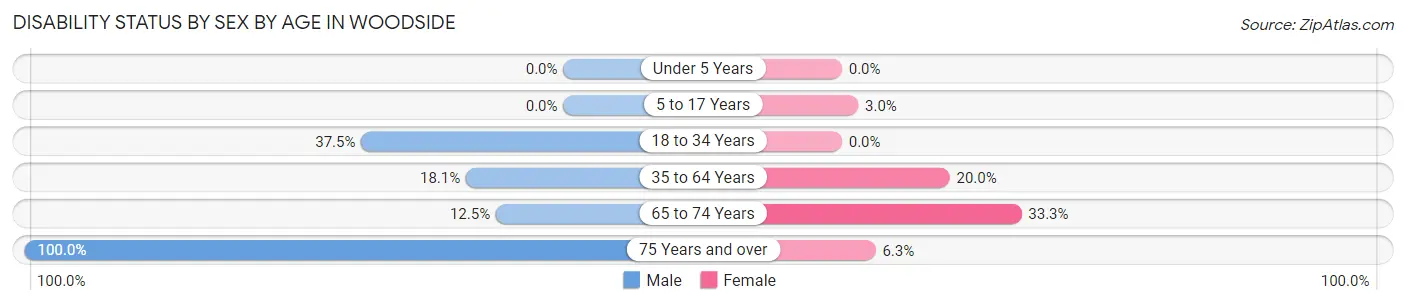
| Age Bracket | Male | Female |
| Under 5 Years | 0 (0.0%) | 0 (0.0%) |
| 5 to 17 Years | 0 (0.0%) | 1 (3.0%) |
| 18 to 34 Years | 6 (37.5%) | 0 (0.0%) |
| 35 to 64 Years | 13 (18.1%) | 9 (20.0%) |
| 65 to 74 Years | 1 (12.5%) | 1 (33.3%) |
| 75 Years and over | 7 (100.0%) | 2 (6.2%) |
Disability Class by Sex by Age in Woodside
Disability Class: Hearing Difficulty
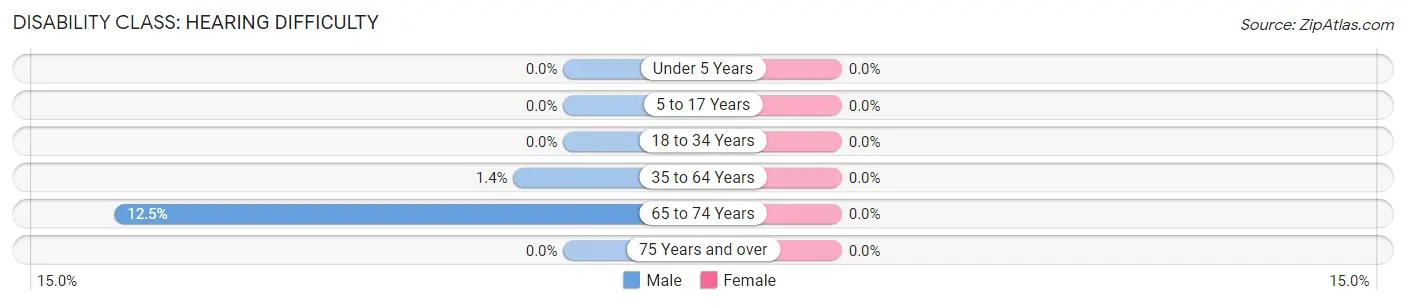
| Age Bracket | Male | Female |
| Under 5 Years | 0 (0.0%) | 0 (0.0%) |
| 5 to 17 Years | 0 (0.0%) | 0 (0.0%) |
| 18 to 34 Years | 0 (0.0%) | 0 (0.0%) |
| 35 to 64 Years | 1 (1.4%) | 0 (0.0%) |
| 65 to 74 Years | 1 (12.5%) | 0 (0.0%) |
| 75 Years and over | 0 (0.0%) | 0 (0.0%) |
Disability Class: Vision Difficulty
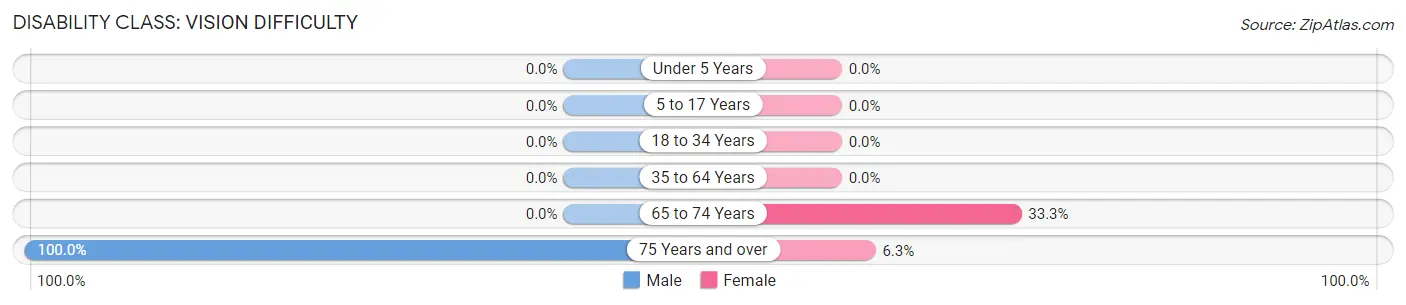
| Age Bracket | Male | Female |
| Under 5 Years | 0 (0.0%) | 0 (0.0%) |
| 5 to 17 Years | 0 (0.0%) | 0 (0.0%) |
| 18 to 34 Years | 0 (0.0%) | 0 (0.0%) |
| 35 to 64 Years | 0 (0.0%) | 0 (0.0%) |
| 65 to 74 Years | 0 (0.0%) | 1 (33.3%) |
| 75 Years and over | 7 (100.0%) | 2 (6.2%) |
Disability Class: Cognitive Difficulty
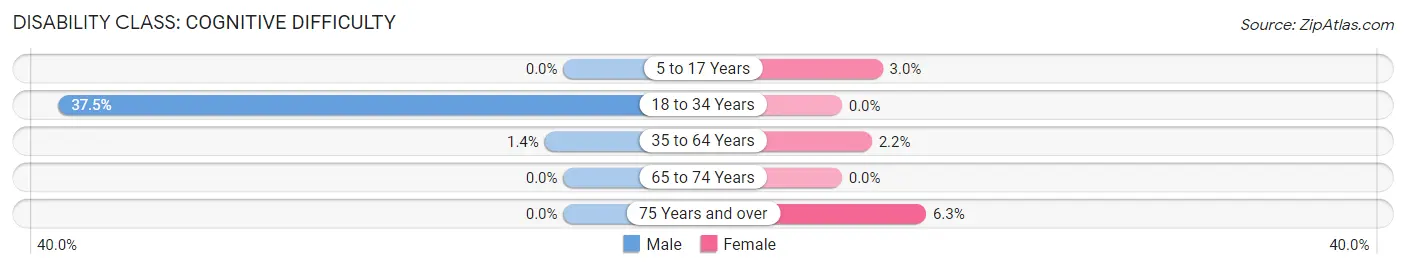
| Age Bracket | Male | Female |
| 5 to 17 Years | 0 (0.0%) | 1 (3.0%) |
| 18 to 34 Years | 6 (37.5%) | 0 (0.0%) |
| 35 to 64 Years | 1 (1.4%) | 1 (2.2%) |
| 65 to 74 Years | 0 (0.0%) | 0 (0.0%) |
| 75 Years and over | 0 (0.0%) | 2 (6.2%) |
Disability Class: Ambulatory Difficulty
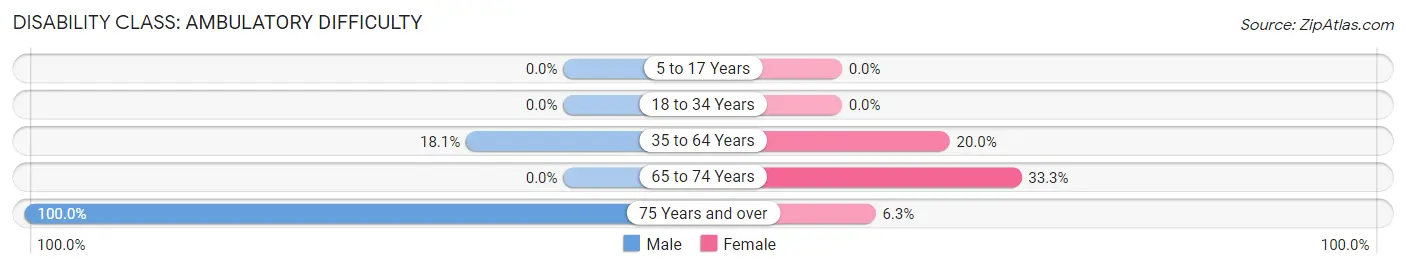
| Age Bracket | Male | Female |
| 5 to 17 Years | 0 (0.0%) | 0 (0.0%) |
| 18 to 34 Years | 0 (0.0%) | 0 (0.0%) |
| 35 to 64 Years | 13 (18.1%) | 9 (20.0%) |
| 65 to 74 Years | 0 (0.0%) | 1 (33.3%) |
| 75 Years and over | 7 (100.0%) | 2 (6.2%) |
Disability Class: Self-Care Difficulty
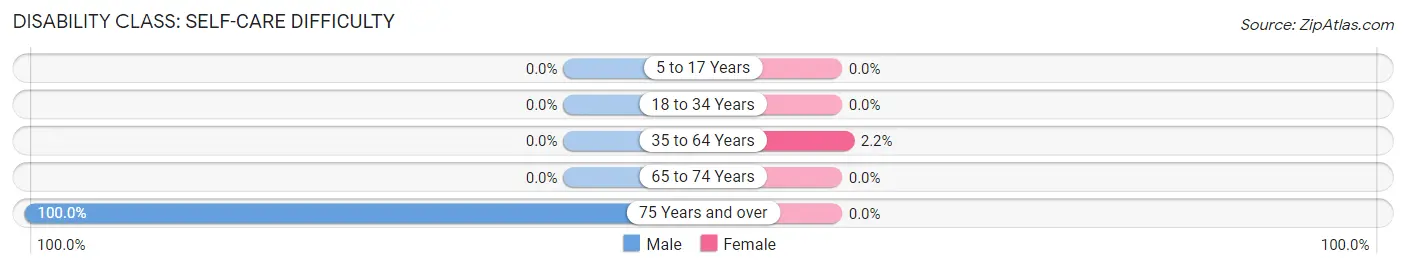
| Age Bracket | Male | Female |
| 5 to 17 Years | 0 (0.0%) | 0 (0.0%) |
| 18 to 34 Years | 0 (0.0%) | 0 (0.0%) |
| 35 to 64 Years | 0 (0.0%) | 1 (2.2%) |
| 65 to 74 Years | 0 (0.0%) | 0 (0.0%) |
| 75 Years and over | 7 (100.0%) | 0 (0.0%) |
Technology Access in Woodside
Computing Device Access in Woodside
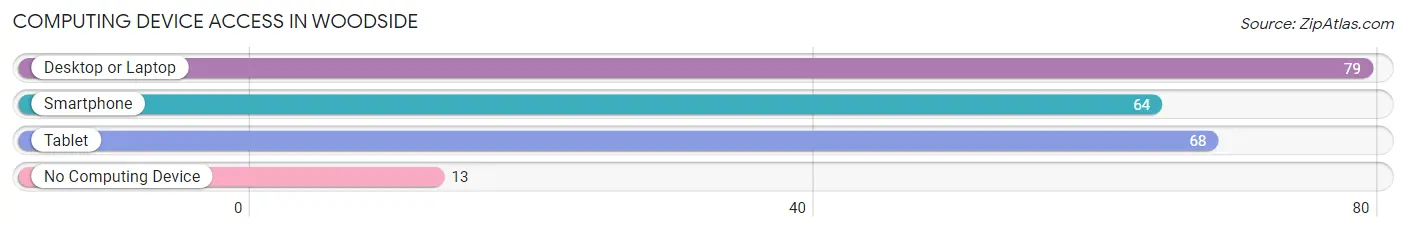
| Device Type | # Households | % Households |
| Desktop or Laptop | 79 | 77.4% |
| Smartphone | 64 | 62.7% |
| Tablet | 68 | 66.7% |
| No Computing Device | 13 | 12.8% |
| Total | 102 | 100.0% |
Internet Access in Woodside
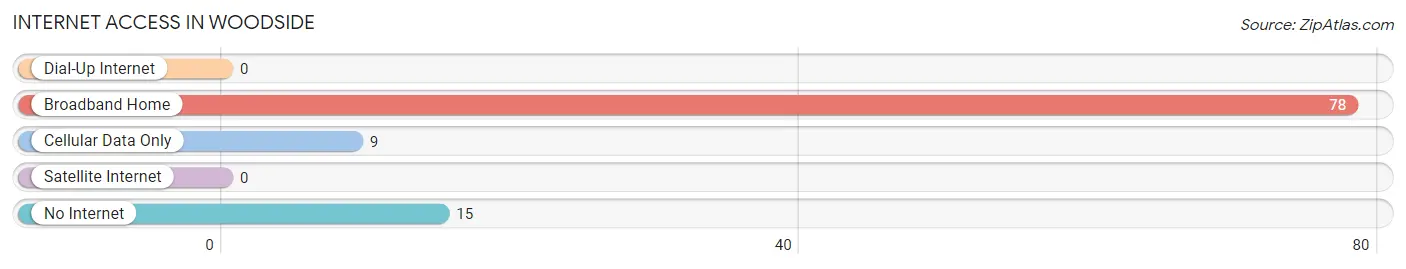
| Internet Type | # Households | % Households |
| Dial-Up Internet | 0 | 0.0% |
| Broadband Home | 78 | 76.5% |
| Cellular Data Only | 9 | 8.8% |
| Satellite Internet | 0 | 0.0% |
| No Internet | 15 | 14.7% |
| Total | 102 | 100.0% |
Woodside Summary
Woodside is a small unincorporated community located in Kent County, Delaware. It is situated in the northern part of the state, approximately 10 miles south of Dover, the state capital. The community is bordered by the towns of Camden, Wyoming, and Frederica. Woodside is a rural area with a population of approximately 1,000 people.
History
Woodside was first settled in the late 1700s by a group of Quakers from Pennsylvania. The Quakers were attracted to the area due to its fertile soil and abundant natural resources. The community was originally known as “Woodside Crossroads” due to its location at the intersection of two major roads. In 1820, the town was officially incorporated as “Woodside”.
The town grew slowly over the next few decades, but experienced a period of rapid growth in the late 1800s. This was due to the construction of the Delaware Railroad, which ran through the town. The railroad brought new businesses and industries to the area, and the population of Woodside increased significantly.
Geography
Woodside is located in northern Kent County, Delaware. It is situated in the Delmarva Peninsula, which is bordered by the Chesapeake Bay to the east and the Atlantic Ocean to the south. The town is located approximately 10 miles south of Dover, the state capital.
The town is situated on a flat plain, with an elevation of approximately 30 feet above sea level. The climate is humid subtropical, with hot, humid summers and mild winters. The average annual temperature is around 60 degrees Fahrenheit.
Economy
Woodside’s economy is largely based on agriculture. The town is home to several farms, which produce a variety of crops, including corn, soybeans, wheat, and hay. The town also has several small businesses, including a grocery store, a hardware store, and a few restaurants.
The town is also home to several manufacturing companies, which produce a variety of products, including furniture, clothing, and electronics. The town is also home to a few small technology companies, which specialize in software development and web design.
Demographics
As of the 2010 census, the population of Woodside was 1,000 people. The racial makeup of the town was 94.2% White, 2.2% African American, 0.7% Native American, 0.7% Asian, and 2.2% from other races. The median household income was $45,000, and the median age was 40 years.
Woodside is a small, rural community with a strong sense of community. The town is home to several churches, a library, and a few parks. The town also has a volunteer fire department and a volunteer ambulance service. The town is served by the Woodside School District, which includes two elementary schools and one middle school.
Common Questions
What is Per Capita Income in Woodside?
Per Capita income in Woodside is $26,368.
What is the Median Family Income in Woodside?
Median Family Income in Woodside is $80,938.
What is the Median Household income in Woodside?
Median Household Income in Woodside is $77,500.
What is Income or Wage Gap in Woodside?
Income or Wage Gap in Woodside is 13.6%.
Women in Woodside earn 86.4 cents for every dollar earned by a man.
What is Inequality or Gini Index in Woodside?
Inequality or Gini Index in Woodside is 0.32.
What is the Total Population of Woodside?
Total Population of Woodside is 253.
What is the Total Male Population of Woodside?
Total Male Population of Woodside is 120.
What is the Total Female Population of Woodside?
Total Female Population of Woodside is 133.
What is the Ratio of Males per 100 Females in Woodside?
There are 90.23 Males per 100 Females in Woodside.
What is the Ratio of Females per 100 Males in Woodside?
There are 110.83 Females per 100 Males in Woodside.
What is the Median Population Age in Woodside?
Median Population Age in Woodside is 49.9 Years.
What is the Average Family Size in Woodside
Average Family Size in Woodside is 2.8 People.
What is the Average Household Size in Woodside
Average Household Size in Woodside is 2.5 People.
How Large is the Labor Force in Woodside?
There are 116 People in the Labor Forcein in Woodside.
What is the Percentage of People in the Labor Force in Woodside?
56.6% of People are in the Labor Force in Woodside.
What is the Unemployment Rate in Woodside?
Unemployment Rate in Woodside is 3.4%.