Viola, DE Map & Demographics
Viola Map
Viola Overview
$43,865
PER CAPITA INCOME
$81,250
AVG FAMILY INCOME
$88,750
AVG HOUSEHOLD INCOME
48.6%
WAGE / INCOME GAP [ % ]
51.4¢/ $1
WAGE / INCOME GAP [ $ ]
0.36
INEQUALITY / GINI INDEX
81
TOTAL POPULATION
37
MALE POPULATION
44
FEMALE POPULATION
84.09
MALES / 100 FEMALES
118.92
FEMALES / 100 MALES
54.5
MEDIAN AGE
2.6
AVG FAMILY SIZE
2.6
AVG HOUSEHOLD SIZE
45
LABOR FORCE [ PEOPLE ]
68.2%
PERCENT IN LABOR FORCE
8.9%
UNEMPLOYMENT RATE
Viola Zip Codes
Viola Area Codes
Income in Viola
Income Overview in Viola
Per Capita Income in Viola is $43,865, while median incomes of families and households are $81,250 and $88,750 respectively.
| Characteristic | Number | Measure |
| Per Capita Income | 81 | $43,865 |
| Median Family Income | 27 | $81,250 |
| Mean Family Income | 27 | $80,785 |
| Median Household Income | 31 | $88,750 |
| Mean Household Income | 31 | $98,352 |
| Income Deficit | 27 | $0 |
| Wage / Income Gap (%) | 81 | 48.57% |
| Wage / Income Gap ($) | 81 | 51.43¢ per $1 |
| Gini / Inequality Index | 81 | 0.36 |
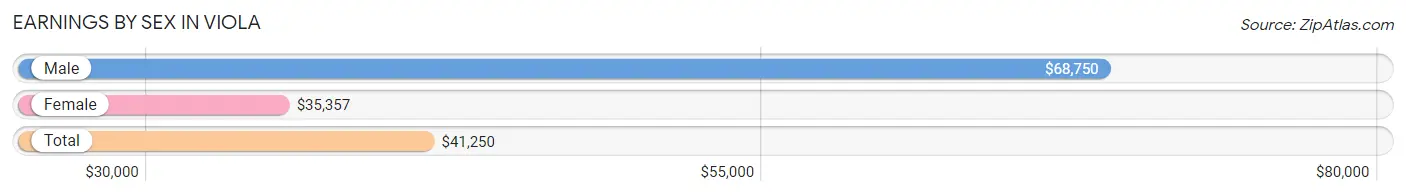
Earnings by Sex in Viola
Average Earnings in Viola are $41,250, $68,750 for men and $35,357 for women, a difference of 48.6%.
| Sex | Number | Average Earnings |
| Male | 21 (46.7%) | $68,750 |
| Female | 24 (53.3%) | $35,357 |
| Total | 45 (100.0%) | $41,250 |
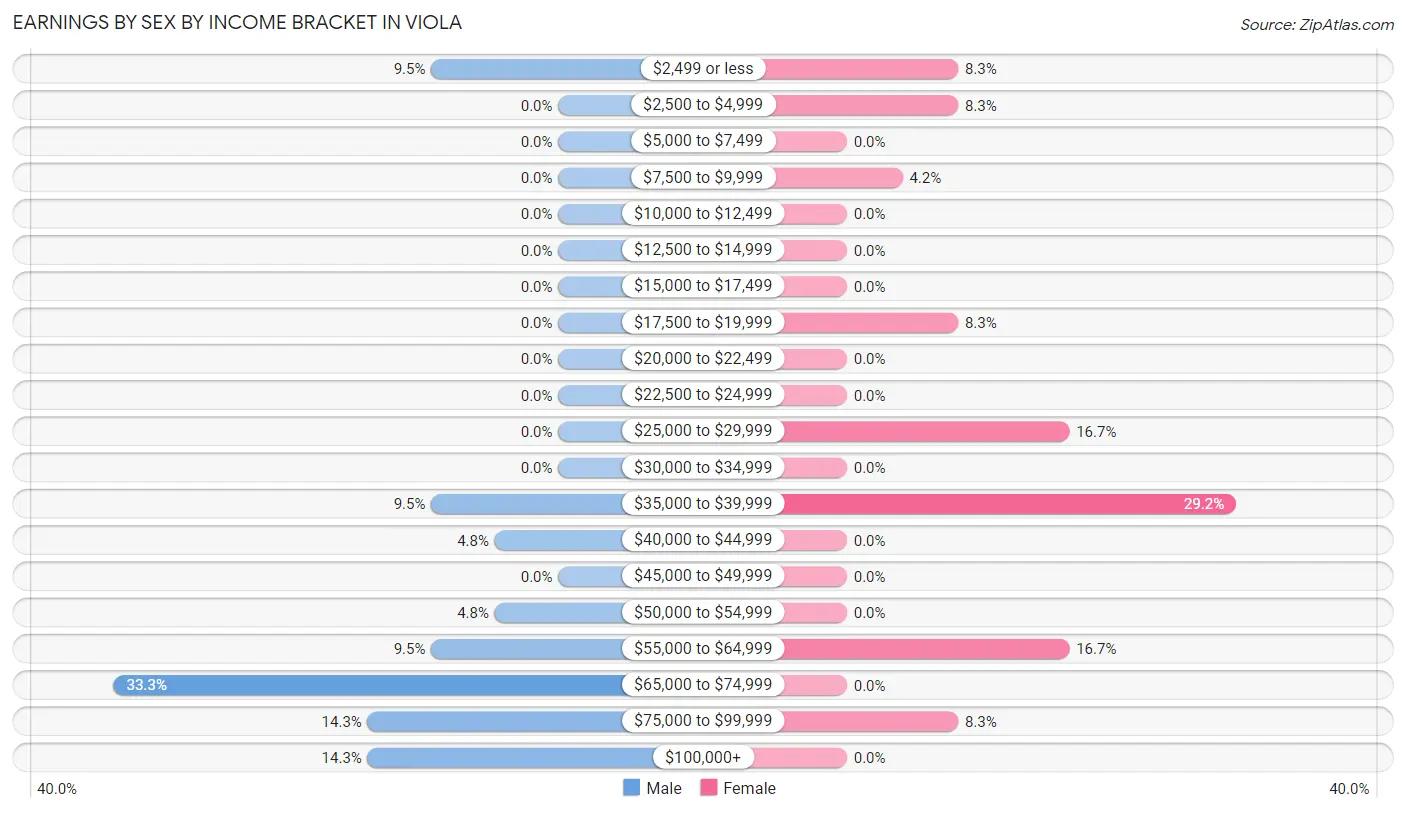
Earnings by Sex by Income Bracket in Viola
The most common earnings brackets in Viola are $65,000 to $74,999 for men (7 | 33.3%) and $35,000 to $39,999 for women (7 | 29.2%).
| Income | Male | Female |
| $2,499 or less | 2 (9.5%) | 2 (8.3%) |
| $2,500 to $4,999 | 0 (0.0%) | 2 (8.3%) |
| $5,000 to $7,499 | 0 (0.0%) | 0 (0.0%) |
| $7,500 to $9,999 | 0 (0.0%) | 1 (4.2%) |
| $10,000 to $12,499 | 0 (0.0%) | 0 (0.0%) |
| $12,500 to $14,999 | 0 (0.0%) | 0 (0.0%) |
| $15,000 to $17,499 | 0 (0.0%) | 0 (0.0%) |
| $17,500 to $19,999 | 0 (0.0%) | 2 (8.3%) |
| $20,000 to $22,499 | 0 (0.0%) | 0 (0.0%) |
| $22,500 to $24,999 | 0 (0.0%) | 0 (0.0%) |
| $25,000 to $29,999 | 0 (0.0%) | 4 (16.7%) |
| $30,000 to $34,999 | 0 (0.0%) | 0 (0.0%) |
| $35,000 to $39,999 | 2 (9.5%) | 7 (29.2%) |
| $40,000 to $44,999 | 1 (4.8%) | 0 (0.0%) |
| $45,000 to $49,999 | 0 (0.0%) | 0 (0.0%) |
| $50,000 to $54,999 | 1 (4.8%) | 0 (0.0%) |
| $55,000 to $64,999 | 2 (9.5%) | 4 (16.7%) |
| $65,000 to $74,999 | 7 (33.3%) | 0 (0.0%) |
| $75,000 to $99,999 | 3 (14.3%) | 2 (8.3%) |
| $100,000+ | 3 (14.3%) | 0 (0.0%) |
| Total | 21 (100.0%) | 24 (100.0%) |
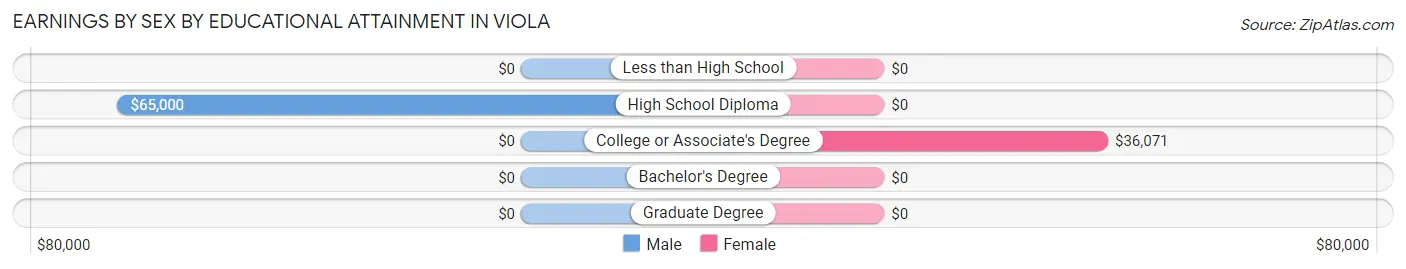
Earnings by Sex by Educational Attainment in Viola
Average earnings in Viola are $68,750 for men and $35,714 for women, a difference of 48.0%. Men with an educational attainment of high school diploma enjoy the highest average annual earnings of $65,000, while those with high school diploma education earn the least with $65,000. Women with an educational attainment of college or associate's degree earn the most with the average annual earnings of $36,071, while those with college or associate's degree education have the smallest earnings of $36,071.
| Educational Attainment | Male Income | Female Income |
| Less than High School | - | - |
| High School Diploma | $65,000 | $0 |
| College or Associate's Degree | - | - |
| Bachelor's Degree | - | - |
| Graduate Degree | - | - |
| Total | $68,750 | $35,714 |
Family Income in Viola
Family Income Brackets in Viola
According to the Viola family income data, there are 7 families falling into the $100,000 to $149,999 income range, which is the most common income bracket and makes up 25.9% of all families.
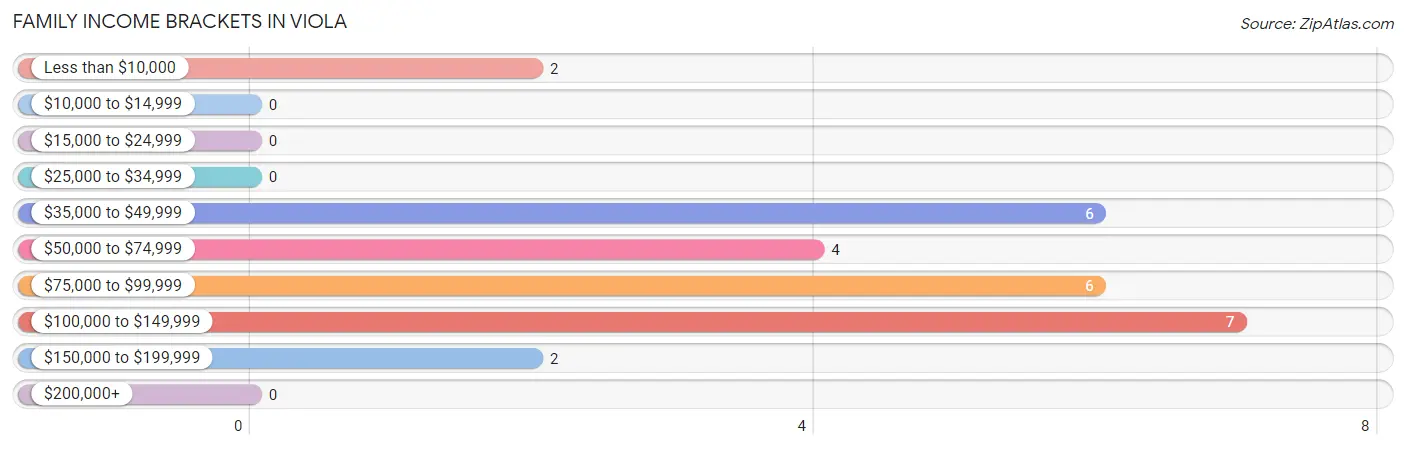
| Income Bracket | # Families | % Families |
| Less than $10,000 | 2 | 7.4% |
| $10,000 to $14,999 | 0 | 0.0% |
| $15,000 to $24,999 | 0 | 0.0% |
| $25,000 to $34,999 | 0 | 0.0% |
| $35,000 to $49,999 | 6 | 22.2% |
| $50,000 to $74,999 | 4 | 14.8% |
| $75,000 to $99,999 | 6 | 22.2% |
| $100,000 to $149,999 | 7 | 25.9% |
| $150,000 to $199,999 | 2 | 7.4% |
| $200,000+ | 0 | 0.0% |
Family Income by Famaliy Size in Viola
4-person families (4 | 14.8%) account for the highest median family income in Viola with $118,750 per family, while 4-person families (4 | 14.8%) have the highest median income of $29,688 per family member.
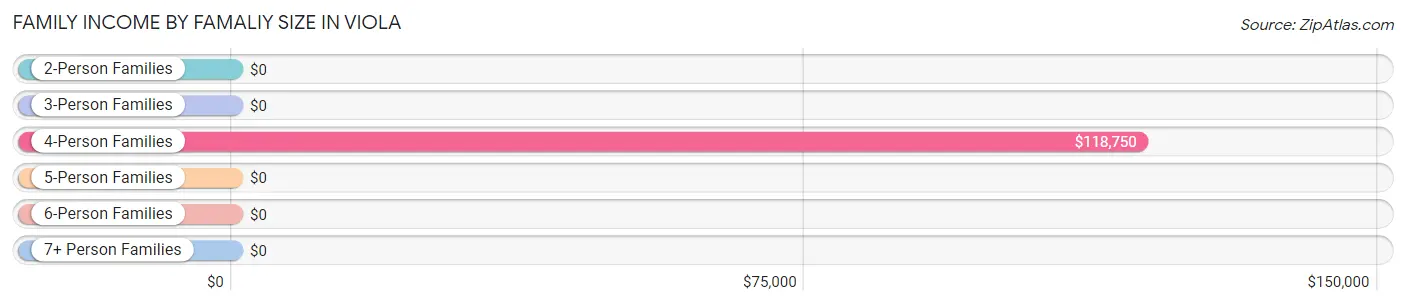
| Income Bracket | # Families | Median Income |
| 2-Person Families | 17 (63.0%) | $0 |
| 3-Person Families | 6 (22.2%) | $0 |
| 4-Person Families | 4 (14.8%) | $118,750 |
| 5-Person Families | 0 (0.0%) | $0 |
| 6-Person Families | 0 (0.0%) | $0 |
| 7+ Person Families | 0 (0.0%) | $0 |
| Total | 27 (100.0%) | $81,250 |
Family Income by Number of Earners in Viola
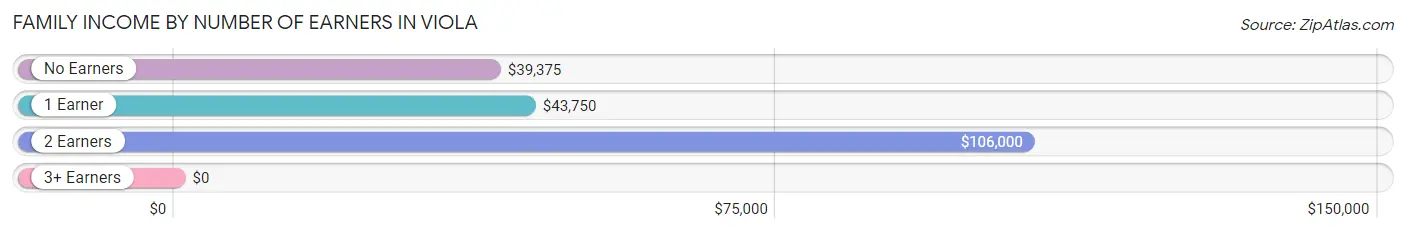
| Number of Earners | # Families | Median Income |
| No Earners | 7 (25.9%) | $39,375 |
| 1 Earner | 6 (22.2%) | $43,750 |
| 2 Earners | 14 (51.8%) | $106,000 |
| 3+ Earners | 0 (0.0%) | $0 |
| Total | 27 (100.0%) | $81,250 |
Household Income in Viola
Household Income Brackets in Viola
With 11 households falling in the category, the $100,000 to $149,999 income range is the most frequent in Viola, accounting for 35.5% of all households.
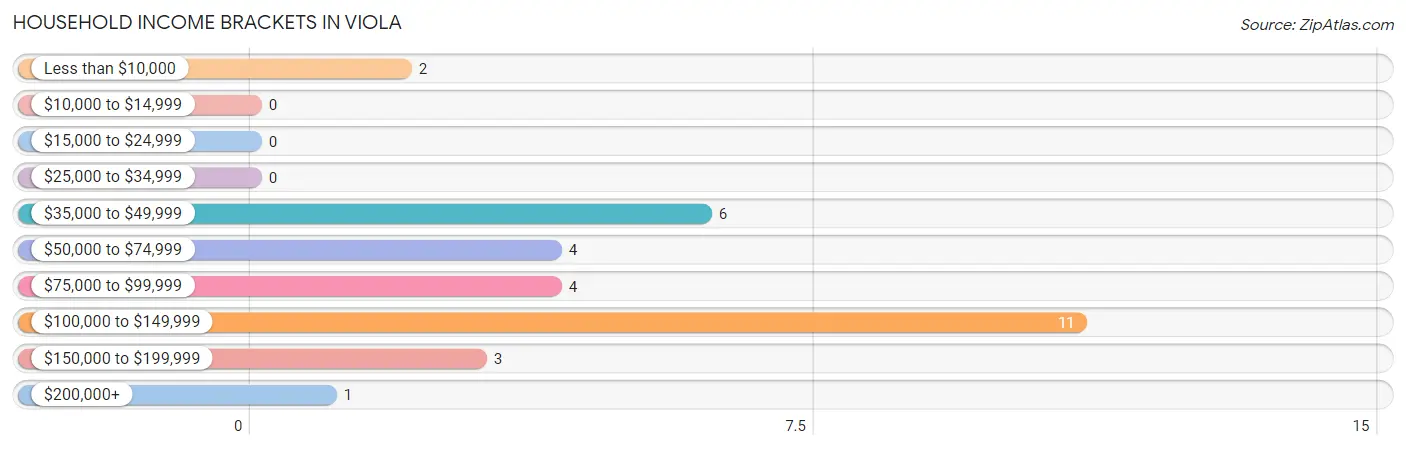
| Income Bracket | # Households | % Households |
| Less than $10,000 | 2 | 6.5% |
| $10,000 to $14,999 | 0 | 0.0% |
| $15,000 to $24,999 | 0 | 0.0% |
| $25,000 to $34,999 | 0 | 0.0% |
| $35,000 to $49,999 | 6 | 19.4% |
| $50,000 to $74,999 | 4 | 12.9% |
| $75,000 to $99,999 | 4 | 12.9% |
| $100,000 to $149,999 | 11 | 35.5% |
| $150,000 to $199,999 | 3 | 9.7% |
| $200,000+ | 1 | 3.2% |
Household Income by Householder Age in Viola
The median household income in Viola is $88,750, with the highest median household income of $106,500 found in the 45 to 64 years age bracket for the primary householder. A total of 12 households (38.7%) fall into this category.
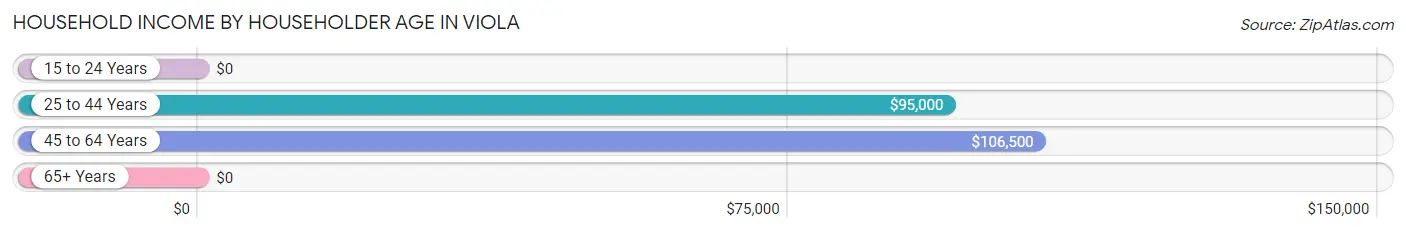
| Income Bracket | # Households | Median Income |
| 15 to 24 Years | 0 (0.0%) | $0 |
| 25 to 44 Years | 8 (25.8%) | $95,000 |
| 45 to 64 Years | 12 (38.7%) | $106,500 |
| 65+ Years | 11 (35.5%) | $0 |
| Total | 31 (100.0%) | $88,750 |
Poverty in Viola
Income Below Poverty by Sex and Age in Viola
With 8.6% poverty level for males and 2.3% for females among the residents of Viola, 35 to 44 year old males and 55 to 64 year old females are the most vulnerable to poverty, with 1 males (25.0%) and 1 females (7.1%) in their respective age groups living below the poverty level.
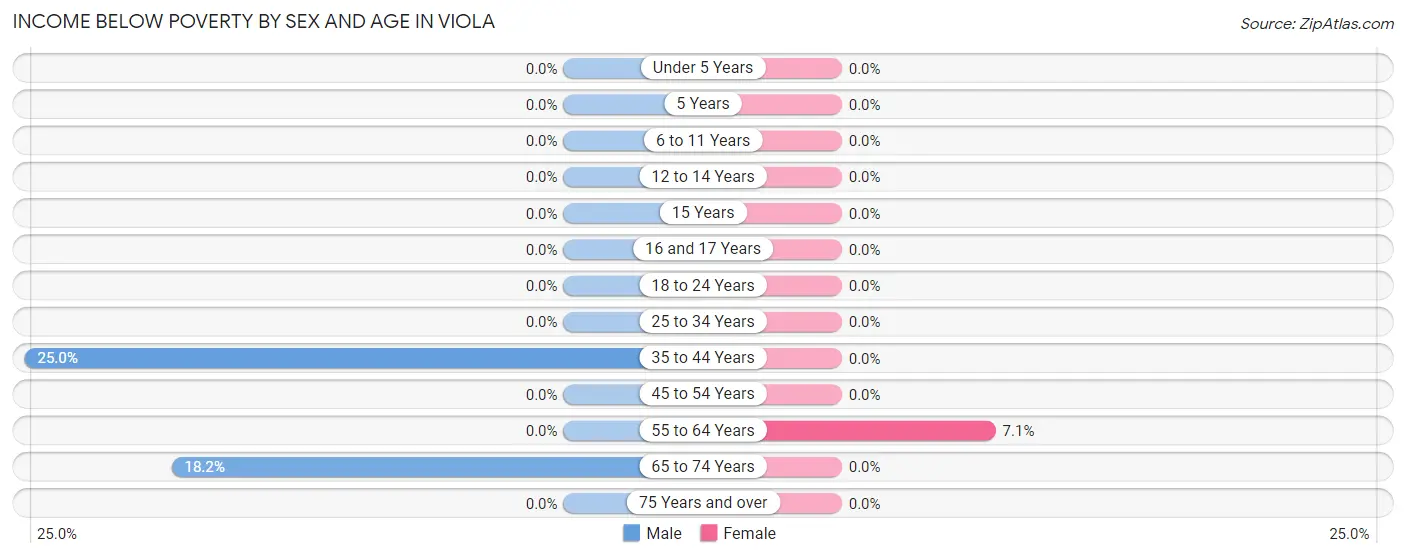
| Age Bracket | Male | Female |
| Under 5 Years | 0 (0.0%) | 0 (0.0%) |
| 5 Years | 0 (0.0%) | 0 (0.0%) |
| 6 to 11 Years | 0 (0.0%) | 0 (0.0%) |
| 12 to 14 Years | 0 (0.0%) | 0 (0.0%) |
| 15 Years | 0 (0.0%) | 0 (0.0%) |
| 16 and 17 Years | 0 (0.0%) | 0 (0.0%) |
| 18 to 24 Years | 0 (0.0%) | 0 (0.0%) |
| 25 to 34 Years | 0 (0.0%) | 0 (0.0%) |
| 35 to 44 Years | 1 (25.0%) | 0 (0.0%) |
| 45 to 54 Years | 0 (0.0%) | 0 (0.0%) |
| 55 to 64 Years | 0 (0.0%) | 1 (7.1%) |
| 65 to 74 Years | 2 (18.2%) | 0 (0.0%) |
| 75 Years and over | 0 (0.0%) | 0 (0.0%) |
| Total | 3 (8.6%) | 1 (2.3%) |
Income Above Poverty by Sex and Age in Viola
According to the poverty statistics in Viola, males aged 6 to 11 years and females aged 6 to 11 years are the age groups that are most secure financially, with 100.0% of males and 100.0% of females in these age groups living above the poverty line.
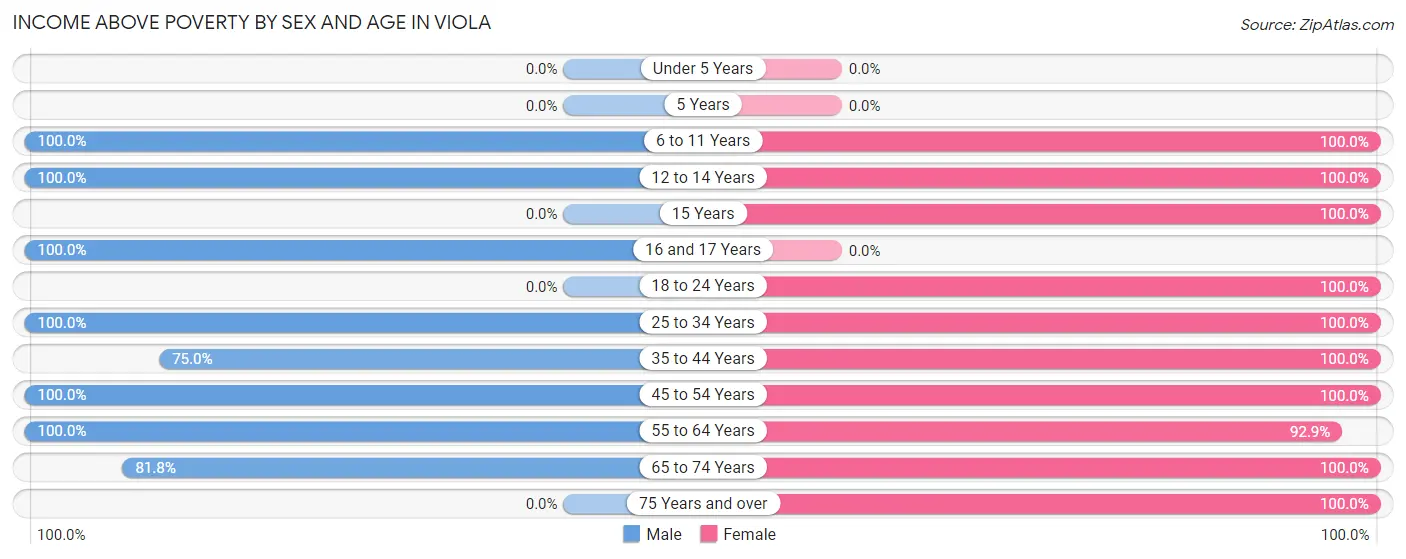
| Age Bracket | Male | Female |
| Under 5 Years | 0 (0.0%) | 0 (0.0%) |
| 5 Years | 0 (0.0%) | 0 (0.0%) |
| 6 to 11 Years | 2 (100.0%) | 5 (100.0%) |
| 12 to 14 Years | 2 (100.0%) | 1 (100.0%) |
| 15 Years | 0 (0.0%) | 3 (100.0%) |
| 16 and 17 Years | 1 (100.0%) | 0 (0.0%) |
| 18 to 24 Years | 0 (0.0%) | 4 (100.0%) |
| 25 to 34 Years | 3 (100.0%) | 2 (100.0%) |
| 35 to 44 Years | 3 (75.0%) | 7 (100.0%) |
| 45 to 54 Years | 3 (100.0%) | 2 (100.0%) |
| 55 to 64 Years | 9 (100.0%) | 13 (92.9%) |
| 65 to 74 Years | 9 (81.8%) | 3 (100.0%) |
| 75 Years and over | 0 (0.0%) | 3 (100.0%) |
| Total | 32 (91.4%) | 43 (97.7%) |
Income Below Poverty Among Married-Couple Families in Viola
The poverty statistics for married-couple families in Viola show that 8.7% or 2 of the total 23 families live below the poverty line. Families with no children have the highest poverty rate of 10.5%, comprising of 2 families. On the other hand, families with 1 or 2 children have the lowest poverty rate of 0.0%, which includes 0 families.
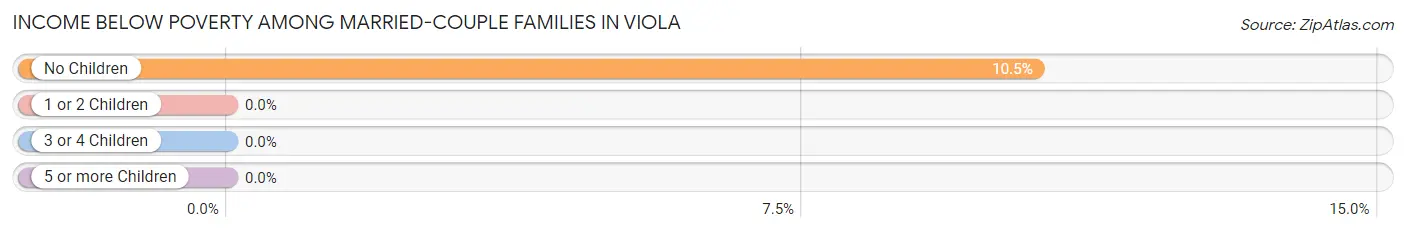
| Children | Above Poverty | Below Poverty |
| No Children | 17 (89.5%) | 2 (10.5%) |
| 1 or 2 Children | 4 (100.0%) | 0 (0.0%) |
| 3 or 4 Children | 0 (0.0%) | 0 (0.0%) |
| 5 or more Children | 0 (0.0%) | 0 (0.0%) |
| Total | 21 (91.3%) | 2 (8.7%) |
Income Below Poverty Among Single-Parent Households in Viola
| Children | Single Father | Single Mother |
| No Children | 0 (0.0%) | 0 (0.0%) |
| 1 or 2 Children | 0 (0.0%) | 0 (0.0%) |
| 3 or 4 Children | 0 (0.0%) | 0 (0.0%) |
| 5 or more Children | 0 (0.0%) | 0 (0.0%) |
| Total | 0 (0.0%) | 0 (0.0%) |
Income Below Poverty Among Married-Couple vs Single-Parent Households in Viola
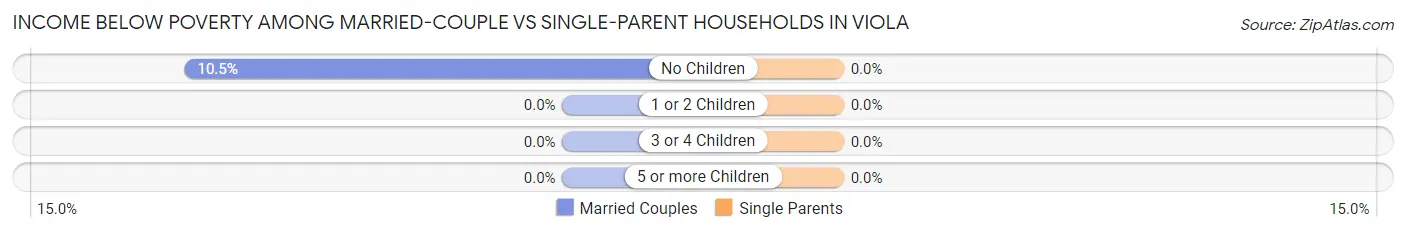
| Children | Married-Couple Families | Single-Parent Households |
| No Children | 2 (10.5%) | 0 (0.0%) |
| 1 or 2 Children | 0 (0.0%) | 0 (0.0%) |
| 3 or 4 Children | 0 (0.0%) | 0 (0.0%) |
| 5 or more Children | 0 (0.0%) | 0 (0.0%) |
| Total | 2 (8.7%) | 0 (0.0%) |
Race in Viola
The most populous races in Viola are White / Caucasian (78 | 96.3%), Hispanic or Latino (5 | 6.2%), and Two or more Races (3 | 3.7%).
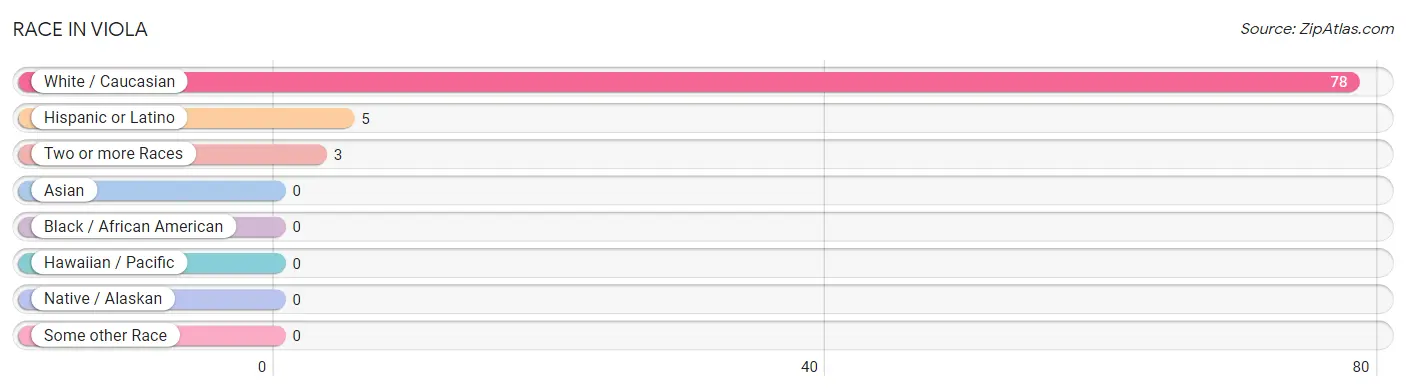
| Race | # Population | % Population |
| Asian | 0 | 0.0% |
| Black / African American | 0 | 0.0% |
| Hawaiian / Pacific | 0 | 0.0% |
| Hispanic or Latino | 5 | 6.2% |
| Native / Alaskan | 0 | 0.0% |
| White / Caucasian | 78 | 96.3% |
| Two or more Races | 3 | 3.7% |
| Some other Race | 0 | 0.0% |
| Total | 81 | 100.0% |
Ancestry in Viola
The most populous ancestries reported in Viola are American (21 | 25.9%), German (7 | 8.6%), English (5 | 6.2%), Irish (5 | 6.2%), and Puerto Rican (5 | 6.2%), together accounting for 53.1% of all Viola residents.
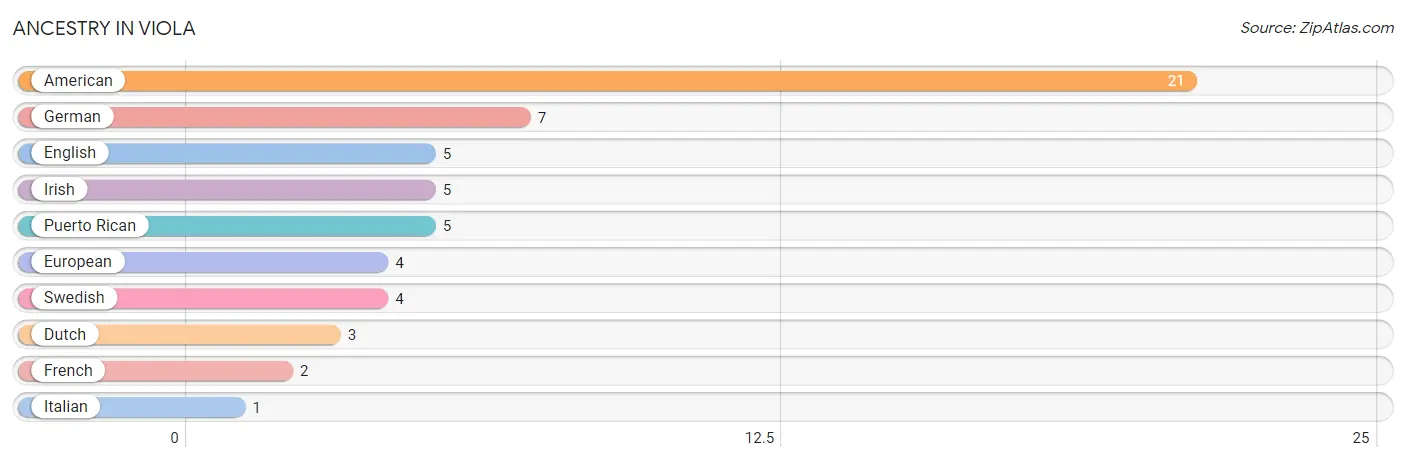
| Ancestry | # Population | % Population |
| American | 21 | 25.9% |
| Dutch | 3 | 3.7% |
| English | 5 | 6.2% |
| European | 4 | 4.9% |
| French | 2 | 2.5% |
| German | 7 | 8.6% |
| Irish | 5 | 6.2% |
| Italian | 1 | 1.2% |
| Puerto Rican | 5 | 6.2% |
| Swedish | 4 | 4.9% | View All 10 Rows |
Immigrants in Viola
The most numerous immigrant groups reported in Viola came from , and Canada (2 | 2.5%), together accounting for 2.5% of all Viola residents.

| Immigration Origin | # Population | % Population |
| Canada | 2 | 2.5% | View All 1 Rows |
Sex and Age in Viola
Sex and Age in Viola
The most populous age groups in Viola are 60 to 64 Years (9 | 24.3%) for men and 60 to 64 Years (12 | 27.3%) for women.
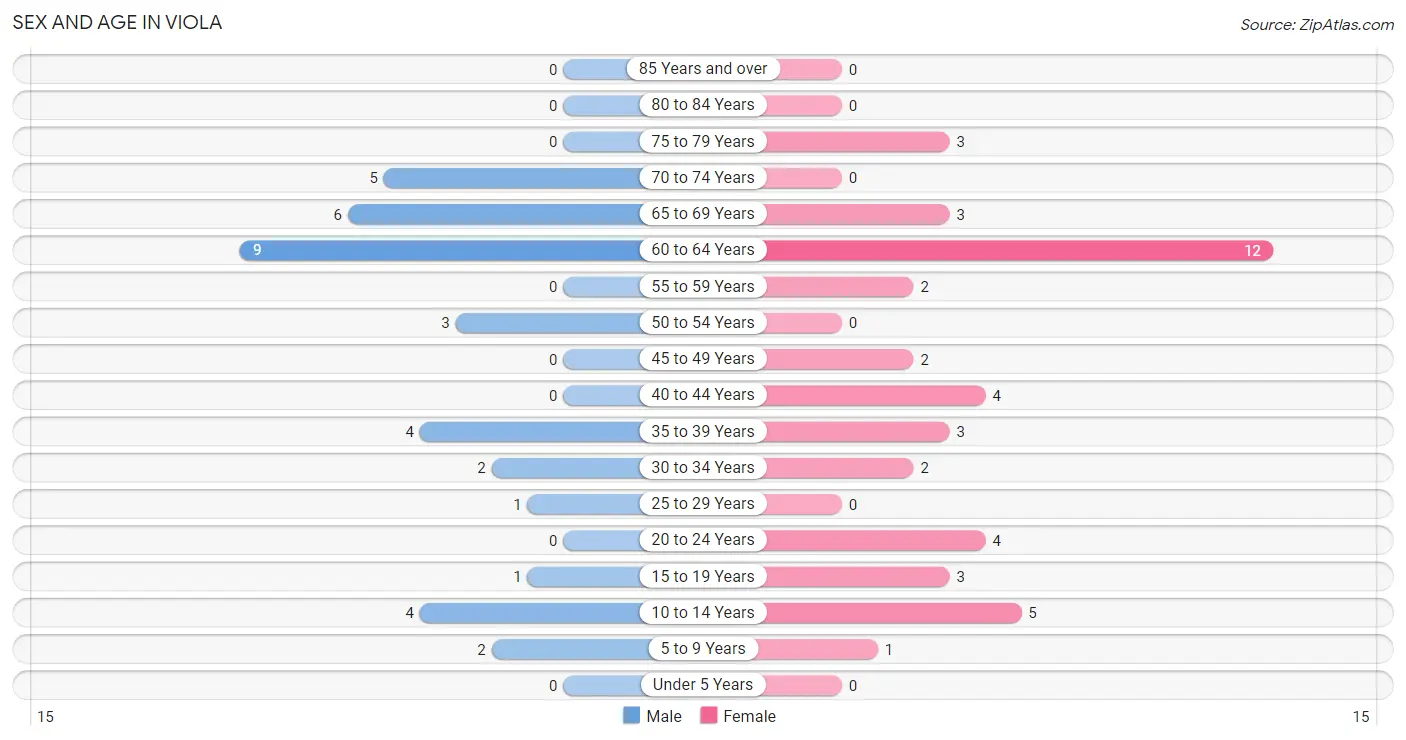
| Age Bracket | Male | Female |
| Under 5 Years | 0 (0.0%) | 0 (0.0%) |
| 5 to 9 Years | 2 (5.4%) | 1 (2.3%) |
| 10 to 14 Years | 4 (10.8%) | 5 (11.4%) |
| 15 to 19 Years | 1 (2.7%) | 3 (6.8%) |
| 20 to 24 Years | 0 (0.0%) | 4 (9.1%) |
| 25 to 29 Years | 1 (2.7%) | 0 (0.0%) |
| 30 to 34 Years | 2 (5.4%) | 2 (4.5%) |
| 35 to 39 Years | 4 (10.8%) | 3 (6.8%) |
| 40 to 44 Years | 0 (0.0%) | 4 (9.1%) |
| 45 to 49 Years | 0 (0.0%) | 2 (4.5%) |
| 50 to 54 Years | 3 (8.1%) | 0 (0.0%) |
| 55 to 59 Years | 0 (0.0%) | 2 (4.5%) |
| 60 to 64 Years | 9 (24.3%) | 12 (27.3%) |
| 65 to 69 Years | 6 (16.2%) | 3 (6.8%) |
| 70 to 74 Years | 5 (13.5%) | 0 (0.0%) |
| 75 to 79 Years | 0 (0.0%) | 3 (6.8%) |
| 80 to 84 Years | 0 (0.0%) | 0 (0.0%) |
| 85 Years and over | 0 (0.0%) | 0 (0.0%) |
| Total | 37 (100.0%) | 44 (100.0%) |
Families and Households in Viola
Median Family Size in Viola
The median family size in Viola is 2.56 persons per family, with single male/father families (2 | 7.4%) accounting for the largest median family size of 3 persons per family. On the other hand, single female/mother families (2 | 7.4%) represent the smallest median family size with 2.00 persons per family.
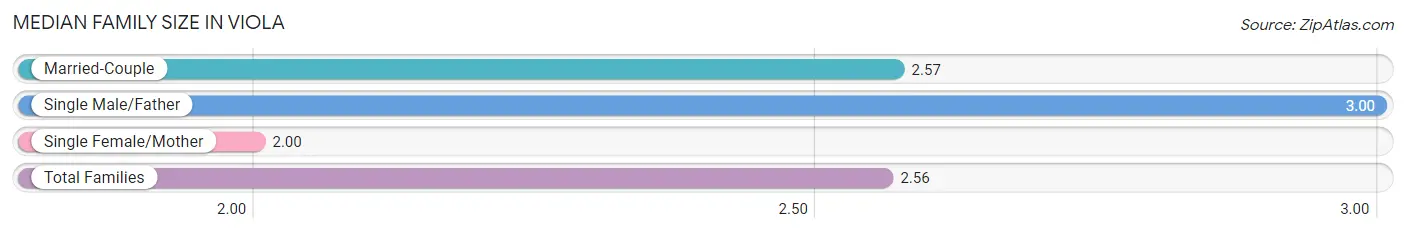
| Family Type | # Families | Family Size |
| Married-Couple | 23 (85.2%) | 2.57 |
| Single Male/Father | 2 (7.4%) | 3.00 |
| Single Female/Mother | 2 (7.4%) | 2.00 |
| Total Families | 27 (100.0%) | 2.56 |
Median Household Size in Viola
The median household size in Viola is 2.61 persons per household, with single male/father households (2 | 6.5%) accounting for the largest median household size of 3 persons per household. single female/mother households (2 | 6.5%) represent the smallest median household size with 2.00 persons per household.
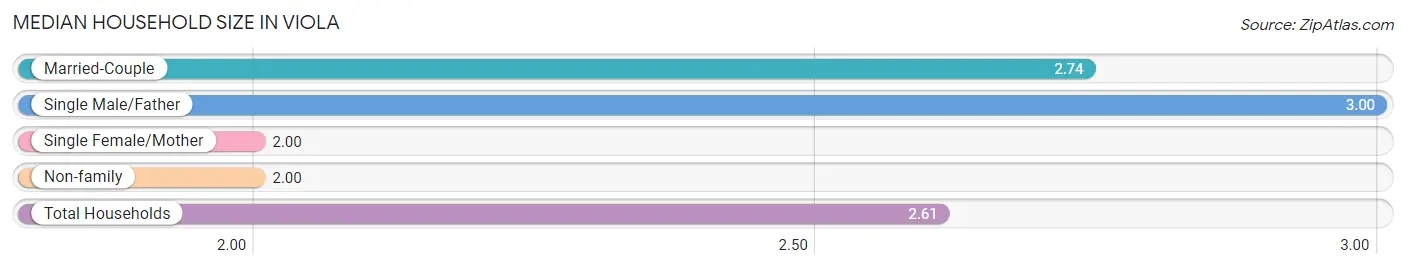
| Household Type | # Households | Household Size |
| Married-Couple | 23 (74.2%) | 2.74 |
| Single Male/Father | 2 (6.5%) | 3.00 |
| Single Female/Mother | 2 (6.5%) | 2.00 |
| Non-family | 4 (12.9%) | 2.00 |
| Total Households | 31 (100.0%) | 2.61 |
Household Size by Marriage Status in Viola
Out of a total of 31 households in Viola, 27 (87.1%) are family households, while 4 (12.9%) are nonfamily households. The most numerous type of family households are 2-person households, comprising 15, and the most common type of nonfamily households are 2-person households, comprising 3.
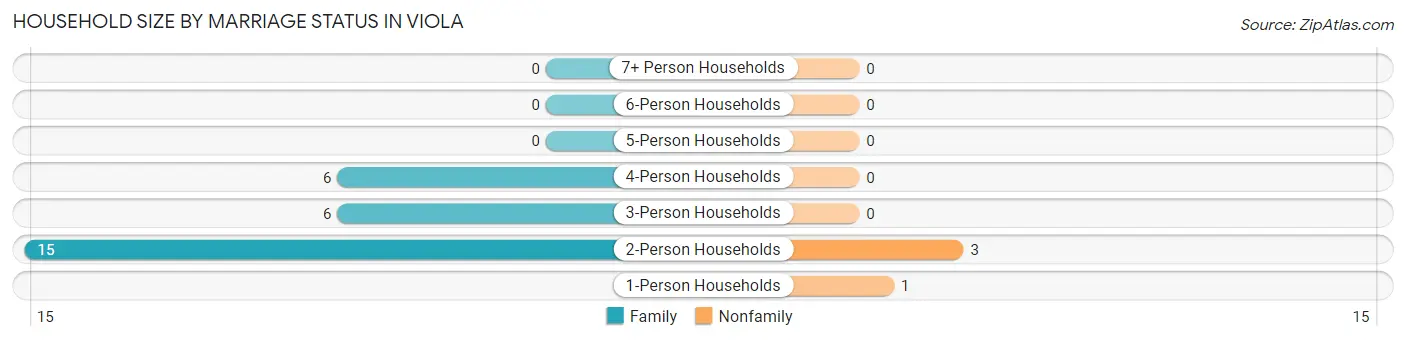
| Household Size | Family Households | Nonfamily Households |
| 1-Person Households | - | 1 (3.2%) |
| 2-Person Households | 15 (48.4%) | 3 (9.7%) |
| 3-Person Households | 6 (19.4%) | 0 (0.0%) |
| 4-Person Households | 6 (19.4%) | 0 (0.0%) |
| 5-Person Households | 0 (0.0%) | 0 (0.0%) |
| 6-Person Households | 0 (0.0%) | 0 (0.0%) |
| 7+ Person Households | 0 (0.0%) | 0 (0.0%) |
| Total | 27 (87.1%) | 4 (12.9%) |
Female Fertility in Viola
Fertility by Age in Viola
| Age Bracket | Women with Births | Births / 1,000 Women |
| 15 to 19 years | 0 (0.0%) | 0.0 |
| 20 to 34 years | 0 (0.0%) | 0.0 |
| 35 to 50 years | 0 (0.0%) | 0.0 |
| Total | 0 (0.0%) | 0.0 |
Fertility by Age by Marriage Status in Viola
| Age Bracket | Married | Unmarried |
| 15 to 19 years | 0 (0.0%) | 0 (0.0%) |
| 20 to 34 years | 0 (0.0%) | 0 (0.0%) |
| 35 to 50 years | 0 (0.0%) | 0 (0.0%) |
| Total | 0 (0.0%) | 0 (0.0%) |
Fertility by Education in Viola
| Educational Attainment | Women with Births | Births / 1,000 Women |
| Less than High School | 0 (0.0%) | 0.0 |
| High School Diploma | 0 (0.0%) | 0.0 |
| College or Associate's Degree | 0 (0.0%) | 0.0 |
| Bachelor's Degree | 0 (0.0%) | 0.0 |
| Graduate Degree | 0 (0.0%) | 0.0 |
| Total | 0 (0.0%) | 0.0 |
Fertility by Education by Marriage Status in Viola
| Educational Attainment | Married | Unmarried |
| Less than High School | 0 (0.0%) | 0 (0.0%) |
| High School Diploma | 0 (0.0%) | 0 (0.0%) |
| College or Associate's Degree | 0 (0.0%) | 0 (0.0%) |
| Bachelor's Degree | 0 (0.0%) | 0 (0.0%) |
| Graduate Degree | 0 (0.0%) | 0 (0.0%) |
| Total | 0 (0.0%) | 0 (0.0%) |
Employment Characteristics in Viola
Employment by Class of Employer in Viola
Among the 41 employed individuals in Viola, private company employees (13 | 31.7%), self-employed (incorporated) (10 | 24.4%), and state government employees (8 | 19.5%) make up the most common classes of employment.
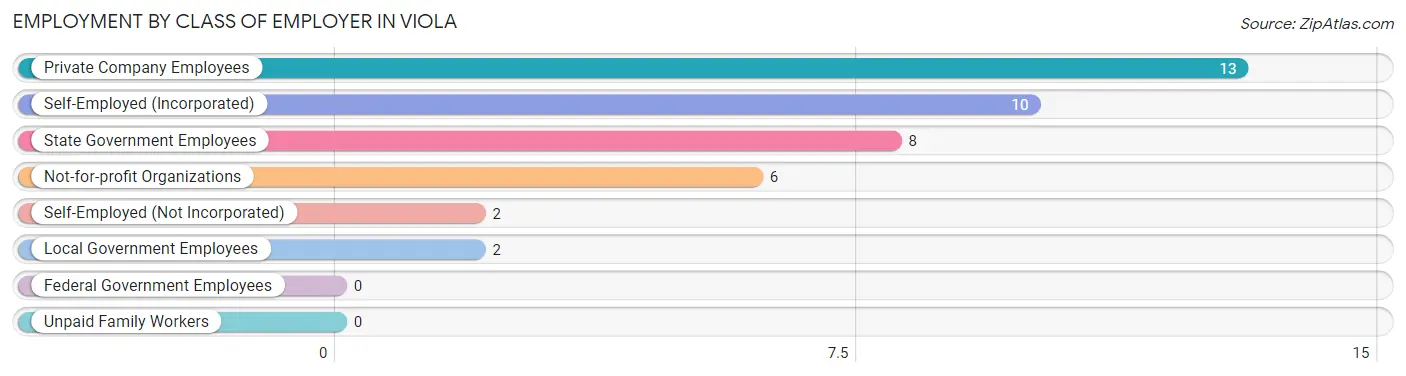
| Employer Class | # Employees | % Employees |
| Private Company Employees | 13 | 31.7% |
| Self-Employed (Incorporated) | 10 | 24.4% |
| Self-Employed (Not Incorporated) | 2 | 4.9% |
| Not-for-profit Organizations | 6 | 14.6% |
| Local Government Employees | 2 | 4.9% |
| State Government Employees | 8 | 19.5% |
| Federal Government Employees | 0 | 0.0% |
| Unpaid Family Workers | 0 | 0.0% |
| Total | 41 | 100.0% |
Employment Status by Age in Viola
According to the labor force statistics for Viola, out of the total population over 16 years of age (66), 68.2% or 45 individuals are in the labor force, with 8.9% or 4 of them unemployed. The age group with the highest labor force participation rate is 20 to 24 years, with 100.0% or 4 individuals in the labor force. Within the labor force, the 20 to 24 years age range has the highest percentage of unemployed individuals, with 50.0% or 2 of them being unemployed.
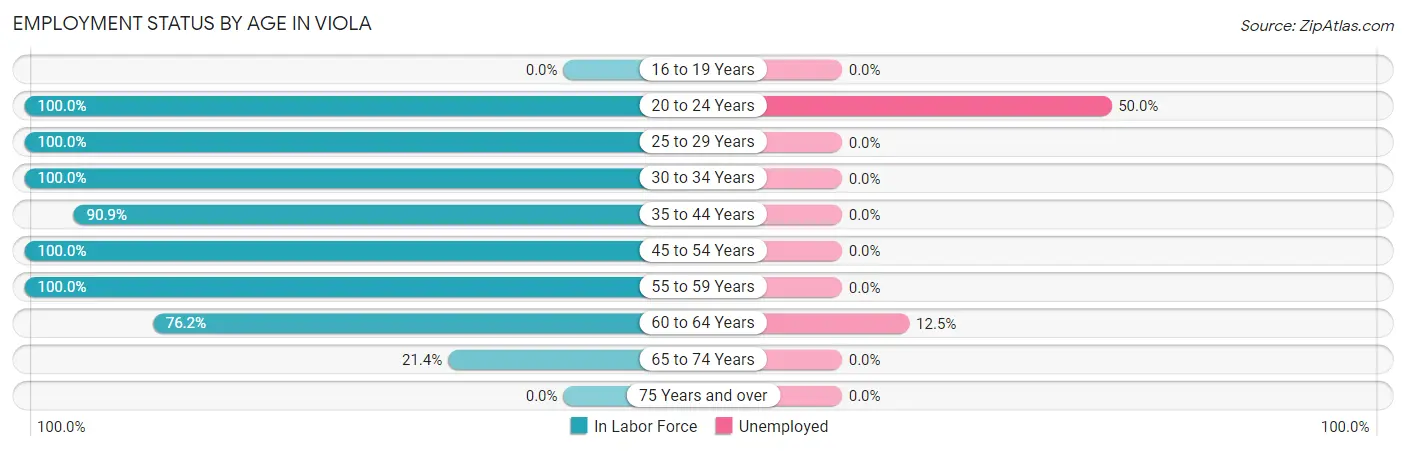
| Age Bracket | In Labor Force | Unemployed |
| 16 to 19 Years | 0 (0.0%) | 0 (0.0%) |
| 20 to 24 Years | 4 (100.0%) | 2 (50.0%) |
| 25 to 29 Years | 1 (100.0%) | 0 (0.0%) |
| 30 to 34 Years | 4 (100.0%) | 0 (0.0%) |
| 35 to 44 Years | 10 (90.9%) | 0 (0.0%) |
| 45 to 54 Years | 5 (100.0%) | 0 (0.0%) |
| 55 to 59 Years | 2 (100.0%) | 0 (0.0%) |
| 60 to 64 Years | 16 (76.2%) | 2 (12.5%) |
| 65 to 74 Years | 3 (21.4%) | 0 (0.0%) |
| 75 Years and over | 0 (0.0%) | 0 (0.0%) |
| Total | 45 (68.2%) | 4 (8.9%) |
Employment Status by Educational Attainment in Viola
According to labor force statistics for Viola, 86.4% of individuals (38) out of the total population between 25 and 64 years of age (44) are in the labor force, with 5.3% or 2 of them being unemployed. The group with the highest labor force participation rate are those with the educational attainment of high school diploma, with 100.0% or 9 individuals in the labor force. Within the labor force, individuals with high school diploma education have the highest percentage of unemployment, with 22.2% or 2 of them being unemployed.
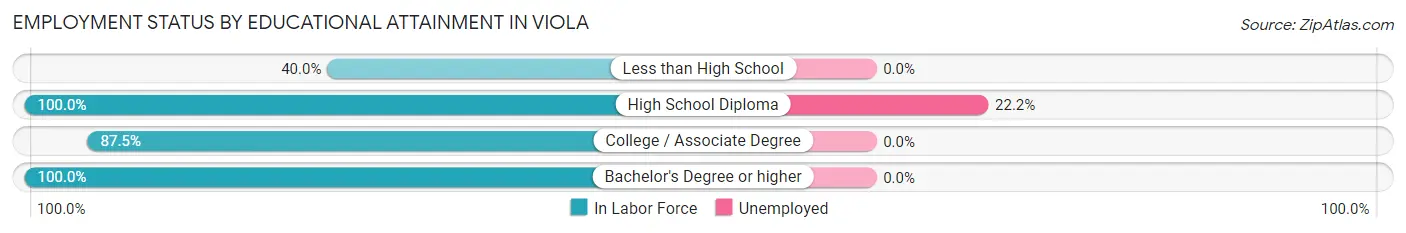
| Educational Attainment | In Labor Force | Unemployed |
| Less than High School | 2 (40.0%) | 0 (0.0%) |
| High School Diploma | 9 (100.0%) | 2 (22.2%) |
| College / Associate Degree | 21 (87.5%) | 0 (0.0%) |
| Bachelor's Degree or higher | 6 (100.0%) | 0 (0.0%) |
| Total | 38 (86.4%) | 2 (5.3%) |
Employment Occupations by Sex in Viola
Management, Business, Science and Arts Occupations
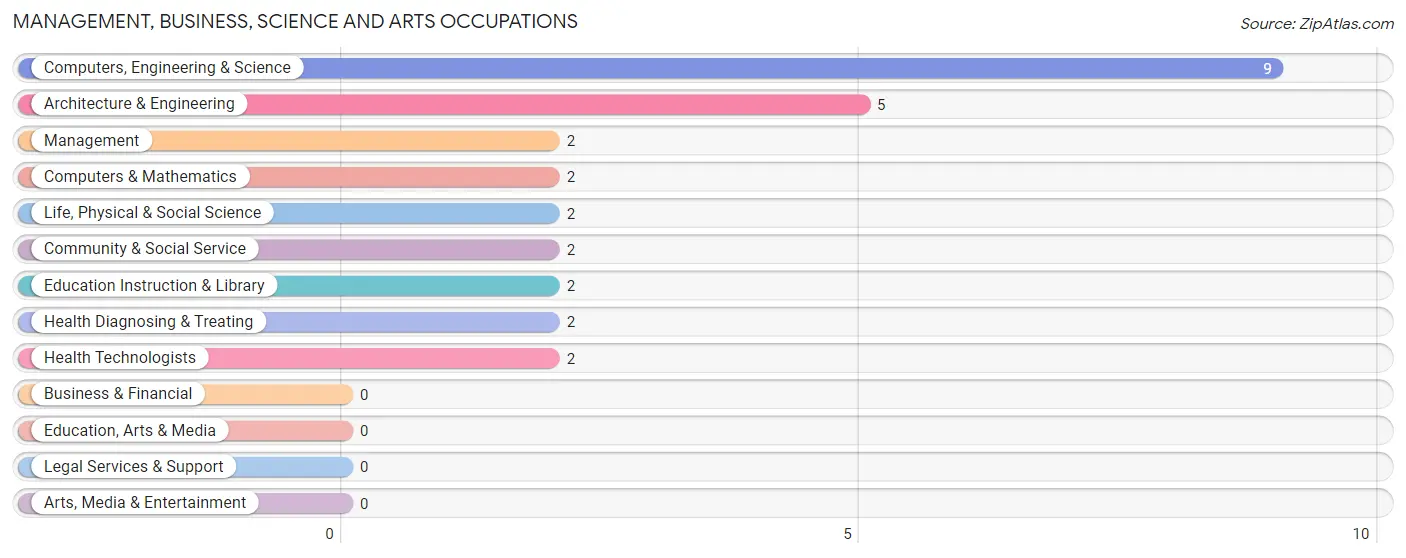
The most common Management, Business, Science and Arts occupations in Viola are Computers, Engineering & Science (9 | 22.0%), Architecture & Engineering (5 | 12.2%), Management (2 | 4.9%), Computers & Mathematics (2 | 4.9%), and Life, Physical & Social Science (2 | 4.9%).
Management, Business, Science and Arts Occupations by Sex
Within the Management, Business, Science and Arts occupations in Viola, the most male-oriented occupations are Computers & Mathematics (100.0%), Architecture & Engineering (100.0%), and Computers, Engineering & Science (77.8%), while the most female-oriented occupations are Management (100.0%), Life, Physical & Social Science (100.0%), and Health Diagnosing & Treating (100.0%).
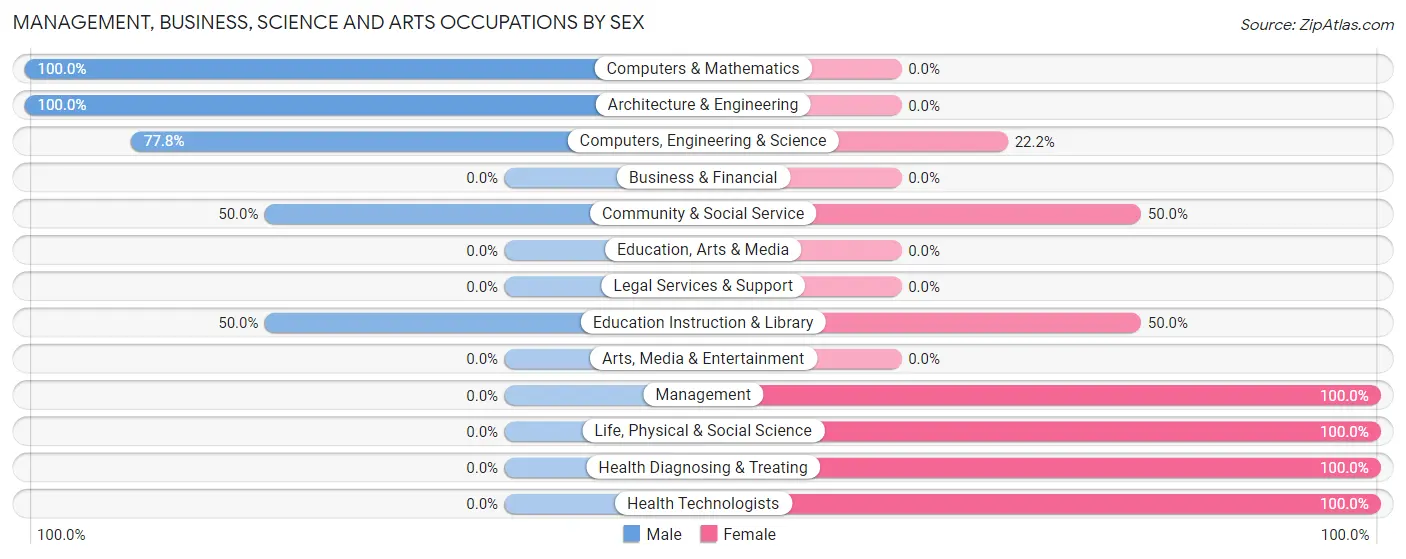
| Occupation | Male | Female |
| Management | 0 (0.0%) | 2 (100.0%) |
| Business & Financial | 0 (0.0%) | 0 (0.0%) |
| Computers, Engineering & Science | 7 (77.8%) | 2 (22.2%) |
| Computers & Mathematics | 2 (100.0%) | 0 (0.0%) |
| Architecture & Engineering | 5 (100.0%) | 0 (0.0%) |
| Life, Physical & Social Science | 0 (0.0%) | 2 (100.0%) |
| Community & Social Service | 1 (50.0%) | 1 (50.0%) |
| Education, Arts & Media | 0 (0.0%) | 0 (0.0%) |
| Legal Services & Support | 0 (0.0%) | 0 (0.0%) |
| Education Instruction & Library | 1 (50.0%) | 1 (50.0%) |
| Arts, Media & Entertainment | 0 (0.0%) | 0 (0.0%) |
| Health Diagnosing & Treating | 0 (0.0%) | 2 (100.0%) |
| Health Technologists | 0 (0.0%) | 2 (100.0%) |
| Total (Category) | 8 (53.3%) | 7 (46.7%) |
| Total (Overall) | 19 (46.3%) | 22 (53.7%) |
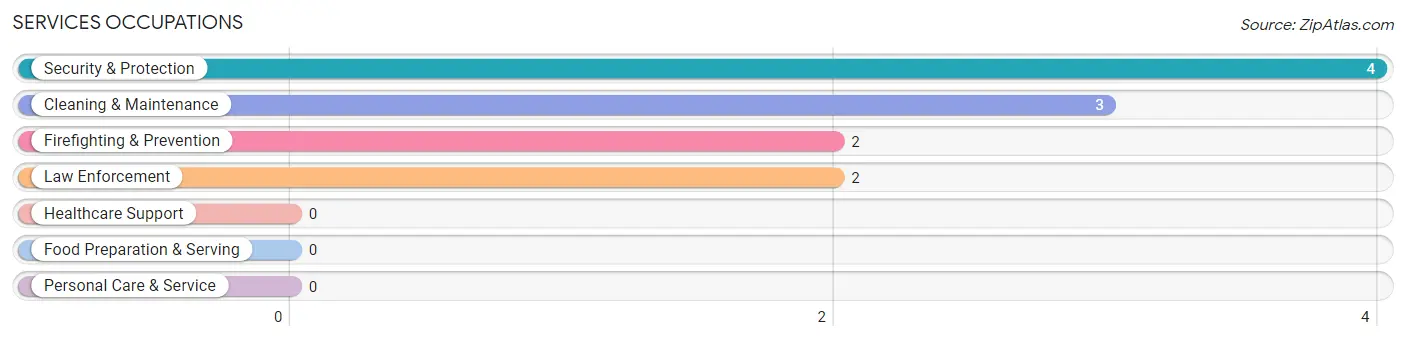
Services Occupations
The most common Services occupations in Viola are Security & Protection (4 | 9.8%), Cleaning & Maintenance (3 | 7.3%), Firefighting & Prevention (2 | 4.9%), and Law Enforcement (2 | 4.9%).
Services Occupations by Sex
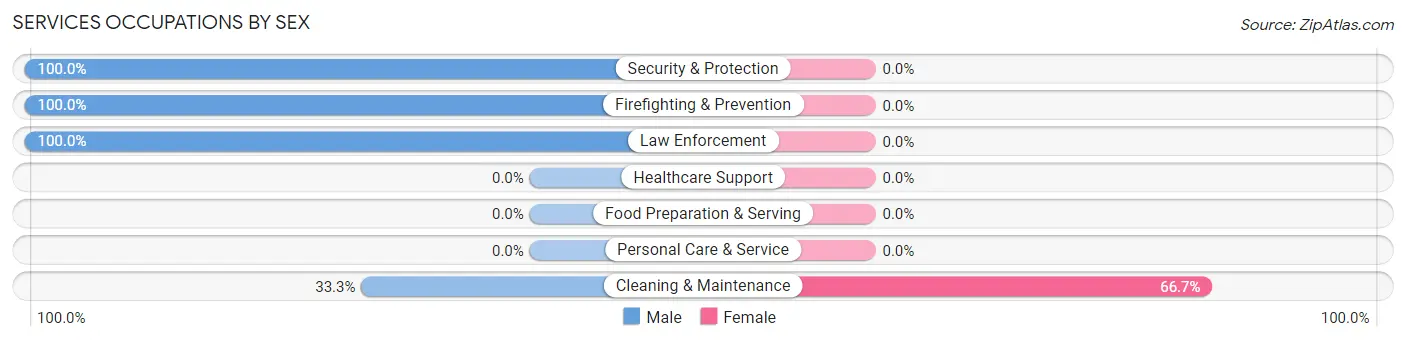
| Occupation | Male | Female |
| Healthcare Support | 0 (0.0%) | 0 (0.0%) |
| Security & Protection | 4 (100.0%) | 0 (0.0%) |
| Firefighting & Prevention | 2 (100.0%) | 0 (0.0%) |
| Law Enforcement | 2 (100.0%) | 0 (0.0%) |
| Food Preparation & Serving | 0 (0.0%) | 0 (0.0%) |
| Cleaning & Maintenance | 1 (33.3%) | 2 (66.7%) |
| Personal Care & Service | 0 (0.0%) | 0 (0.0%) |
| Total (Category) | 5 (71.4%) | 2 (28.6%) |
| Total (Overall) | 19 (46.3%) | 22 (53.7%) |
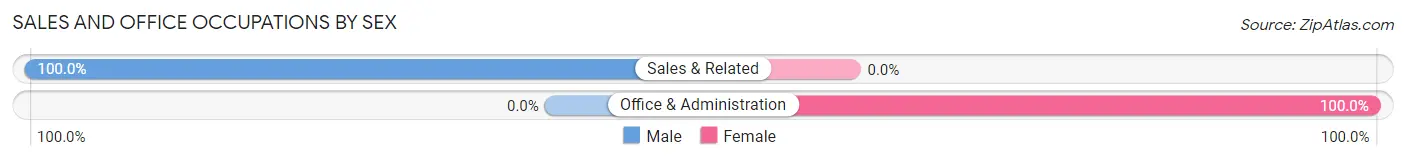
Sales and Office Occupations
The most common Sales and Office occupations in Viola are Office & Administration (13 | 31.7%), and Sales & Related (2 | 4.9%).

Sales and Office Occupations by Sex
| Occupation | Male | Female |
| Sales & Related | 2 (100.0%) | 0 (0.0%) |
| Office & Administration | 0 (0.0%) | 13 (100.0%) |
| Total (Category) | 2 (13.3%) | 13 (86.7%) |
| Total (Overall) | 19 (46.3%) | 22 (53.7%) |
Natural Resources, Construction and Maintenance Occupations
The most common Natural Resources, Construction and Maintenance occupations in Viola are , and Construction & Extraction (1 | 2.4%).
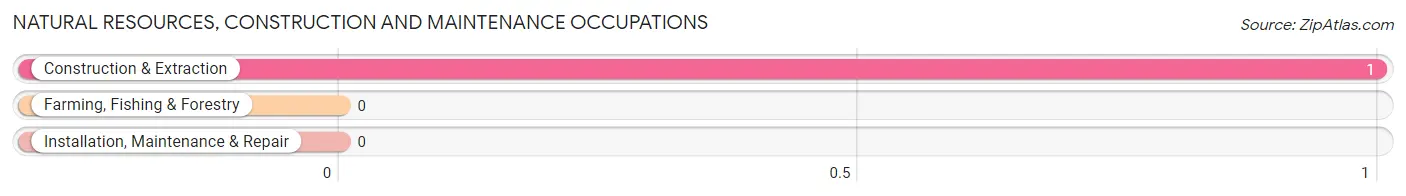
Natural Resources, Construction and Maintenance Occupations by Sex

| Occupation | Male | Female |
| Farming, Fishing & Forestry | 0 (0.0%) | 0 (0.0%) |
| Construction & Extraction | 1 (100.0%) | 0 (0.0%) |
| Installation, Maintenance & Repair | 0 (0.0%) | 0 (0.0%) |
| Total (Category) | 1 (100.0%) | 0 (0.0%) |
| Total (Overall) | 19 (46.3%) | 22 (53.7%) |
Production, Transportation and Moving Occupations
The most common Production, Transportation and Moving occupations in Viola are Transportation (2 | 4.9%), and Production (1 | 2.4%).
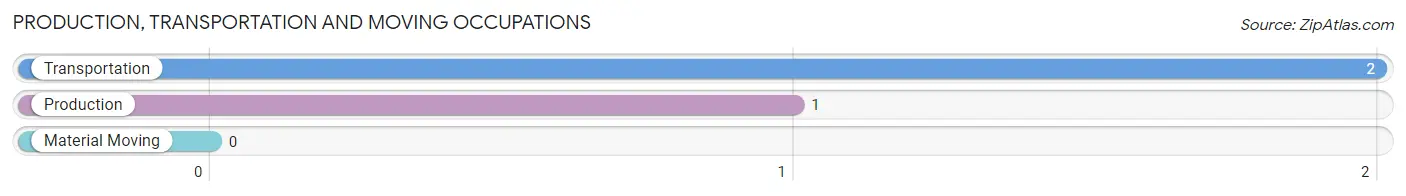
Production, Transportation and Moving Occupations by Sex
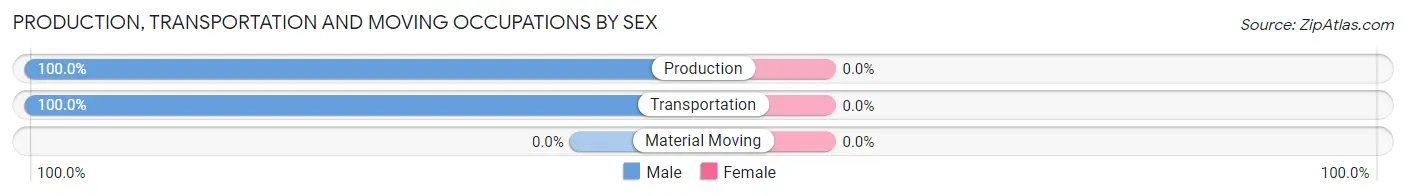
| Occupation | Male | Female |
| Production | 1 (100.0%) | 0 (0.0%) |
| Transportation | 2 (100.0%) | 0 (0.0%) |
| Material Moving | 0 (0.0%) | 0 (0.0%) |
| Total (Category) | 3 (100.0%) | 0 (0.0%) |
| Total (Overall) | 19 (46.3%) | 22 (53.7%) |
Employment Industries by Sex in Viola
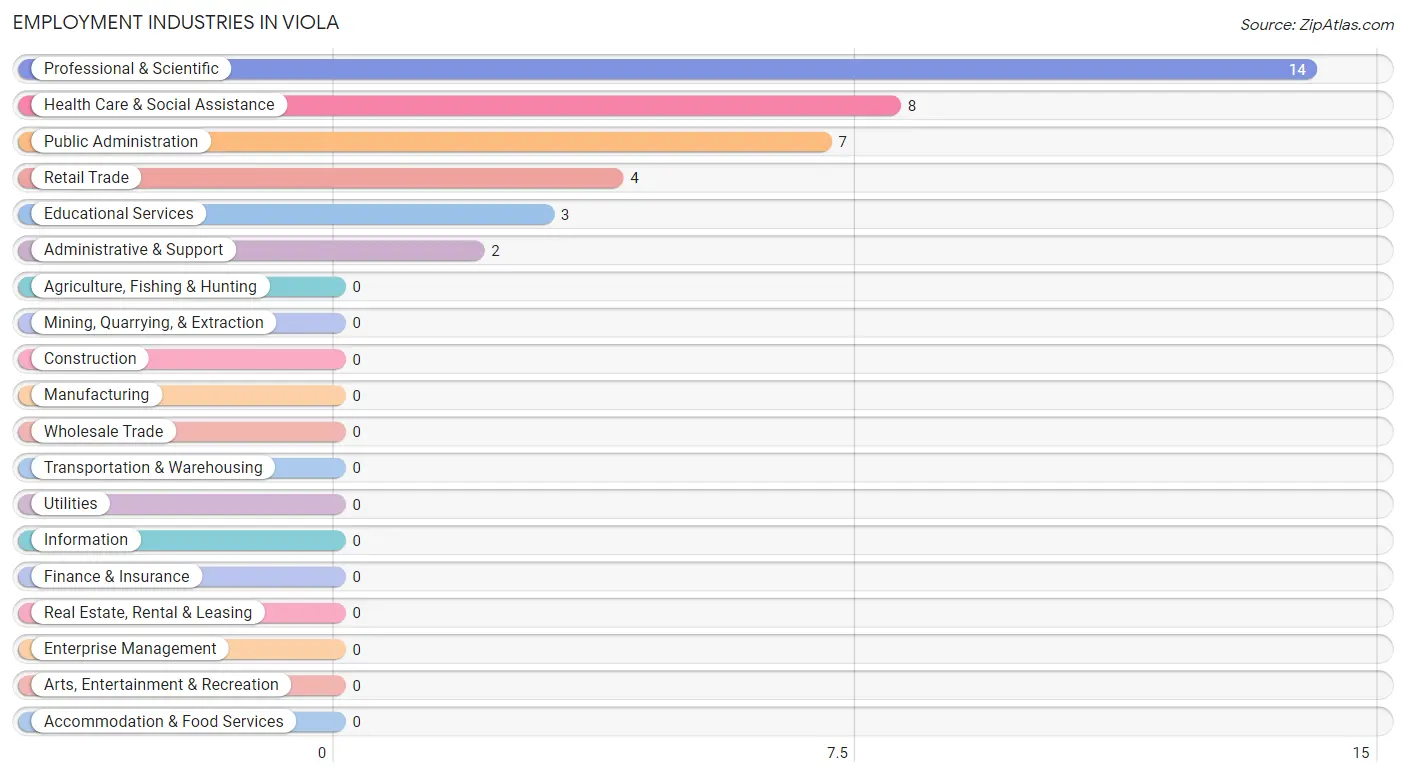
Employment Industries in Viola
The major employment industries in Viola include Professional & Scientific (14 | 34.2%), Health Care & Social Assistance (8 | 19.5%), Public Administration (7 | 17.1%), Retail Trade (4 | 9.8%), and Educational Services (3 | 7.3%).
Employment Industries by Sex in Viola
The Viola industries that see more men than women are Administrative & Support (100.0%), Public Administration (71.4%), and Retail Trade (50.0%), whereas the industries that tend to have a higher number of women are Health Care & Social Assistance (87.5%), Educational Services (66.7%), and Retail Trade (50.0%).
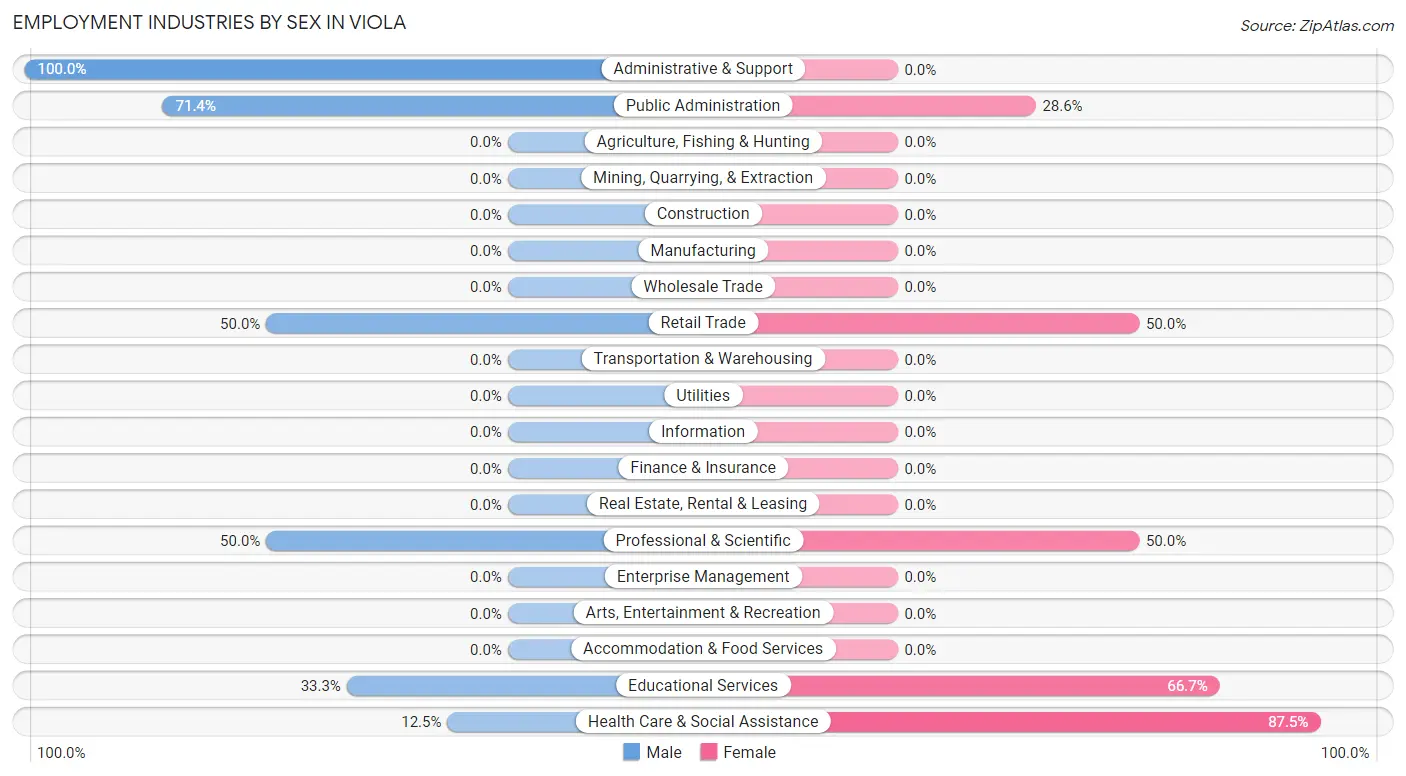
| Industry | Male | Female |
| Agriculture, Fishing & Hunting | 0 (0.0%) | 0 (0.0%) |
| Mining, Quarrying, & Extraction | 0 (0.0%) | 0 (0.0%) |
| Construction | 0 (0.0%) | 0 (0.0%) |
| Manufacturing | 0 (0.0%) | 0 (0.0%) |
| Wholesale Trade | 0 (0.0%) | 0 (0.0%) |
| Retail Trade | 2 (50.0%) | 2 (50.0%) |
| Transportation & Warehousing | 0 (0.0%) | 0 (0.0%) |
| Utilities | 0 (0.0%) | 0 (0.0%) |
| Information | 0 (0.0%) | 0 (0.0%) |
| Finance & Insurance | 0 (0.0%) | 0 (0.0%) |
| Real Estate, Rental & Leasing | 0 (0.0%) | 0 (0.0%) |
| Professional & Scientific | 7 (50.0%) | 7 (50.0%) |
| Enterprise Management | 0 (0.0%) | 0 (0.0%) |
| Administrative & Support | 2 (100.0%) | 0 (0.0%) |
| Educational Services | 1 (33.3%) | 2 (66.7%) |
| Health Care & Social Assistance | 1 (12.5%) | 7 (87.5%) |
| Arts, Entertainment & Recreation | 0 (0.0%) | 0 (0.0%) |
| Accommodation & Food Services | 0 (0.0%) | 0 (0.0%) |
| Public Administration | 5 (71.4%) | 2 (28.6%) |
| Total | 19 (46.3%) | 22 (53.7%) |
Education in Viola
School Enrollment in Viola
The most common levels of schooling among the 18 students in Viola are middle school (8 | 44.4%), high school (5 | 27.8%), and college / undergraduate (4 | 22.2%).
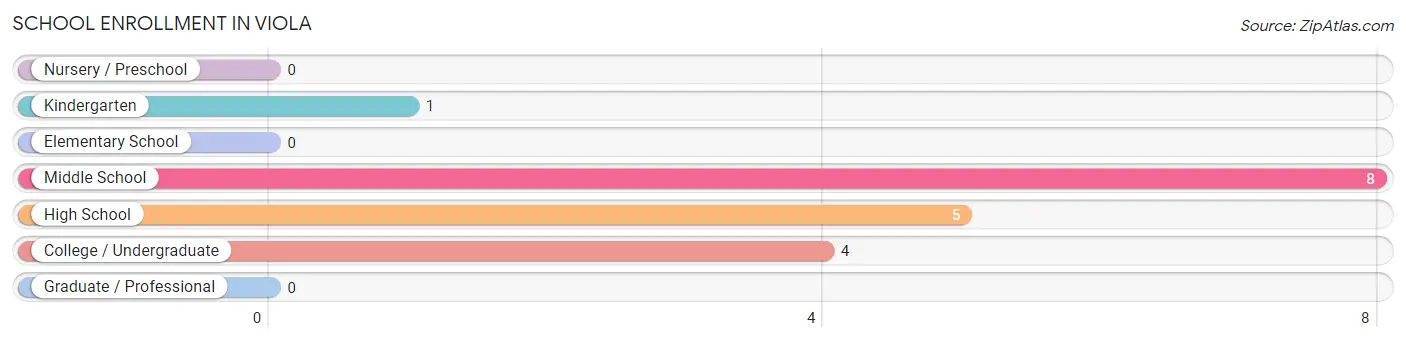
| School Level | # Students | % Students |
| Nursery / Preschool | 0 | 0.0% |
| Kindergarten | 1 | 5.6% |
| Elementary School | 0 | 0.0% |
| Middle School | 8 | 44.4% |
| High School | 5 | 27.8% |
| College / Undergraduate | 4 | 22.2% |
| Graduate / Professional | 0 | 0.0% |
| Total | 18 | 100.0% |
School Enrollment by Age by Funding Source in Viola
Out of a total of 18 students who are enrolled in schools in Viola, 5 (27.8%) attend a private institution, while the remaining 13 (72.2%) are enrolled in public schools. The age group of 35 years and over has the highest likelihood of being enrolled in private schools, with 2 (100.0% in the age bracket) enrolled. Conversely, the age group of 5 to 9 year old has the lowest likelihood of being enrolled in a private school, with 1 (100.0% in the age bracket) attending a public institution.
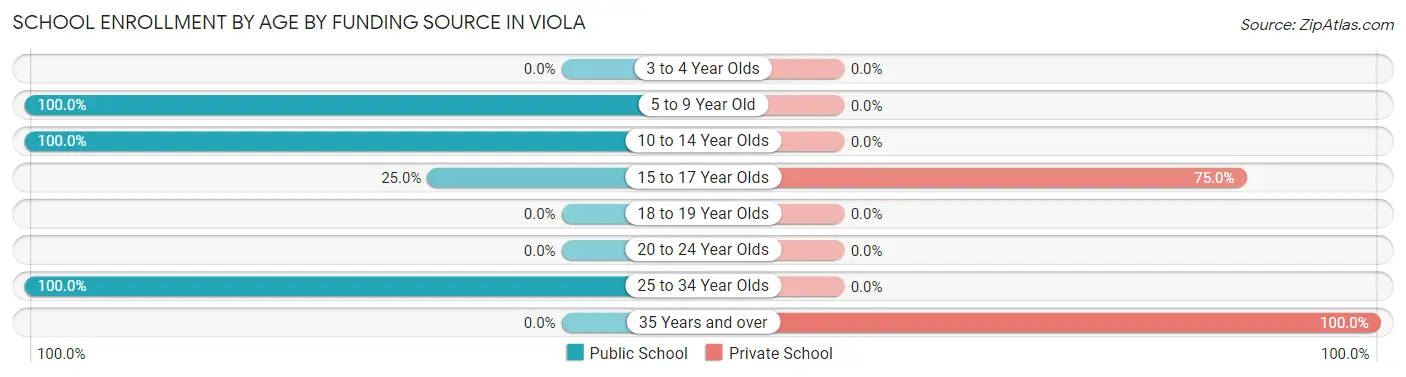
| Age Bracket | Public School | Private School |
| 3 to 4 Year Olds | 0 (0.0%) | 0 (0.0%) |
| 5 to 9 Year Old | 1 (100.0%) | 0 (0.0%) |
| 10 to 14 Year Olds | 9 (100.0%) | 0 (0.0%) |
| 15 to 17 Year Olds | 1 (25.0%) | 3 (75.0%) |
| 18 to 19 Year Olds | 0 (0.0%) | 0 (0.0%) |
| 20 to 24 Year Olds | 0 (0.0%) | 0 (0.0%) |
| 25 to 34 Year Olds | 2 (100.0%) | 0 (0.0%) |
| 35 Years and over | 0 (0.0%) | 2 (100.0%) |
| Total | 13 (72.2%) | 5 (27.8%) |
Educational Attainment by Field of Study in Viola
Computers & mathematics (5 | 29.4%), science & technology (5 | 29.4%), physical & health sciences (3 | 17.6%), education (2 | 11.8%), and bio, nature & agricultural (1 | 5.9%) are the most common fields of study among 17 individuals in Viola who have obtained a bachelor's degree or higher.
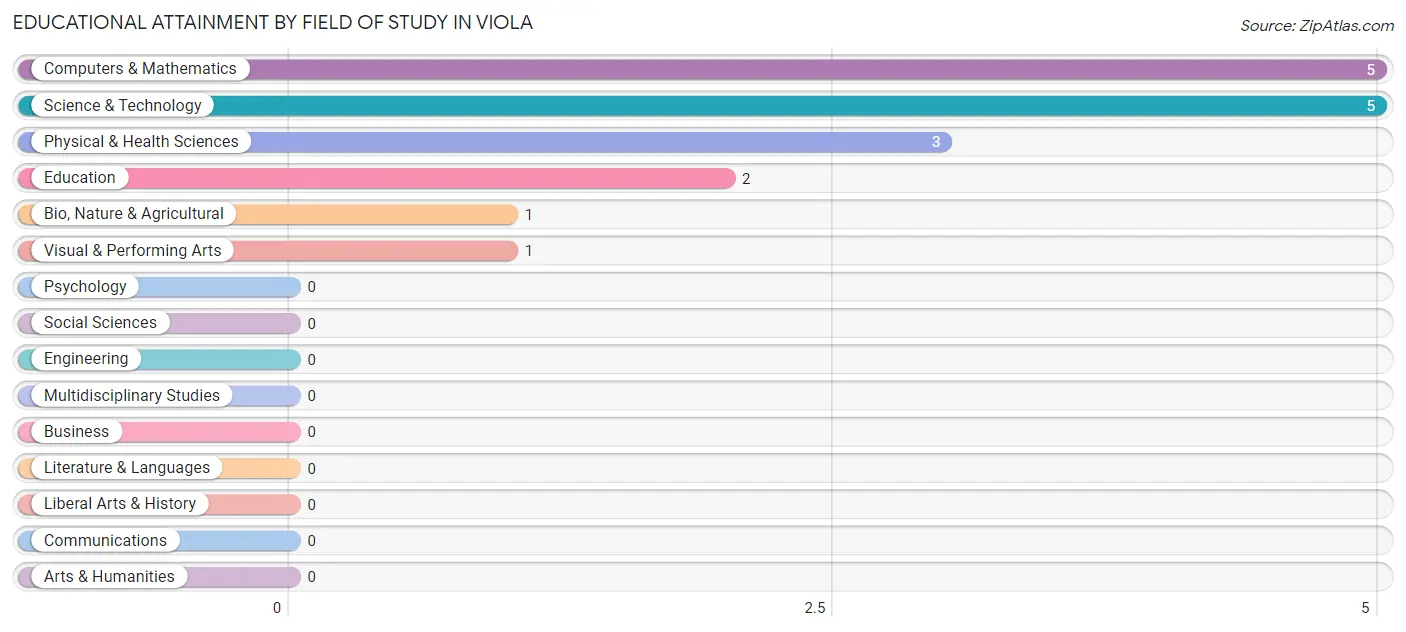
| Field of Study | # Graduates | % Graduates |
| Computers & Mathematics | 5 | 29.4% |
| Bio, Nature & Agricultural | 1 | 5.9% |
| Physical & Health Sciences | 3 | 17.6% |
| Psychology | 0 | 0.0% |
| Social Sciences | 0 | 0.0% |
| Engineering | 0 | 0.0% |
| Multidisciplinary Studies | 0 | 0.0% |
| Science & Technology | 5 | 29.4% |
| Business | 0 | 0.0% |
| Education | 2 | 11.8% |
| Literature & Languages | 0 | 0.0% |
| Liberal Arts & History | 0 | 0.0% |
| Visual & Performing Arts | 1 | 5.9% |
| Communications | 0 | 0.0% |
| Arts & Humanities | 0 | 0.0% |
| Total | 17 | 100.0% |
Transportation & Commute in Viola
Vehicle Availability by Sex in Viola
The most prevalent vehicle ownership categories in Viola are males with 2 vehicles (14, accounting for 73.7%) and females with 2 vehicles (12, making up 63.6%).
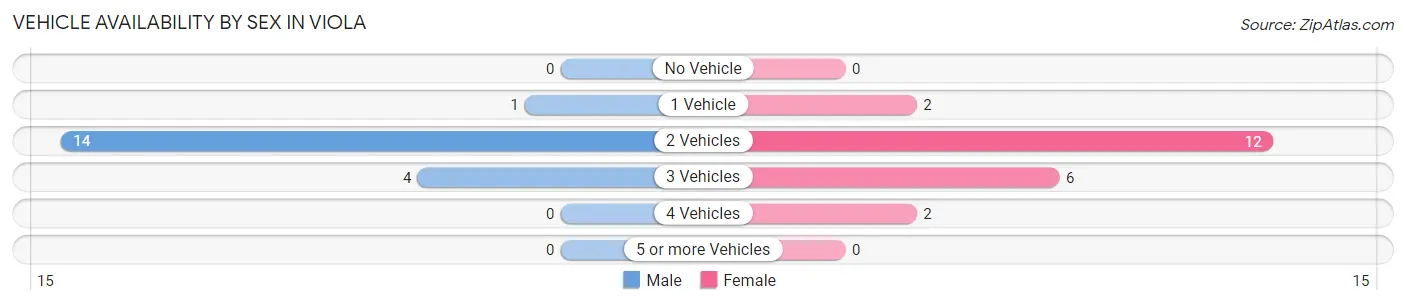
| Vehicles Available | Male | Female |
| No Vehicle | 0 (0.0%) | 0 (0.0%) |
| 1 Vehicle | 1 (5.3%) | 2 (9.1%) |
| 2 Vehicles | 14 (73.7%) | 12 (54.5%) |
| 3 Vehicles | 4 (21.0%) | 6 (27.3%) |
| 4 Vehicles | 0 (0.0%) | 2 (9.1%) |
| 5 or more Vehicles | 0 (0.0%) | 0 (0.0%) |
| Total | 19 (100.0%) | 22 (100.0%) |
Commute Time in Viola
The most frequently occuring commute durations in Viola are 15 to 19 minutes (12 commuters, 41.4%), 20 to 24 minutes (5 commuters, 17.2%), and 10 to 14 minutes (4 commuters, 13.8%).
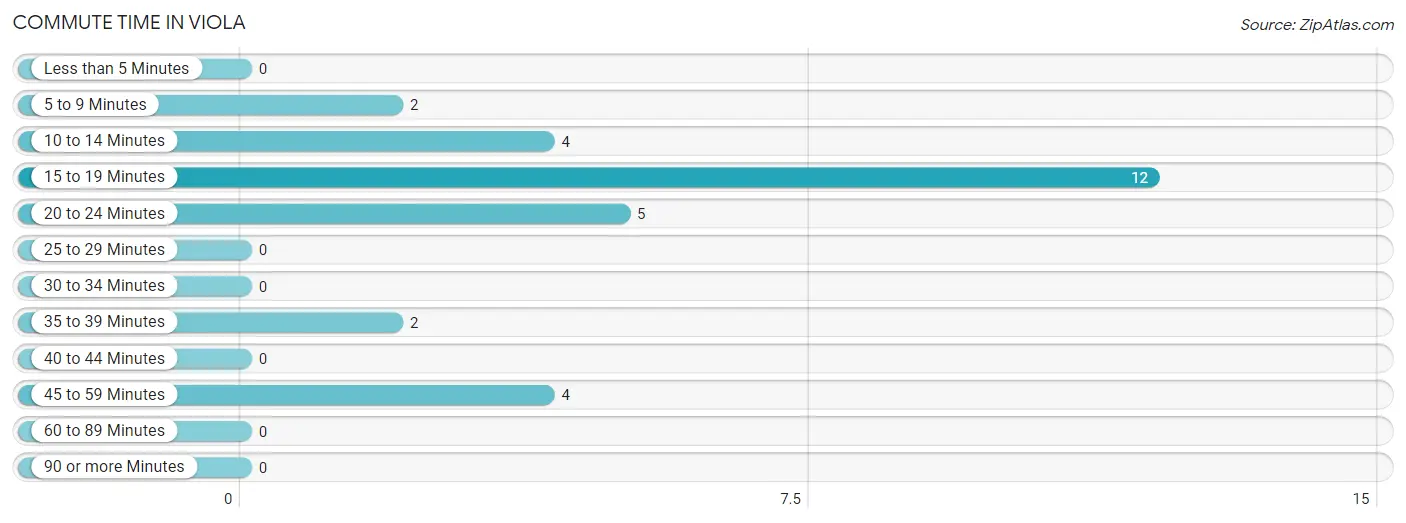
| Commute Time | # Commuters | % Commuters |
| Less than 5 Minutes | 0 | 0.0% |
| 5 to 9 Minutes | 2 | 6.9% |
| 10 to 14 Minutes | 4 | 13.8% |
| 15 to 19 Minutes | 12 | 41.4% |
| 20 to 24 Minutes | 5 | 17.2% |
| 25 to 29 Minutes | 0 | 0.0% |
| 30 to 34 Minutes | 0 | 0.0% |
| 35 to 39 Minutes | 2 | 6.9% |
| 40 to 44 Minutes | 0 | 0.0% |
| 45 to 59 Minutes | 4 | 13.8% |
| 60 to 89 Minutes | 0 | 0.0% |
| 90 or more Minutes | 0 | 0.0% |
Commute Time by Sex in Viola
The most common commute times in Viola are 15 to 19 minutes (4 commuters, 33.3%) for males and 15 to 19 minutes (8 commuters, 47.1%) for females.
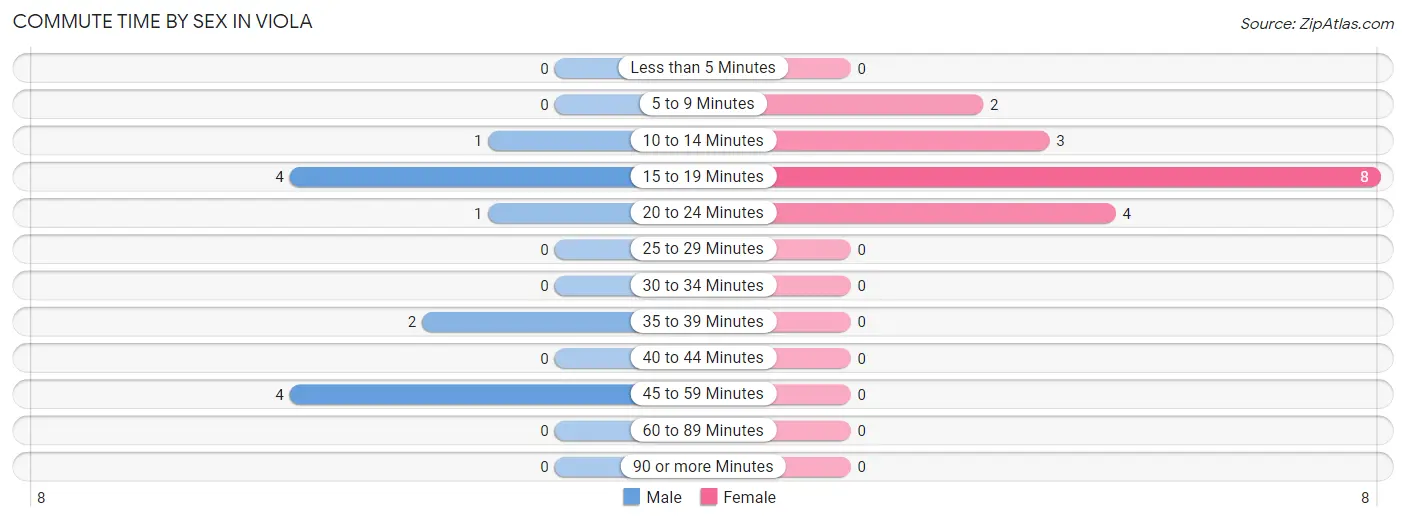
| Commute Time | Male | Female |
| Less than 5 Minutes | 0 (0.0%) | 0 (0.0%) |
| 5 to 9 Minutes | 0 (0.0%) | 2 (11.8%) |
| 10 to 14 Minutes | 1 (8.3%) | 3 (17.6%) |
| 15 to 19 Minutes | 4 (33.3%) | 8 (47.1%) |
| 20 to 24 Minutes | 1 (8.3%) | 4 (23.5%) |
| 25 to 29 Minutes | 0 (0.0%) | 0 (0.0%) |
| 30 to 34 Minutes | 0 (0.0%) | 0 (0.0%) |
| 35 to 39 Minutes | 2 (16.7%) | 0 (0.0%) |
| 40 to 44 Minutes | 0 (0.0%) | 0 (0.0%) |
| 45 to 59 Minutes | 4 (33.3%) | 0 (0.0%) |
| 60 to 89 Minutes | 0 (0.0%) | 0 (0.0%) |
| 90 or more Minutes | 0 (0.0%) | 0 (0.0%) |
Time of Departure to Work by Sex in Viola
The most frequent times of departure to work in Viola are 6:30 AM to 6:59 AM (5, 41.7%) for males and 6:30 AM to 6:59 AM (4, 23.5%) for females.
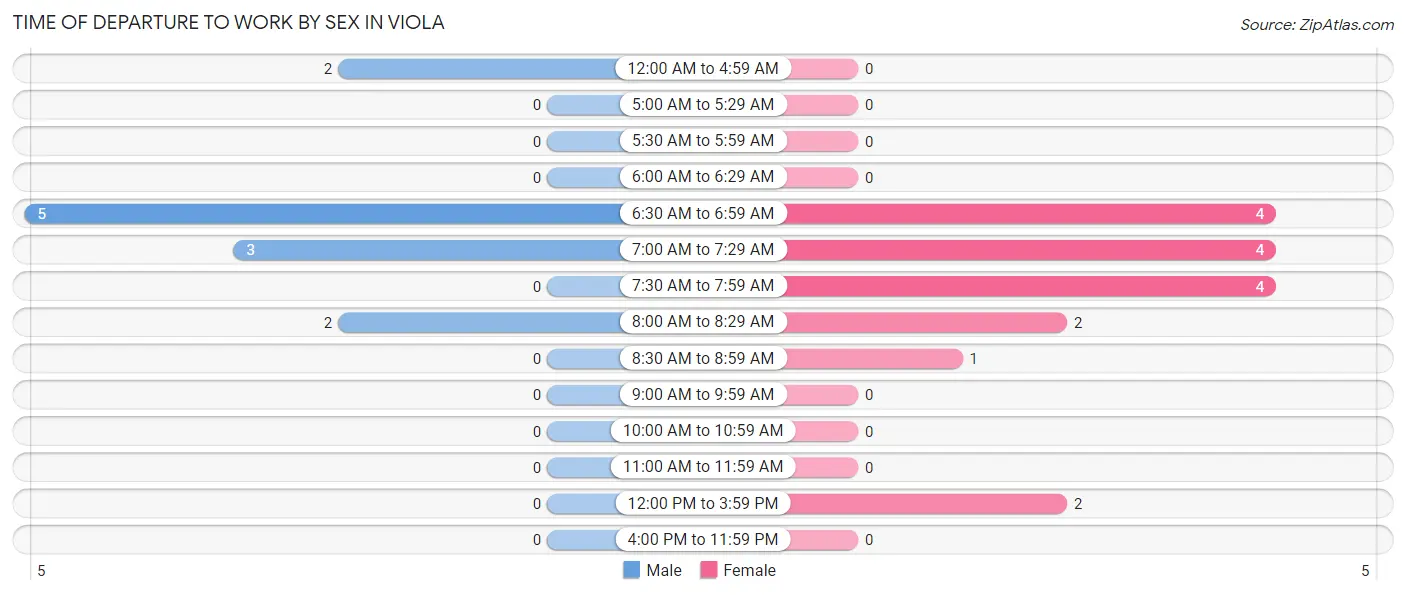
| Time of Departure | Male | Female |
| 12:00 AM to 4:59 AM | 2 (16.7%) | 0 (0.0%) |
| 5:00 AM to 5:29 AM | 0 (0.0%) | 0 (0.0%) |
| 5:30 AM to 5:59 AM | 0 (0.0%) | 0 (0.0%) |
| 6:00 AM to 6:29 AM | 0 (0.0%) | 0 (0.0%) |
| 6:30 AM to 6:59 AM | 5 (41.7%) | 4 (23.5%) |
| 7:00 AM to 7:29 AM | 3 (25.0%) | 4 (23.5%) |
| 7:30 AM to 7:59 AM | 0 (0.0%) | 4 (23.5%) |
| 8:00 AM to 8:29 AM | 2 (16.7%) | 2 (11.8%) |
| 8:30 AM to 8:59 AM | 0 (0.0%) | 1 (5.9%) |
| 9:00 AM to 9:59 AM | 0 (0.0%) | 0 (0.0%) |
| 10:00 AM to 10:59 AM | 0 (0.0%) | 0 (0.0%) |
| 11:00 AM to 11:59 AM | 0 (0.0%) | 0 (0.0%) |
| 12:00 PM to 3:59 PM | 0 (0.0%) | 2 (11.8%) |
| 4:00 PM to 11:59 PM | 0 (0.0%) | 0 (0.0%) |
| Total | 12 (100.0%) | 17 (100.0%) |
Housing Occupancy in Viola
Occupancy by Ownership in Viola
Of the total 31 dwellings in Viola, owner-occupied units account for 28 (90.3%), while renter-occupied units make up 3 (9.7%).
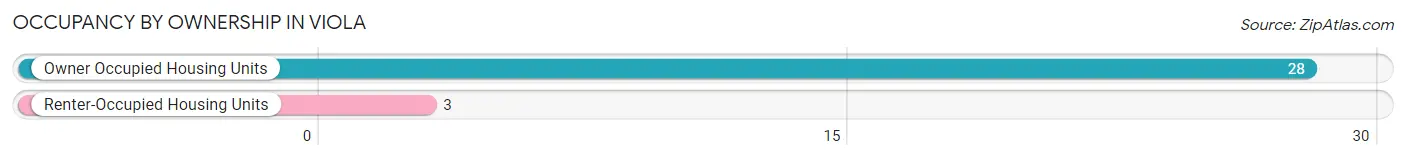
| Occupancy | # Housing Units | % Housing Units |
| Owner Occupied Housing Units | 28 | 90.3% |
| Renter-Occupied Housing Units | 3 | 9.7% |
| Total Occupied Housing Units | 31 | 100.0% |
Occupancy by Household Size in Viola
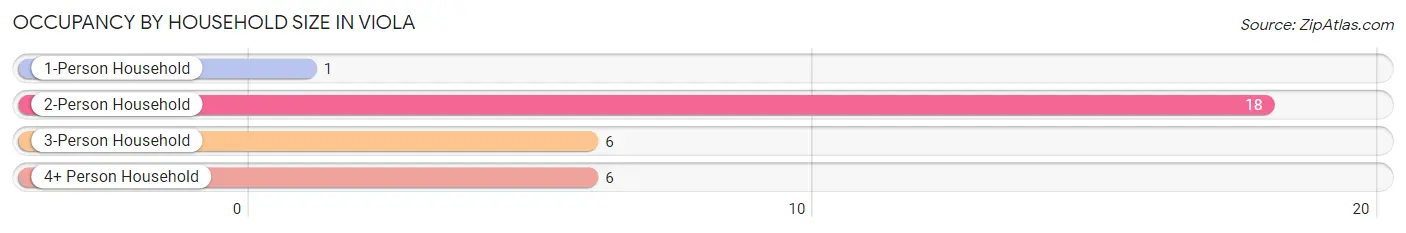
| Household Size | # Housing Units | % Housing Units |
| 1-Person Household | 1 | 3.2% |
| 2-Person Household | 18 | 58.1% |
| 3-Person Household | 6 | 19.4% |
| 4+ Person Household | 6 | 19.4% |
| Total Housing Units | 31 | 100.0% |
Occupancy by Ownership by Household Size in Viola
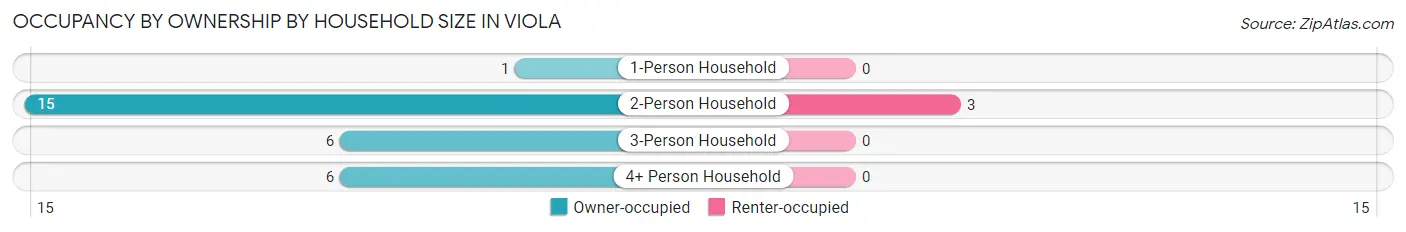
| Household Size | Owner-occupied | Renter-occupied |
| 1-Person Household | 1 (100.0%) | 0 (0.0%) |
| 2-Person Household | 15 (83.3%) | 3 (16.7%) |
| 3-Person Household | 6 (100.0%) | 0 (0.0%) |
| 4+ Person Household | 6 (100.0%) | 0 (0.0%) |
| Total Housing Units | 28 (90.3%) | 3 (9.7%) |
Occupancy by Educational Attainment in Viola
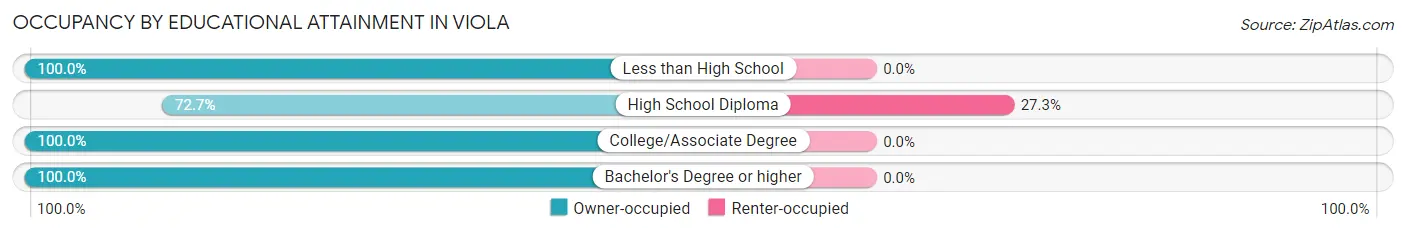
| Household Size | Owner-occupied | Renter-occupied |
| Less than High School | 4 (100.0%) | 0 (0.0%) |
| High School Diploma | 8 (72.7%) | 3 (27.3%) |
| College/Associate Degree | 11 (100.0%) | 0 (0.0%) |
| Bachelor's Degree or higher | 5 (100.0%) | 0 (0.0%) |
Occupancy by Age of Householder in Viola
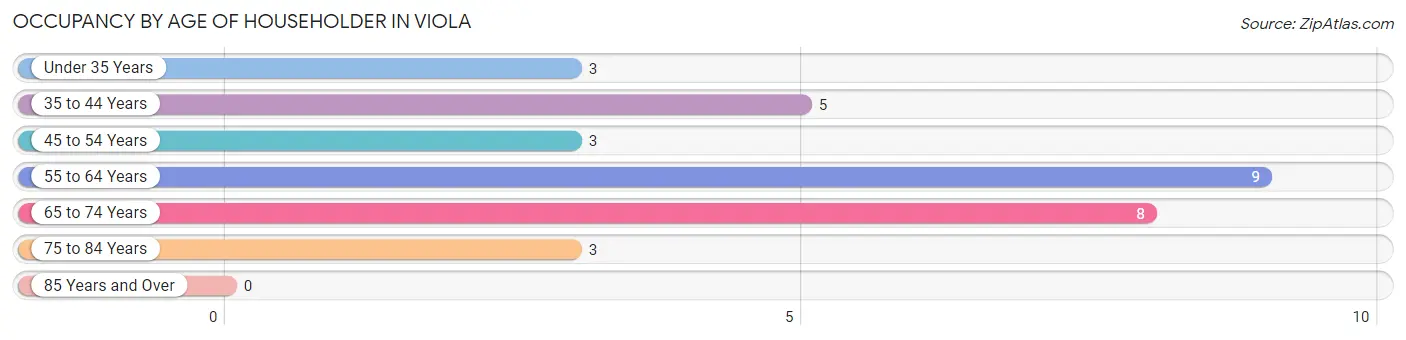
| Age Bracket | # Households | % Households |
| Under 35 Years | 3 | 9.7% |
| 35 to 44 Years | 5 | 16.1% |
| 45 to 54 Years | 3 | 9.7% |
| 55 to 64 Years | 9 | 29.0% |
| 65 to 74 Years | 8 | 25.8% |
| 75 to 84 Years | 3 | 9.7% |
| 85 Years and Over | 0 | 0.0% |
| Total | 31 | 100.0% |
Housing Finances in Viola
Median Income by Occupancy in Viola
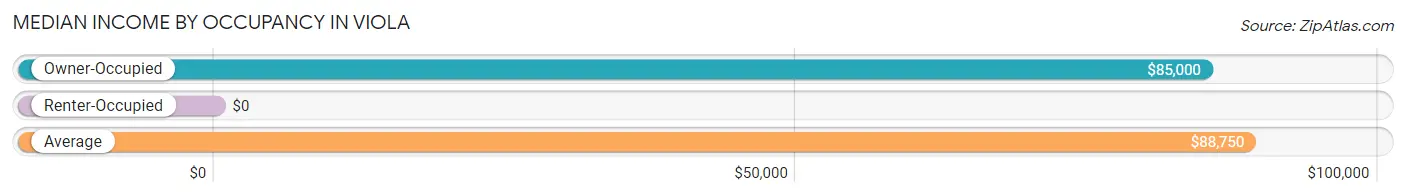
| Occupancy Type | # Households | Median Income |
| Owner-Occupied | 28 (90.3%) | $85,000 |
| Renter-Occupied | 3 (9.7%) | $0 |
| Average | 31 (100.0%) | $88,750 |
Occupancy by Householder Income Bracket in Viola
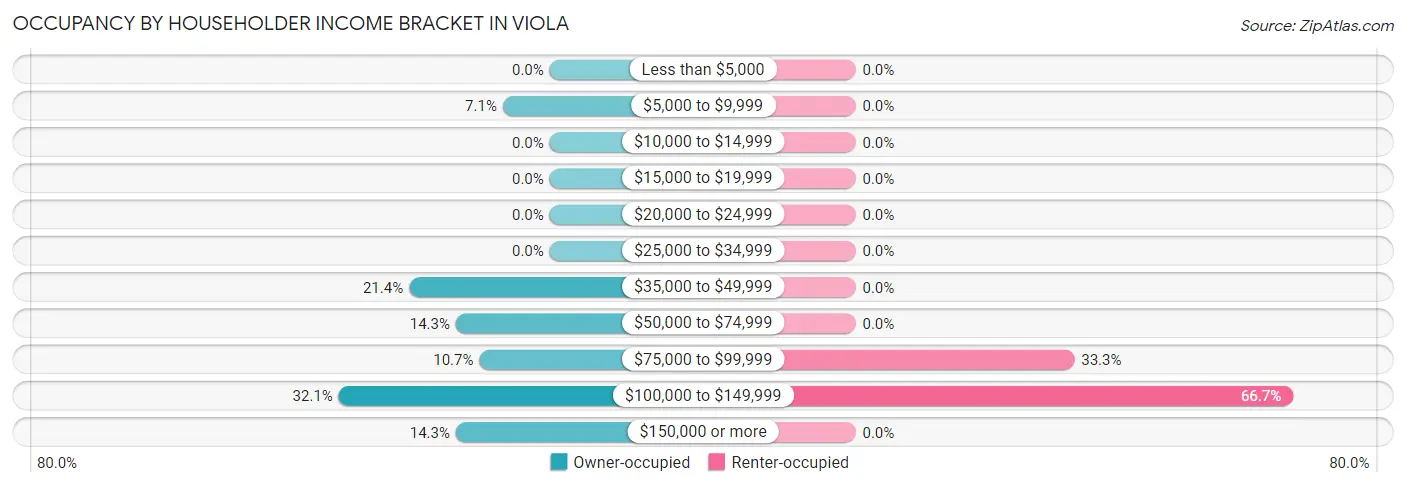
| Income Bracket | Owner-occupied | Renter-occupied |
| Less than $5,000 | 0 (0.0%) | 0 (0.0%) |
| $5,000 to $9,999 | 2 (7.1%) | 0 (0.0%) |
| $10,000 to $14,999 | 0 (0.0%) | 0 (0.0%) |
| $15,000 to $19,999 | 0 (0.0%) | 0 (0.0%) |
| $20,000 to $24,999 | 0 (0.0%) | 0 (0.0%) |
| $25,000 to $34,999 | 0 (0.0%) | 0 (0.0%) |
| $35,000 to $49,999 | 6 (21.4%) | 0 (0.0%) |
| $50,000 to $74,999 | 4 (14.3%) | 0 (0.0%) |
| $75,000 to $99,999 | 3 (10.7%) | 1 (33.3%) |
| $100,000 to $149,999 | 9 (32.1%) | 2 (66.7%) |
| $150,000 or more | 4 (14.3%) | 0 (0.0%) |
| Total | 28 (100.0%) | 3 (100.0%) |
Monthly Housing Cost Tiers in Viola
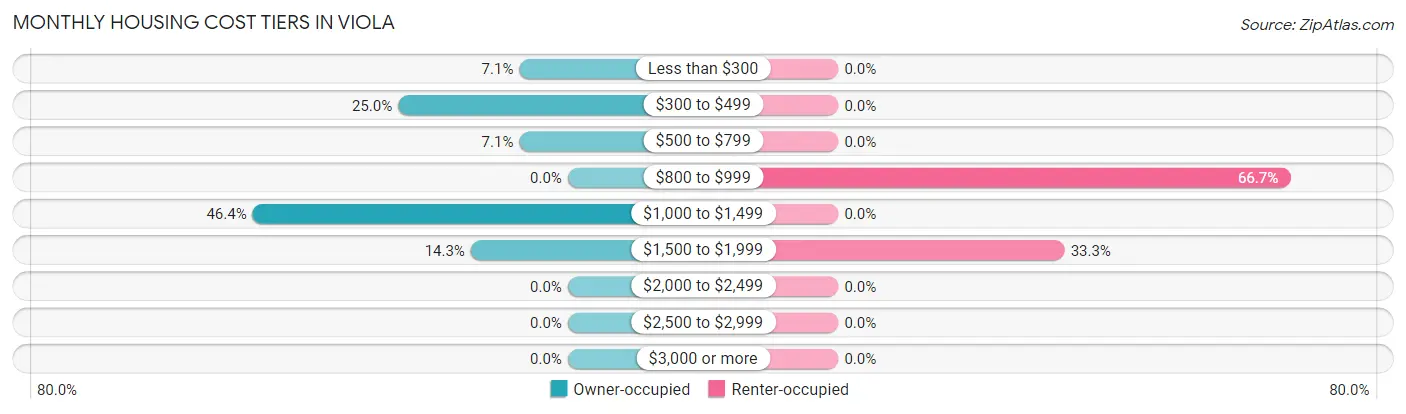
| Monthly Cost | Owner-occupied | Renter-occupied |
| Less than $300 | 2 (7.1%) | 0 (0.0%) |
| $300 to $499 | 7 (25.0%) | 0 (0.0%) |
| $500 to $799 | 2 (7.1%) | 0 (0.0%) |
| $800 to $999 | 0 (0.0%) | 2 (66.7%) |
| $1,000 to $1,499 | 13 (46.4%) | 0 (0.0%) |
| $1,500 to $1,999 | 4 (14.3%) | 1 (33.3%) |
| $2,000 to $2,499 | 0 (0.0%) | 0 (0.0%) |
| $2,500 to $2,999 | 0 (0.0%) | 0 (0.0%) |
| $3,000 or more | 0 (0.0%) | 0 (0.0%) |
| Total | 28 (100.0%) | 3 (100.0%) |
Physical Housing Characteristics in Viola
Housing Structures in Viola
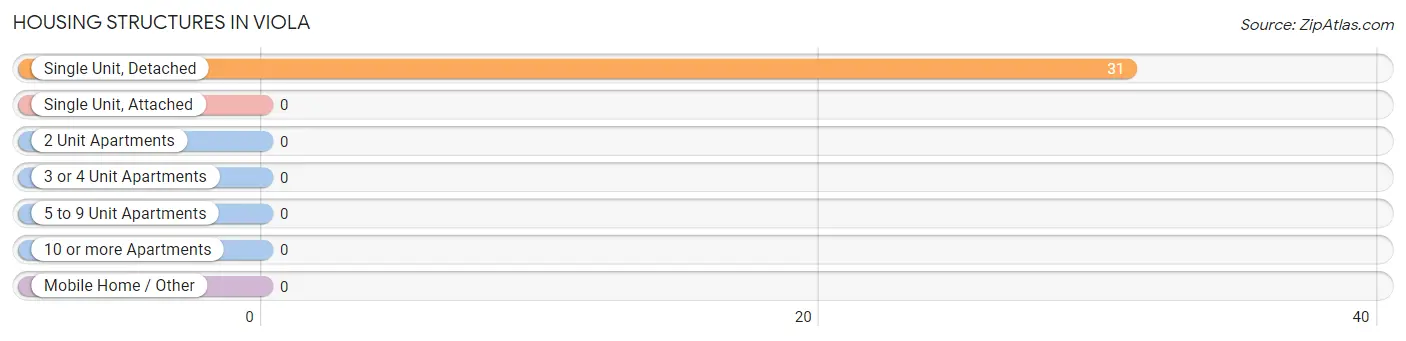
| Structure Type | # Housing Units | % Housing Units |
| Single Unit, Detached | 31 | 100.0% |
| Single Unit, Attached | 0 | 0.0% |
| 2 Unit Apartments | 0 | 0.0% |
| 3 or 4 Unit Apartments | 0 | 0.0% |
| 5 to 9 Unit Apartments | 0 | 0.0% |
| 10 or more Apartments | 0 | 0.0% |
| Mobile Home / Other | 0 | 0.0% |
| Total | 31 | 100.0% |
Housing Structures by Occupancy in Viola
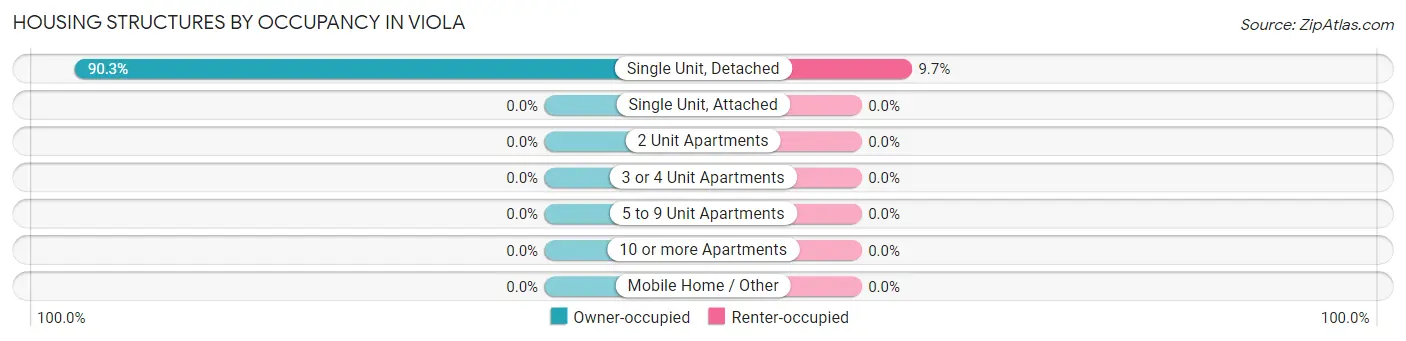
| Structure Type | Owner-occupied | Renter-occupied |
| Single Unit, Detached | 28 (90.3%) | 3 (9.7%) |
| Single Unit, Attached | 0 (0.0%) | 0 (0.0%) |
| 2 Unit Apartments | 0 (0.0%) | 0 (0.0%) |
| 3 or 4 Unit Apartments | 0 (0.0%) | 0 (0.0%) |
| 5 to 9 Unit Apartments | 0 (0.0%) | 0 (0.0%) |
| 10 or more Apartments | 0 (0.0%) | 0 (0.0%) |
| Mobile Home / Other | 0 (0.0%) | 0 (0.0%) |
| Total | 28 (90.3%) | 3 (9.7%) |
Housing Structures by Number of Rooms in Viola
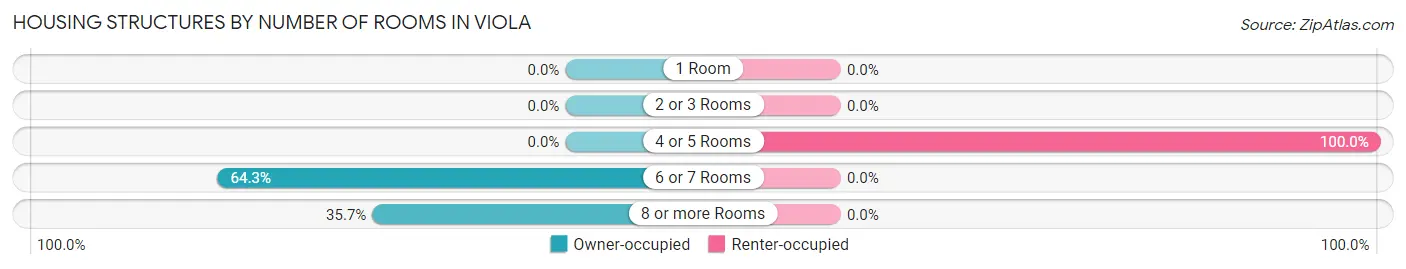
| Number of Rooms | Owner-occupied | Renter-occupied |
| 1 Room | 0 (0.0%) | 0 (0.0%) |
| 2 or 3 Rooms | 0 (0.0%) | 0 (0.0%) |
| 4 or 5 Rooms | 0 (0.0%) | 3 (100.0%) |
| 6 or 7 Rooms | 18 (64.3%) | 0 (0.0%) |
| 8 or more Rooms | 10 (35.7%) | 0 (0.0%) |
| Total | 28 (100.0%) | 3 (100.0%) |
Housing Structure by Heating Type in Viola
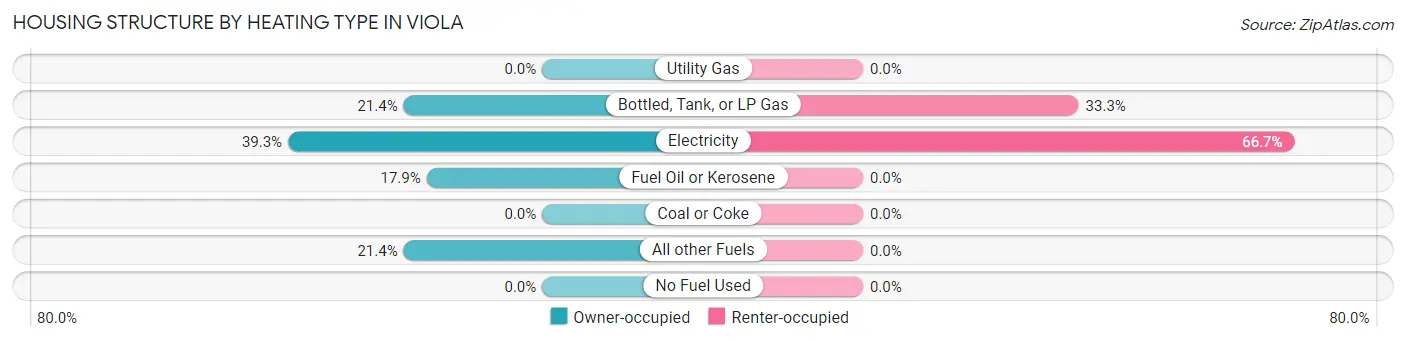
| Heating Type | Owner-occupied | Renter-occupied |
| Utility Gas | 0 (0.0%) | 0 (0.0%) |
| Bottled, Tank, or LP Gas | 6 (21.4%) | 1 (33.3%) |
| Electricity | 11 (39.3%) | 2 (66.7%) |
| Fuel Oil or Kerosene | 5 (17.9%) | 0 (0.0%) |
| Coal or Coke | 0 (0.0%) | 0 (0.0%) |
| All other Fuels | 6 (21.4%) | 0 (0.0%) |
| No Fuel Used | 0 (0.0%) | 0 (0.0%) |
| Total | 28 (100.0%) | 3 (100.0%) |
Household Vehicle Usage in Viola
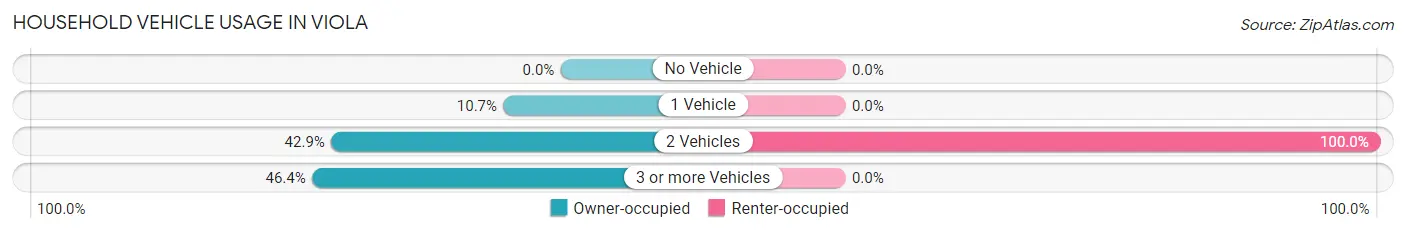
| Vehicles per Household | Owner-occupied | Renter-occupied |
| No Vehicle | 0 (0.0%) | 0 (0.0%) |
| 1 Vehicle | 3 (10.7%) | 0 (0.0%) |
| 2 Vehicles | 12 (42.9%) | 3 (100.0%) |
| 3 or more Vehicles | 13 (46.4%) | 0 (0.0%) |
| Total | 28 (100.0%) | 3 (100.0%) |
Real Estate & Mortgages in Viola
Real Estate and Mortgage Overview in Viola
| Characteristic | Without Mortgage | With Mortgage |
| Housing Units | 8 | 20 |
| Median Property Value | - | - |
| Median Household Income | - | - |
| Monthly Housing Costs | $433 | $0 |
| Real Estate Taxes | $1,125 | $1 |
Property Value by Mortgage Status in Viola
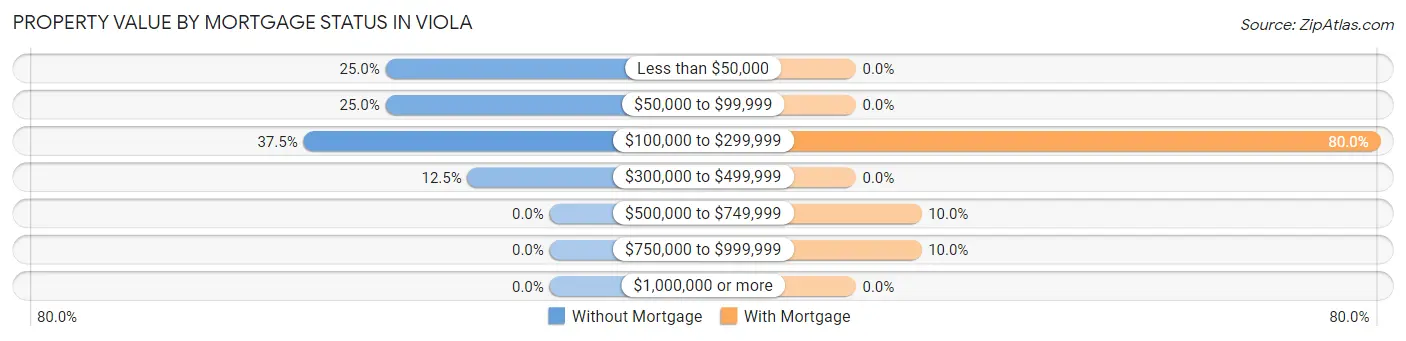
| Property Value | Without Mortgage | With Mortgage |
| Less than $50,000 | 2 (25.0%) | 0 (0.0%) |
| $50,000 to $99,999 | 2 (25.0%) | 0 (0.0%) |
| $100,000 to $299,999 | 3 (37.5%) | 16 (80.0%) |
| $300,000 to $499,999 | 1 (12.5%) | 0 (0.0%) |
| $500,000 to $749,999 | 0 (0.0%) | 2 (10.0%) |
| $750,000 to $999,999 | 0 (0.0%) | 2 (10.0%) |
| $1,000,000 or more | 0 (0.0%) | 0 (0.0%) |
| Total | 8 (100.0%) | 20 (100.0%) |
Household Income by Mortgage Status in Viola
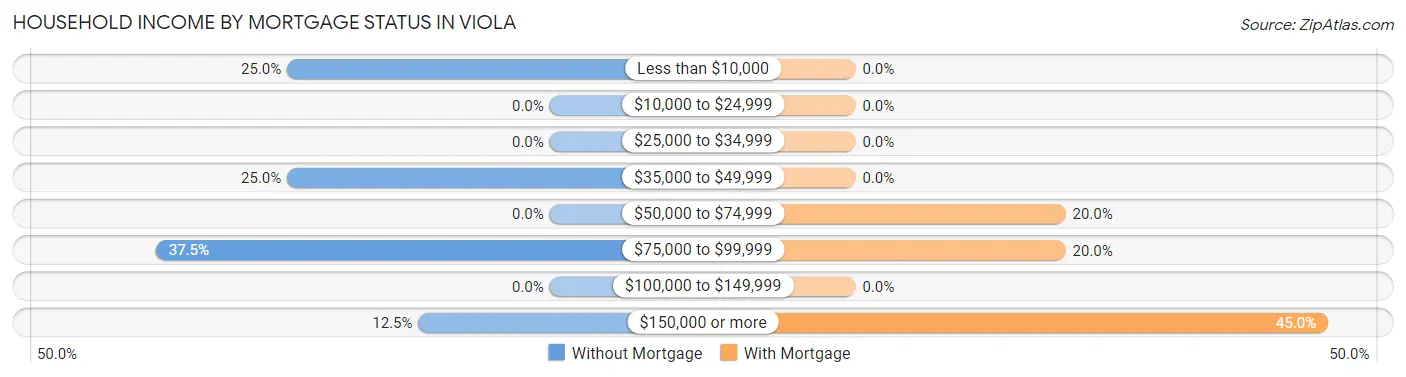
| Household Income | Without Mortgage | With Mortgage |
| Less than $10,000 | 2 (25.0%) | 0 (0.0%) |
| $10,000 to $24,999 | 0 (0.0%) | 0 (0.0%) |
| $25,000 to $34,999 | 0 (0.0%) | 0 (0.0%) |
| $35,000 to $49,999 | 2 (25.0%) | 0 (0.0%) |
| $50,000 to $74,999 | 0 (0.0%) | 4 (20.0%) |
| $75,000 to $99,999 | 3 (37.5%) | 4 (20.0%) |
| $100,000 to $149,999 | 0 (0.0%) | 0 (0.0%) |
| $150,000 or more | 1 (12.5%) | 9 (45.0%) |
| Total | 8 (100.0%) | 20 (100.0%) |
Property Value to Household Income Ratio in Viola
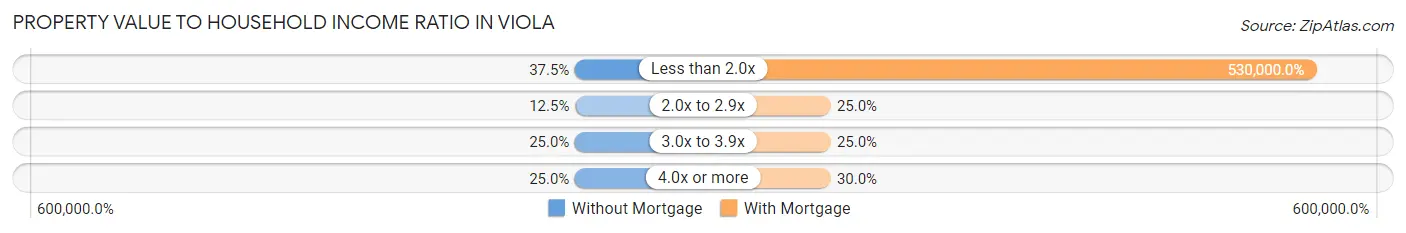
| Value-to-Income Ratio | Without Mortgage | With Mortgage |
| Less than 2.0x | 3 (37.5%) | 106,000 (530,000.0%) |
| 2.0x to 2.9x | 1 (12.5%) | 5 (25.0%) |
| 3.0x to 3.9x | 2 (25.0%) | 5 (25.0%) |
| 4.0x or more | 2 (25.0%) | 6 (30.0%) |
| Total | 8 (100.0%) | 20 (100.0%) |
Real Estate Taxes by Mortgage Status in Viola
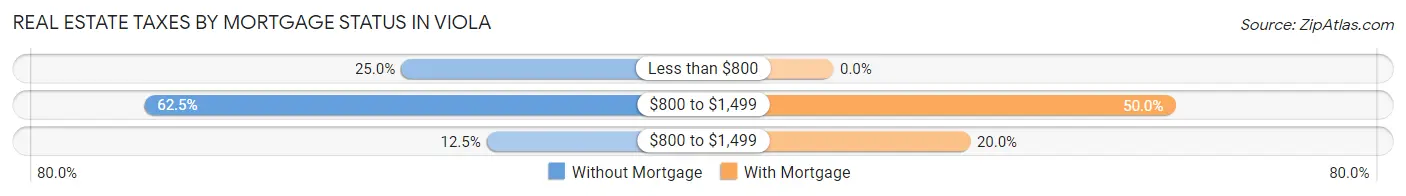
| Property Taxes | Without Mortgage | With Mortgage |
| Less than $800 | 2 (25.0%) | 0 (0.0%) |
| $800 to $1,499 | 5 (62.5%) | 10 (50.0%) |
| $800 to $1,499 | 1 (12.5%) | 4 (20.0%) |
| Total | 8 (100.0%) | 20 (100.0%) |
Health & Disability in Viola
Health Insurance Coverage by Age in Viola
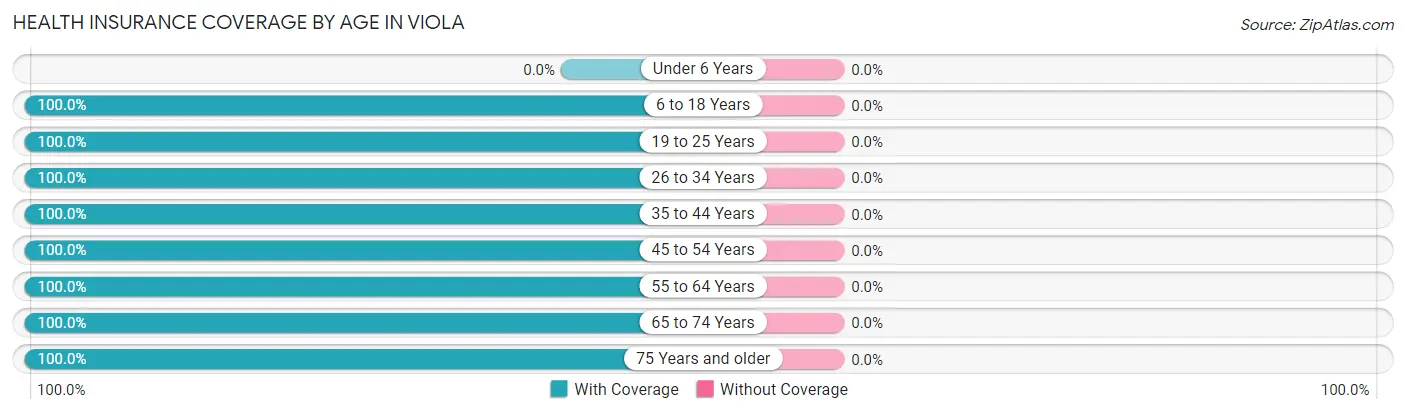
| Age Bracket | With Coverage | Without Coverage |
| Under 6 Years | 0 (0.0%) | 0 (0.0%) |
| 6 to 18 Years | 16 (100.0%) | 0 (0.0%) |
| 19 to 25 Years | 4 (100.0%) | 0 (0.0%) |
| 26 to 34 Years | 5 (100.0%) | 0 (0.0%) |
| 35 to 44 Years | 11 (100.0%) | 0 (0.0%) |
| 45 to 54 Years | 5 (100.0%) | 0 (0.0%) |
| 55 to 64 Years | 23 (100.0%) | 0 (0.0%) |
| 65 to 74 Years | 14 (100.0%) | 0 (0.0%) |
| 75 Years and older | 3 (100.0%) | 0 (0.0%) |
| Total | 81 (100.0%) | 0 (0.0%) |
Health Insurance Coverage by Citizenship Status in Viola
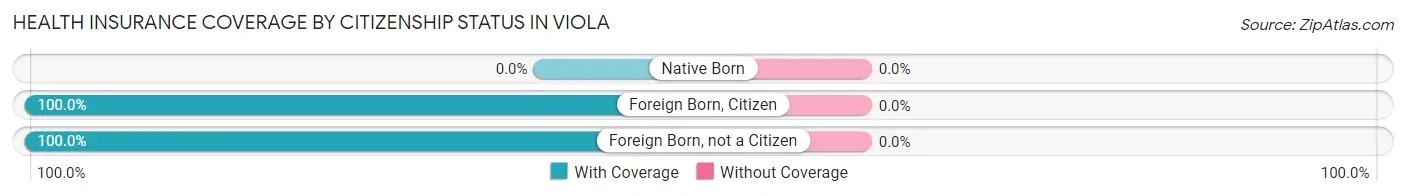
| Citizenship Status | With Coverage | Without Coverage |
| Native Born | 0 (0.0%) | 0 (0.0%) |
| Foreign Born, Citizen | 16 (100.0%) | 0 (0.0%) |
| Foreign Born, not a Citizen | 4 (100.0%) | 0 (0.0%) |
Health Insurance Coverage by Household Income in Viola
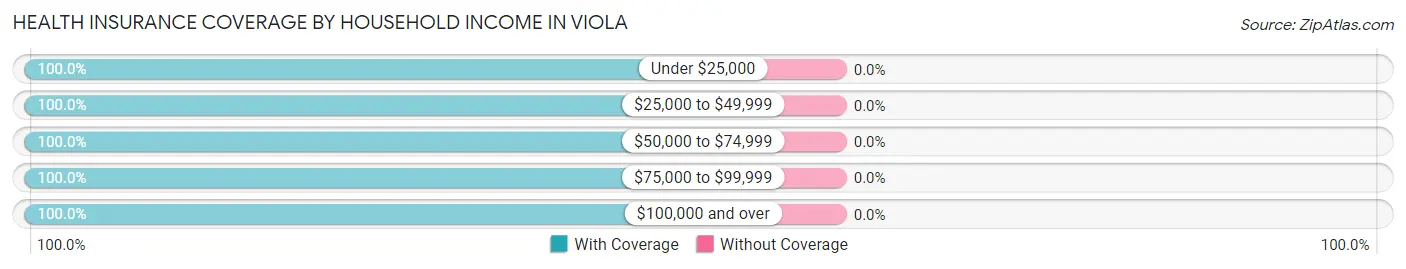
| Household Income | With Coverage | Without Coverage |
| Under $25,000 | 4 (100.0%) | 0 (0.0%) |
| $25,000 to $49,999 | 11 (100.0%) | 0 (0.0%) |
| $50,000 to $74,999 | 11 (100.0%) | 0 (0.0%) |
| $75,000 to $99,999 | 14 (100.0%) | 0 (0.0%) |
| $100,000 and over | 41 (100.0%) | 0 (0.0%) |
Public vs Private Health Insurance Coverage by Age in Viola
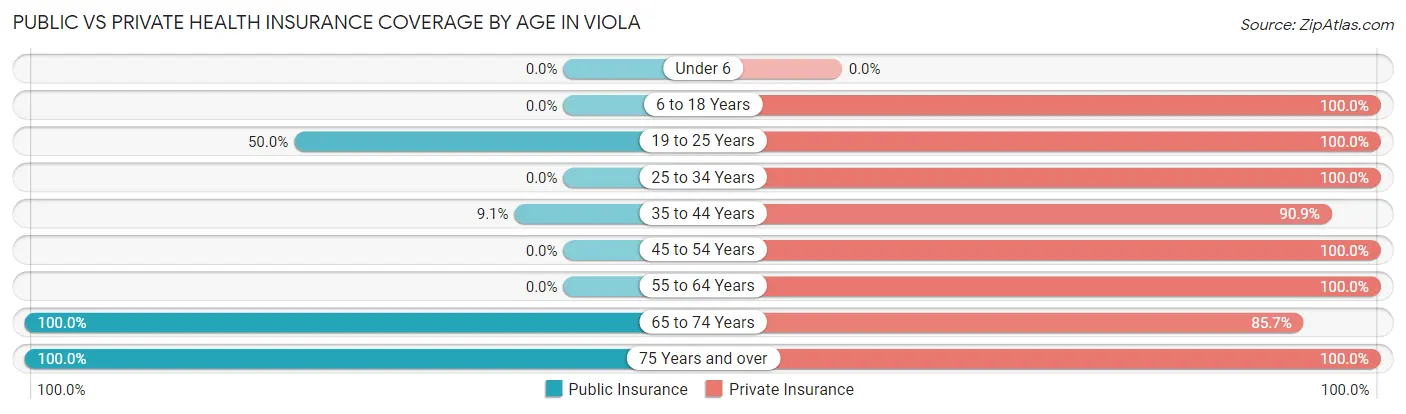
| Age Bracket | Public Insurance | Private Insurance |
| Under 6 | 0 (0.0%) | 0 (0.0%) |
| 6 to 18 Years | 0 (0.0%) | 16 (100.0%) |
| 19 to 25 Years | 2 (50.0%) | 4 (100.0%) |
| 25 to 34 Years | 0 (0.0%) | 5 (100.0%) |
| 35 to 44 Years | 1 (9.1%) | 10 (90.9%) |
| 45 to 54 Years | 0 (0.0%) | 5 (100.0%) |
| 55 to 64 Years | 0 (0.0%) | 23 (100.0%) |
| 65 to 74 Years | 14 (100.0%) | 12 (85.7%) |
| 75 Years and over | 3 (100.0%) | 3 (100.0%) |
| Total | 20 (24.7%) | 78 (96.3%) |
Disability Status by Sex by Age in Viola
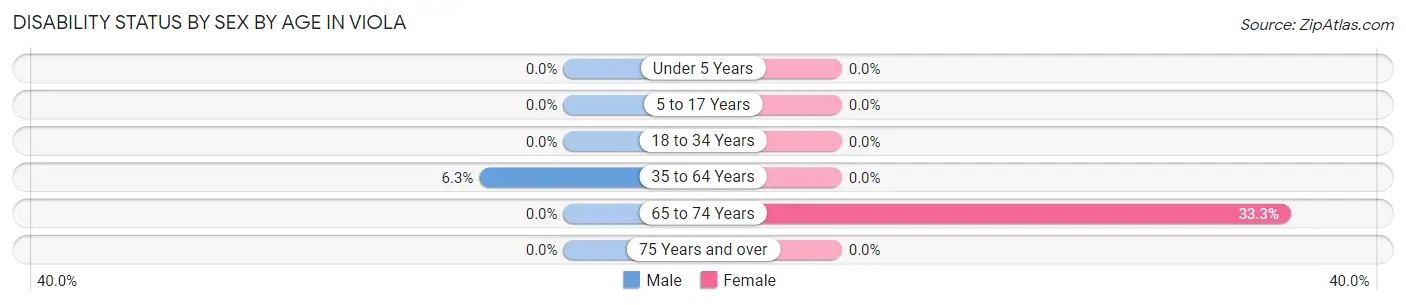
| Age Bracket | Male | Female |
| Under 5 Years | 0 (0.0%) | 0 (0.0%) |
| 5 to 17 Years | 0 (0.0%) | 0 (0.0%) |
| 18 to 34 Years | 0 (0.0%) | 0 (0.0%) |
| 35 to 64 Years | 1 (6.2%) | 0 (0.0%) |
| 65 to 74 Years | 0 (0.0%) | 1 (33.3%) |
| 75 Years and over | 0 (0.0%) | 0 (0.0%) |
Disability Class by Sex by Age in Viola
Disability Class: Hearing Difficulty
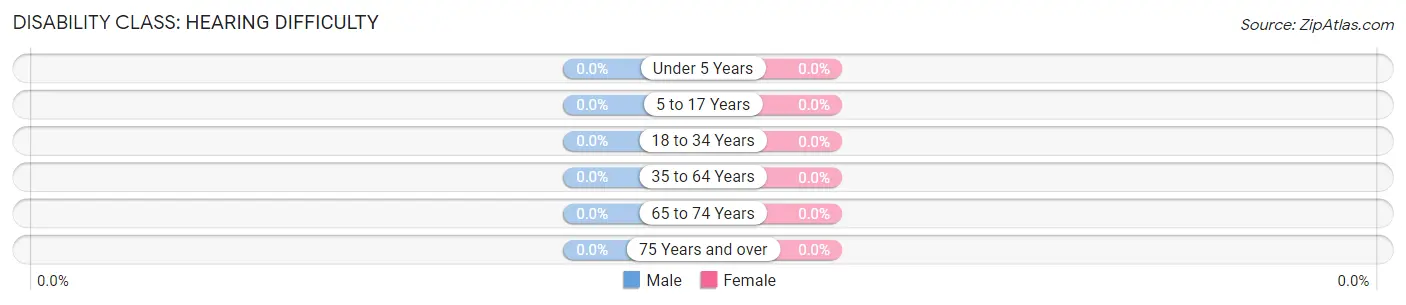
| Age Bracket | Male | Female |
| Under 5 Years | 0 (0.0%) | 0 (0.0%) |
| 5 to 17 Years | 0 (0.0%) | 0 (0.0%) |
| 18 to 34 Years | 0 (0.0%) | 0 (0.0%) |
| 35 to 64 Years | 0 (0.0%) | 0 (0.0%) |
| 65 to 74 Years | 0 (0.0%) | 0 (0.0%) |
| 75 Years and over | 0 (0.0%) | 0 (0.0%) |
Disability Class: Vision Difficulty
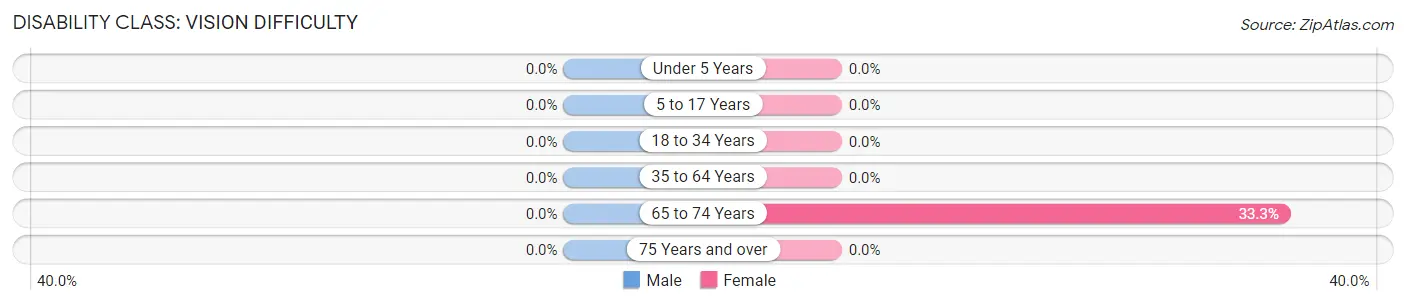
| Age Bracket | Male | Female |
| Under 5 Years | 0 (0.0%) | 0 (0.0%) |
| 5 to 17 Years | 0 (0.0%) | 0 (0.0%) |
| 18 to 34 Years | 0 (0.0%) | 0 (0.0%) |
| 35 to 64 Years | 0 (0.0%) | 0 (0.0%) |
| 65 to 74 Years | 0 (0.0%) | 1 (33.3%) |
| 75 Years and over | 0 (0.0%) | 0 (0.0%) |
Disability Class: Cognitive Difficulty
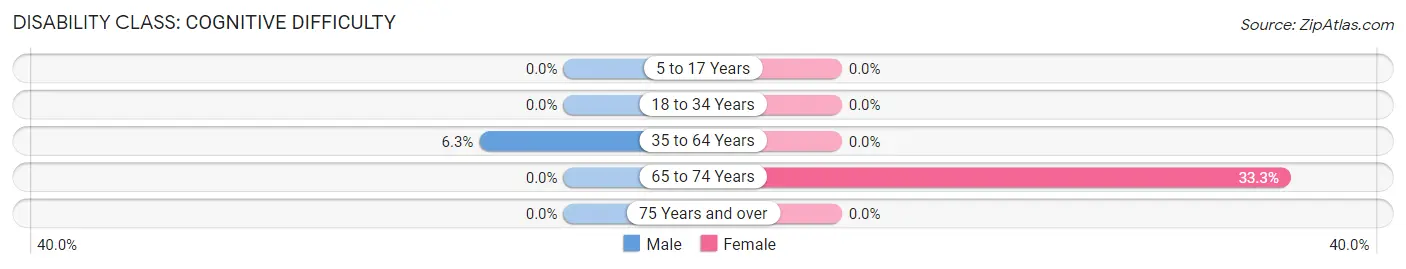
| Age Bracket | Male | Female |
| 5 to 17 Years | 0 (0.0%) | 0 (0.0%) |
| 18 to 34 Years | 0 (0.0%) | 0 (0.0%) |
| 35 to 64 Years | 1 (6.2%) | 0 (0.0%) |
| 65 to 74 Years | 0 (0.0%) | 1 (33.3%) |
| 75 Years and over | 0 (0.0%) | 0 (0.0%) |
Disability Class: Ambulatory Difficulty
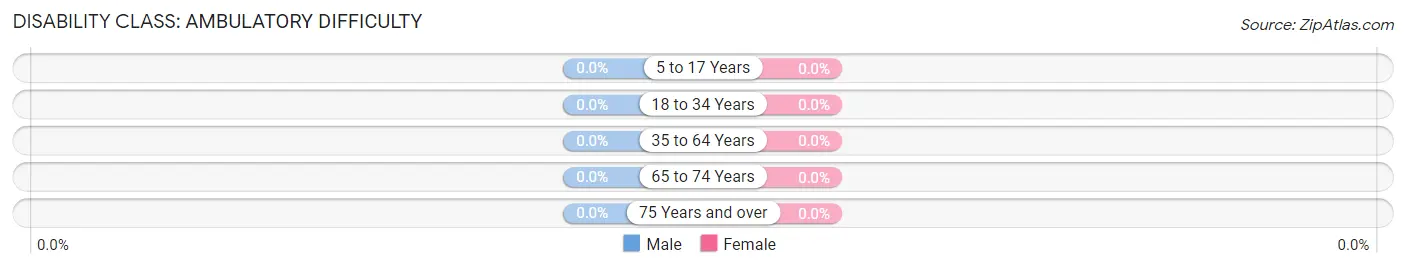
| Age Bracket | Male | Female |
| 5 to 17 Years | 0 (0.0%) | 0 (0.0%) |
| 18 to 34 Years | 0 (0.0%) | 0 (0.0%) |
| 35 to 64 Years | 0 (0.0%) | 0 (0.0%) |
| 65 to 74 Years | 0 (0.0%) | 0 (0.0%) |
| 75 Years and over | 0 (0.0%) | 0 (0.0%) |
Disability Class: Self-Care Difficulty
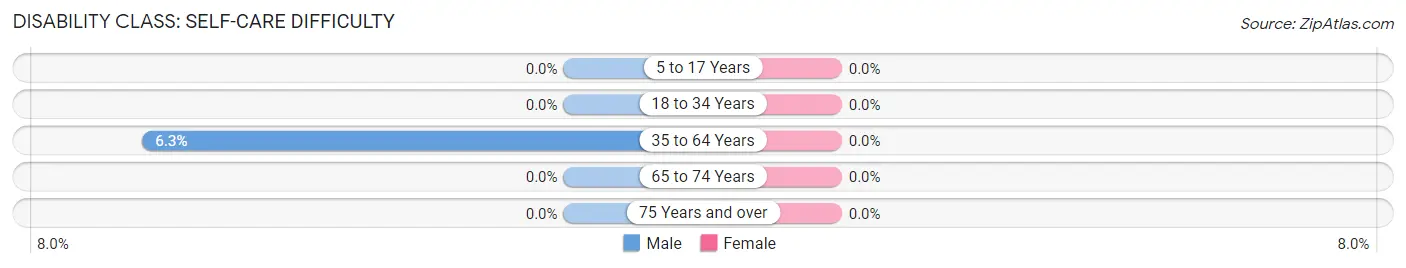
| Age Bracket | Male | Female |
| 5 to 17 Years | 0 (0.0%) | 0 (0.0%) |
| 18 to 34 Years | 0 (0.0%) | 0 (0.0%) |
| 35 to 64 Years | 1 (6.2%) | 0 (0.0%) |
| 65 to 74 Years | 0 (0.0%) | 0 (0.0%) |
| 75 Years and over | 0 (0.0%) | 0 (0.0%) |
Technology Access in Viola
Computing Device Access in Viola
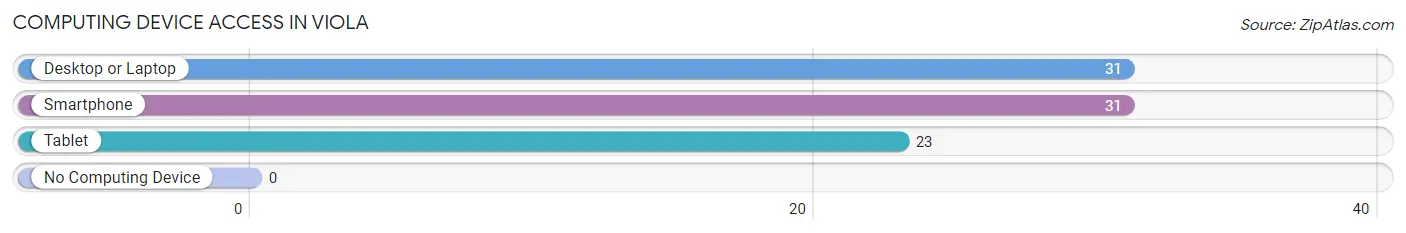
| Device Type | # Households | % Households |
| Desktop or Laptop | 31 | 100.0% |
| Smartphone | 31 | 100.0% |
| Tablet | 23 | 74.2% |
| No Computing Device | 0 | 0.0% |
| Total | 31 | 100.0% |
Internet Access in Viola
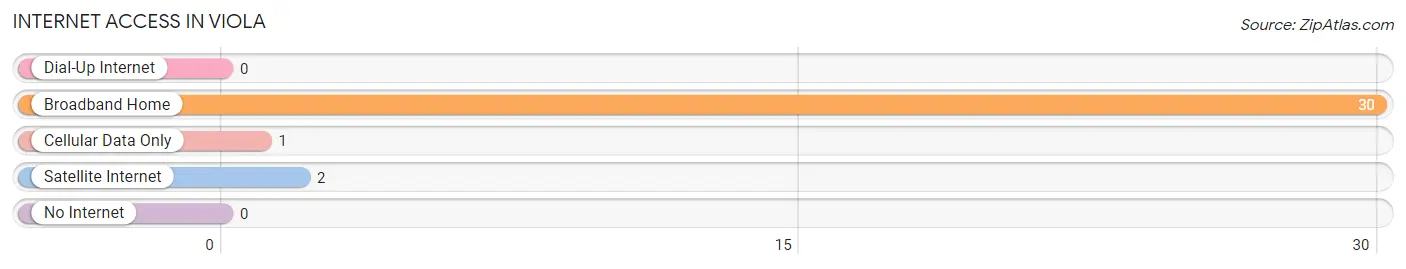
| Internet Type | # Households | % Households |
| Dial-Up Internet | 0 | 0.0% |
| Broadband Home | 30 | 96.8% |
| Cellular Data Only | 1 | 3.2% |
| Satellite Internet | 2 | 6.5% |
| No Internet | 0 | 0.0% |
| Total | 31 | 100.0% |
Viola Summary
DE History
The history of Delaware is a long and varied one, stretching back to the earliest days of the United States. The first European settlers in the area were Dutch, who established a trading post in 1631. The area was then claimed by the English in 1664, and the Dutch and English settlers coexisted peacefully until the American Revolution. During the Revolution, Delaware was a hotbed of activity, with many battles taking place in the state. After the war, Delaware became the first state to ratify the Constitution, and it has remained a part of the United States ever since.
The 19th century saw Delaware become an important industrial center, with the DuPont Company and other large corporations setting up shop in the state. The 20th century saw Delaware become a major financial center, with the establishment of the Delaware Trust Company and other financial institutions. The state also became a major tourist destination, with its beaches and other attractions drawing visitors from all over the world.
DE Geography
Delaware is located in the Mid-Atlantic region of the United States, bordered by Pennsylvania, Maryland, and the Atlantic Ocean. The state is divided into three counties: New Castle, Kent, and Sussex. The state is relatively small, with a total area of only 1,982 square miles. The state is mostly flat, with the highest point being Ebright Azimuth, which stands at 448 feet above sea level.
The climate of Delaware is generally mild, with hot summers and cold winters. The state receives an average of 43 inches of precipitation per year, with most of it falling in the form of rain. The state is also home to a variety of wildlife, including white-tailed deer, black bears, and bald eagles.
DE Economy
The economy of Delaware is largely based on services, with the state being home to a number of large financial institutions, such as the Delaware Trust Company and the Wilmington Trust Company. The state is also home to a number of large corporations, such as DuPont, AstraZeneca, and W.L. Gore & Associates. The state is also home to a number of smaller businesses, such as craft breweries and wineries.
The state’s economy is also supported by its tourism industry, with its beaches and other attractions drawing visitors from all over the world. The state is also home to a number of casinos, which generate a significant amount of revenue for the state.
DE Demographics
As of 2019, the population of Delaware was 973,764, making it the 45th most populous state in the United States. The state is home to a diverse population, with the largest ethnic groups being White (63.2%), Black or African American (22.2%), and Hispanic or Latino (9.2%). The state is also home to a large number of immigrants, with the largest groups being from India, China, and Mexico.
The median household income in Delaware is $63,824, and the median home value is $239,400. The state has a relatively low unemployment rate of 3.7%, and the poverty rate is 11.2%. The state also has a high rate of educational attainment, with 91.2% of adults having at least a high school diploma and 37.2% having a bachelor’s degree or higher.
Common Questions
What is Per Capita Income in Viola?
Per Capita income in Viola is $43,865.
What is the Median Family Income in Viola?
Median Family Income in Viola is $81,250.
What is the Median Household income in Viola?
Median Household Income in Viola is $88,750.
What is Income or Wage Gap in Viola?
Income or Wage Gap in Viola is 48.6%.
Women in Viola earn 51.4 cents for every dollar earned by a man.
What is Inequality or Gini Index in Viola?
Inequality or Gini Index in Viola is 0.36.
What is the Total Population of Viola?
Total Population of Viola is 81.
What is the Total Male Population of Viola?
Total Male Population of Viola is 37.
What is the Total Female Population of Viola?
Total Female Population of Viola is 44.
What is the Ratio of Males per 100 Females in Viola?
There are 84.09 Males per 100 Females in Viola.
What is the Ratio of Females per 100 Males in Viola?
There are 118.92 Females per 100 Males in Viola.
What is the Median Population Age in Viola?
Median Population Age in Viola is 54.5 Years.
What is the Average Family Size in Viola
Average Family Size in Viola is 2.6 People.
What is the Average Household Size in Viola
Average Household Size in Viola is 2.6 People.
How Large is the Labor Force in Viola?
There are 45 People in the Labor Forcein in Viola.
What is the Percentage of People in the Labor Force in Viola?
68.2% of People are in the Labor Force in Viola.
What is the Unemployment Rate in Viola?
Unemployment Rate in Viola is 8.9%.