Leipsic, DE Map & Demographics
Leipsic Map
Leipsic Overview
$28,375
PER CAPITA INCOME
$48,500
AVG FAMILY INCOME
$46,250
AVG HOUSEHOLD INCOME
0.40
INEQUALITY / GINI INDEX
171
TOTAL POPULATION
89
MALE POPULATION
82
FEMALE POPULATION
108.54
MALES / 100 FEMALES
92.13
FEMALES / 100 MALES
48.2
MEDIAN AGE
3.2
AVG FAMILY SIZE
2.2
AVG HOUSEHOLD SIZE
96
LABOR FORCE [ PEOPLE ]
70.6%
PERCENT IN LABOR FORCE
7.3%
UNEMPLOYMENT RATE
Leipsic Area Codes
Income in Leipsic
Income Overview in Leipsic
Per Capita Income in Leipsic is $28,375, while median incomes of families and households are $48,500 and $46,250 respectively.
| Characteristic | Number | Measure |
| Per Capita Income | 171 | $28,375 |
| Median Family Income | 38 | $48,500 |
| Mean Family Income | 38 | $75,782 |
| Median Household Income | 79 | $46,250 |
| Mean Household Income | 79 | $61,313 |
| Income Deficit | 38 | $0 |
| Wage / Income Gap (%) | 171 | 0.00% |
| Wage / Income Gap ($) | 171 | 100.00¢ per $1 |
| Gini / Inequality Index | 171 | 0.40 |
Earnings by Sex in Leipsic
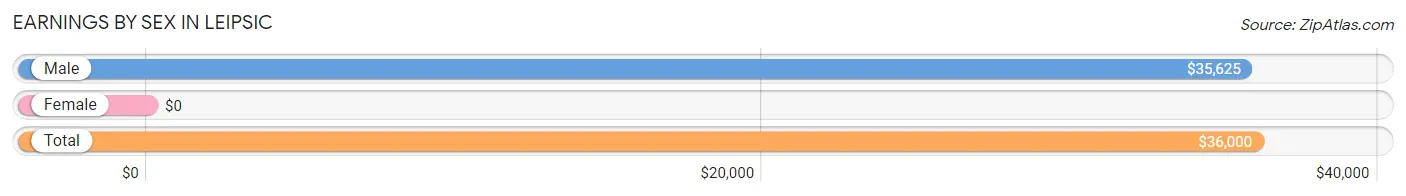
| Sex | Number | Average Earnings |
| Male | 66 (66.0%) | $35,625 |
| Female | 34 (34.0%) | $0 |
| Total | 100 (100.0%) | $36,000 |
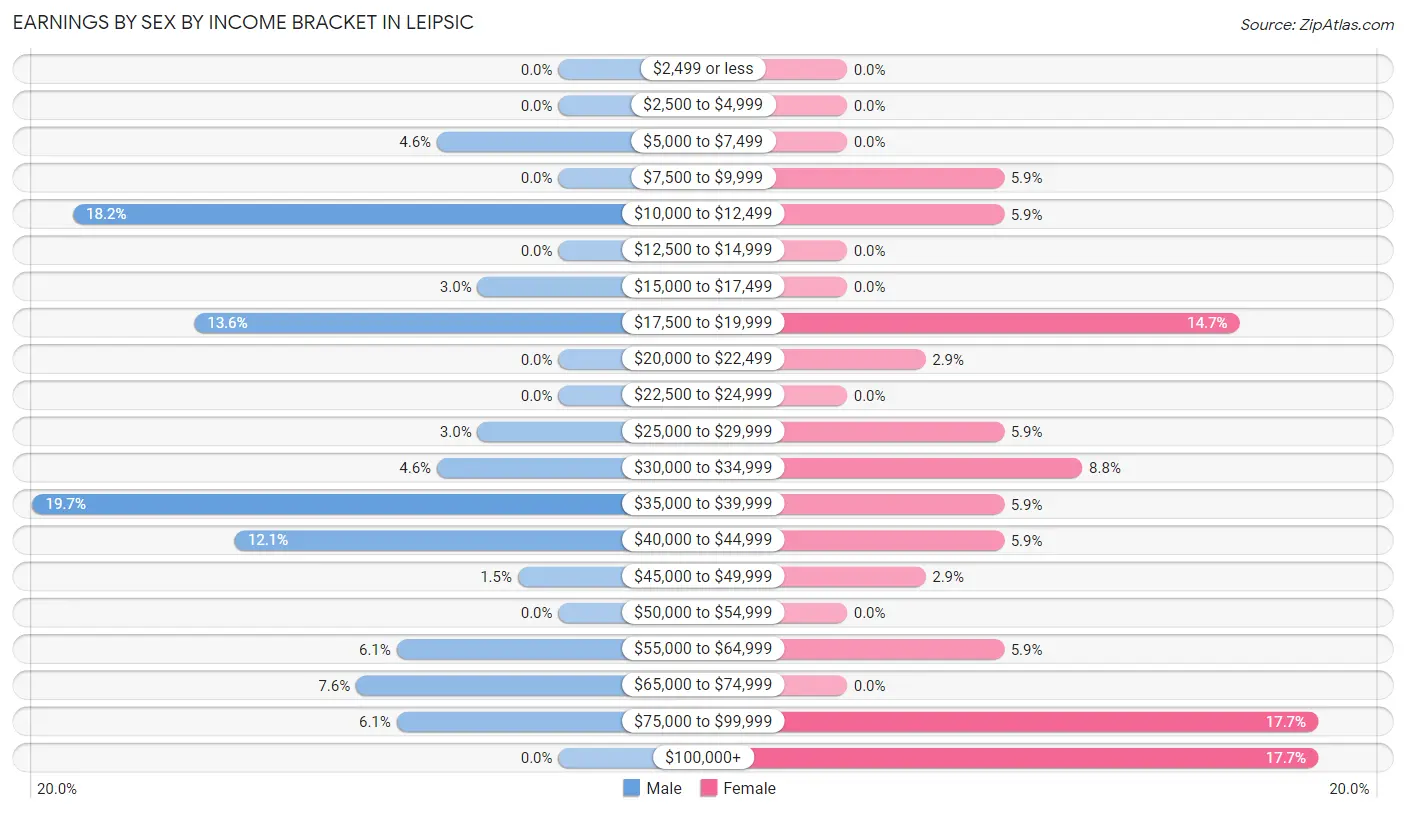
Earnings by Sex by Income Bracket in Leipsic
The most common earnings brackets in Leipsic are $35,000 to $39,999 for men (13 | 19.7%) and $75,000 to $99,999 for women (6 | 17.6%).
| Income | Male | Female |
| $2,499 or less | 0 (0.0%) | 0 (0.0%) |
| $2,500 to $4,999 | 0 (0.0%) | 0 (0.0%) |
| $5,000 to $7,499 | 3 (4.5%) | 0 (0.0%) |
| $7,500 to $9,999 | 0 (0.0%) | 2 (5.9%) |
| $10,000 to $12,499 | 12 (18.2%) | 2 (5.9%) |
| $12,500 to $14,999 | 0 (0.0%) | 0 (0.0%) |
| $15,000 to $17,499 | 2 (3.0%) | 0 (0.0%) |
| $17,500 to $19,999 | 9 (13.6%) | 5 (14.7%) |
| $20,000 to $22,499 | 0 (0.0%) | 1 (2.9%) |
| $22,500 to $24,999 | 0 (0.0%) | 0 (0.0%) |
| $25,000 to $29,999 | 2 (3.0%) | 2 (5.9%) |
| $30,000 to $34,999 | 3 (4.5%) | 3 (8.8%) |
| $35,000 to $39,999 | 13 (19.7%) | 2 (5.9%) |
| $40,000 to $44,999 | 8 (12.1%) | 2 (5.9%) |
| $45,000 to $49,999 | 1 (1.5%) | 1 (2.9%) |
| $50,000 to $54,999 | 0 (0.0%) | 0 (0.0%) |
| $55,000 to $64,999 | 4 (6.1%) | 2 (5.9%) |
| $65,000 to $74,999 | 5 (7.6%) | 0 (0.0%) |
| $75,000 to $99,999 | 4 (6.1%) | 6 (17.6%) |
| $100,000+ | 0 (0.0%) | 6 (17.6%) |
| Total | 66 (100.0%) | 34 (100.0%) |
Earnings by Sex by Educational Attainment in Leipsic
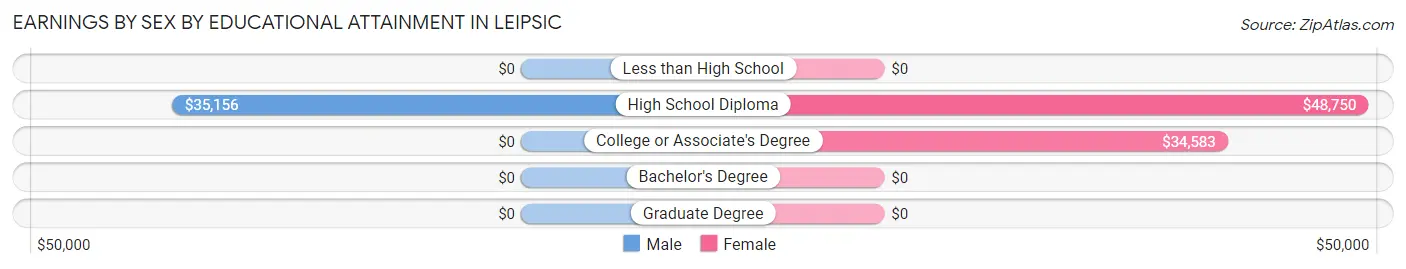
| Educational Attainment | Male Income | Female Income |
| Less than High School | - | - |
| High School Diploma | $35,156 | $48,750 |
| College or Associate's Degree | - | - |
| Bachelor's Degree | - | - |
| Graduate Degree | - | - |
| Total | $36,094 | $0 |
Family Income in Leipsic
Family Income Brackets in Leipsic
According to the Leipsic family income data, there are 14 families falling into the $35,000 to $49,999 income range, which is the most common income bracket and makes up 36.8% of all families.
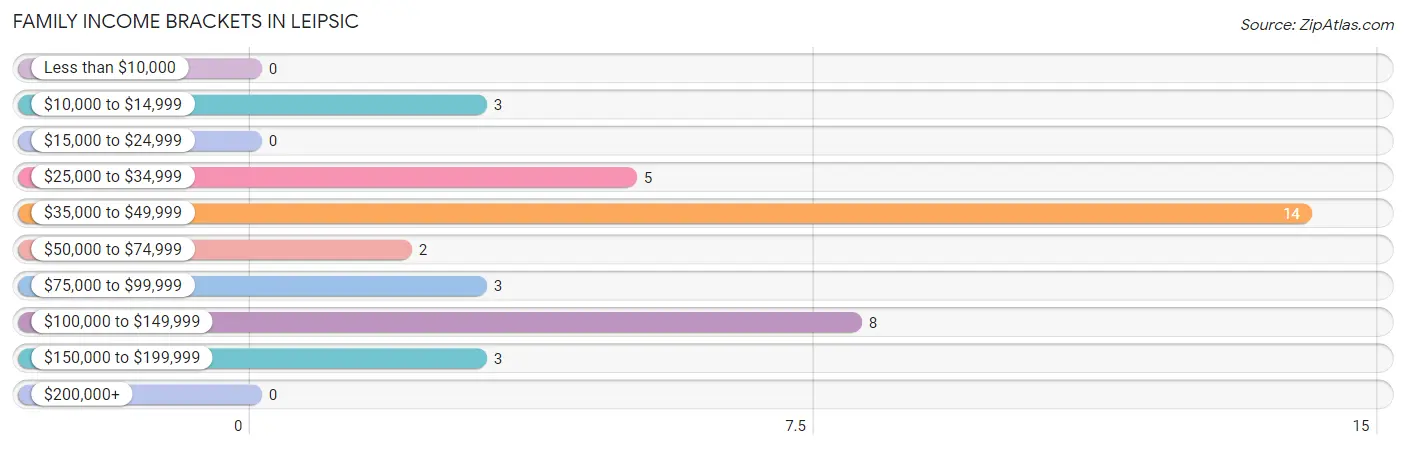
| Income Bracket | # Families | % Families |
| Less than $10,000 | 0 | 0.0% |
| $10,000 to $14,999 | 3 | 7.9% |
| $15,000 to $24,999 | 0 | 0.0% |
| $25,000 to $34,999 | 5 | 13.2% |
| $35,000 to $49,999 | 14 | 36.8% |
| $50,000 to $74,999 | 2 | 5.3% |
| $75,000 to $99,999 | 3 | 7.9% |
| $100,000 to $149,999 | 8 | 21.1% |
| $150,000 to $199,999 | 3 | 7.9% |
| $200,000+ | 0 | 0.0% |
Family Income by Famaliy Size in Leipsic
2-person families (13 | 34.2%) account for the highest median family income in Leipsic with $48,750 per family, while 2-person families (13 | 34.2%) have the highest median income of $24,375 per family member.
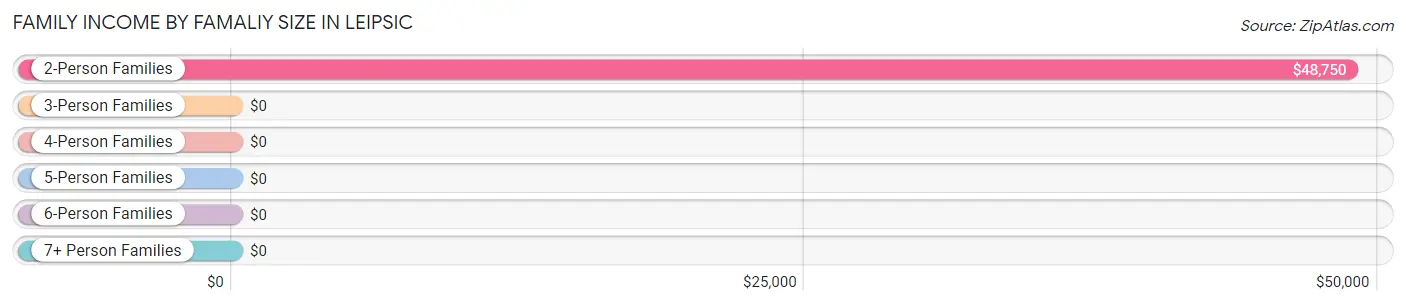
| Income Bracket | # Families | Median Income |
| 2-Person Families | 13 (34.2%) | $48,750 |
| 3-Person Families | 10 (26.3%) | $0 |
| 4-Person Families | 14 (36.8%) | $0 |
| 5-Person Families | 1 (2.6%) | $0 |
| 6-Person Families | 0 (0.0%) | $0 |
| 7+ Person Families | 0 (0.0%) | $0 |
| Total | 38 (100.0%) | $48,500 |
Family Income by Number of Earners in Leipsic
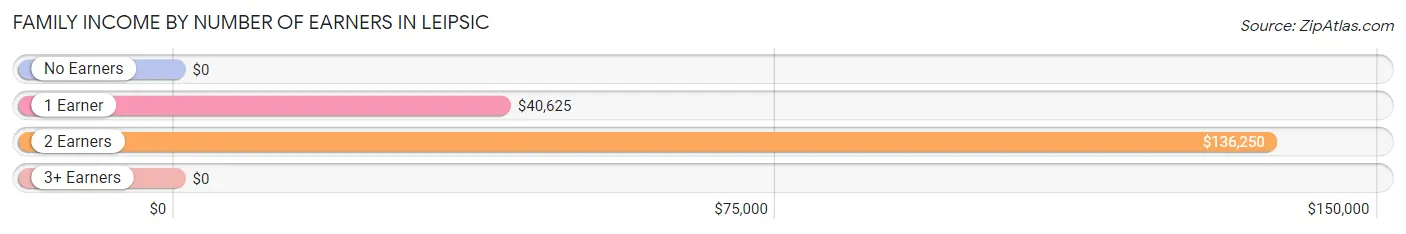
| Number of Earners | # Families | Median Income |
| No Earners | 1 (2.6%) | $0 |
| 1 Earner | 21 (55.3%) | $40,625 |
| 2 Earners | 12 (31.6%) | $136,250 |
| 3+ Earners | 4 (10.5%) | $0 |
| Total | 38 (100.0%) | $48,500 |
Household Income in Leipsic
Household Income Brackets in Leipsic
With 16 households falling in the category, the $15,000 to $24,999 income range is the most frequent in Leipsic, accounting for 20.3% of all households.
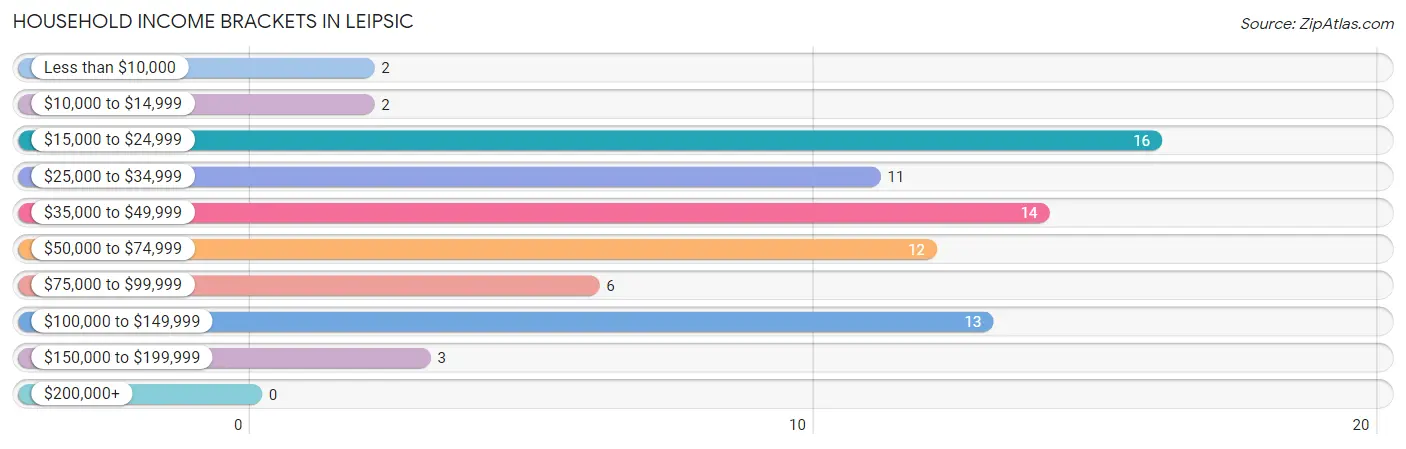
| Income Bracket | # Households | % Households |
| Less than $10,000 | 2 | 2.5% |
| $10,000 to $14,999 | 2 | 2.5% |
| $15,000 to $24,999 | 16 | 20.3% |
| $25,000 to $34,999 | 11 | 13.9% |
| $35,000 to $49,999 | 14 | 17.7% |
| $50,000 to $74,999 | 12 | 15.2% |
| $75,000 to $99,999 | 6 | 7.6% |
| $100,000 to $149,999 | 13 | 16.5% |
| $150,000 to $199,999 | 3 | 3.8% |
| $200,000+ | 0 | 0.0% |
Household Income by Householder Age in Leipsic
The median household income in Leipsic is $46,250, with the highest median household income of $56,000 found in the 45 to 64 years age bracket for the primary householder. A total of 48 households (60.8%) fall into this category.
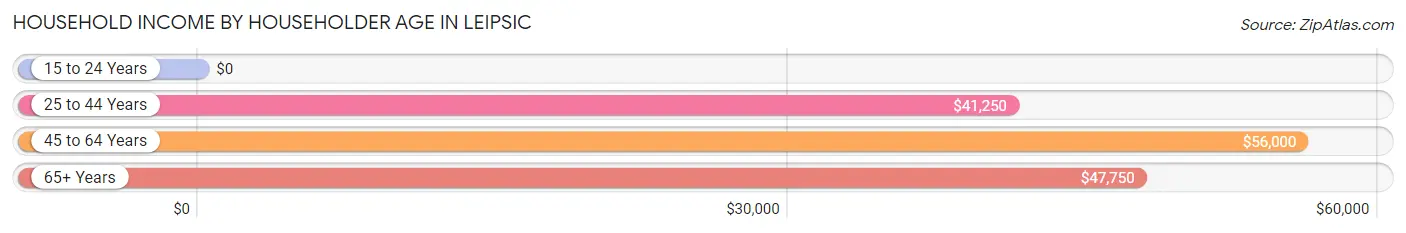
| Income Bracket | # Households | Median Income |
| 15 to 24 Years | 0 (0.0%) | $0 |
| 25 to 44 Years | 14 (17.7%) | $41,250 |
| 45 to 64 Years | 48 (60.8%) | $56,000 |
| 65+ Years | 17 (21.5%) | $47,750 |
| Total | 79 (100.0%) | $46,250 |
Poverty in Leipsic
Income Below Poverty by Sex and Age in Leipsic
With 5.6% poverty level for males and 3.7% for females among the residents of Leipsic, 65 to 74 year old males and 35 to 44 year old females are the most vulnerable to poverty, with 2 males (50.0%) and 2 females (50.0%) in their respective age groups living below the poverty level.
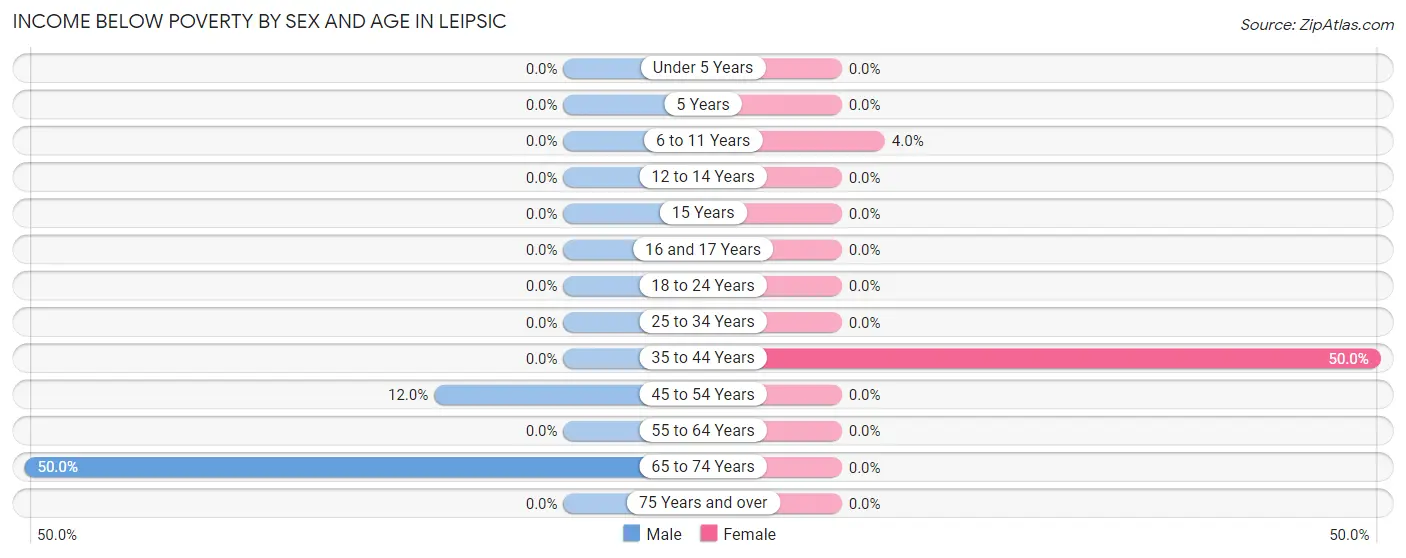
| Age Bracket | Male | Female |
| Under 5 Years | 0 (0.0%) | 0 (0.0%) |
| 5 Years | 0 (0.0%) | 0 (0.0%) |
| 6 to 11 Years | 0 (0.0%) | 1 (4.0%) |
| 12 to 14 Years | 0 (0.0%) | 0 (0.0%) |
| 15 Years | 0 (0.0%) | 0 (0.0%) |
| 16 and 17 Years | 0 (0.0%) | 0 (0.0%) |
| 18 to 24 Years | 0 (0.0%) | 0 (0.0%) |
| 25 to 34 Years | 0 (0.0%) | 0 (0.0%) |
| 35 to 44 Years | 0 (0.0%) | 2 (50.0%) |
| 45 to 54 Years | 3 (12.0%) | 0 (0.0%) |
| 55 to 64 Years | 0 (0.0%) | 0 (0.0%) |
| 65 to 74 Years | 2 (50.0%) | 0 (0.0%) |
| 75 Years and over | 0 (0.0%) | 0 (0.0%) |
| Total | 5 (5.6%) | 3 (3.7%) |
Income Above Poverty by Sex and Age in Leipsic
According to the poverty statistics in Leipsic, males aged under 5 years and females aged 18 to 24 years are the age groups that are most secure financially, with 100.0% of males and 100.0% of females in these age groups living above the poverty line.
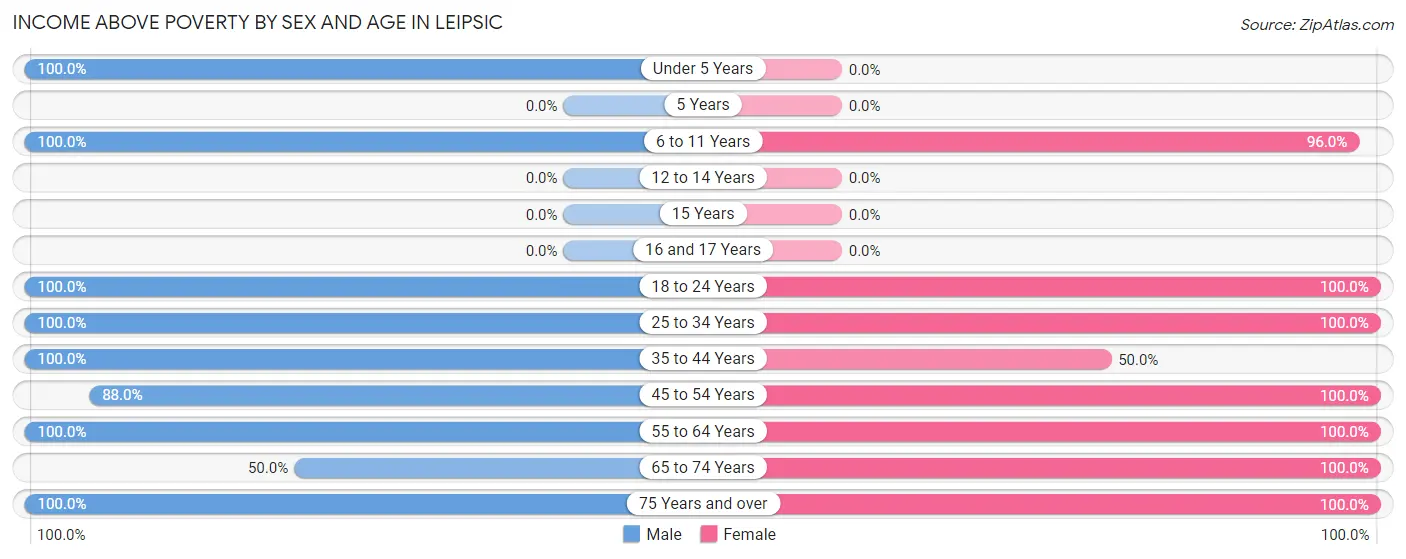
| Age Bracket | Male | Female |
| Under 5 Years | 1 (100.0%) | 0 (0.0%) |
| 5 Years | 0 (0.0%) | 0 (0.0%) |
| 6 to 11 Years | 9 (100.0%) | 24 (96.0%) |
| 12 to 14 Years | 0 (0.0%) | 0 (0.0%) |
| 15 Years | 0 (0.0%) | 0 (0.0%) |
| 16 and 17 Years | 0 (0.0%) | 0 (0.0%) |
| 18 to 24 Years | 3 (100.0%) | 3 (100.0%) |
| 25 to 34 Years | 4 (100.0%) | 9 (100.0%) |
| 35 to 44 Years | 9 (100.0%) | 2 (50.0%) |
| 45 to 54 Years | 22 (88.0%) | 18 (100.0%) |
| 55 to 64 Years | 29 (100.0%) | 12 (100.0%) |
| 65 to 74 Years | 2 (50.0%) | 6 (100.0%) |
| 75 Years and over | 5 (100.0%) | 5 (100.0%) |
| Total | 84 (94.4%) | 79 (96.3%) |
Income Below Poverty Among Married-Couple Families in Leipsic
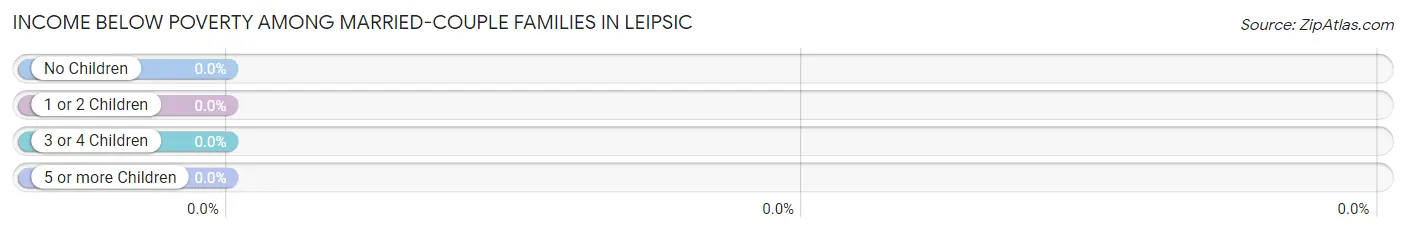
| Children | Above Poverty | Below Poverty |
| No Children | 13 (100.0%) | 0 (0.0%) |
| 1 or 2 Children | 15 (100.0%) | 0 (0.0%) |
| 3 or 4 Children | 1 (100.0%) | 0 (0.0%) |
| 5 or more Children | 0 (0.0%) | 0 (0.0%) |
| Total | 29 (100.0%) | 0 (0.0%) |
Income Below Poverty Among Single-Parent Households in Leipsic
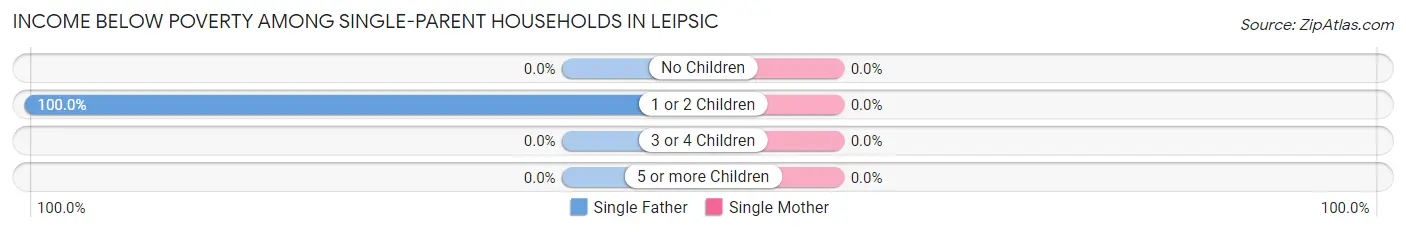
| Children | Single Father | Single Mother |
| No Children | 0 (0.0%) | 0 (0.0%) |
| 1 or 2 Children | 3 (100.0%) | 0 (0.0%) |
| 3 or 4 Children | 0 (0.0%) | 0 (0.0%) |
| 5 or more Children | 0 (0.0%) | 0 (0.0%) |
| Total | 3 (33.3%) | 0 (0.0%) |
Income Below Poverty Among Married-Couple vs Single-Parent Households in Leipsic
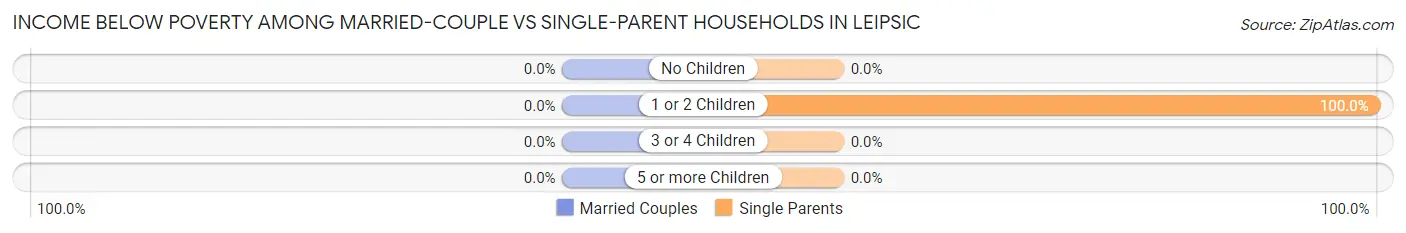
| Children | Married-Couple Families | Single-Parent Households |
| No Children | 0 (0.0%) | 0 (0.0%) |
| 1 or 2 Children | 0 (0.0%) | 3 (100.0%) |
| 3 or 4 Children | 0 (0.0%) | 0 (0.0%) |
| 5 or more Children | 0 (0.0%) | 0 (0.0%) |
| Total | 0 (0.0%) | 3 (33.3%) |
Race in Leipsic
The most populous races in Leipsic are White / Caucasian (169 | 98.8%), Hispanic or Latino (8 | 4.7%), and Some other Race (2 | 1.2%).
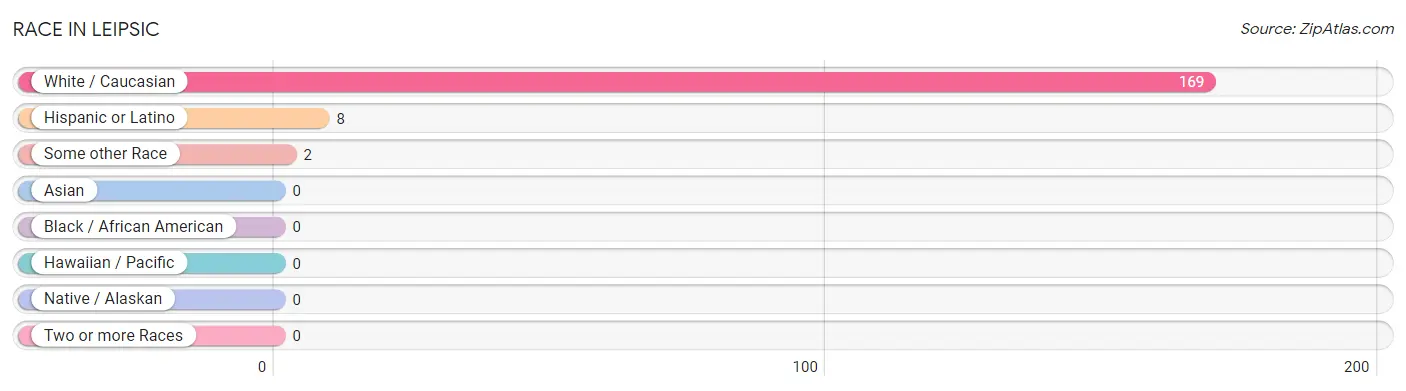
| Race | # Population | % Population |
| Asian | 0 | 0.0% |
| Black / African American | 0 | 0.0% |
| Hawaiian / Pacific | 0 | 0.0% |
| Hispanic or Latino | 8 | 4.7% |
| Native / Alaskan | 0 | 0.0% |
| White / Caucasian | 169 | 98.8% |
| Two or more Races | 0 | 0.0% |
| Some other Race | 2 | 1.2% |
| Total | 171 | 100.0% |
Ancestry in Leipsic
The most populous ancestries reported in Leipsic are German (59 | 34.5%), English (37 | 21.6%), Italian (34 | 19.9%), Irish (15 | 8.8%), and American (14 | 8.2%), together accounting for 93.0% of all Leipsic residents.
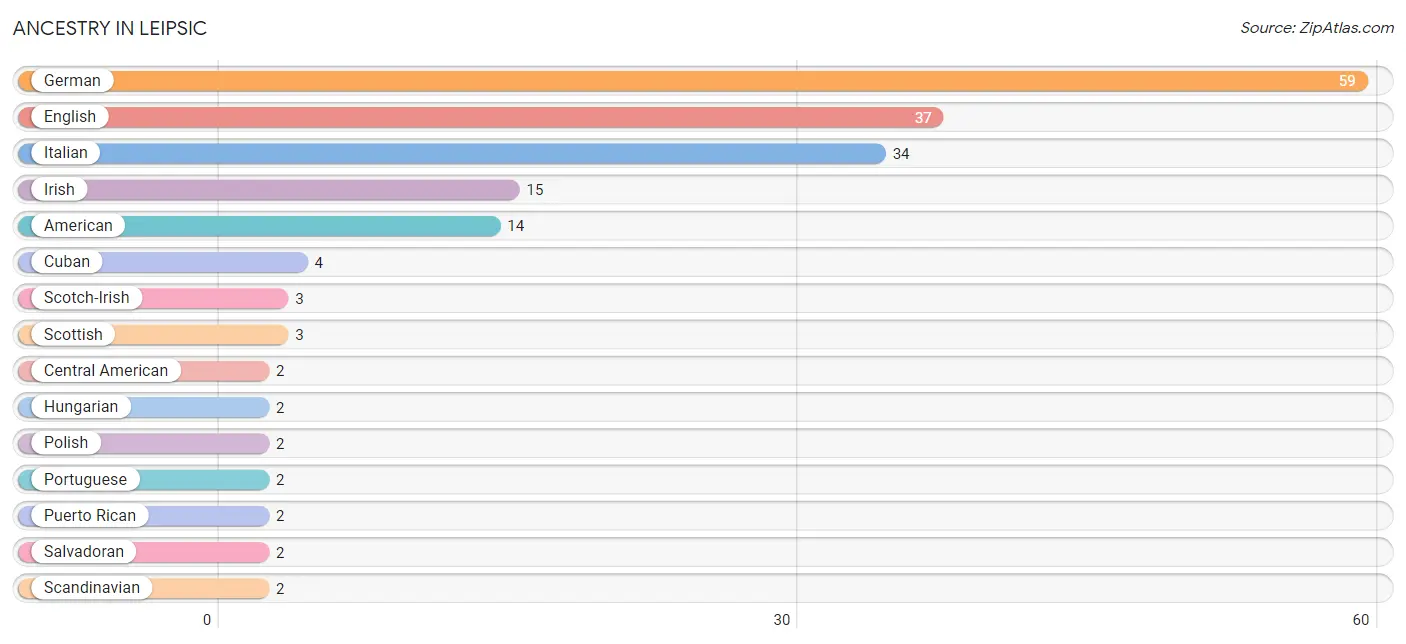
| Ancestry | # Population | % Population |
| American | 14 | 8.2% |
| Central American | 2 | 1.2% |
| Cuban | 4 | 2.3% |
| English | 37 | 21.6% |
| German | 59 | 34.5% |
| Hungarian | 2 | 1.2% |
| Irish | 15 | 8.8% |
| Italian | 34 | 19.9% |
| Polish | 2 | 1.2% |
| Portuguese | 2 | 1.2% |
| Puerto Rican | 2 | 1.2% |
| Salvadoran | 2 | 1.2% |
| Scandinavian | 2 | 1.2% |
| Scotch-Irish | 3 | 1.8% |
| Scottish | 3 | 1.8% |
| Welsh | 2 | 1.2% | View All 16 Rows |
Immigrants in Leipsic
The most numerous immigrant groups reported in Leipsic came from Latin America (5 | 2.9%), Caribbean (3 | 1.8%), Cuba (3 | 1.8%), Central America (2 | 1.2%), and El Salvador (2 | 1.2%), together accounting for 8.8% of all Leipsic residents.
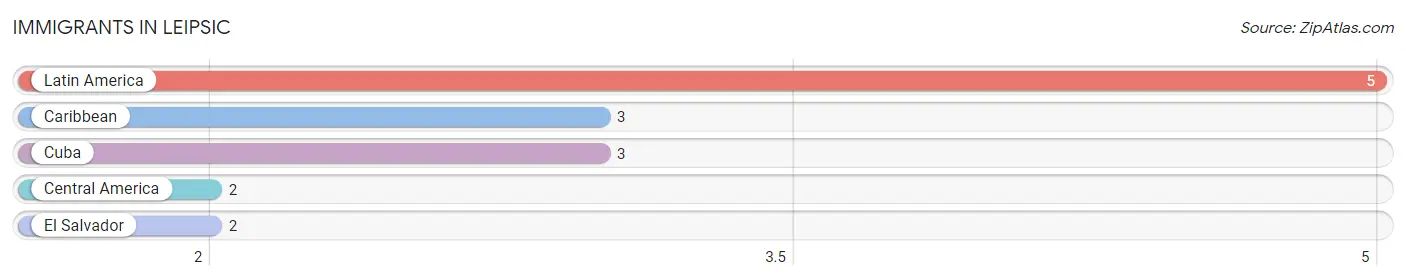
| Immigration Origin | # Population | % Population |
| Caribbean | 3 | 1.8% |
| Central America | 2 | 1.2% |
| Cuba | 3 | 1.8% |
| El Salvador | 2 | 1.2% |
| Latin America | 5 | 2.9% | View All 5 Rows |
Sex and Age in Leipsic
Sex and Age in Leipsic
The most populous age groups in Leipsic are 55 to 59 Years (22 | 24.7%) for men and 10 to 14 Years (20 | 24.4%) for women.
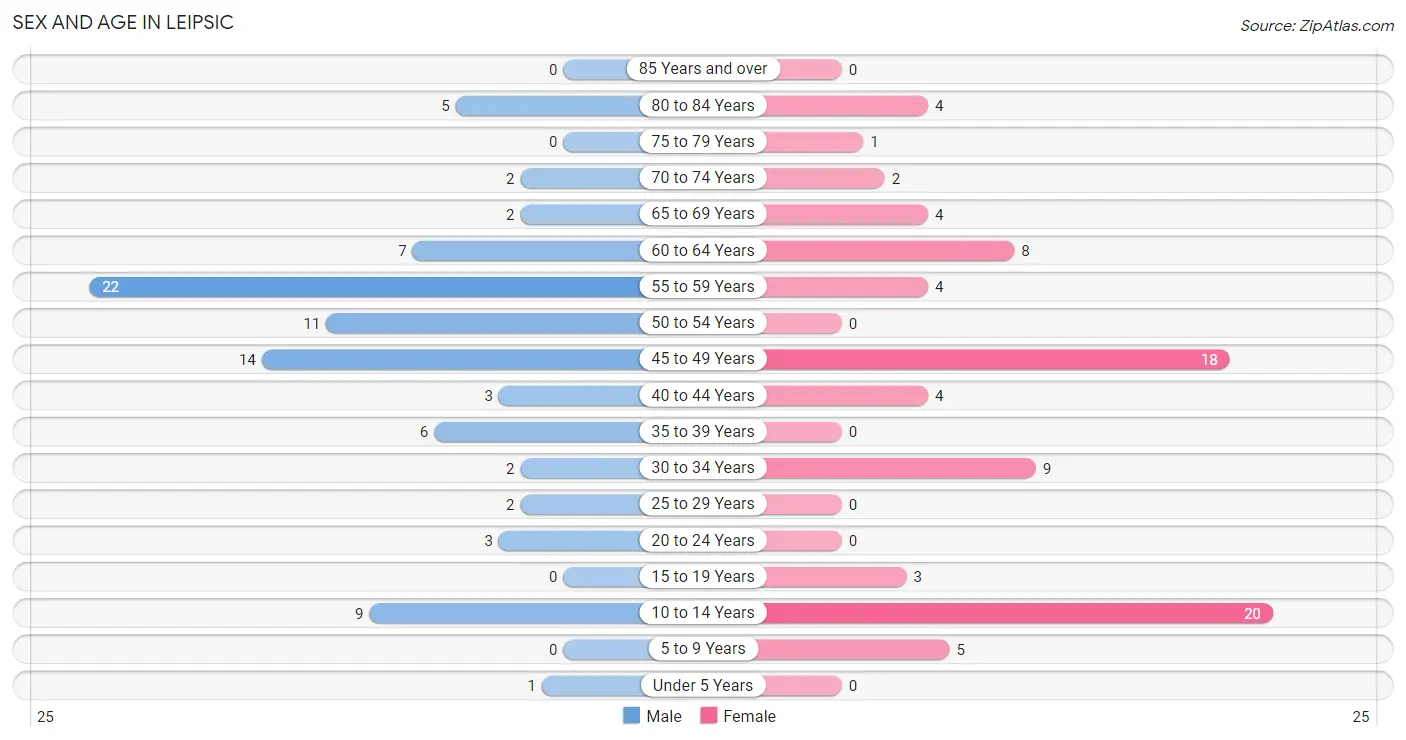
| Age Bracket | Male | Female |
| Under 5 Years | 1 (1.1%) | 0 (0.0%) |
| 5 to 9 Years | 0 (0.0%) | 5 (6.1%) |
| 10 to 14 Years | 9 (10.1%) | 20 (24.4%) |
| 15 to 19 Years | 0 (0.0%) | 3 (3.7%) |
| 20 to 24 Years | 3 (3.4%) | 0 (0.0%) |
| 25 to 29 Years | 2 (2.2%) | 0 (0.0%) |
| 30 to 34 Years | 2 (2.2%) | 9 (11.0%) |
| 35 to 39 Years | 6 (6.7%) | 0 (0.0%) |
| 40 to 44 Years | 3 (3.4%) | 4 (4.9%) |
| 45 to 49 Years | 14 (15.7%) | 18 (22.0%) |
| 50 to 54 Years | 11 (12.4%) | 0 (0.0%) |
| 55 to 59 Years | 22 (24.7%) | 4 (4.9%) |
| 60 to 64 Years | 7 (7.9%) | 8 (9.8%) |
| 65 to 69 Years | 2 (2.2%) | 4 (4.9%) |
| 70 to 74 Years | 2 (2.2%) | 2 (2.4%) |
| 75 to 79 Years | 0 (0.0%) | 1 (1.2%) |
| 80 to 84 Years | 5 (5.6%) | 4 (4.9%) |
| 85 Years and over | 0 (0.0%) | 0 (0.0%) |
| Total | 89 (100.0%) | 82 (100.0%) |
Families and Households in Leipsic
Median Family Size in Leipsic
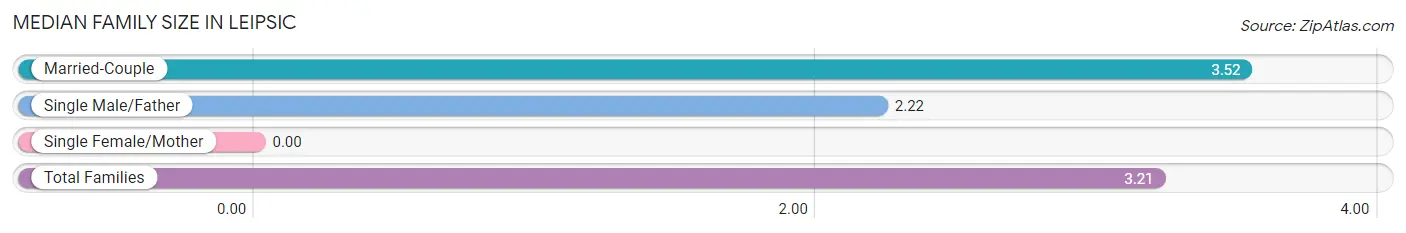
| Family Type | # Families | Family Size |
| Married-Couple | 29 (76.3%) | 3.52 |
| Single Male/Father | 9 (23.7%) | 2.22 |
| Single Female/Mother | 0 (0.0%) | - |
| Total Families | 38 (100.0%) | 3.21 |
Median Household Size in Leipsic
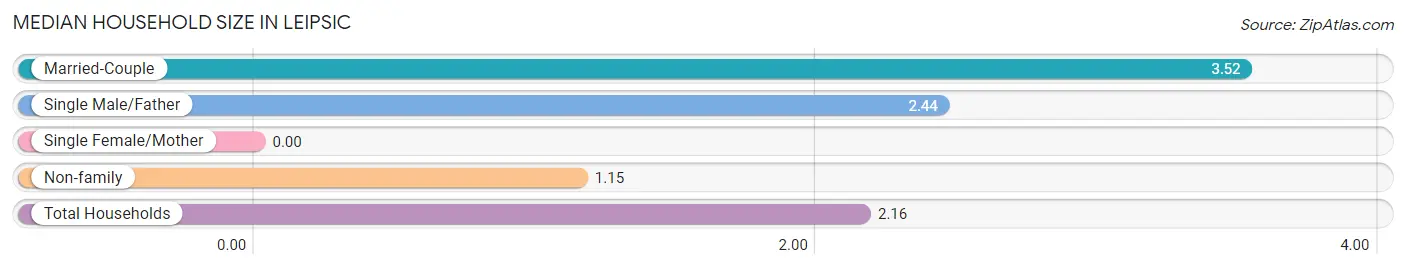
| Household Type | # Households | Household Size |
| Married-Couple | 29 (36.7%) | 3.52 |
| Single Male/Father | 9 (11.4%) | 2.44 |
| Single Female/Mother | 0 (0.0%) | - |
| Non-family | 41 (51.9%) | 1.15 |
| Total Households | 79 (100.0%) | 2.16 |
Household Size by Marriage Status in Leipsic
Out of a total of 79 households in Leipsic, 38 (48.1%) are family households, while 41 (51.9%) are nonfamily households. The most numerous type of family households are 4-person households, comprising 14, and the most common type of nonfamily households are 1-person households, comprising 34.
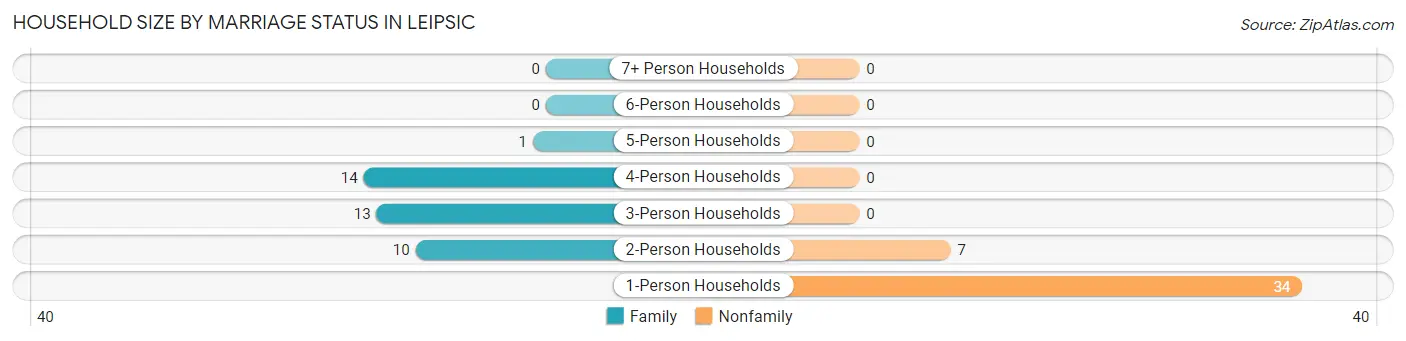
| Household Size | Family Households | Nonfamily Households |
| 1-Person Households | - | 34 (43.0%) |
| 2-Person Households | 10 (12.7%) | 7 (8.9%) |
| 3-Person Households | 13 (16.5%) | 0 (0.0%) |
| 4-Person Households | 14 (17.7%) | 0 (0.0%) |
| 5-Person Households | 1 (1.3%) | 0 (0.0%) |
| 6-Person Households | 0 (0.0%) | 0 (0.0%) |
| 7+ Person Households | 0 (0.0%) | 0 (0.0%) |
| Total | 38 (48.1%) | 41 (51.9%) |
Female Fertility in Leipsic
Fertility by Age in Leipsic
| Age Bracket | Women with Births | Births / 1,000 Women |
| 15 to 19 years | 0 (0.0%) | 0.0 |
| 20 to 34 years | 0 (0.0%) | 0.0 |
| 35 to 50 years | 0 (0.0%) | 0.0 |
| Total | 0 (0.0%) | 0.0 |
Fertility by Age by Marriage Status in Leipsic
| Age Bracket | Married | Unmarried |
| 15 to 19 years | 0 (0.0%) | 0 (0.0%) |
| 20 to 34 years | 0 (0.0%) | 0 (0.0%) |
| 35 to 50 years | 0 (0.0%) | 0 (0.0%) |
| Total | 0 (0.0%) | 0 (0.0%) |
Fertility by Education in Leipsic
| Educational Attainment | Women with Births | Births / 1,000 Women |
| Less than High School | 0 (0.0%) | 0.0 |
| High School Diploma | 0 (0.0%) | 0.0 |
| College or Associate's Degree | 0 (0.0%) | 0.0 |
| Bachelor's Degree | 0 (0.0%) | 0.0 |
| Graduate Degree | 0 (0.0%) | 0.0 |
| Total | 0 (0.0%) | 0.0 |
Fertility by Education by Marriage Status in Leipsic
| Educational Attainment | Married | Unmarried |
| Less than High School | 0 (0.0%) | 0 (0.0%) |
| High School Diploma | 0 (0.0%) | 0 (0.0%) |
| College or Associate's Degree | 0 (0.0%) | 0 (0.0%) |
| Bachelor's Degree | 0 (0.0%) | 0 (0.0%) |
| Graduate Degree | 0 (0.0%) | 0 (0.0%) |
| Total | 0 (0.0%) | 0 (0.0%) |
Employment Characteristics in Leipsic
Employment by Class of Employer in Leipsic
Among the 89 employed individuals in Leipsic, private company employees (59 | 66.3%), not-for-profit organizations (10 | 11.2%), and state government employees (10 | 11.2%) make up the most common classes of employment.
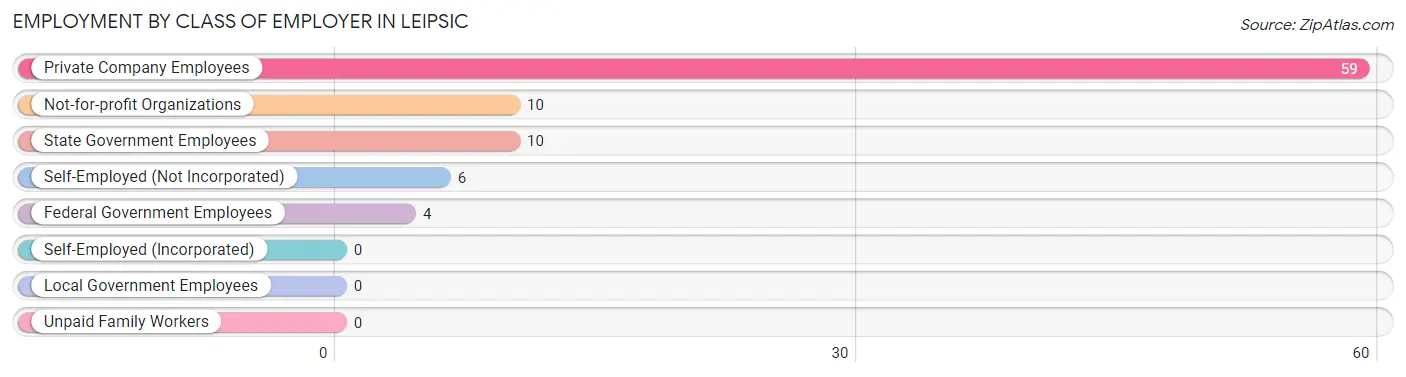
| Employer Class | # Employees | % Employees |
| Private Company Employees | 59 | 66.3% |
| Self-Employed (Incorporated) | 0 | 0.0% |
| Self-Employed (Not Incorporated) | 6 | 6.7% |
| Not-for-profit Organizations | 10 | 11.2% |
| Local Government Employees | 0 | 0.0% |
| State Government Employees | 10 | 11.2% |
| Federal Government Employees | 4 | 4.5% |
| Unpaid Family Workers | 0 | 0.0% |
| Total | 89 | 100.0% |
Employment Status by Age in Leipsic
According to the labor force statistics for Leipsic, out of the total population over 16 years of age (136), 70.6% or 96 individuals are in the labor force, with 7.3% or 7 of them unemployed. The age group with the highest labor force participation rate is 20 to 24 years, with 100.0% or 3 individuals in the labor force. Within the labor force, the 60 to 64 years age range has the highest percentage of unemployed individuals, with 33.3% or 2 of them being unemployed.
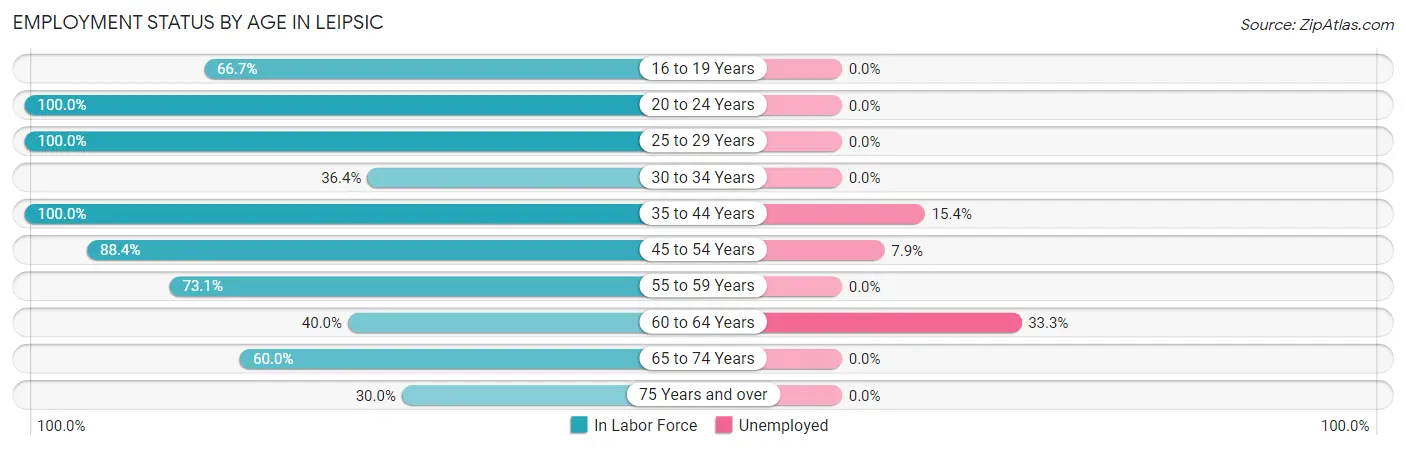
| Age Bracket | In Labor Force | Unemployed |
| 16 to 19 Years | 2 (66.7%) | 0 (0.0%) |
| 20 to 24 Years | 3 (100.0%) | 0 (0.0%) |
| 25 to 29 Years | 2 (100.0%) | 0 (0.0%) |
| 30 to 34 Years | 4 (36.4%) | 0 (0.0%) |
| 35 to 44 Years | 13 (100.0%) | 2 (15.4%) |
| 45 to 54 Years | 38 (88.4%) | 3 (7.9%) |
| 55 to 59 Years | 19 (73.1%) | 0 (0.0%) |
| 60 to 64 Years | 6 (40.0%) | 2 (33.3%) |
| 65 to 74 Years | 6 (60.0%) | 0 (0.0%) |
| 75 Years and over | 3 (30.0%) | 0 (0.0%) |
| Total | 96 (70.6%) | 7 (7.3%) |
Employment Status by Educational Attainment in Leipsic
According to labor force statistics for Leipsic, 74.5% of individuals (82) out of the total population between 25 and 64 years of age (110) are in the labor force, with 8.5% or 7 of them being unemployed. The group with the highest labor force participation rate are those with the educational attainment of less than high school, with 100.0% or 13 individuals in the labor force. Within the labor force, individuals with college / associate degree education have the highest percentage of unemployment, with 11.8% or 2 of them being unemployed.
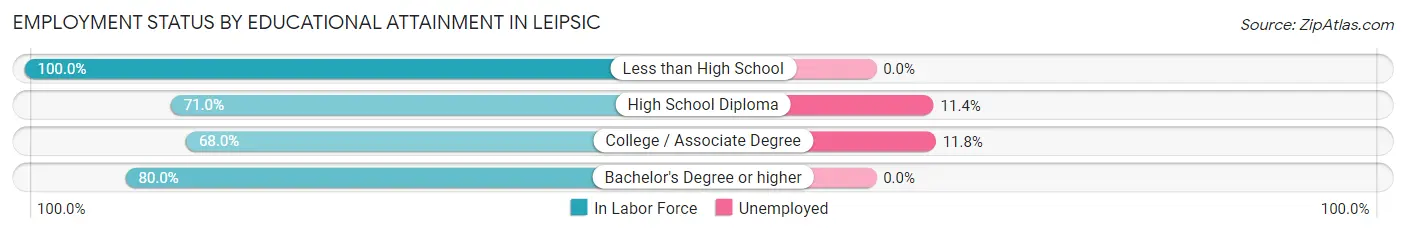
| Educational Attainment | In Labor Force | Unemployed |
| Less than High School | 13 (100.0%) | 0 (0.0%) |
| High School Diploma | 44 (71.0%) | 7 (11.4%) |
| College / Associate Degree | 17 (68.0%) | 3 (11.8%) |
| Bachelor's Degree or higher | 8 (80.0%) | 0 (0.0%) |
| Total | 82 (74.5%) | 9 (8.5%) |
Employment Occupations by Sex in Leipsic
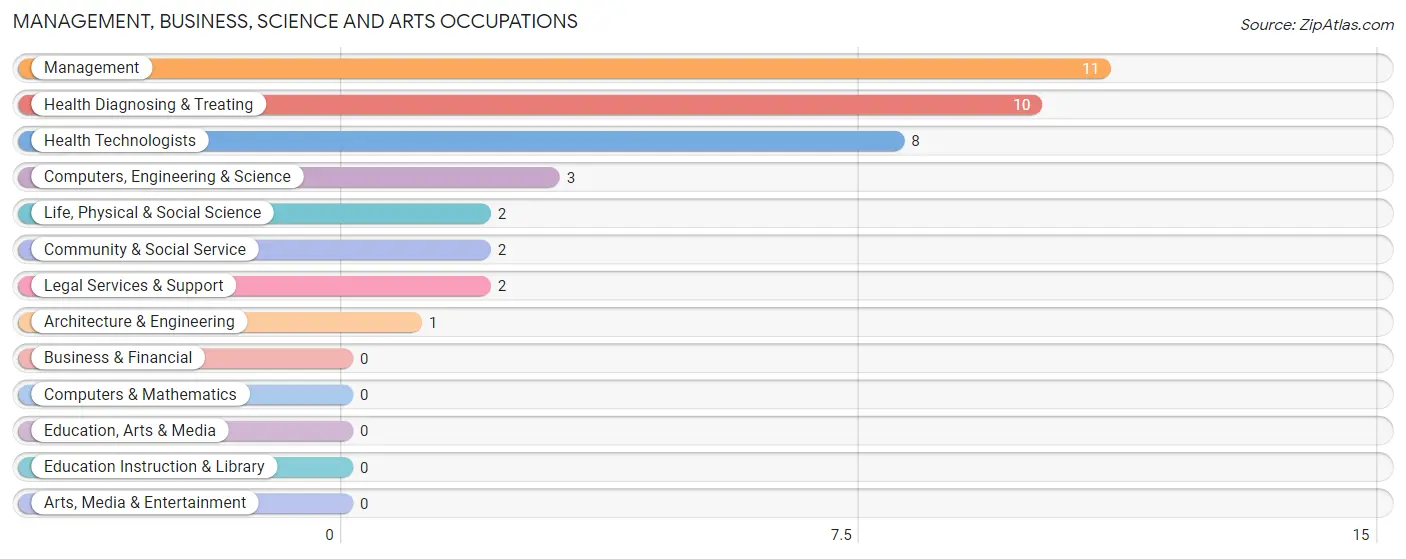
Management, Business, Science and Arts Occupations
The most common Management, Business, Science and Arts occupations in Leipsic are Management (11 | 12.4%), Health Diagnosing & Treating (10 | 11.2%), Health Technologists (8 | 9.0%), Computers, Engineering & Science (3 | 3.4%), and Life, Physical & Social Science (2 | 2.2%).
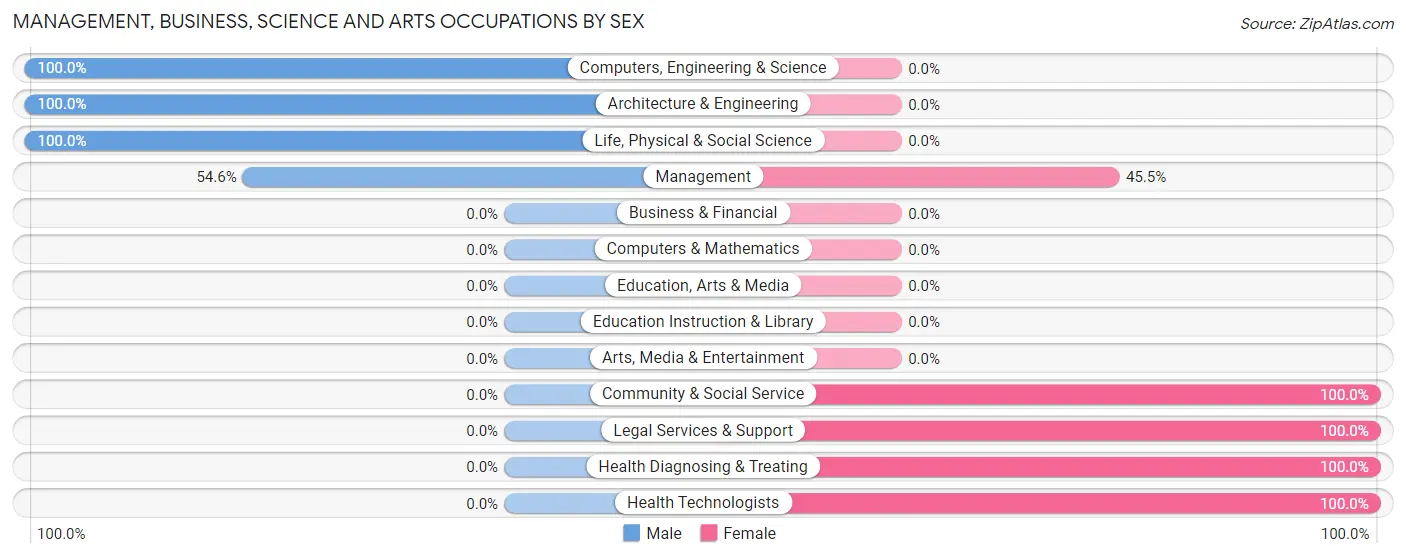
Management, Business, Science and Arts Occupations by Sex
Within the Management, Business, Science and Arts occupations in Leipsic, the most male-oriented occupations are Computers, Engineering & Science (100.0%), Architecture & Engineering (100.0%), and Life, Physical & Social Science (100.0%), while the most female-oriented occupations are Community & Social Service (100.0%), Legal Services & Support (100.0%), and Health Diagnosing & Treating (100.0%).
| Occupation | Male | Female |
| Management | 6 (54.5%) | 5 (45.5%) |
| Business & Financial | 0 (0.0%) | 0 (0.0%) |
| Computers, Engineering & Science | 3 (100.0%) | 0 (0.0%) |
| Computers & Mathematics | 0 (0.0%) | 0 (0.0%) |
| Architecture & Engineering | 1 (100.0%) | 0 (0.0%) |
| Life, Physical & Social Science | 2 (100.0%) | 0 (0.0%) |
| Community & Social Service | 0 (0.0%) | 2 (100.0%) |
| Education, Arts & Media | 0 (0.0%) | 0 (0.0%) |
| Legal Services & Support | 0 (0.0%) | 2 (100.0%) |
| Education Instruction & Library | 0 (0.0%) | 0 (0.0%) |
| Arts, Media & Entertainment | 0 (0.0%) | 0 (0.0%) |
| Health Diagnosing & Treating | 0 (0.0%) | 10 (100.0%) |
| Health Technologists | 0 (0.0%) | 8 (100.0%) |
| Total (Category) | 9 (34.6%) | 17 (65.4%) |
| Total (Overall) | 57 (64.0%) | 32 (36.0%) |
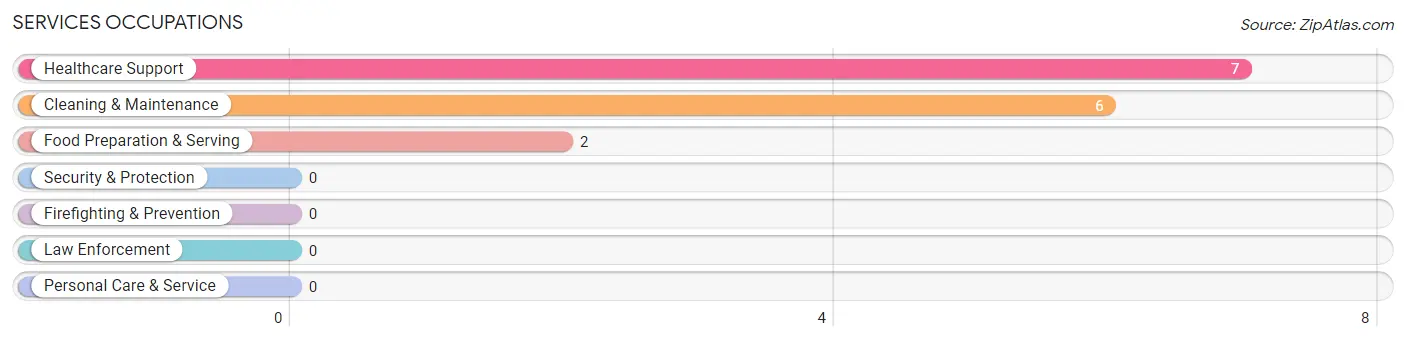
Services Occupations
The most common Services occupations in Leipsic are Healthcare Support (7 | 7.9%), Cleaning & Maintenance (6 | 6.7%), and Food Preparation & Serving (2 | 2.2%).
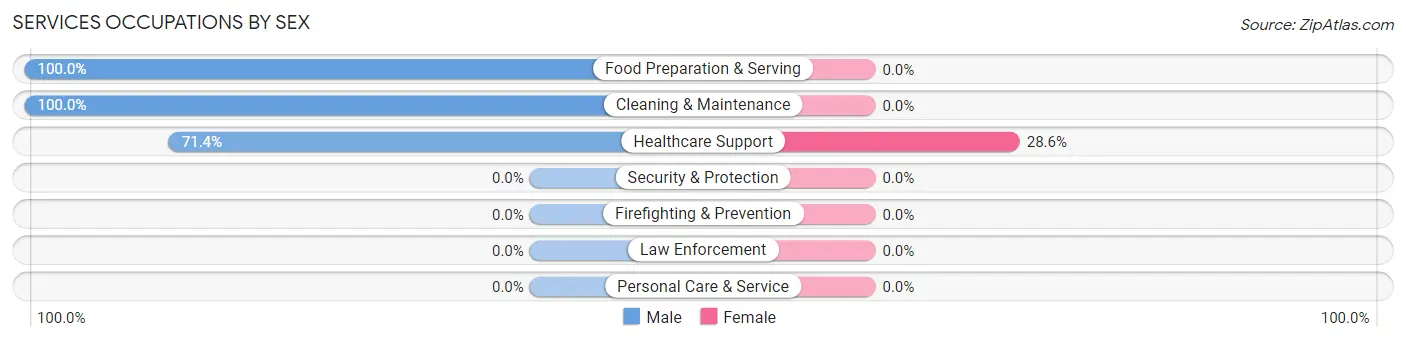
Services Occupations by Sex
| Occupation | Male | Female |
| Healthcare Support | 5 (71.4%) | 2 (28.6%) |
| Security & Protection | 0 (0.0%) | 0 (0.0%) |
| Firefighting & Prevention | 0 (0.0%) | 0 (0.0%) |
| Law Enforcement | 0 (0.0%) | 0 (0.0%) |
| Food Preparation & Serving | 2 (100.0%) | 0 (0.0%) |
| Cleaning & Maintenance | 6 (100.0%) | 0 (0.0%) |
| Personal Care & Service | 0 (0.0%) | 0 (0.0%) |
| Total (Category) | 13 (86.7%) | 2 (13.3%) |
| Total (Overall) | 57 (64.0%) | 32 (36.0%) |
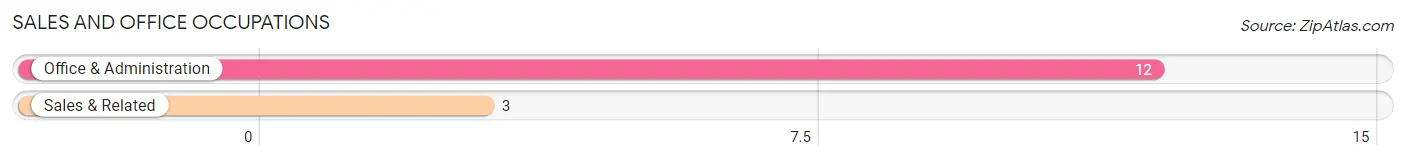
Sales and Office Occupations
The most common Sales and Office occupations in Leipsic are Office & Administration (12 | 13.5%), and Sales & Related (3 | 3.4%).
Sales and Office Occupations by Sex
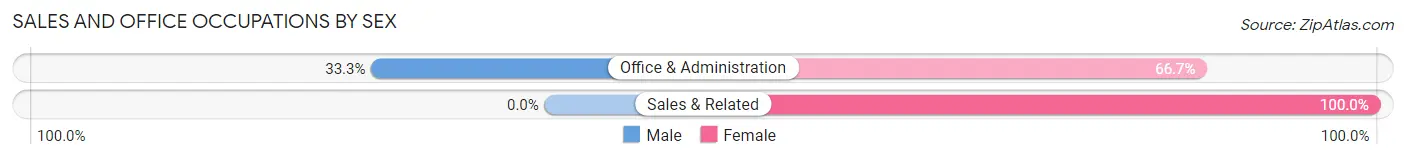
| Occupation | Male | Female |
| Sales & Related | 0 (0.0%) | 3 (100.0%) |
| Office & Administration | 4 (33.3%) | 8 (66.7%) |
| Total (Category) | 4 (26.7%) | 11 (73.3%) |
| Total (Overall) | 57 (64.0%) | 32 (36.0%) |
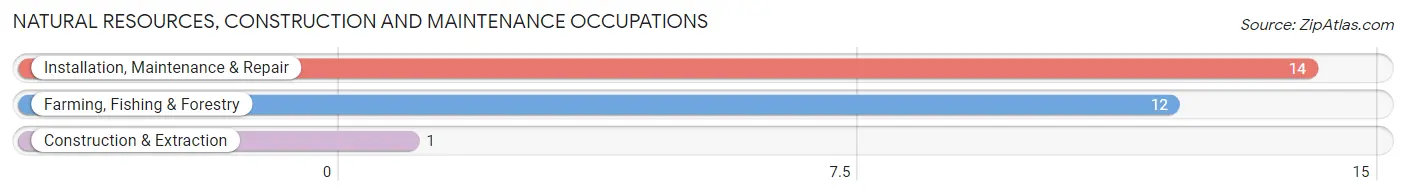
Natural Resources, Construction and Maintenance Occupations
The most common Natural Resources, Construction and Maintenance occupations in Leipsic are Installation, Maintenance & Repair (14 | 15.7%), Farming, Fishing & Forestry (12 | 13.5%), and Construction & Extraction (1 | 1.1%).
Natural Resources, Construction and Maintenance Occupations by Sex
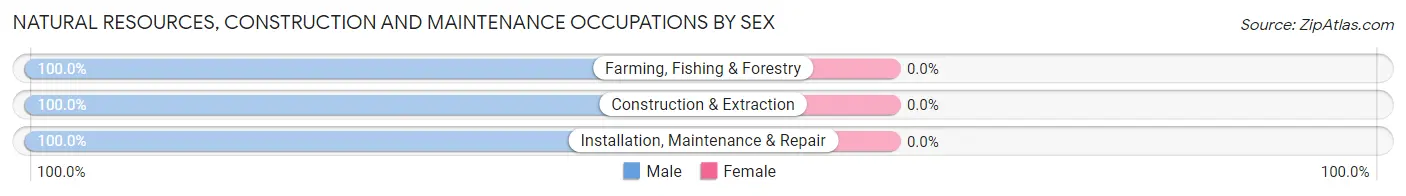
| Occupation | Male | Female |
| Farming, Fishing & Forestry | 12 (100.0%) | 0 (0.0%) |
| Construction & Extraction | 1 (100.0%) | 0 (0.0%) |
| Installation, Maintenance & Repair | 14 (100.0%) | 0 (0.0%) |
| Total (Category) | 27 (100.0%) | 0 (0.0%) |
| Total (Overall) | 57 (64.0%) | 32 (36.0%) |
Production, Transportation and Moving Occupations
The most common Production, Transportation and Moving occupations in Leipsic are Transportation (3 | 3.4%), Material Moving (2 | 2.2%), and Production (1 | 1.1%).
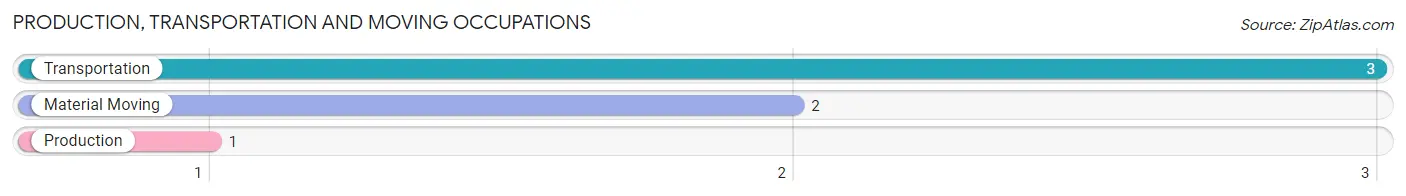
Production, Transportation and Moving Occupations by Sex
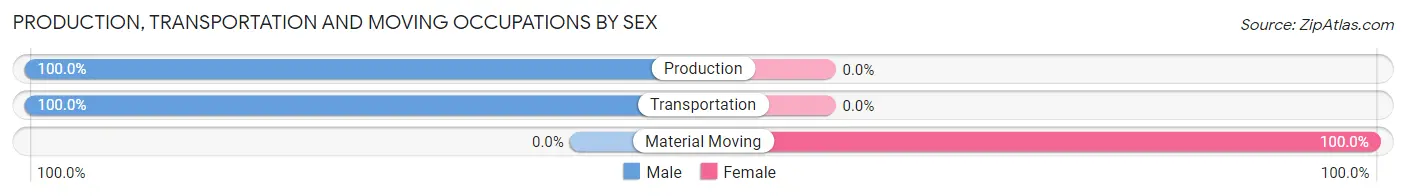
| Occupation | Male | Female |
| Production | 1 (100.0%) | 0 (0.0%) |
| Transportation | 3 (100.0%) | 0 (0.0%) |
| Material Moving | 0 (0.0%) | 2 (100.0%) |
| Total (Category) | 4 (66.7%) | 2 (33.3%) |
| Total (Overall) | 57 (64.0%) | 32 (36.0%) |
Employment Industries by Sex in Leipsic
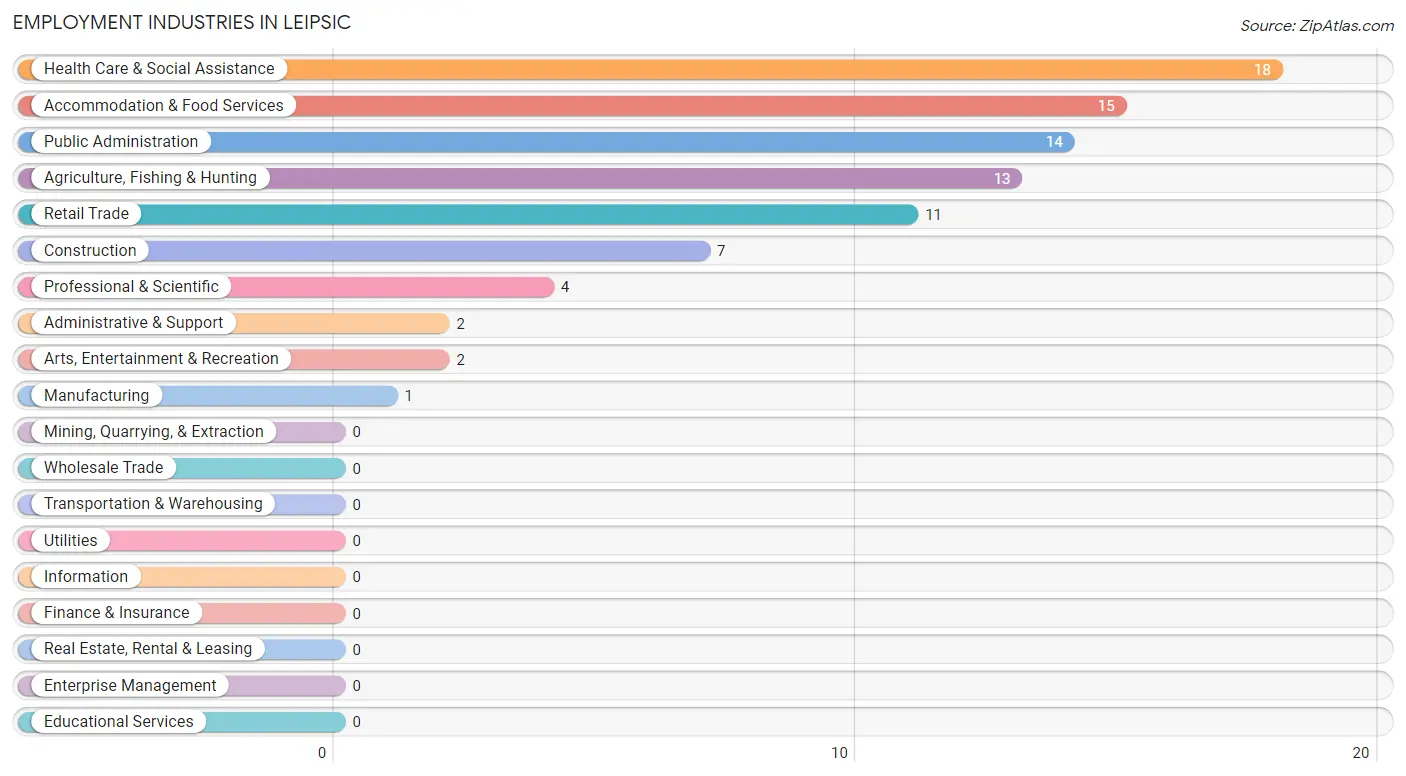
Employment Industries in Leipsic
The major employment industries in Leipsic include Health Care & Social Assistance (18 | 20.2%), Accommodation & Food Services (15 | 16.9%), Public Administration (14 | 15.7%), Agriculture, Fishing & Hunting (13 | 14.6%), and Retail Trade (11 | 12.4%).
Employment Industries by Sex in Leipsic
The Leipsic industries that see more men than women are Agriculture, Fishing & Hunting (100.0%), Manufacturing (100.0%), and Administrative & Support (100.0%), whereas the industries that tend to have a higher number of women are Professional & Scientific (100.0%), Construction (85.7%), and Health Care & Social Assistance (72.2%).
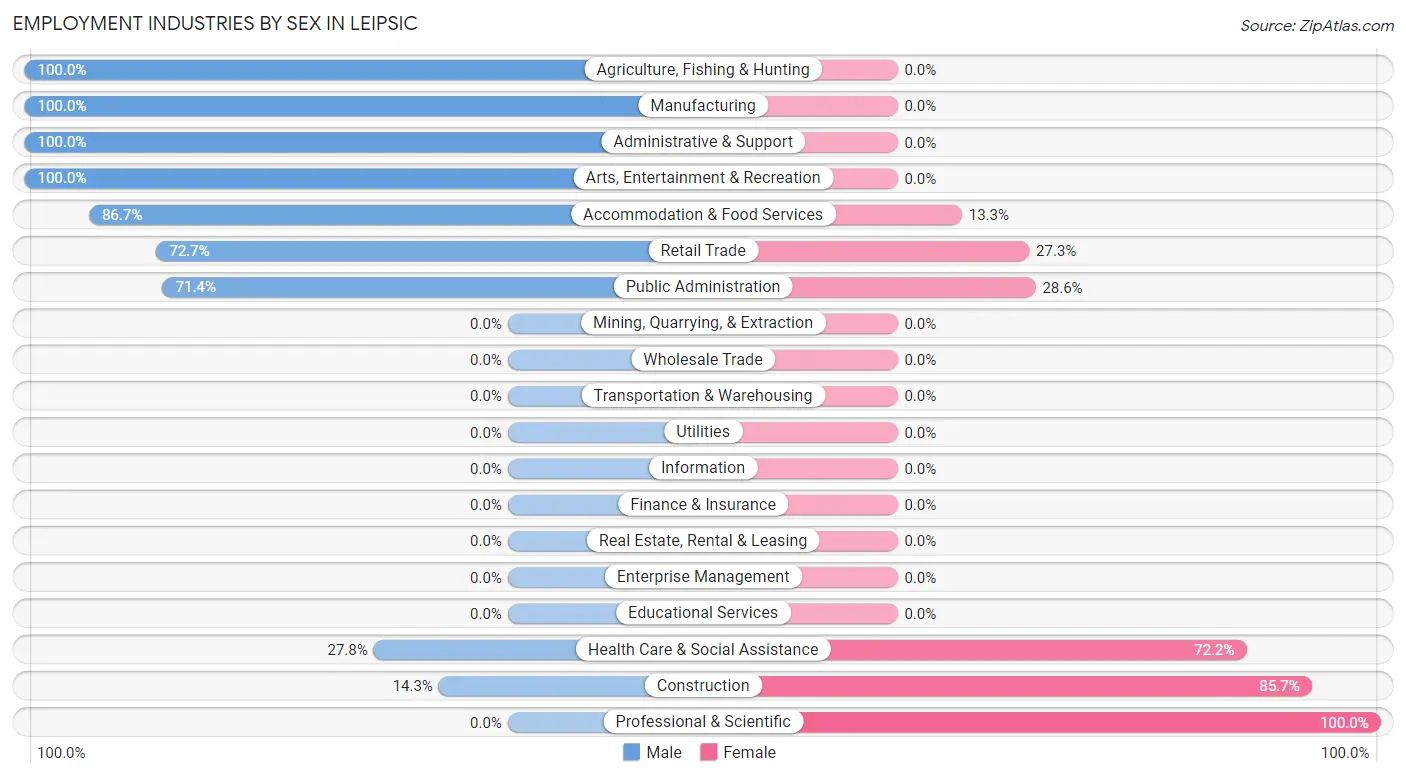
| Industry | Male | Female |
| Agriculture, Fishing & Hunting | 13 (100.0%) | 0 (0.0%) |
| Mining, Quarrying, & Extraction | 0 (0.0%) | 0 (0.0%) |
| Construction | 1 (14.3%) | 6 (85.7%) |
| Manufacturing | 1 (100.0%) | 0 (0.0%) |
| Wholesale Trade | 0 (0.0%) | 0 (0.0%) |
| Retail Trade | 8 (72.7%) | 3 (27.3%) |
| Transportation & Warehousing | 0 (0.0%) | 0 (0.0%) |
| Utilities | 0 (0.0%) | 0 (0.0%) |
| Information | 0 (0.0%) | 0 (0.0%) |
| Finance & Insurance | 0 (0.0%) | 0 (0.0%) |
| Real Estate, Rental & Leasing | 0 (0.0%) | 0 (0.0%) |
| Professional & Scientific | 0 (0.0%) | 4 (100.0%) |
| Enterprise Management | 0 (0.0%) | 0 (0.0%) |
| Administrative & Support | 2 (100.0%) | 0 (0.0%) |
| Educational Services | 0 (0.0%) | 0 (0.0%) |
| Health Care & Social Assistance | 5 (27.8%) | 13 (72.2%) |
| Arts, Entertainment & Recreation | 2 (100.0%) | 0 (0.0%) |
| Accommodation & Food Services | 13 (86.7%) | 2 (13.3%) |
| Public Administration | 10 (71.4%) | 4 (28.6%) |
| Total | 57 (64.0%) | 32 (36.0%) |
Education in Leipsic
School Enrollment in Leipsic
The most common levels of schooling among the 25 students in Leipsic are elementary school (11 | 44.0%), middle school (8 | 32.0%), and college / undergraduate (4 | 16.0%).
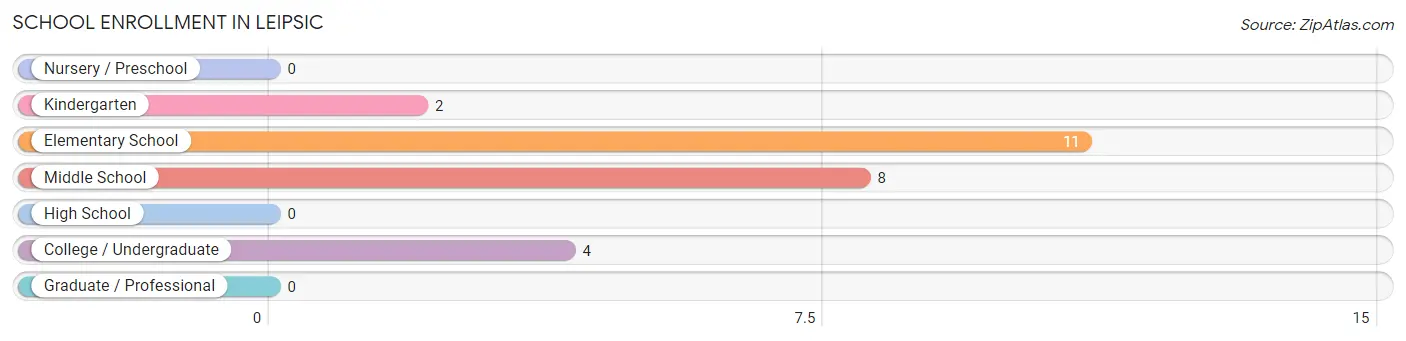
| School Level | # Students | % Students |
| Nursery / Preschool | 0 | 0.0% |
| Kindergarten | 2 | 8.0% |
| Elementary School | 11 | 44.0% |
| Middle School | 8 | 32.0% |
| High School | 0 | 0.0% |
| College / Undergraduate | 4 | 16.0% |
| Graduate / Professional | 0 | 0.0% |
| Total | 25 | 100.0% |
School Enrollment by Age by Funding Source in Leipsic
Out of a total of 25 students who are enrolled in schools in Leipsic, 15 (60.0%) attend a private institution, while the remaining 10 (40.0%) are enrolled in public schools. The age group of 10 to 14 year olds has the highest likelihood of being enrolled in private schools, with 15 (93.8% in the age bracket) enrolled. Conversely, the age group of 5 to 9 year old has the lowest likelihood of being enrolled in a private school, with 5 (100.0% in the age bracket) attending a public institution.
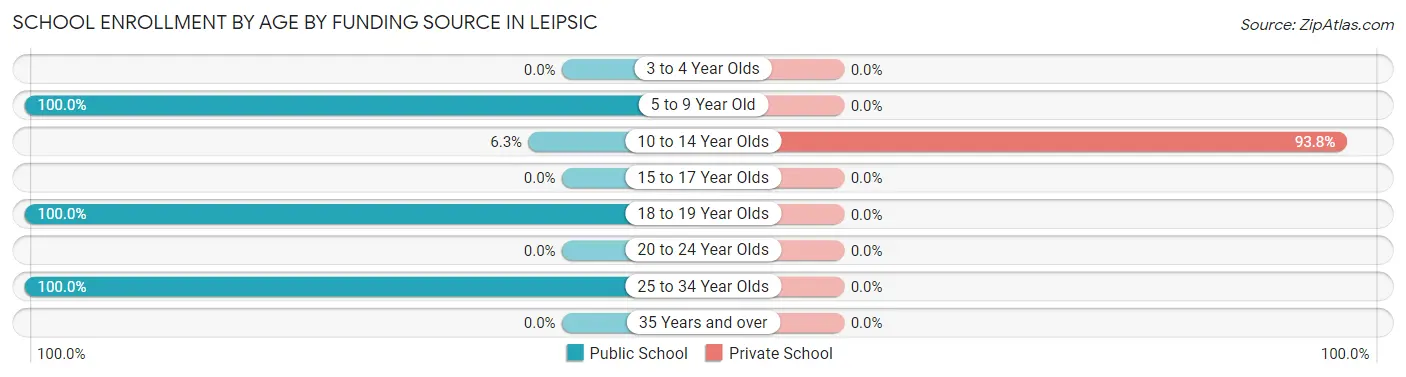
| Age Bracket | Public School | Private School |
| 3 to 4 Year Olds | 0 (0.0%) | 0 (0.0%) |
| 5 to 9 Year Old | 5 (100.0%) | 0 (0.0%) |
| 10 to 14 Year Olds | 1 (6.2%) | 15 (93.8%) |
| 15 to 17 Year Olds | 0 (0.0%) | 0 (0.0%) |
| 18 to 19 Year Olds | 2 (100.0%) | 0 (0.0%) |
| 20 to 24 Year Olds | 0 (0.0%) | 0 (0.0%) |
| 25 to 34 Year Olds | 2 (100.0%) | 0 (0.0%) |
| 35 Years and over | 0 (0.0%) | 0 (0.0%) |
| Total | 10 (40.0%) | 15 (60.0%) |
Educational Attainment by Field of Study in Leipsic
Science & technology (8 | 47.1%), business (4 | 23.5%), education (3 | 17.6%), and visual & performing arts (2 | 11.8%) are the most common fields of study among 17 individuals in Leipsic who have obtained a bachelor's degree or higher.
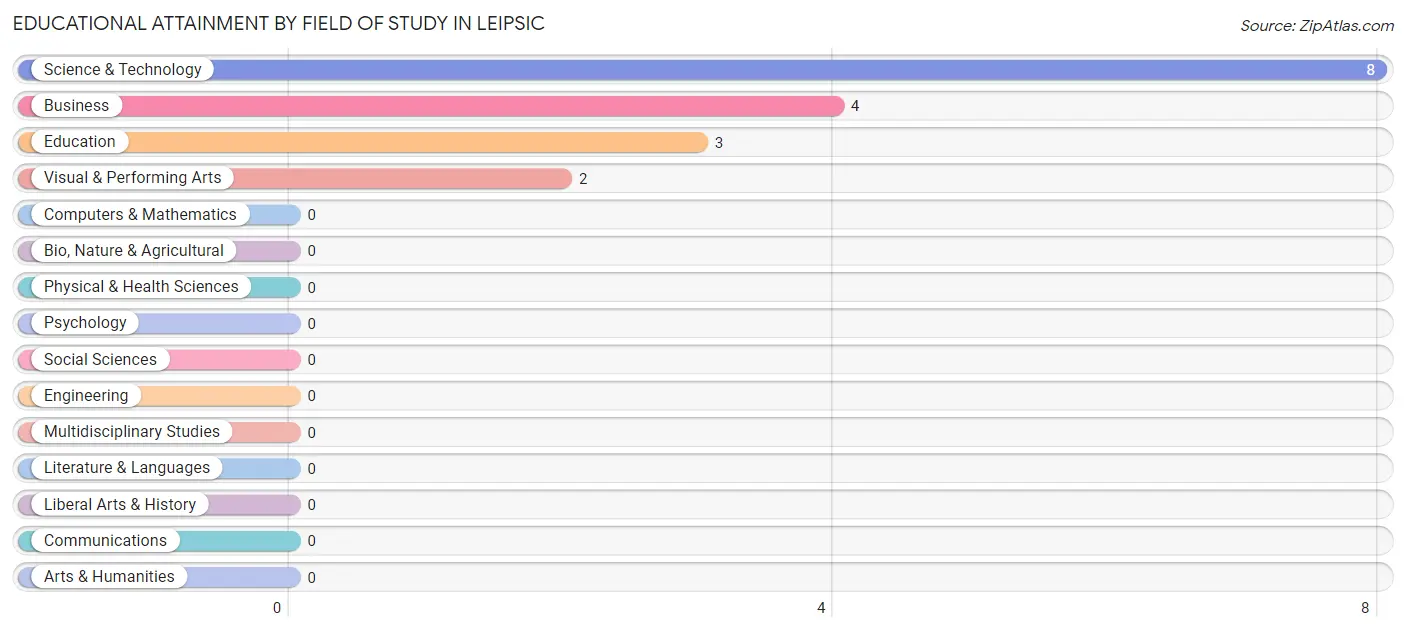
| Field of Study | # Graduates | % Graduates |
| Computers & Mathematics | 0 | 0.0% |
| Bio, Nature & Agricultural | 0 | 0.0% |
| Physical & Health Sciences | 0 | 0.0% |
| Psychology | 0 | 0.0% |
| Social Sciences | 0 | 0.0% |
| Engineering | 0 | 0.0% |
| Multidisciplinary Studies | 0 | 0.0% |
| Science & Technology | 8 | 47.1% |
| Business | 4 | 23.5% |
| Education | 3 | 17.6% |
| Literature & Languages | 0 | 0.0% |
| Liberal Arts & History | 0 | 0.0% |
| Visual & Performing Arts | 2 | 11.8% |
| Communications | 0 | 0.0% |
| Arts & Humanities | 0 | 0.0% |
| Total | 17 | 100.0% |
Transportation & Commute in Leipsic
Vehicle Availability by Sex in Leipsic
The most prevalent vehicle ownership categories in Leipsic are males with 2 vehicles (38, accounting for 66.7%) and females with 2 vehicles (5, making up 118.8%).
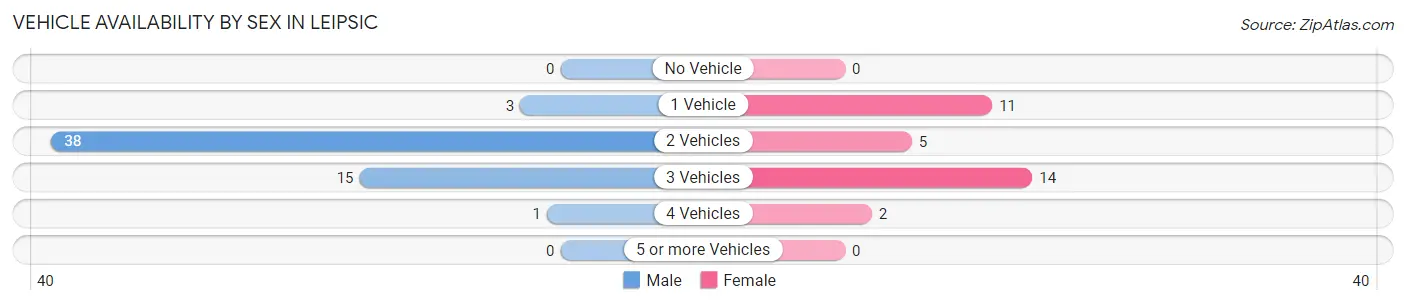
| Vehicles Available | Male | Female |
| No Vehicle | 0 (0.0%) | 0 (0.0%) |
| 1 Vehicle | 3 (5.3%) | 11 (34.4%) |
| 2 Vehicles | 38 (66.7%) | 5 (15.6%) |
| 3 Vehicles | 15 (26.3%) | 14 (43.8%) |
| 4 Vehicles | 1 (1.8%) | 2 (6.2%) |
| 5 or more Vehicles | 0 (0.0%) | 0 (0.0%) |
| Total | 57 (100.0%) | 32 (100.0%) |
Commute Time in Leipsic
The most frequently occuring commute durations in Leipsic are 10 to 14 minutes (16 commuters, 19.1%), 15 to 19 minutes (16 commuters, 19.1%), and 20 to 24 minutes (12 commuters, 14.3%).
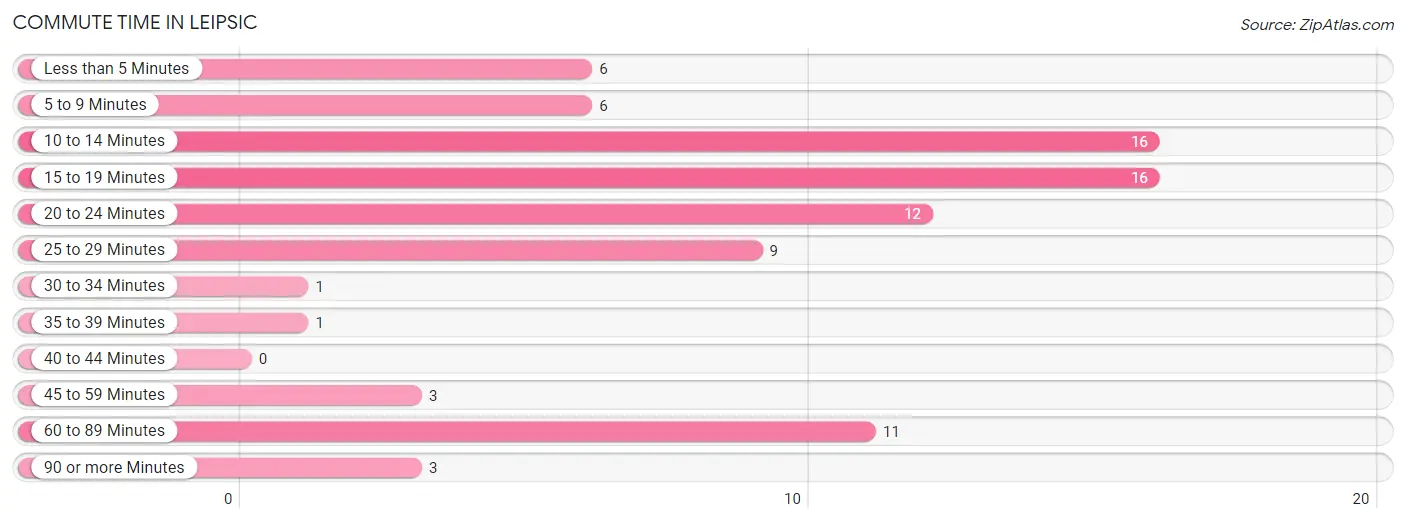
| Commute Time | # Commuters | % Commuters |
| Less than 5 Minutes | 6 | 7.1% |
| 5 to 9 Minutes | 6 | 7.1% |
| 10 to 14 Minutes | 16 | 19.1% |
| 15 to 19 Minutes | 16 | 19.1% |
| 20 to 24 Minutes | 12 | 14.3% |
| 25 to 29 Minutes | 9 | 10.7% |
| 30 to 34 Minutes | 1 | 1.2% |
| 35 to 39 Minutes | 1 | 1.2% |
| 40 to 44 Minutes | 0 | 0.0% |
| 45 to 59 Minutes | 3 | 3.6% |
| 60 to 89 Minutes | 11 | 13.1% |
| 90 or more Minutes | 3 | 3.6% |
Commute Time by Sex in Leipsic
The most common commute times in Leipsic are 10 to 14 minutes (11 commuters, 21.1%) for males and 20 to 24 minutes (9 commuters, 28.1%) for females.
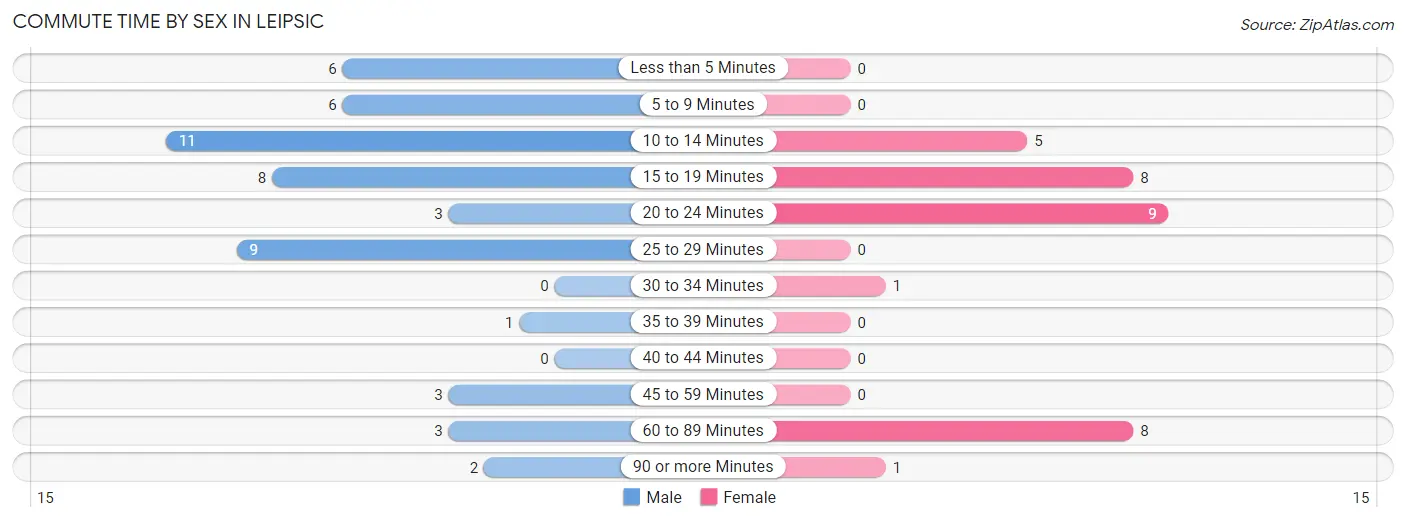
| Commute Time | Male | Female |
| Less than 5 Minutes | 6 (11.5%) | 0 (0.0%) |
| 5 to 9 Minutes | 6 (11.5%) | 0 (0.0%) |
| 10 to 14 Minutes | 11 (21.1%) | 5 (15.6%) |
| 15 to 19 Minutes | 8 (15.4%) | 8 (25.0%) |
| 20 to 24 Minutes | 3 (5.8%) | 9 (28.1%) |
| 25 to 29 Minutes | 9 (17.3%) | 0 (0.0%) |
| 30 to 34 Minutes | 0 (0.0%) | 1 (3.1%) |
| 35 to 39 Minutes | 1 (1.9%) | 0 (0.0%) |
| 40 to 44 Minutes | 0 (0.0%) | 0 (0.0%) |
| 45 to 59 Minutes | 3 (5.8%) | 0 (0.0%) |
| 60 to 89 Minutes | 3 (5.8%) | 8 (25.0%) |
| 90 or more Minutes | 2 (3.8%) | 1 (3.1%) |
Time of Departure to Work by Sex in Leipsic
The most frequent times of departure to work in Leipsic are 7:00 AM to 7:29 AM (21, 40.4%) for males and 6:00 AM to 6:29 AM (7, 21.9%) for females.
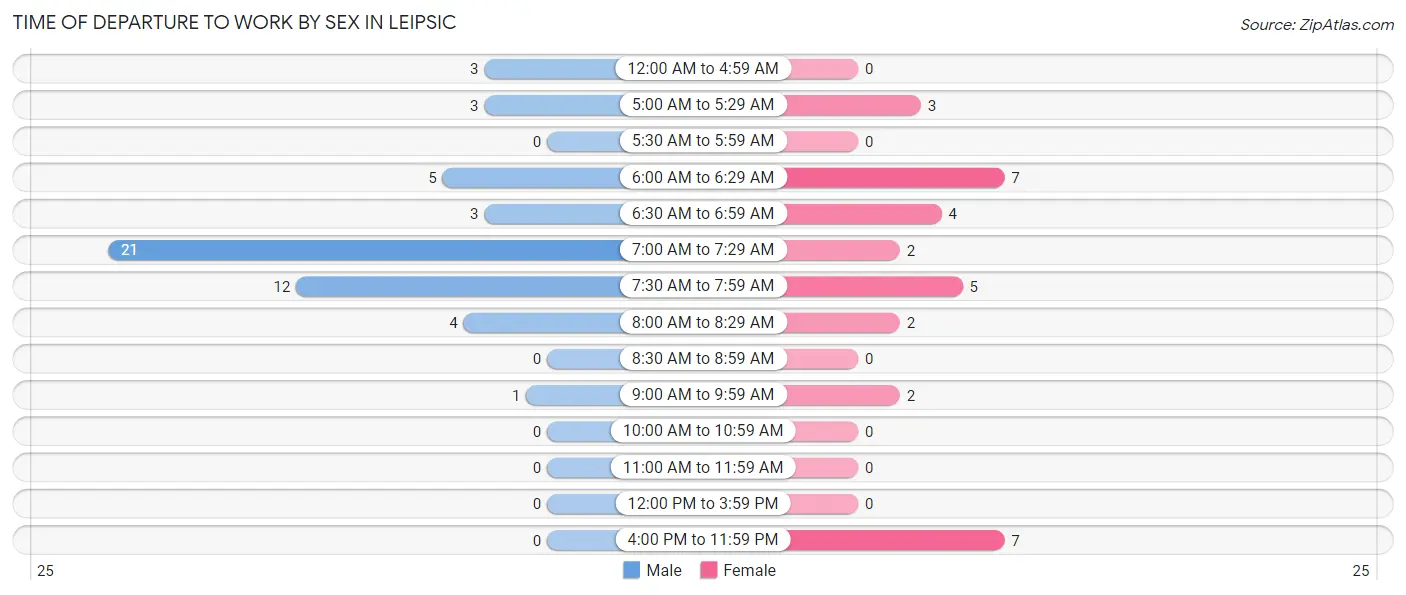
| Time of Departure | Male | Female |
| 12:00 AM to 4:59 AM | 3 (5.8%) | 0 (0.0%) |
| 5:00 AM to 5:29 AM | 3 (5.8%) | 3 (9.4%) |
| 5:30 AM to 5:59 AM | 0 (0.0%) | 0 (0.0%) |
| 6:00 AM to 6:29 AM | 5 (9.6%) | 7 (21.9%) |
| 6:30 AM to 6:59 AM | 3 (5.8%) | 4 (12.5%) |
| 7:00 AM to 7:29 AM | 21 (40.4%) | 2 (6.2%) |
| 7:30 AM to 7:59 AM | 12 (23.1%) | 5 (15.6%) |
| 8:00 AM to 8:29 AM | 4 (7.7%) | 2 (6.2%) |
| 8:30 AM to 8:59 AM | 0 (0.0%) | 0 (0.0%) |
| 9:00 AM to 9:59 AM | 1 (1.9%) | 2 (6.2%) |
| 10:00 AM to 10:59 AM | 0 (0.0%) | 0 (0.0%) |
| 11:00 AM to 11:59 AM | 0 (0.0%) | 0 (0.0%) |
| 12:00 PM to 3:59 PM | 0 (0.0%) | 0 (0.0%) |
| 4:00 PM to 11:59 PM | 0 (0.0%) | 7 (21.9%) |
| Total | 52 (100.0%) | 32 (100.0%) |
Housing Occupancy in Leipsic
Occupancy by Ownership in Leipsic
Of the total 79 dwellings in Leipsic, owner-occupied units account for 42 (53.2%), while renter-occupied units make up 37 (46.8%).
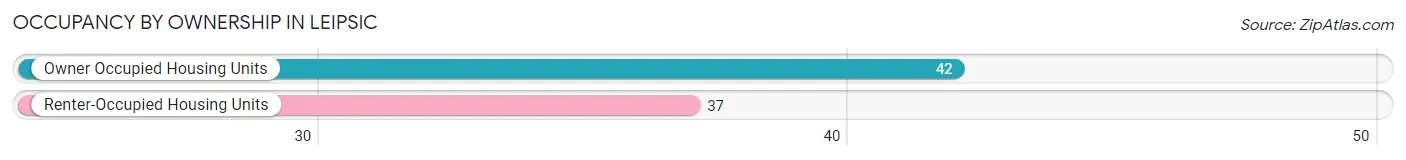
| Occupancy | # Housing Units | % Housing Units |
| Owner Occupied Housing Units | 42 | 53.2% |
| Renter-Occupied Housing Units | 37 | 46.8% |
| Total Occupied Housing Units | 79 | 100.0% |
Occupancy by Household Size in Leipsic
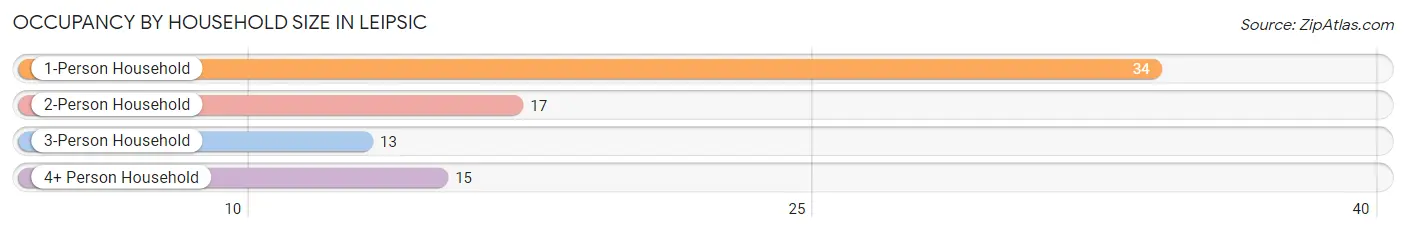
| Household Size | # Housing Units | % Housing Units |
| 1-Person Household | 34 | 43.0% |
| 2-Person Household | 17 | 21.5% |
| 3-Person Household | 13 | 16.5% |
| 4+ Person Household | 15 | 19.0% |
| Total Housing Units | 79 | 100.0% |
Occupancy by Ownership by Household Size in Leipsic
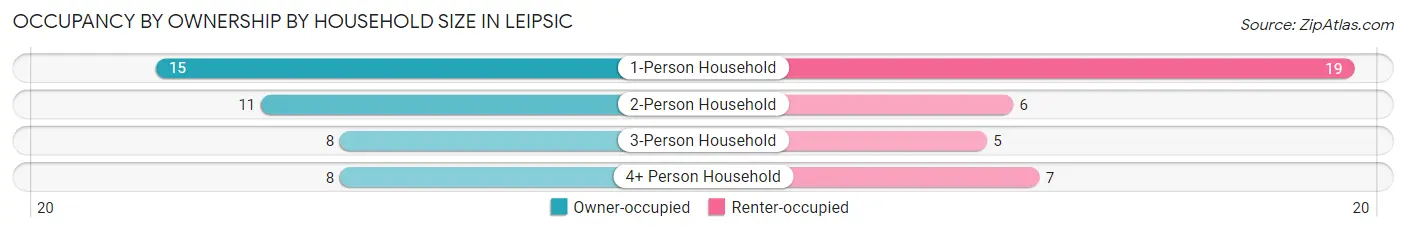
| Household Size | Owner-occupied | Renter-occupied |
| 1-Person Household | 15 (44.1%) | 19 (55.9%) |
| 2-Person Household | 11 (64.7%) | 6 (35.3%) |
| 3-Person Household | 8 (61.5%) | 5 (38.5%) |
| 4+ Person Household | 8 (53.3%) | 7 (46.7%) |
| Total Housing Units | 42 (53.2%) | 37 (46.8%) |
Occupancy by Educational Attainment in Leipsic
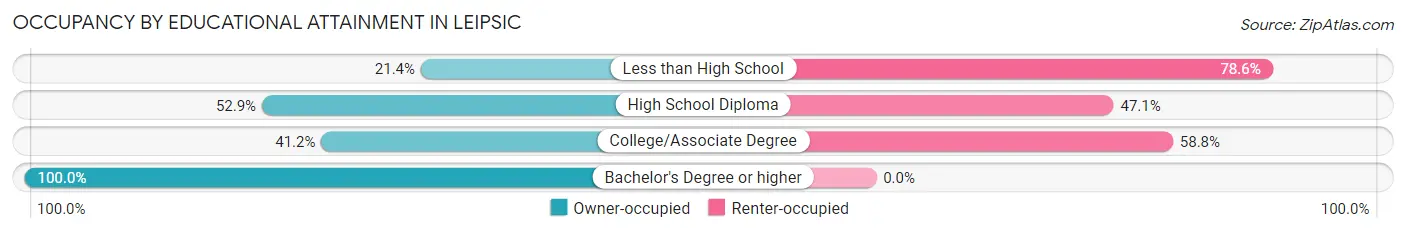
| Household Size | Owner-occupied | Renter-occupied |
| Less than High School | 3 (21.4%) | 11 (78.6%) |
| High School Diploma | 18 (52.9%) | 16 (47.1%) |
| College/Associate Degree | 7 (41.2%) | 10 (58.8%) |
| Bachelor's Degree or higher | 14 (100.0%) | 0 (0.0%) |
Occupancy by Age of Householder in Leipsic
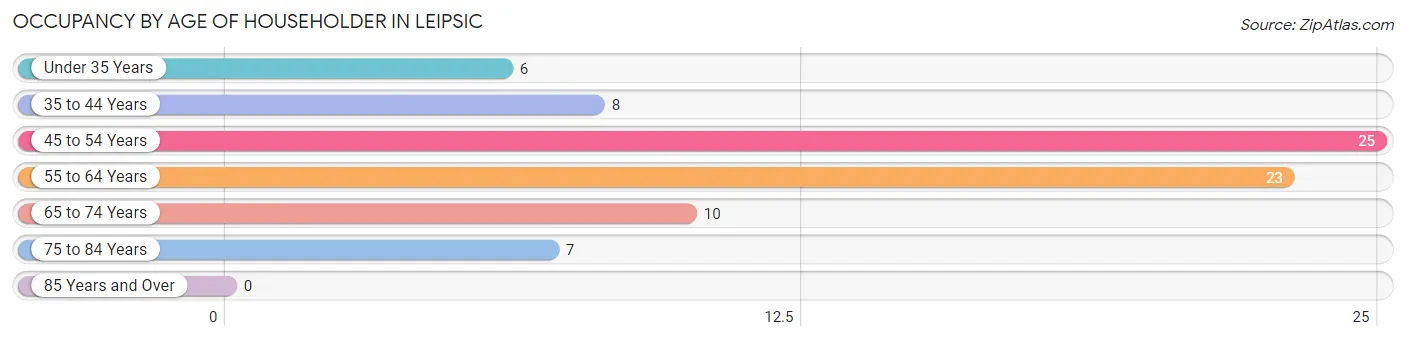
| Age Bracket | # Households | % Households |
| Under 35 Years | 6 | 7.6% |
| 35 to 44 Years | 8 | 10.1% |
| 45 to 54 Years | 25 | 31.7% |
| 55 to 64 Years | 23 | 29.1% |
| 65 to 74 Years | 10 | 12.7% |
| 75 to 84 Years | 7 | 8.9% |
| 85 Years and Over | 0 | 0.0% |
| Total | 79 | 100.0% |
Housing Finances in Leipsic
Median Income by Occupancy in Leipsic
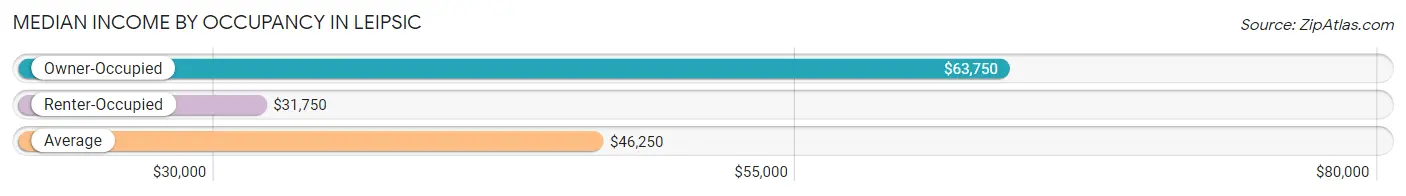
| Occupancy Type | # Households | Median Income |
| Owner-Occupied | 42 (53.2%) | $63,750 |
| Renter-Occupied | 37 (46.8%) | $31,750 |
| Average | 79 (100.0%) | $46,250 |
Occupancy by Householder Income Bracket in Leipsic
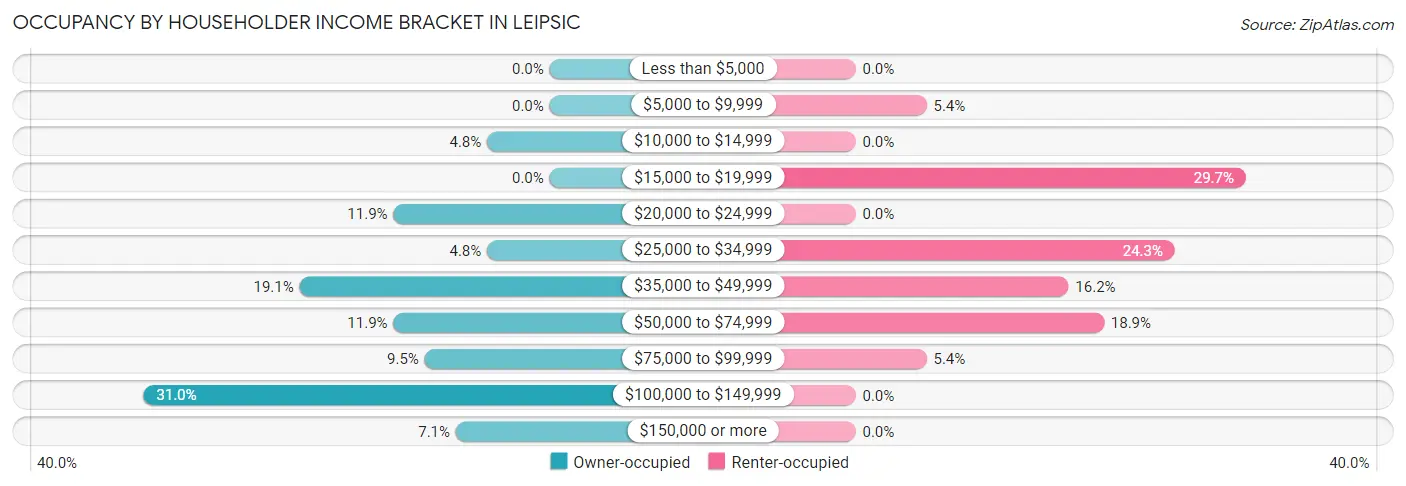
| Income Bracket | Owner-occupied | Renter-occupied |
| Less than $5,000 | 0 (0.0%) | 0 (0.0%) |
| $5,000 to $9,999 | 0 (0.0%) | 2 (5.4%) |
| $10,000 to $14,999 | 2 (4.8%) | 0 (0.0%) |
| $15,000 to $19,999 | 0 (0.0%) | 11 (29.7%) |
| $20,000 to $24,999 | 5 (11.9%) | 0 (0.0%) |
| $25,000 to $34,999 | 2 (4.8%) | 9 (24.3%) |
| $35,000 to $49,999 | 8 (19.1%) | 6 (16.2%) |
| $50,000 to $74,999 | 5 (11.9%) | 7 (18.9%) |
| $75,000 to $99,999 | 4 (9.5%) | 2 (5.4%) |
| $100,000 to $149,999 | 13 (30.9%) | 0 (0.0%) |
| $150,000 or more | 3 (7.1%) | 0 (0.0%) |
| Total | 42 (100.0%) | 37 (100.0%) |
Monthly Housing Cost Tiers in Leipsic
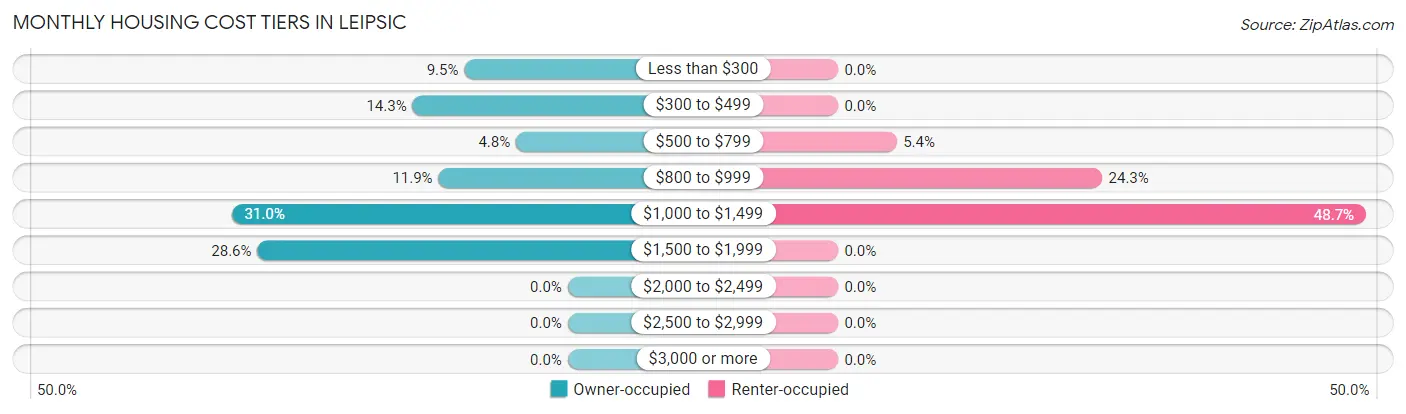
| Monthly Cost | Owner-occupied | Renter-occupied |
| Less than $300 | 4 (9.5%) | 0 (0.0%) |
| $300 to $499 | 6 (14.3%) | 0 (0.0%) |
| $500 to $799 | 2 (4.8%) | 2 (5.4%) |
| $800 to $999 | 5 (11.9%) | 9 (24.3%) |
| $1,000 to $1,499 | 13 (30.9%) | 18 (48.6%) |
| $1,500 to $1,999 | 12 (28.6%) | 0 (0.0%) |
| $2,000 to $2,499 | 0 (0.0%) | 0 (0.0%) |
| $2,500 to $2,999 | 0 (0.0%) | 0 (0.0%) |
| $3,000 or more | 0 (0.0%) | 0 (0.0%) |
| Total | 42 (100.0%) | 37 (100.0%) |
Physical Housing Characteristics in Leipsic
Housing Structures in Leipsic
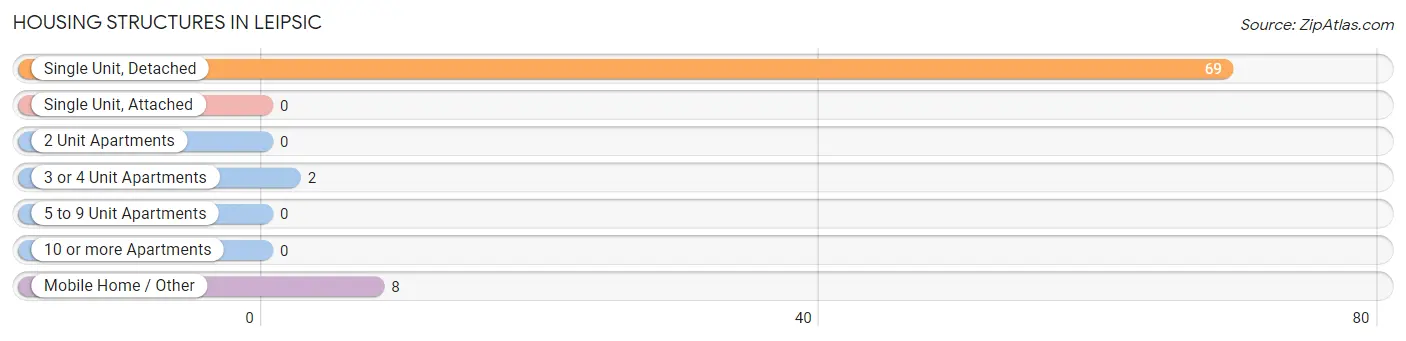
| Structure Type | # Housing Units | % Housing Units |
| Single Unit, Detached | 69 | 87.3% |
| Single Unit, Attached | 0 | 0.0% |
| 2 Unit Apartments | 0 | 0.0% |
| 3 or 4 Unit Apartments | 2 | 2.5% |
| 5 to 9 Unit Apartments | 0 | 0.0% |
| 10 or more Apartments | 0 | 0.0% |
| Mobile Home / Other | 8 | 10.1% |
| Total | 79 | 100.0% |
Housing Structures by Occupancy in Leipsic
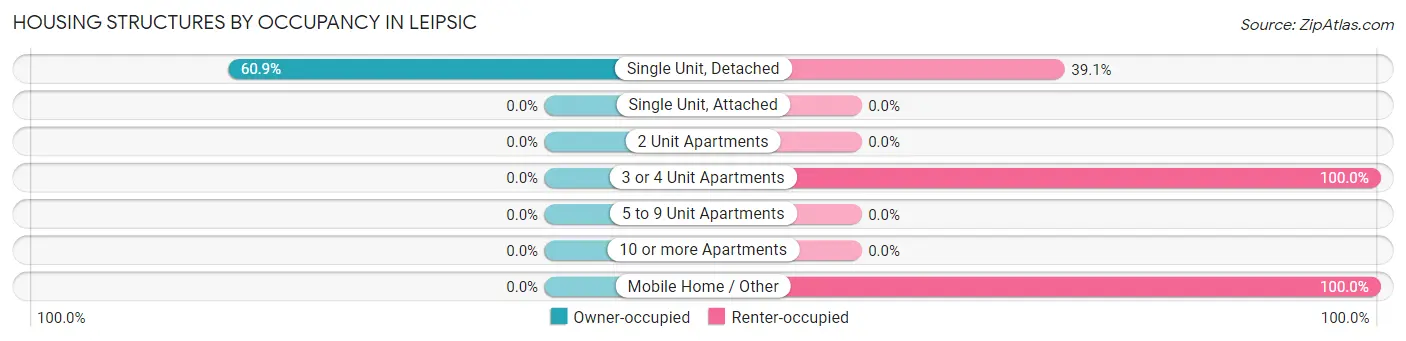
| Structure Type | Owner-occupied | Renter-occupied |
| Single Unit, Detached | 42 (60.9%) | 27 (39.1%) |
| Single Unit, Attached | 0 (0.0%) | 0 (0.0%) |
| 2 Unit Apartments | 0 (0.0%) | 0 (0.0%) |
| 3 or 4 Unit Apartments | 0 (0.0%) | 2 (100.0%) |
| 5 to 9 Unit Apartments | 0 (0.0%) | 0 (0.0%) |
| 10 or more Apartments | 0 (0.0%) | 0 (0.0%) |
| Mobile Home / Other | 0 (0.0%) | 8 (100.0%) |
| Total | 42 (53.2%) | 37 (46.8%) |
Housing Structures by Number of Rooms in Leipsic
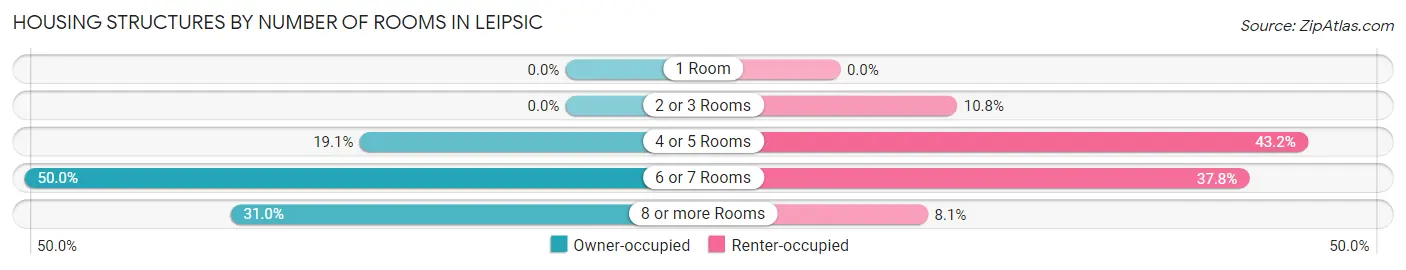
| Number of Rooms | Owner-occupied | Renter-occupied |
| 1 Room | 0 (0.0%) | 0 (0.0%) |
| 2 or 3 Rooms | 0 (0.0%) | 4 (10.8%) |
| 4 or 5 Rooms | 8 (19.1%) | 16 (43.2%) |
| 6 or 7 Rooms | 21 (50.0%) | 14 (37.8%) |
| 8 or more Rooms | 13 (30.9%) | 3 (8.1%) |
| Total | 42 (100.0%) | 37 (100.0%) |
Housing Structure by Heating Type in Leipsic
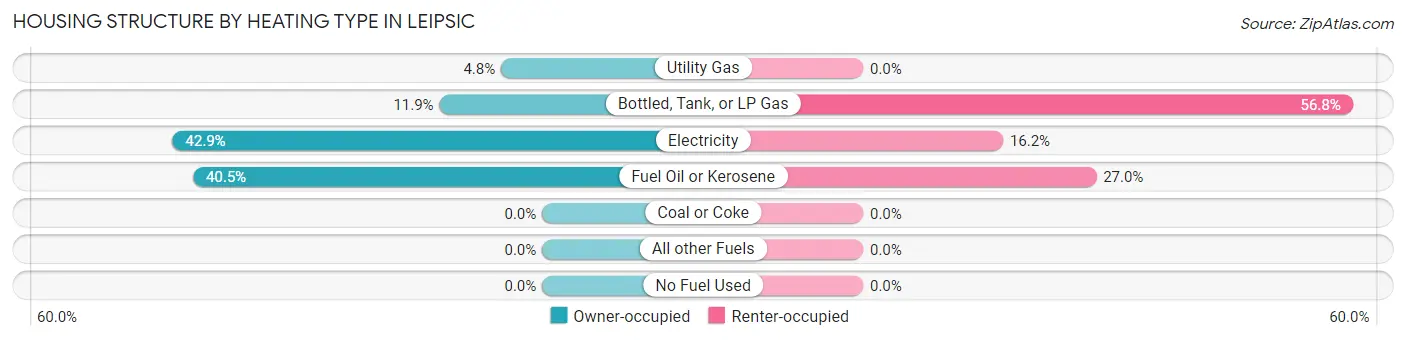
| Heating Type | Owner-occupied | Renter-occupied |
| Utility Gas | 2 (4.8%) | 0 (0.0%) |
| Bottled, Tank, or LP Gas | 5 (11.9%) | 21 (56.8%) |
| Electricity | 18 (42.9%) | 6 (16.2%) |
| Fuel Oil or Kerosene | 17 (40.5%) | 10 (27.0%) |
| Coal or Coke | 0 (0.0%) | 0 (0.0%) |
| All other Fuels | 0 (0.0%) | 0 (0.0%) |
| No Fuel Used | 0 (0.0%) | 0 (0.0%) |
| Total | 42 (100.0%) | 37 (100.0%) |
Household Vehicle Usage in Leipsic
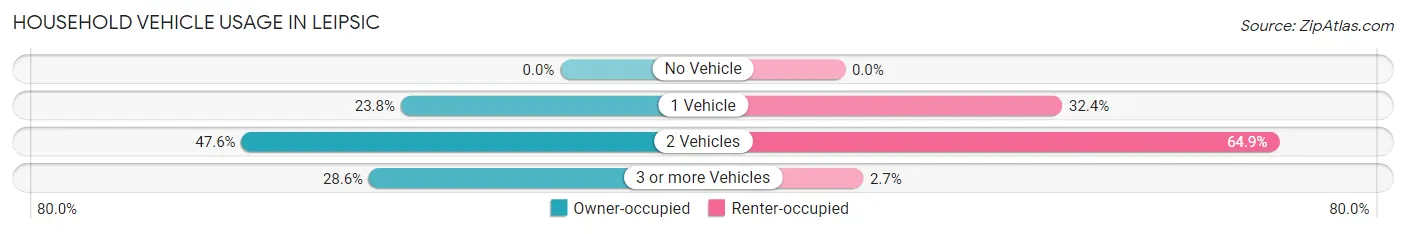
| Vehicles per Household | Owner-occupied | Renter-occupied |
| No Vehicle | 0 (0.0%) | 0 (0.0%) |
| 1 Vehicle | 10 (23.8%) | 12 (32.4%) |
| 2 Vehicles | 20 (47.6%) | 24 (64.9%) |
| 3 or more Vehicles | 12 (28.6%) | 1 (2.7%) |
| Total | 42 (100.0%) | 37 (100.0%) |
Real Estate & Mortgages in Leipsic
Real Estate and Mortgage Overview in Leipsic
| Characteristic | Without Mortgage | With Mortgage |
| Housing Units | 10 | 32 |
| Median Property Value | $175,000 | $220,000 |
| Median Household Income | - | - |
| Monthly Housing Costs | $375 | $0 |
| Real Estate Taxes | $917 | $5 |
Property Value by Mortgage Status in Leipsic
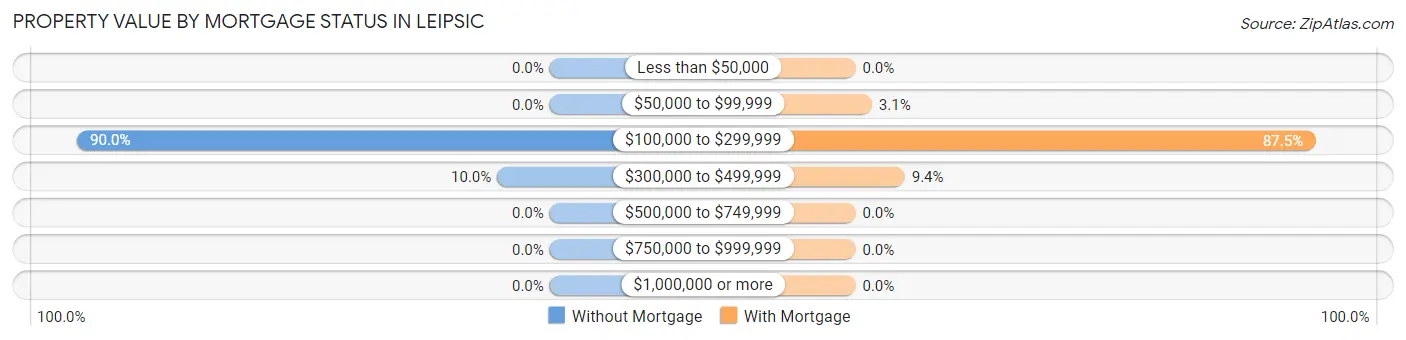
| Property Value | Without Mortgage | With Mortgage |
| Less than $50,000 | 0 (0.0%) | 0 (0.0%) |
| $50,000 to $99,999 | 0 (0.0%) | 1 (3.1%) |
| $100,000 to $299,999 | 9 (90.0%) | 28 (87.5%) |
| $300,000 to $499,999 | 1 (10.0%) | 3 (9.4%) |
| $500,000 to $749,999 | 0 (0.0%) | 0 (0.0%) |
| $750,000 to $999,999 | 0 (0.0%) | 0 (0.0%) |
| $1,000,000 or more | 0 (0.0%) | 0 (0.0%) |
| Total | 10 (100.0%) | 32 (100.0%) |
Household Income by Mortgage Status in Leipsic
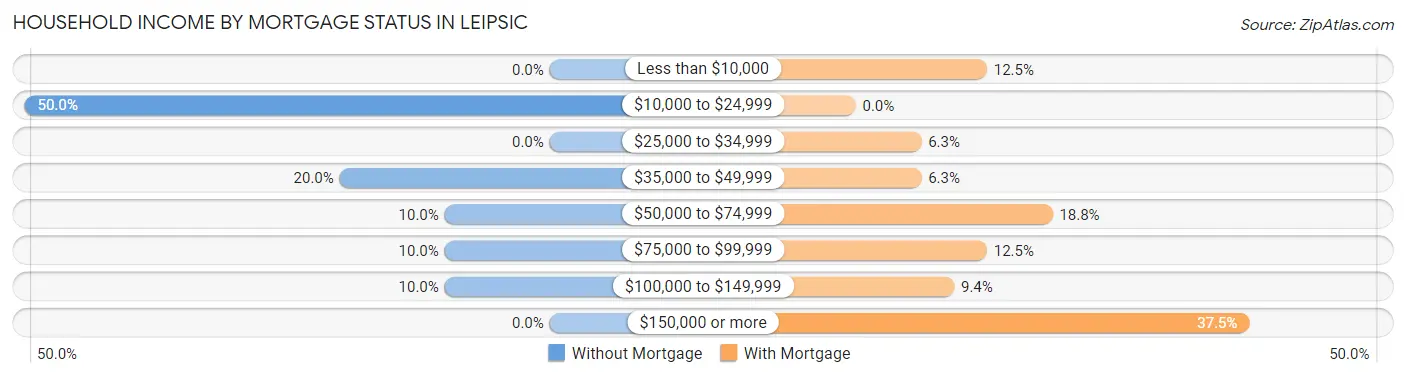
| Household Income | Without Mortgage | With Mortgage |
| Less than $10,000 | 0 (0.0%) | 4 (12.5%) |
| $10,000 to $24,999 | 5 (50.0%) | 0 (0.0%) |
| $25,000 to $34,999 | 0 (0.0%) | 2 (6.2%) |
| $35,000 to $49,999 | 2 (20.0%) | 2 (6.2%) |
| $50,000 to $74,999 | 1 (10.0%) | 6 (18.8%) |
| $75,000 to $99,999 | 1 (10.0%) | 4 (12.5%) |
| $100,000 to $149,999 | 1 (10.0%) | 3 (9.4%) |
| $150,000 or more | 0 (0.0%) | 12 (37.5%) |
| Total | 10 (100.0%) | 32 (100.0%) |
Property Value to Household Income Ratio in Leipsic
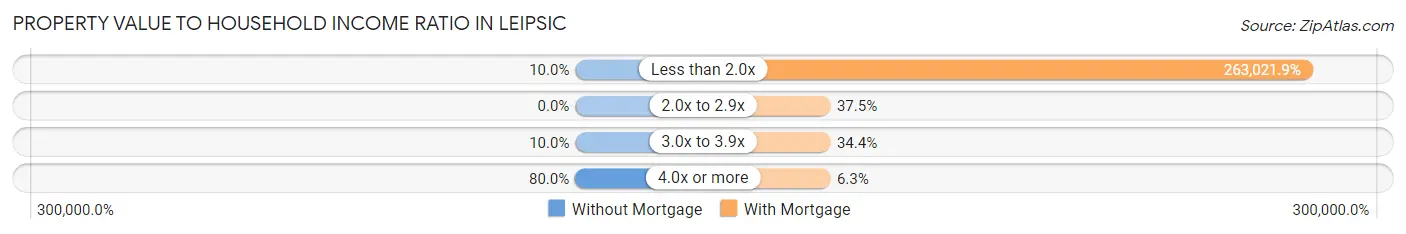
| Value-to-Income Ratio | Without Mortgage | With Mortgage |
| Less than 2.0x | 1 (10.0%) | 84,167 (263,021.9%) |
| 2.0x to 2.9x | 0 (0.0%) | 12 (37.5%) |
| 3.0x to 3.9x | 1 (10.0%) | 11 (34.4%) |
| 4.0x or more | 8 (80.0%) | 2 (6.2%) |
| Total | 10 (100.0%) | 32 (100.0%) |
Real Estate Taxes by Mortgage Status in Leipsic
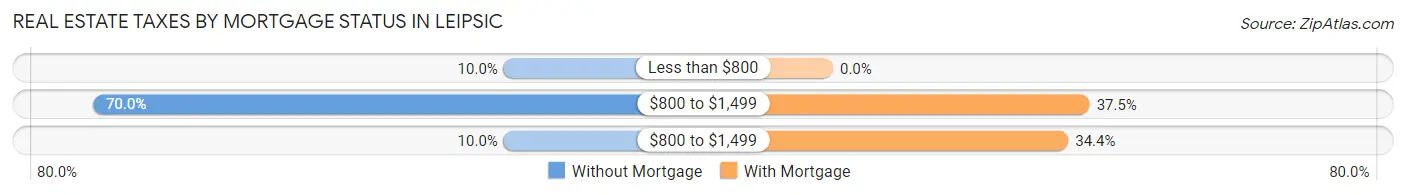
| Property Taxes | Without Mortgage | With Mortgage |
| Less than $800 | 1 (10.0%) | 0 (0.0%) |
| $800 to $1,499 | 7 (70.0%) | 12 (37.5%) |
| $800 to $1,499 | 1 (10.0%) | 11 (34.4%) |
| Total | 10 (100.0%) | 32 (100.0%) |
Health & Disability in Leipsic
Health Insurance Coverage by Age in Leipsic
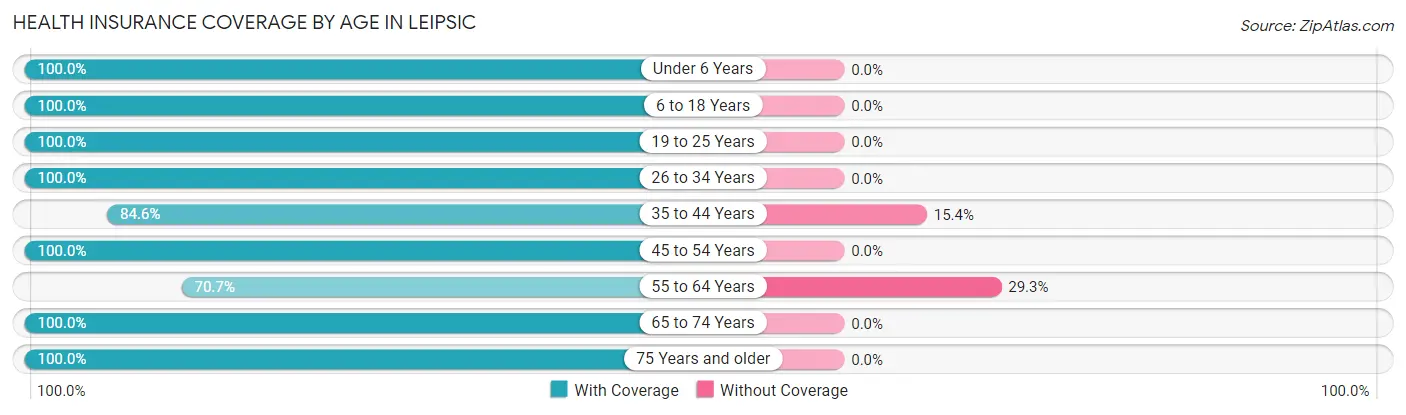
| Age Bracket | With Coverage | Without Coverage |
| Under 6 Years | 1 (100.0%) | 0 (0.0%) |
| 6 to 18 Years | 34 (100.0%) | 0 (0.0%) |
| 19 to 25 Years | 6 (100.0%) | 0 (0.0%) |
| 26 to 34 Years | 13 (100.0%) | 0 (0.0%) |
| 35 to 44 Years | 11 (84.6%) | 2 (15.4%) |
| 45 to 54 Years | 43 (100.0%) | 0 (0.0%) |
| 55 to 64 Years | 29 (70.7%) | 12 (29.3%) |
| 65 to 74 Years | 10 (100.0%) | 0 (0.0%) |
| 75 Years and older | 10 (100.0%) | 0 (0.0%) |
| Total | 157 (91.8%) | 14 (8.2%) |
Health Insurance Coverage by Citizenship Status in Leipsic
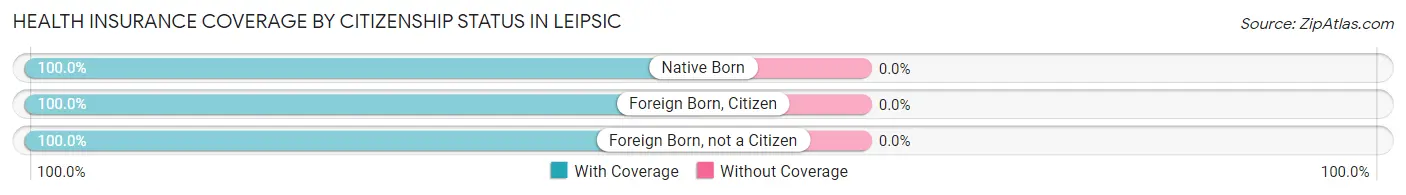
| Citizenship Status | With Coverage | Without Coverage |
| Native Born | 1 (100.0%) | 0 (0.0%) |
| Foreign Born, Citizen | 34 (100.0%) | 0 (0.0%) |
| Foreign Born, not a Citizen | 6 (100.0%) | 0 (0.0%) |
Health Insurance Coverage by Household Income in Leipsic
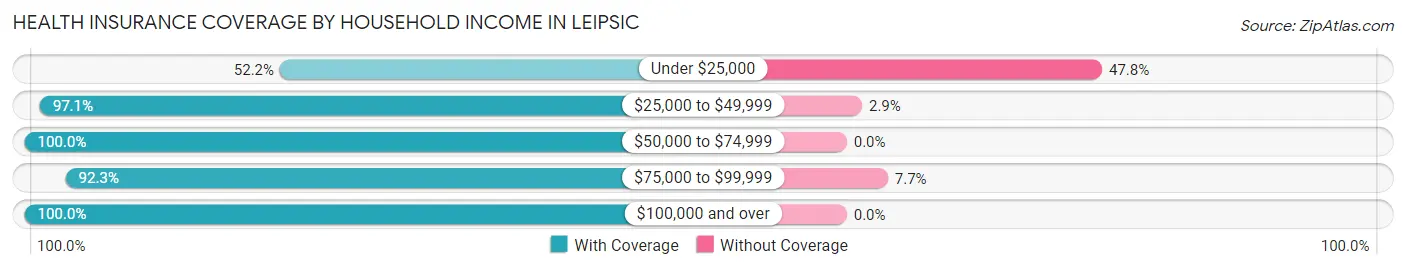
| Household Income | With Coverage | Without Coverage |
| Under $25,000 | 12 (52.2%) | 11 (47.8%) |
| $25,000 to $49,999 | 68 (97.1%) | 2 (2.9%) |
| $50,000 to $74,999 | 18 (100.0%) | 0 (0.0%) |
| $75,000 to $99,999 | 12 (92.3%) | 1 (7.7%) |
| $100,000 and over | 47 (100.0%) | 0 (0.0%) |
Public vs Private Health Insurance Coverage by Age in Leipsic
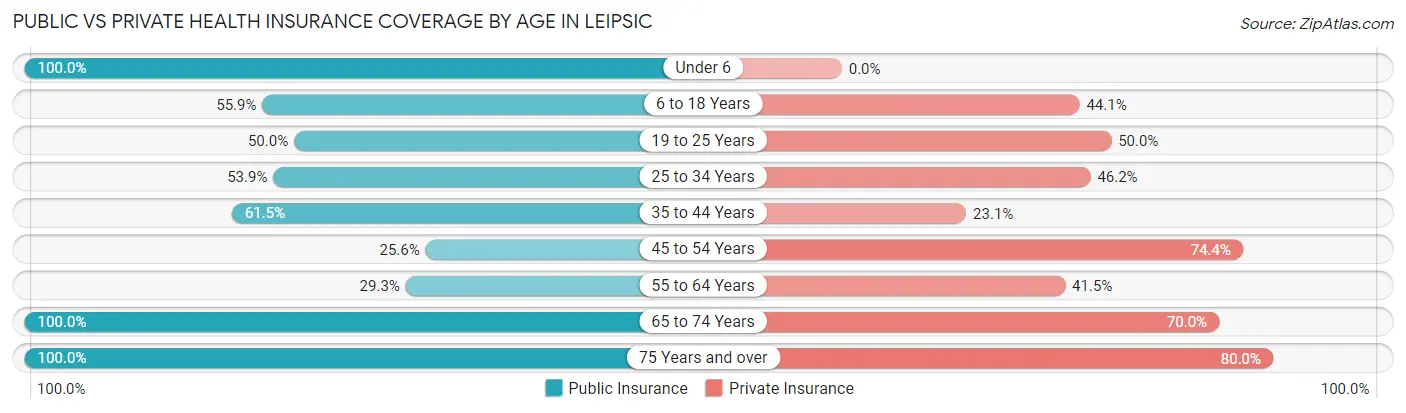
| Age Bracket | Public Insurance | Private Insurance |
| Under 6 | 1 (100.0%) | 0 (0.0%) |
| 6 to 18 Years | 19 (55.9%) | 15 (44.1%) |
| 19 to 25 Years | 3 (50.0%) | 3 (50.0%) |
| 25 to 34 Years | 7 (53.8%) | 6 (46.2%) |
| 35 to 44 Years | 8 (61.5%) | 3 (23.1%) |
| 45 to 54 Years | 11 (25.6%) | 32 (74.4%) |
| 55 to 64 Years | 12 (29.3%) | 17 (41.5%) |
| 65 to 74 Years | 10 (100.0%) | 7 (70.0%) |
| 75 Years and over | 10 (100.0%) | 8 (80.0%) |
| Total | 81 (47.4%) | 91 (53.2%) |
Disability Status by Sex by Age in Leipsic
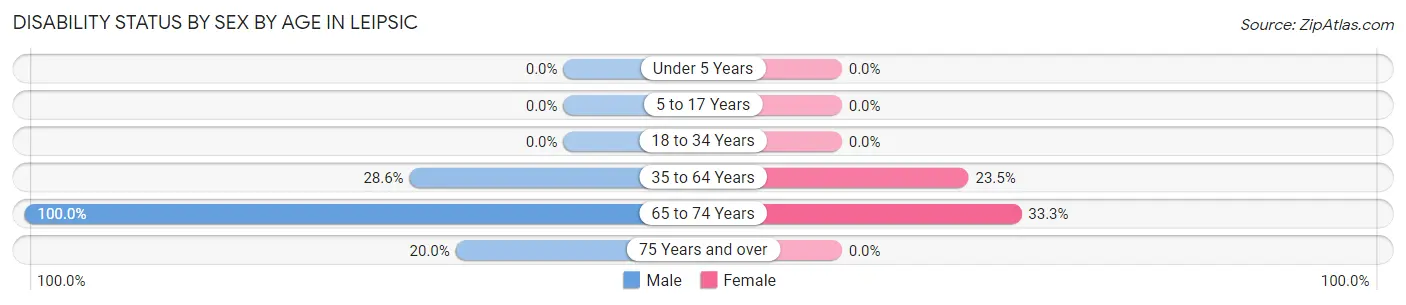
| Age Bracket | Male | Female |
| Under 5 Years | 0 (0.0%) | 0 (0.0%) |
| 5 to 17 Years | 0 (0.0%) | 0 (0.0%) |
| 18 to 34 Years | 0 (0.0%) | 0 (0.0%) |
| 35 to 64 Years | 18 (28.6%) | 8 (23.5%) |
| 65 to 74 Years | 4 (100.0%) | 2 (33.3%) |
| 75 Years and over | 1 (20.0%) | 0 (0.0%) |
Disability Class by Sex by Age in Leipsic
Disability Class: Hearing Difficulty
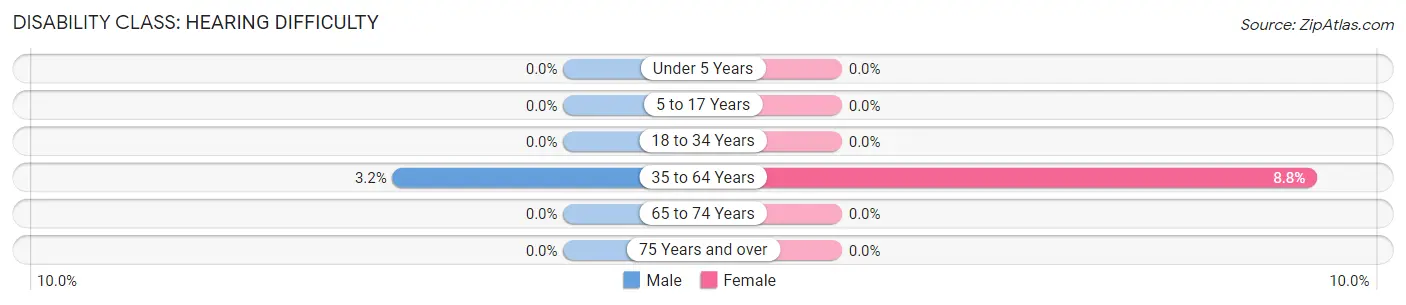
| Age Bracket | Male | Female |
| Under 5 Years | 0 (0.0%) | 0 (0.0%) |
| 5 to 17 Years | 0 (0.0%) | 0 (0.0%) |
| 18 to 34 Years | 0 (0.0%) | 0 (0.0%) |
| 35 to 64 Years | 2 (3.2%) | 3 (8.8%) |
| 65 to 74 Years | 0 (0.0%) | 0 (0.0%) |
| 75 Years and over | 0 (0.0%) | 0 (0.0%) |
Disability Class: Vision Difficulty
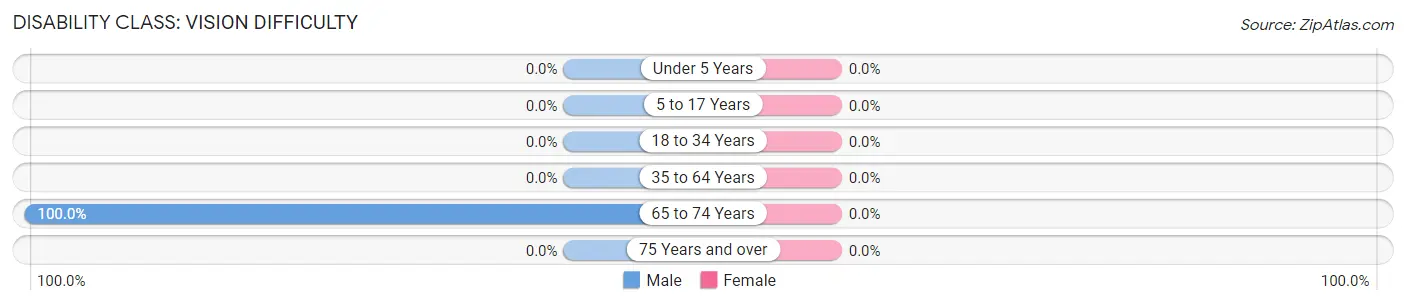
| Age Bracket | Male | Female |
| Under 5 Years | 0 (0.0%) | 0 (0.0%) |
| 5 to 17 Years | 0 (0.0%) | 0 (0.0%) |
| 18 to 34 Years | 0 (0.0%) | 0 (0.0%) |
| 35 to 64 Years | 0 (0.0%) | 0 (0.0%) |
| 65 to 74 Years | 4 (100.0%) | 0 (0.0%) |
| 75 Years and over | 0 (0.0%) | 0 (0.0%) |
Disability Class: Cognitive Difficulty
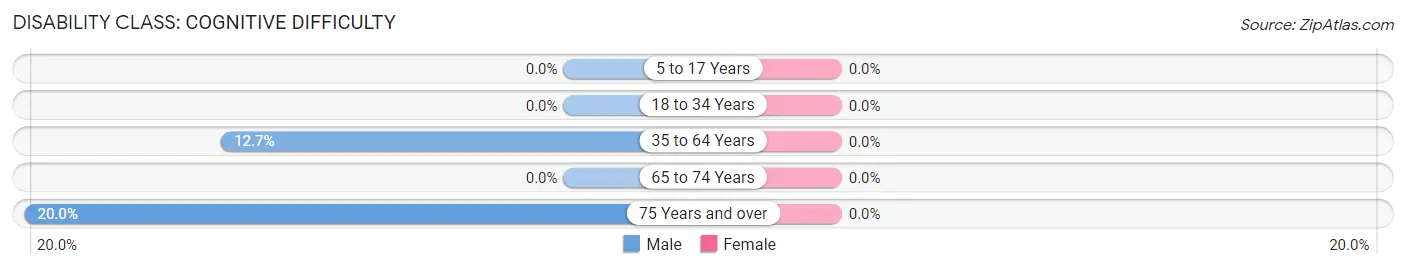
| Age Bracket | Male | Female |
| 5 to 17 Years | 0 (0.0%) | 0 (0.0%) |
| 18 to 34 Years | 0 (0.0%) | 0 (0.0%) |
| 35 to 64 Years | 8 (12.7%) | 0 (0.0%) |
| 65 to 74 Years | 0 (0.0%) | 0 (0.0%) |
| 75 Years and over | 1 (20.0%) | 0 (0.0%) |
Disability Class: Ambulatory Difficulty
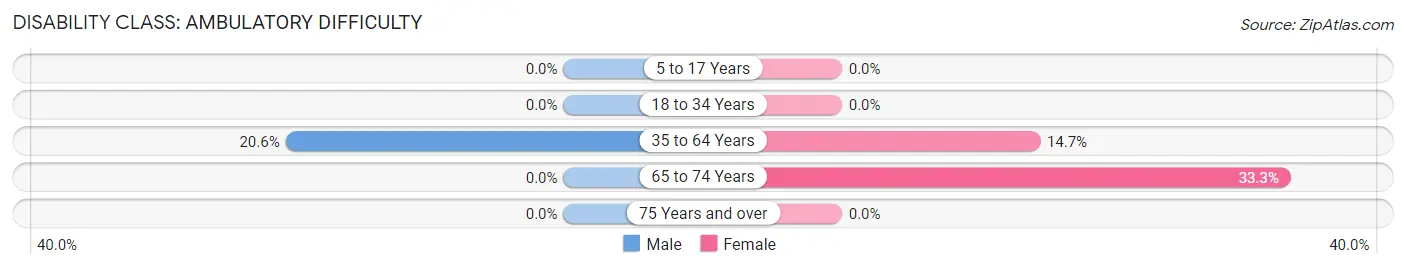
| Age Bracket | Male | Female |
| 5 to 17 Years | 0 (0.0%) | 0 (0.0%) |
| 18 to 34 Years | 0 (0.0%) | 0 (0.0%) |
| 35 to 64 Years | 13 (20.6%) | 5 (14.7%) |
| 65 to 74 Years | 0 (0.0%) | 2 (33.3%) |
| 75 Years and over | 0 (0.0%) | 0 (0.0%) |
Disability Class: Self-Care Difficulty
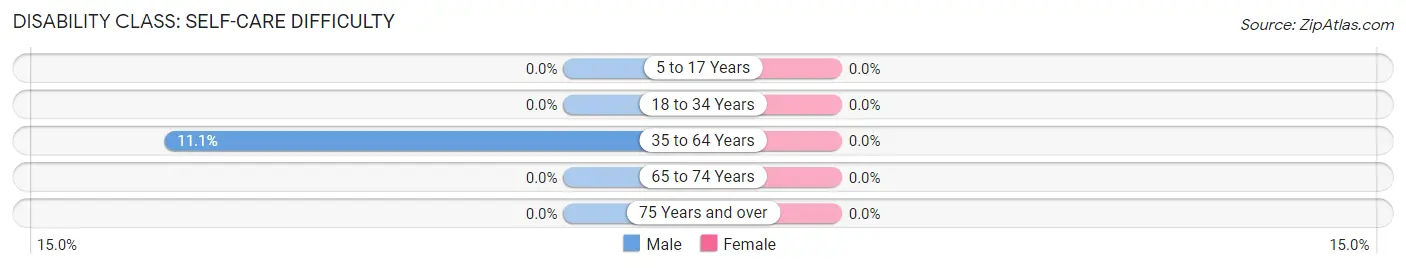
| Age Bracket | Male | Female |
| 5 to 17 Years | 0 (0.0%) | 0 (0.0%) |
| 18 to 34 Years | 0 (0.0%) | 0 (0.0%) |
| 35 to 64 Years | 7 (11.1%) | 0 (0.0%) |
| 65 to 74 Years | 0 (0.0%) | 0 (0.0%) |
| 75 Years and over | 0 (0.0%) | 0 (0.0%) |
Technology Access in Leipsic
Computing Device Access in Leipsic
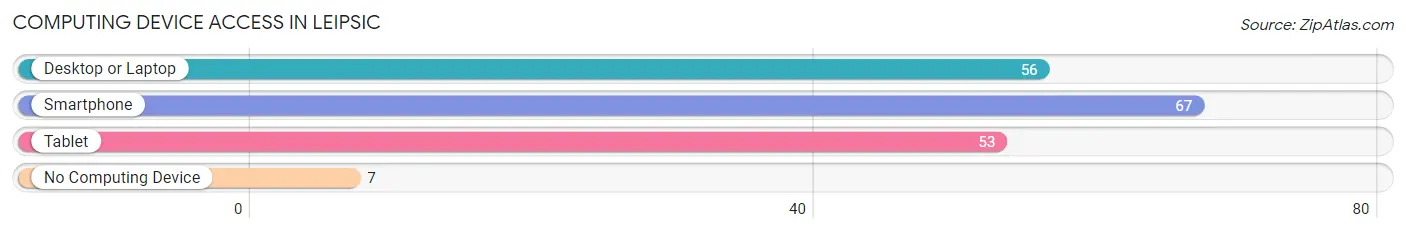
| Device Type | # Households | % Households |
| Desktop or Laptop | 56 | 70.9% |
| Smartphone | 67 | 84.8% |
| Tablet | 53 | 67.1% |
| No Computing Device | 7 | 8.9% |
| Total | 79 | 100.0% |
Internet Access in Leipsic
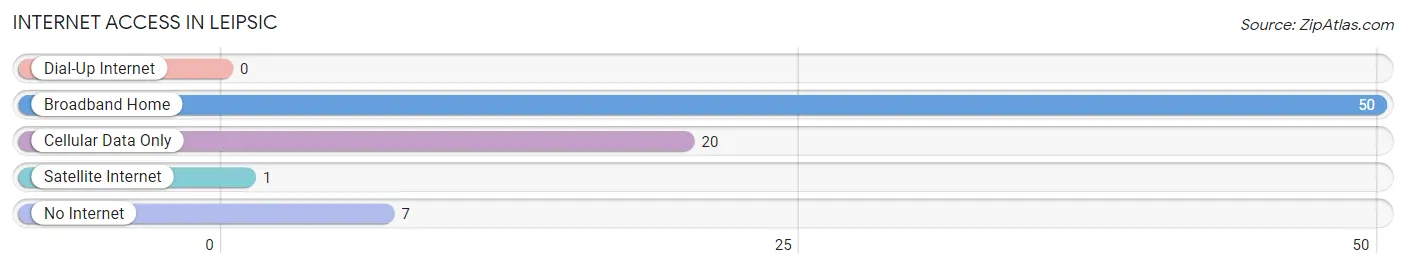
| Internet Type | # Households | % Households |
| Dial-Up Internet | 0 | 0.0% |
| Broadband Home | 50 | 63.3% |
| Cellular Data Only | 20 | 25.3% |
| Satellite Internet | 1 | 1.3% |
| No Internet | 7 | 8.9% |
| Total | 79 | 100.0% |
Leipsic Summary
Leipsic is a city located in the state of Saxony in Germany. It is the largest city in the state and the second largest in the country. It is located on the banks of the Elbe River and is known for its rich cultural heritage and its vibrant economy.
History
Leipsic has a long and rich history that dates back to the 11th century. It was first mentioned in a document in 1075 and was granted city rights in 1165. During the Middle Ages, Leipsic was an important trading center and was home to a number of merchants and craftsmen. It was also an important center of learning and was home to the University of Leipsic, which was founded in 1409.
In the 16th century, Leipsic became a major center of the Protestant Reformation and was home to Martin Luther and other prominent reformers. During the Thirty Years War, Leipsic was occupied by the Swedes and was heavily damaged. In the 18th century, Leipsic was an important center of the Enlightenment and was home to many prominent philosophers and writers.
In the 19th century, Leipsic was an important center of industry and commerce and was home to a number of factories and businesses. It was also an important center of culture and was home to a number of theaters, museums, and other cultural institutions.
Geography
Leipsic is located in the state of Saxony in Germany. It is situated on the banks of the Elbe River and is surrounded by the Leipzig-Halle metropolitan area. The city has an area of 297.6 square kilometers and a population of 575,000.
The city is divided into nine districts, each with its own unique character. The city center is home to a number of historic buildings and monuments, as well as a number of parks and gardens. The city is also home to a number of museums, galleries, and other cultural institutions.
Economy
Leipsic is an important economic center in Germany and is home to a number of major companies and industries. The city is home to a number of automotive, chemical, and pharmaceutical companies, as well as a number of IT and software companies. The city is also home to a number of research and development centers and is a major center of higher education.
The city is also home to a number of cultural institutions, including the Leipzig Opera House, the Gewandhaus Orchestra, and the Leipzig Zoo. The city is also home to a number of festivals and events, including the Leipzig Book Fair and the Leipzig Music Festival.
Demographics
Leipsic has a population of 575,000 and is one of the most populous cities in Germany. The city is home to a diverse population, with a majority of the population being of German descent. The city also has a large immigrant population, with a significant number of people from Turkey, Poland, and other countries.
Leipsic is a major center of higher education and is home to a number of universities and colleges. The city is also home to a number of cultural institutions, including the Leipzig Opera House, the Gewandhaus Orchestra, and the Leipzig Zoo. The city is also home to a number of festivals and events, including the Leipzig Book Fair and the Leipzig Music Festival.
Common Questions
What is Per Capita Income in Leipsic?
Per Capita income in Leipsic is $28,375.
What is the Median Family Income in Leipsic?
Median Family Income in Leipsic is $48,500.
What is the Median Household income in Leipsic?
Median Household Income in Leipsic is $46,250.
What is Inequality or Gini Index in Leipsic?
Inequality or Gini Index in Leipsic is 0.40.
What is the Total Population of Leipsic?
Total Population of Leipsic is 171.
What is the Total Male Population of Leipsic?
Total Male Population of Leipsic is 89.
What is the Total Female Population of Leipsic?
Total Female Population of Leipsic is 82.
What is the Ratio of Males per 100 Females in Leipsic?
There are 108.54 Males per 100 Females in Leipsic.
What is the Ratio of Females per 100 Males in Leipsic?
There are 92.13 Females per 100 Males in Leipsic.
What is the Median Population Age in Leipsic?
Median Population Age in Leipsic is 48.2 Years.
What is the Average Family Size in Leipsic
Average Family Size in Leipsic is 3.2 People.
What is the Average Household Size in Leipsic
Average Household Size in Leipsic is 2.2 People.
How Large is the Labor Force in Leipsic?
There are 96 People in the Labor Forcein in Leipsic.
What is the Percentage of People in the Labor Force in Leipsic?
70.6% of People are in the Labor Force in Leipsic.
What is the Unemployment Rate in Leipsic?
Unemployment Rate in Leipsic is 7.3%.