Greenwood, DE Map & Demographics
Greenwood Map
Greenwood Overview
$40,531
PER CAPITA INCOME
$72,000
AVG FAMILY INCOME
$68,418
AVG HOUSEHOLD INCOME
8.2%
WAGE / INCOME GAP [ % ]
91.8¢/ $1
WAGE / INCOME GAP [ $ ]
0.48
INEQUALITY / GINI INDEX
1,556
TOTAL POPULATION
720
MALE POPULATION
836
FEMALE POPULATION
86.12
MALES / 100 FEMALES
116.11
FEMALES / 100 MALES
36.1
MEDIAN AGE
3.6
AVG FAMILY SIZE
2.5
AVG HOUSEHOLD SIZE
915
LABOR FORCE [ PEOPLE ]
73.2%
PERCENT IN LABOR FORCE
3.7%
UNEMPLOYMENT RATE
Greenwood Zip Codes
Greenwood Area Codes
Income in Greenwood
Income Overview in Greenwood
Per Capita Income in Greenwood is $40,531, while median incomes of families and households are $72,000 and $68,418 respectively.
| Characteristic | Number | Measure |
| Per Capita Income | 1,556 | $40,531 |
| Median Family Income | 312 | $72,000 |
| Mean Family Income | 312 | $120,086 |
| Median Household Income | 635 | $68,418 |
| Mean Household Income | 635 | $94,592 |
| Income Deficit | 312 | $0 |
| Wage / Income Gap (%) | 1,556 | 8.20% |
| Wage / Income Gap ($) | 1,556 | 91.80¢ per $1 |
| Gini / Inequality Index | 1,556 | 0.48 |
Earnings by Sex in Greenwood
Average Earnings in Greenwood are $45,212, $48,542 for men and $44,563 for women, a difference of 8.2%.
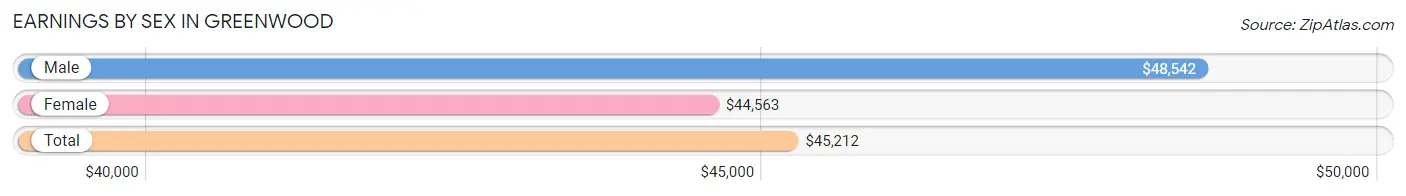
| Sex | Number | Average Earnings |
| Male | 440 (46.4%) | $48,542 |
| Female | 508 (53.6%) | $44,563 |
| Total | 948 (100.0%) | $45,212 |
Earnings by Sex by Income Bracket in Greenwood
The most common earnings brackets in Greenwood are $75,000 to $99,999 for men (86 | 19.6%) and $45,000 to $49,999 for women (83 | 16.3%).
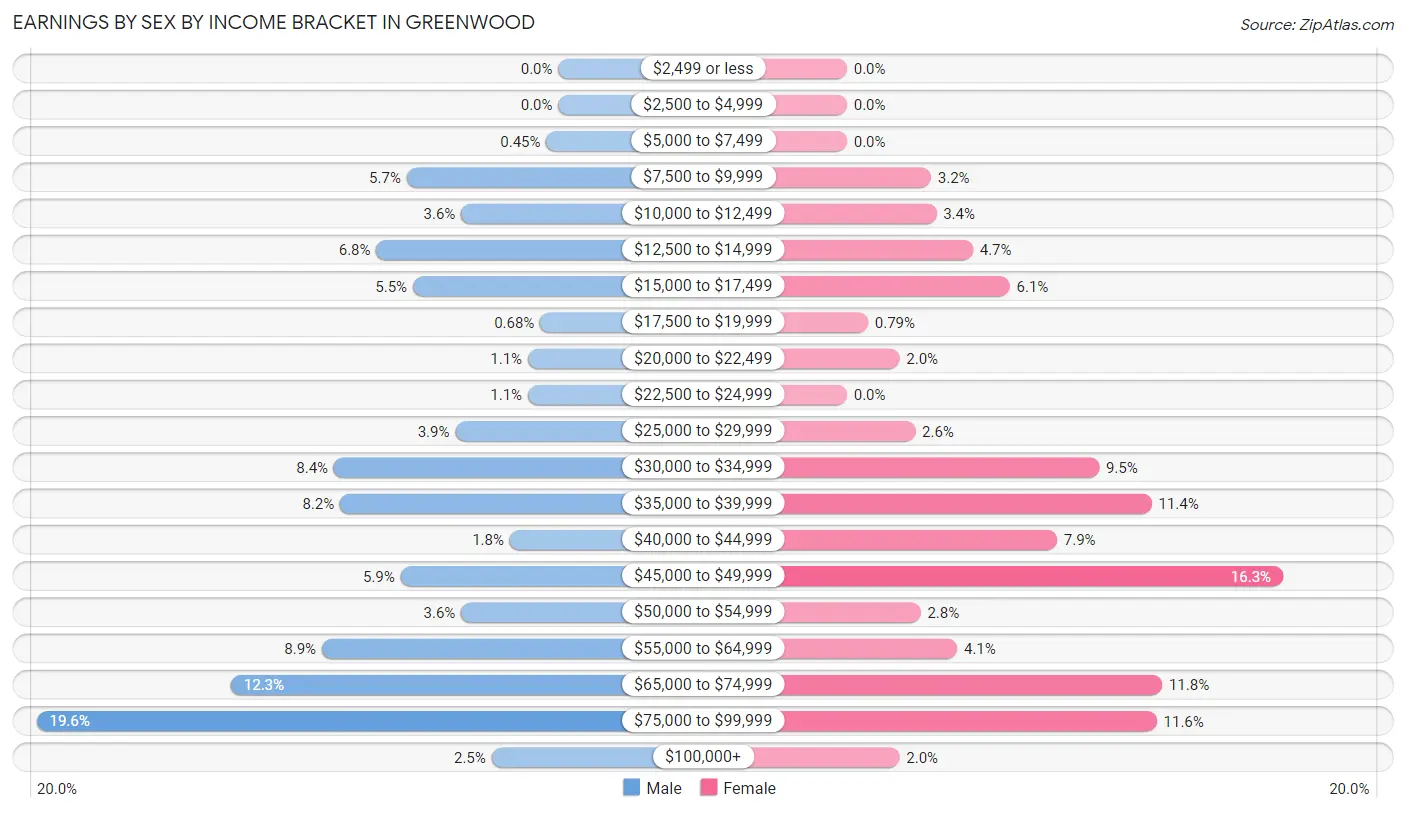
| Income | Male | Female |
| $2,499 or less | 0 (0.0%) | 0 (0.0%) |
| $2,500 to $4,999 | 0 (0.0%) | 0 (0.0%) |
| $5,000 to $7,499 | 2 (0.4%) | 0 (0.0%) |
| $7,500 to $9,999 | 25 (5.7%) | 16 (3.2%) |
| $10,000 to $12,499 | 16 (3.6%) | 17 (3.4%) |
| $12,500 to $14,999 | 30 (6.8%) | 24 (4.7%) |
| $15,000 to $17,499 | 24 (5.4%) | 31 (6.1%) |
| $17,500 to $19,999 | 3 (0.7%) | 4 (0.8%) |
| $20,000 to $22,499 | 5 (1.1%) | 10 (2.0%) |
| $22,500 to $24,999 | 5 (1.1%) | 0 (0.0%) |
| $25,000 to $29,999 | 17 (3.9%) | 13 (2.6%) |
| $30,000 to $34,999 | 37 (8.4%) | 48 (9.5%) |
| $35,000 to $39,999 | 36 (8.2%) | 58 (11.4%) |
| $40,000 to $44,999 | 8 (1.8%) | 40 (7.9%) |
| $45,000 to $49,999 | 26 (5.9%) | 83 (16.3%) |
| $50,000 to $54,999 | 16 (3.6%) | 14 (2.8%) |
| $55,000 to $64,999 | 39 (8.9%) | 21 (4.1%) |
| $65,000 to $74,999 | 54 (12.3%) | 60 (11.8%) |
| $75,000 to $99,999 | 86 (19.6%) | 59 (11.6%) |
| $100,000+ | 11 (2.5%) | 10 (2.0%) |
| Total | 440 (100.0%) | 508 (100.0%) |
Earnings by Sex by Educational Attainment in Greenwood
Average earnings in Greenwood are $52,500 for men and $46,453 for women, a difference of 11.5%. Men with an educational attainment of less than high school enjoy the highest average annual earnings of $67,917, while those with high school diploma education earn the least with $39,063. Women with an educational attainment of bachelor's degree earn the most with the average annual earnings of $67,995, while those with less than high school education have the smallest earnings of $20,417.
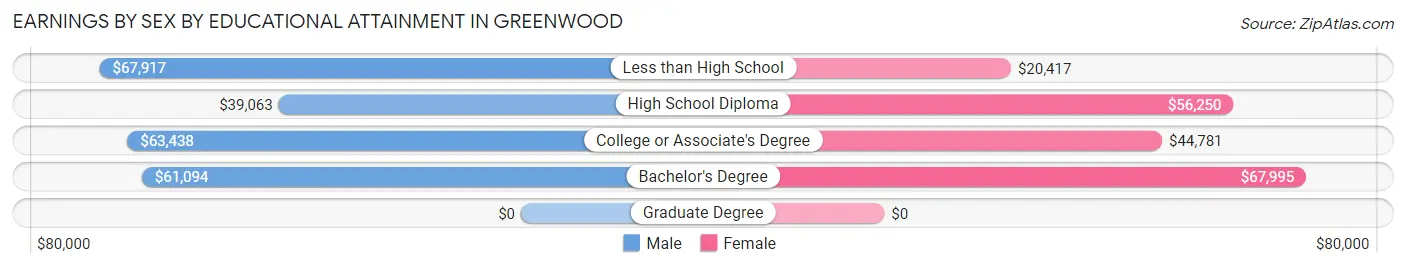
| Educational Attainment | Male Income | Female Income |
| Less than High School | $67,917 | $20,417 |
| High School Diploma | $39,063 | $56,250 |
| College or Associate's Degree | $63,438 | $44,781 |
| Bachelor's Degree | $61,094 | $67,995 |
| Graduate Degree | - | - |
| Total | $52,500 | $46,453 |
Family Income in Greenwood
Family Income Brackets in Greenwood
According to the Greenwood family income data, there are 71 families falling into the $50,000 to $74,999 income range, which is the most common income bracket and makes up 22.8% of all families. Conversely, the $25,000 to $34,999 income bracket is the least frequent group with only 5 families (1.6%) belonging to this category.
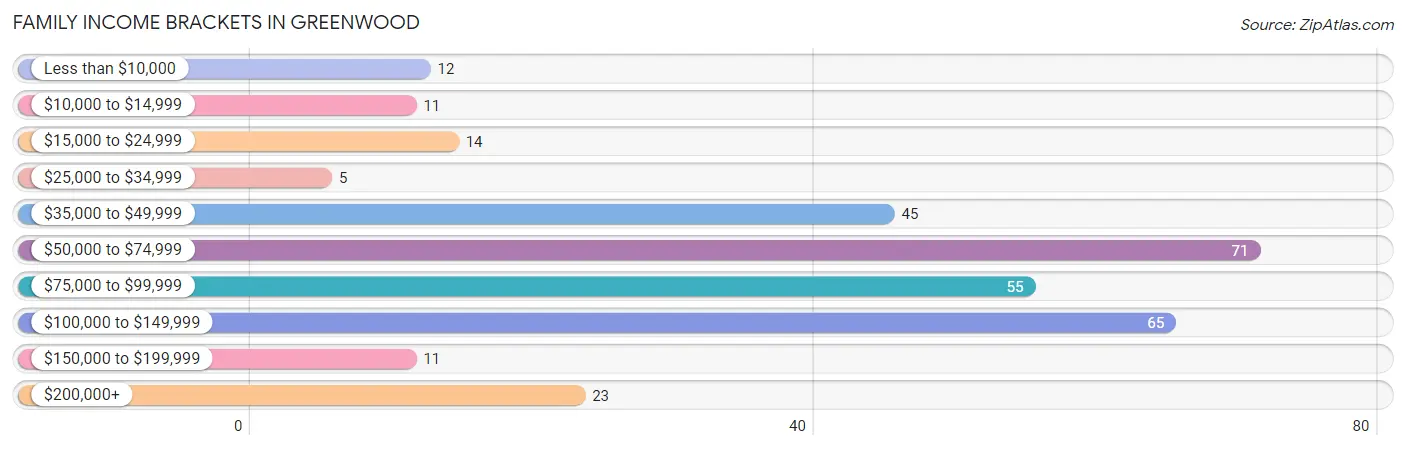
| Income Bracket | # Families | % Families |
| Less than $10,000 | 12 | 3.8% |
| $10,000 to $14,999 | 11 | 3.5% |
| $15,000 to $24,999 | 14 | 4.5% |
| $25,000 to $34,999 | 5 | 1.6% |
| $35,000 to $49,999 | 45 | 14.4% |
| $50,000 to $74,999 | 71 | 22.8% |
| $75,000 to $99,999 | 55 | 17.6% |
| $100,000 to $149,999 | 65 | 20.8% |
| $150,000 to $199,999 | 11 | 3.5% |
| $200,000+ | 23 | 7.4% |
Family Income by Famaliy Size in Greenwood
3-person families (58 | 18.6%) account for the highest median family income in Greenwood with $100,714 per family, while 3-person families (58 | 18.6%) have the highest median income of $33,571 per family member.
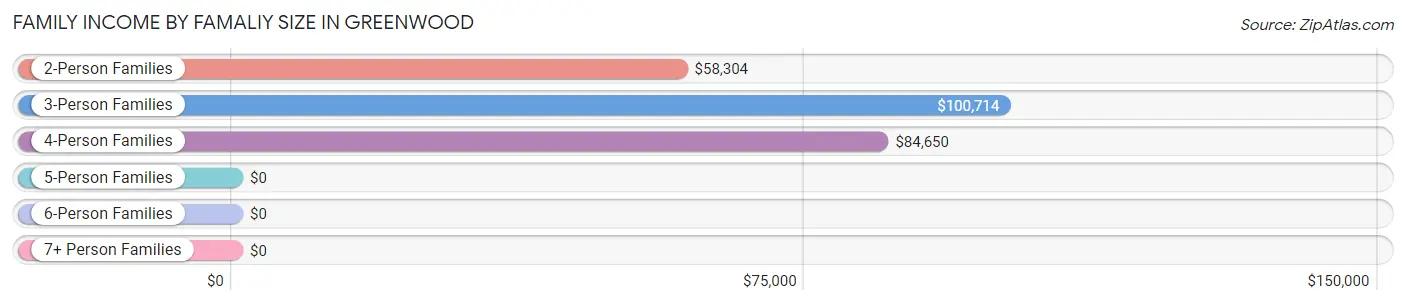
| Income Bracket | # Families | Median Income |
| 2-Person Families | 116 (37.2%) | $58,304 |
| 3-Person Families | 58 (18.6%) | $100,714 |
| 4-Person Families | 83 (26.6%) | $84,650 |
| 5-Person Families | 25 (8.0%) | $0 |
| 6-Person Families | 17 (5.4%) | $0 |
| 7+ Person Families | 13 (4.2%) | $0 |
| Total | 312 (100.0%) | $72,000 |
Family Income by Number of Earners in Greenwood
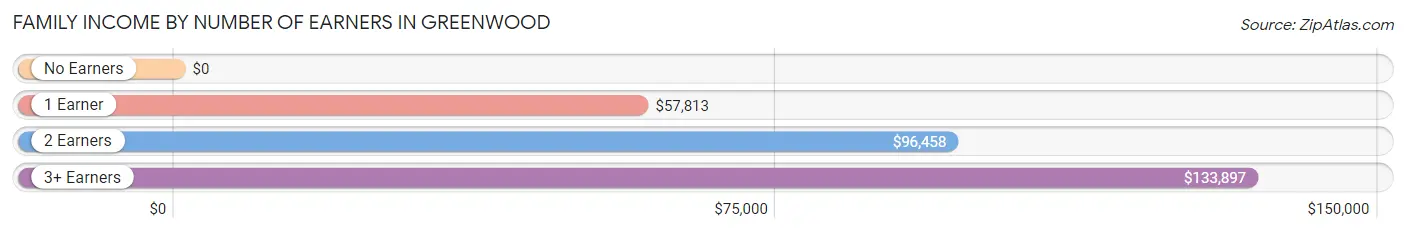
| Number of Earners | # Families | Median Income |
| No Earners | 34 (10.9%) | $0 |
| 1 Earner | 109 (34.9%) | $57,813 |
| 2 Earners | 92 (29.5%) | $96,458 |
| 3+ Earners | 77 (24.7%) | $133,897 |
| Total | 312 (100.0%) | $72,000 |
Household Income in Greenwood
Household Income Brackets in Greenwood
With 136 households falling in the category, the $50,000 to $74,999 income range is the most frequent in Greenwood, accounting for 21.4% of all households. In contrast, only 11 households (1.7%) fall into the $150,000 to $199,999 income bracket, making it the least populous group.
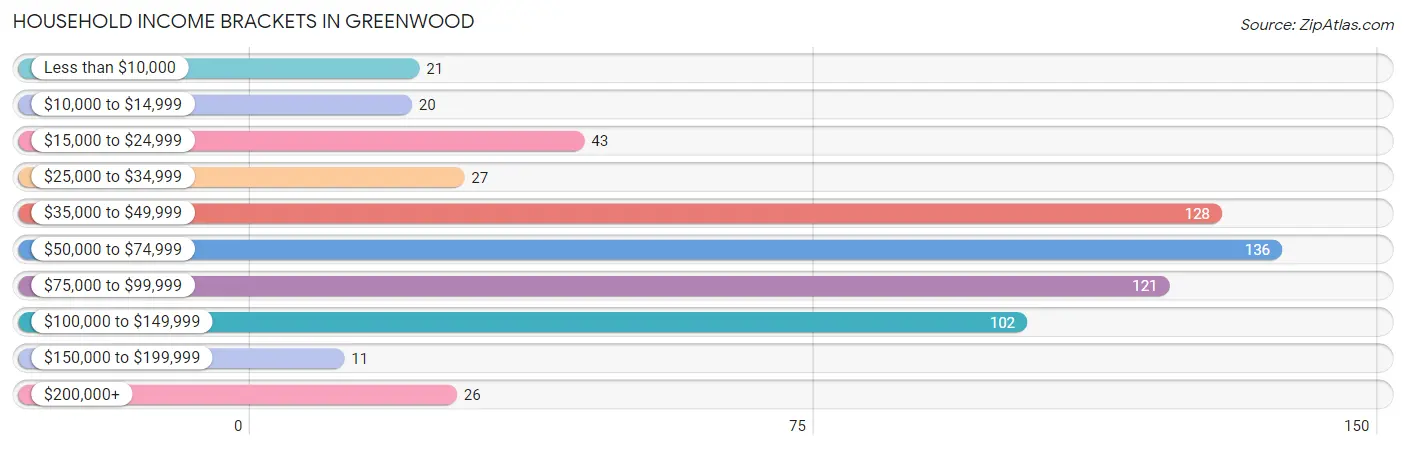
| Income Bracket | # Households | % Households |
| Less than $10,000 | 21 | 3.3% |
| $10,000 to $14,999 | 20 | 3.1% |
| $15,000 to $24,999 | 43 | 6.8% |
| $25,000 to $34,999 | 27 | 4.3% |
| $35,000 to $49,999 | 128 | 20.2% |
| $50,000 to $74,999 | 136 | 21.4% |
| $75,000 to $99,999 | 121 | 19.1% |
| $100,000 to $149,999 | 102 | 16.1% |
| $150,000 to $199,999 | 11 | 1.7% |
| $200,000+ | 26 | 4.1% |
Household Income by Householder Age in Greenwood
The median household income in Greenwood is $68,418, with the highest median household income of $69,906 found in the 25 to 44 years age bracket for the primary householder. A total of 274 households (43.1%) fall into this category. Meanwhile, the 15 to 24 years age bracket for the primary householder has the lowest median household income of $0, with 47 households (7.4%) in this group.
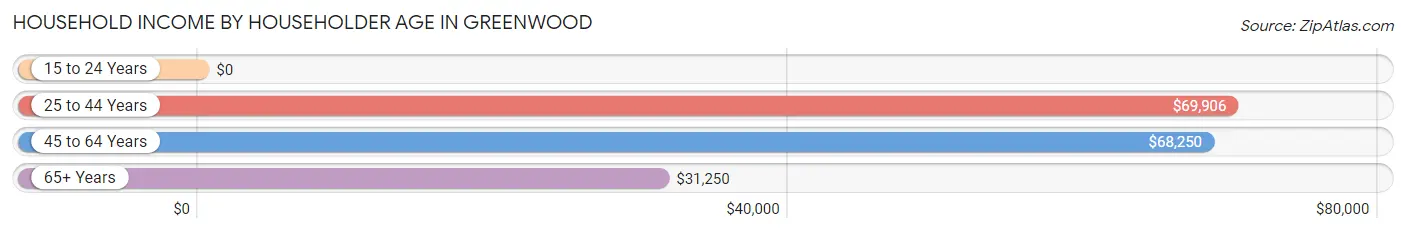
| Income Bracket | # Households | Median Income |
| 15 to 24 Years | 47 (7.4%) | $0 |
| 25 to 44 Years | 274 (43.1%) | $69,906 |
| 45 to 64 Years | 228 (35.9%) | $68,250 |
| 65+ Years | 86 (13.5%) | $31,250 |
| Total | 635 (100.0%) | $68,418 |
Poverty in Greenwood
Income Below Poverty by Sex and Age in Greenwood
With 9.1% poverty level for males and 8.4% for females among the residents of Greenwood, 5 year old males and 5 year old females are the most vulnerable to poverty, with 10 males (58.8%) and 8 females (61.5%) in their respective age groups living below the poverty level.
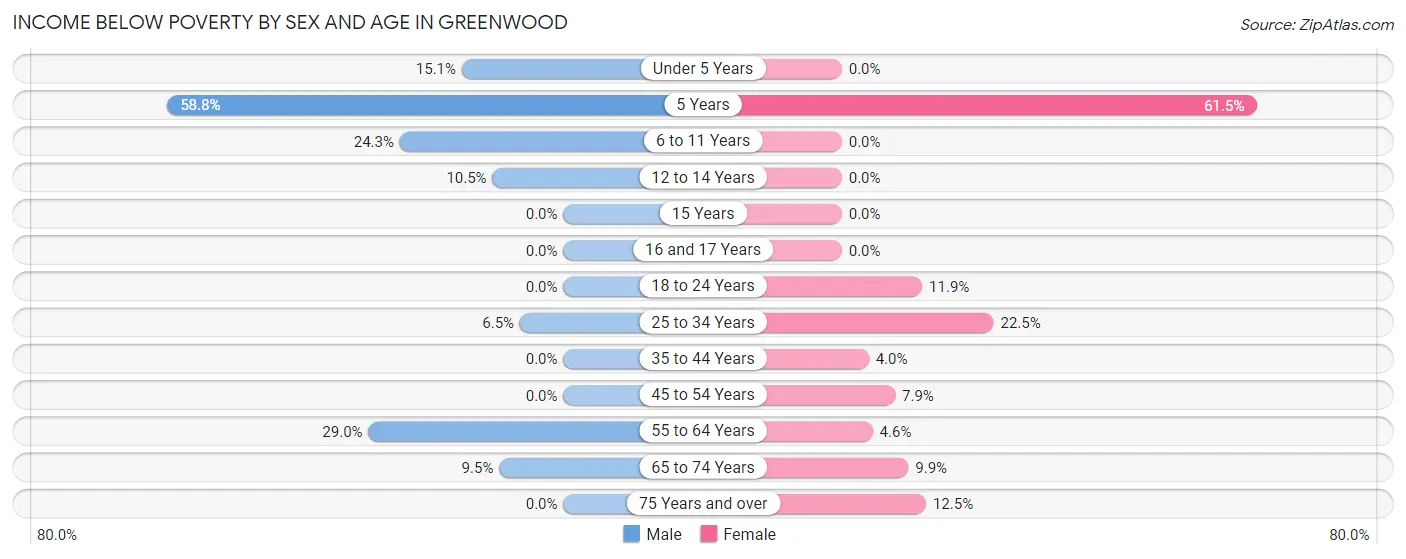
| Age Bracket | Male | Female |
| Under 5 Years | 11 (15.1%) | 0 (0.0%) |
| 5 Years | 10 (58.8%) | 8 (61.5%) |
| 6 to 11 Years | 17 (24.3%) | 0 (0.0%) |
| 12 to 14 Years | 4 (10.5%) | 0 (0.0%) |
| 15 Years | 0 (0.0%) | 0 (0.0%) |
| 16 and 17 Years | 0 (0.0%) | 0 (0.0%) |
| 18 to 24 Years | 0 (0.0%) | 13 (11.9%) |
| 25 to 34 Years | 10 (6.5%) | 16 (22.5%) |
| 35 to 44 Years | 0 (0.0%) | 8 (4.0%) |
| 45 to 54 Years | 0 (0.0%) | 8 (7.9%) |
| 55 to 64 Years | 11 (28.9%) | 6 (4.6%) |
| 65 to 74 Years | 2 (9.5%) | 8 (9.9%) |
| 75 Years and over | 0 (0.0%) | 3 (12.5%) |
| Total | 65 (9.1%) | 70 (8.4%) |
Income Above Poverty by Sex and Age in Greenwood
According to the poverty statistics in Greenwood, males aged 15 years and females aged under 5 years are the age groups that are most secure financially, with 100.0% of males and 100.0% of females in these age groups living above the poverty line.
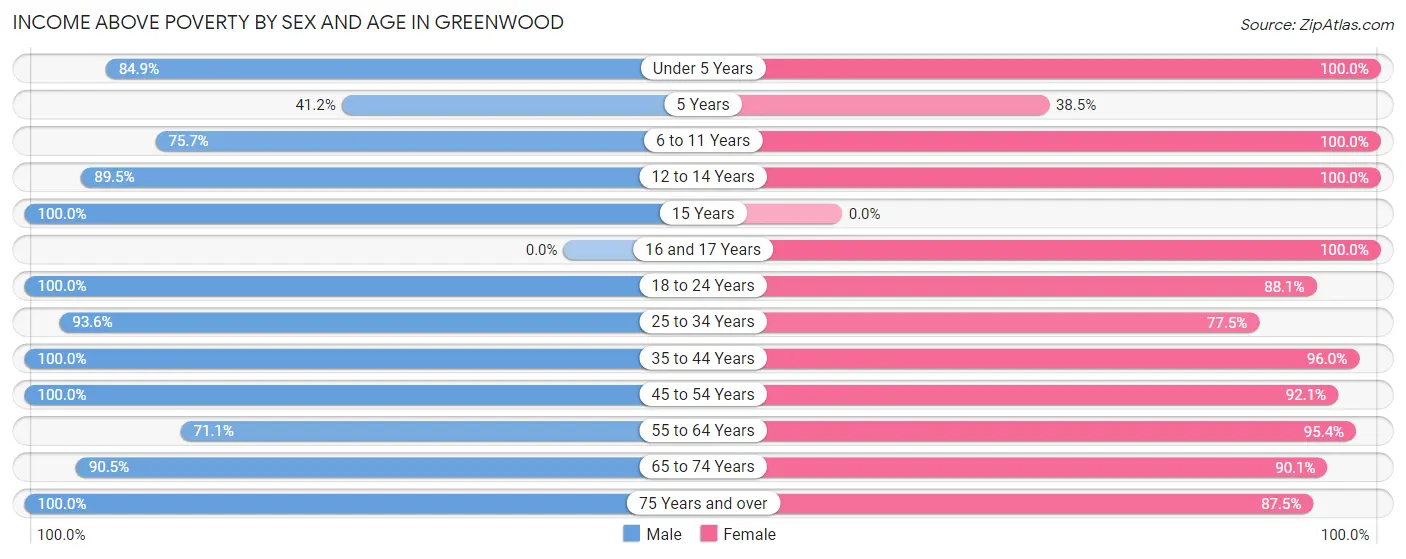
| Age Bracket | Male | Female |
| Under 5 Years | 62 (84.9%) | 44 (100.0%) |
| 5 Years | 7 (41.2%) | 5 (38.5%) |
| 6 to 11 Years | 53 (75.7%) | 11 (100.0%) |
| 12 to 14 Years | 34 (89.5%) | 17 (100.0%) |
| 15 Years | 16 (100.0%) | 0 (0.0%) |
| 16 and 17 Years | 0 (0.0%) | 30 (100.0%) |
| 18 to 24 Years | 86 (100.0%) | 96 (88.1%) |
| 25 to 34 Years | 145 (93.5%) | 55 (77.5%) |
| 35 to 44 Years | 56 (100.0%) | 192 (96.0%) |
| 45 to 54 Years | 142 (100.0%) | 93 (92.1%) |
| 55 to 64 Years | 27 (71.1%) | 125 (95.4%) |
| 65 to 74 Years | 19 (90.5%) | 73 (90.1%) |
| 75 Years and over | 5 (100.0%) | 21 (87.5%) |
| Total | 652 (90.9%) | 762 (91.6%) |
Income Below Poverty Among Married-Couple Families in Greenwood
The poverty statistics for married-couple families in Greenwood show that 8.3% or 15 of the total 180 families live below the poverty line. Families with 3 or 4 children have the highest poverty rate of 78.6%, comprising of 11 families. On the other hand, families with 1 or 2 children have the lowest poverty rate of 0.0%, which includes 0 families.
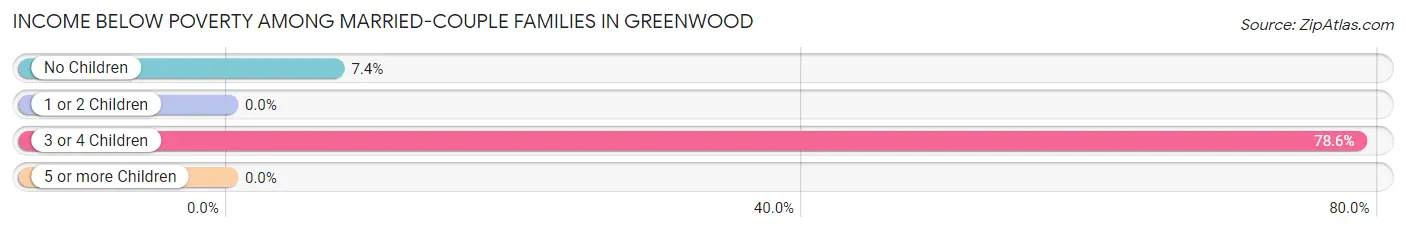
| Children | Above Poverty | Below Poverty |
| No Children | 50 (92.6%) | 4 (7.4%) |
| 1 or 2 Children | 112 (100.0%) | 0 (0.0%) |
| 3 or 4 Children | 3 (21.4%) | 11 (78.6%) |
| 5 or more Children | 0 (0.0%) | 0 (0.0%) |
| Total | 165 (91.7%) | 15 (8.3%) |
Income Below Poverty Among Single-Parent Households in Greenwood
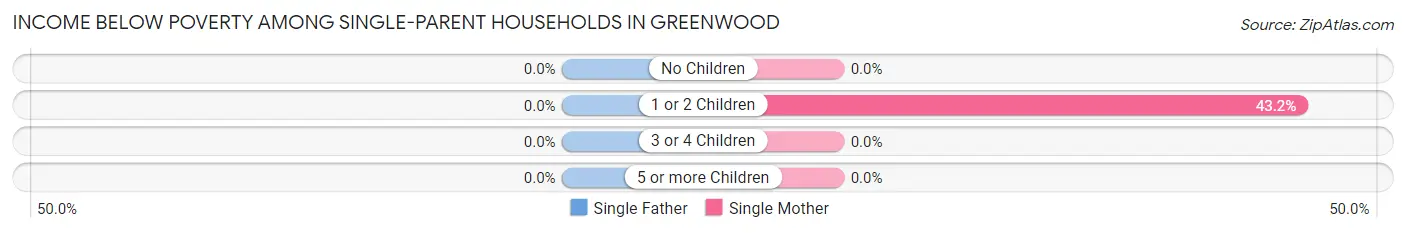
| Children | Single Father | Single Mother |
| No Children | 0 (0.0%) | 0 (0.0%) |
| 1 or 2 Children | 0 (0.0%) | 16 (43.2%) |
| 3 or 4 Children | 0 (0.0%) | 0 (0.0%) |
| 5 or more Children | 0 (0.0%) | 0 (0.0%) |
| Total | 0 (0.0%) | 16 (15.7%) |
Income Below Poverty Among Married-Couple vs Single-Parent Households in Greenwood
The poverty data for Greenwood shows that 15 of the married-couple family households (8.3%) and 16 of the single-parent households (12.1%) are living below the poverty level. Within the married-couple family households, those with 3 or 4 children have the highest poverty rate, with 11 households (78.6%) falling below the poverty line. Among the single-parent households, those with 1 or 2 children have the highest poverty rate, with 16 household (30.2%) living below poverty.
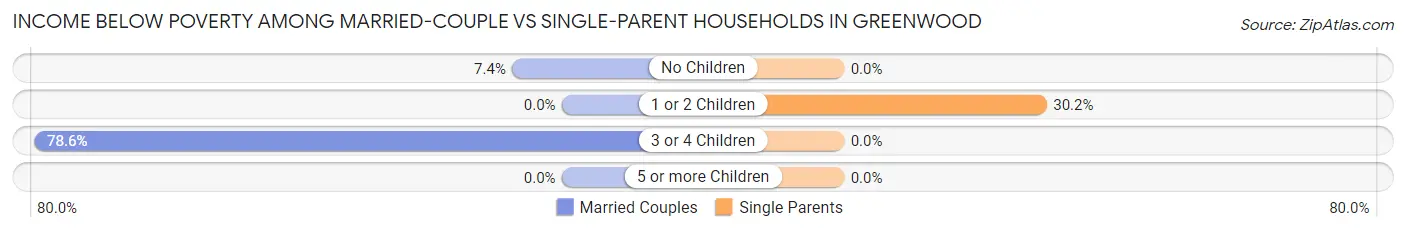
| Children | Married-Couple Families | Single-Parent Households |
| No Children | 4 (7.4%) | 0 (0.0%) |
| 1 or 2 Children | 0 (0.0%) | 16 (30.2%) |
| 3 or 4 Children | 11 (78.6%) | 0 (0.0%) |
| 5 or more Children | 0 (0.0%) | 0 (0.0%) |
| Total | 15 (8.3%) | 16 (12.1%) |
Race in Greenwood
The most populous races in Greenwood are White / Caucasian (1,078 | 69.3%), Hispanic or Latino (399 | 25.6%), and Black / African American (324 | 20.8%).
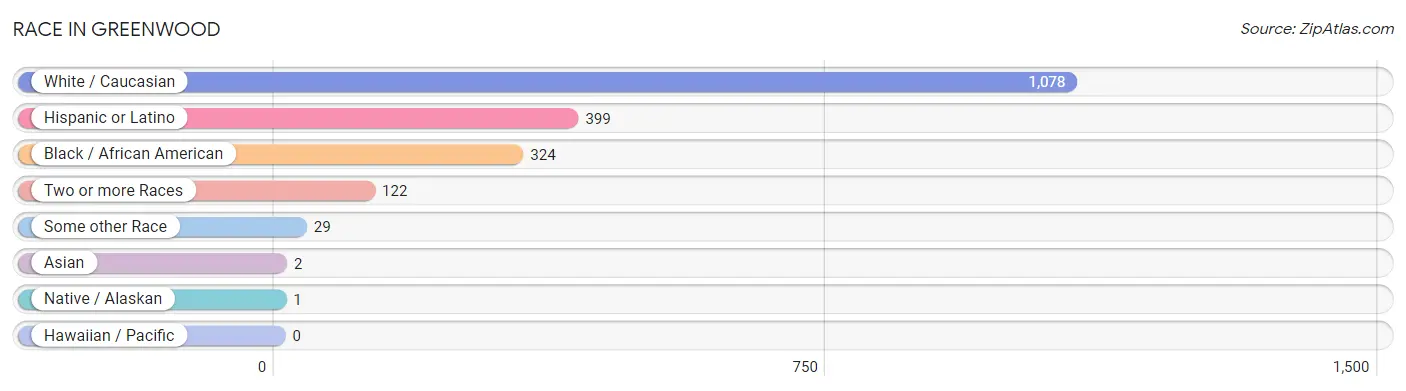
| Race | # Population | % Population |
| Asian | 2 | 0.1% |
| Black / African American | 324 | 20.8% |
| Hawaiian / Pacific | 0 | 0.0% |
| Hispanic or Latino | 399 | 25.6% |
| Native / Alaskan | 1 | 0.1% |
| White / Caucasian | 1,078 | 69.3% |
| Two or more Races | 122 | 7.8% |
| Some other Race | 29 | 1.9% |
| Total | 1,556 | 100.0% |
Ancestry in Greenwood
The most populous ancestries reported in Greenwood are Mexican (239 | 15.4%), English (140 | 9.0%), German (119 | 7.6%), Irish (116 | 7.5%), and European (106 | 6.8%), together accounting for 46.3% of all Greenwood residents.
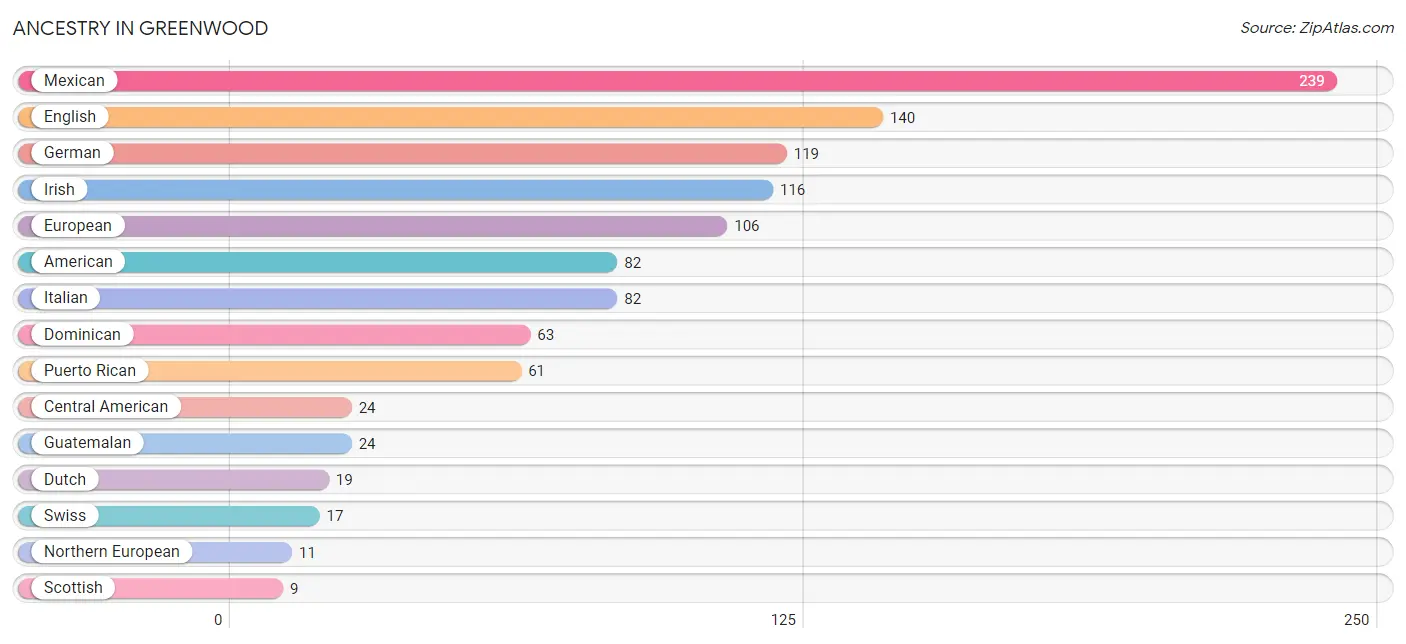
| Ancestry | # Population | % Population |
| American | 82 | 5.3% |
| Armenian | 4 | 0.3% |
| Austrian | 4 | 0.3% |
| Blackfeet | 1 | 0.1% |
| British | 8 | 0.5% |
| Central American | 24 | 1.5% |
| Cherokee | 6 | 0.4% |
| Czech | 7 | 0.4% |
| Dominican | 63 | 4.1% |
| Dutch | 19 | 1.2% |
| English | 140 | 9.0% |
| European | 106 | 6.8% |
| French | 2 | 0.1% |
| German | 119 | 7.6% |
| Guatemalan | 24 | 1.5% |
| Hungarian | 7 | 0.4% |
| Irish | 116 | 7.5% |
| Italian | 82 | 5.3% |
| Korean | 2 | 0.1% |
| Mexican | 239 | 15.4% |
| Navajo | 6 | 0.4% |
| Northern European | 11 | 0.7% |
| Norwegian | 6 | 0.4% |
| Polish | 6 | 0.4% |
| Puerto Rican | 61 | 3.9% |
| Russian | 2 | 0.1% |
| Scottish | 9 | 0.6% |
| Swedish | 6 | 0.4% |
| Swiss | 17 | 1.1% |
| Welsh | 3 | 0.2% | View All 30 Rows |
Immigrants in Greenwood
The most numerous immigrant groups reported in Greenwood came from Latin America (196 | 12.6%), Central America (131 | 8.4%), Mexico (123 | 7.9%), Caribbean (65 | 4.2%), and Dominican Republic (63 | 4.1%), together accounting for 37.1% of all Greenwood residents.
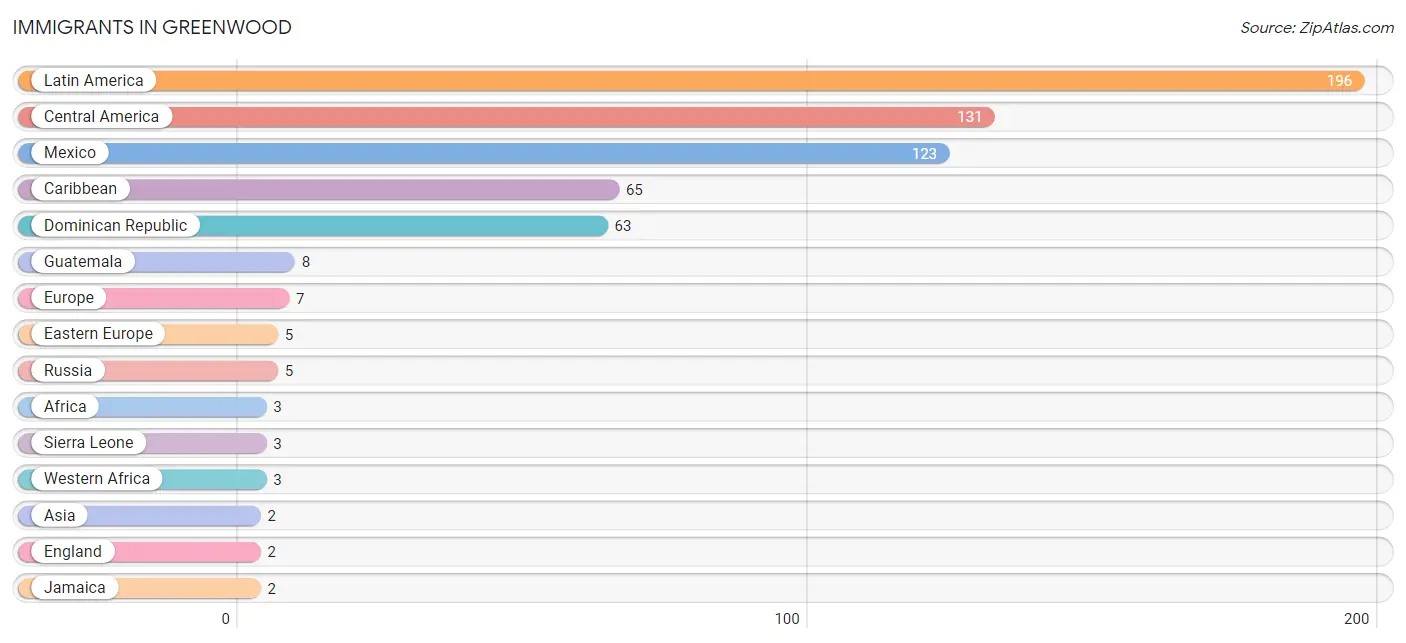
| Immigration Origin | # Population | % Population |
| Africa | 3 | 0.2% |
| Asia | 2 | 0.1% |
| Caribbean | 65 | 4.2% |
| Central America | 131 | 8.4% |
| Dominican Republic | 63 | 4.1% |
| Eastern Europe | 5 | 0.3% |
| England | 2 | 0.1% |
| Europe | 7 | 0.4% |
| Guatemala | 8 | 0.5% |
| Jamaica | 2 | 0.1% |
| Latin America | 196 | 12.6% |
| Mexico | 123 | 7.9% |
| Northern Europe | 2 | 0.1% |
| Philippines | 2 | 0.1% |
| Russia | 5 | 0.3% |
| Sierra Leone | 3 | 0.2% |
| South Eastern Asia | 2 | 0.1% |
| Western Africa | 3 | 0.2% | View All 18 Rows |
Sex and Age in Greenwood
Sex and Age in Greenwood
The most populous age groups in Greenwood are 20 to 24 Years (83 | 11.5%) for men and 35 to 39 Years (101 | 12.1%) for women.
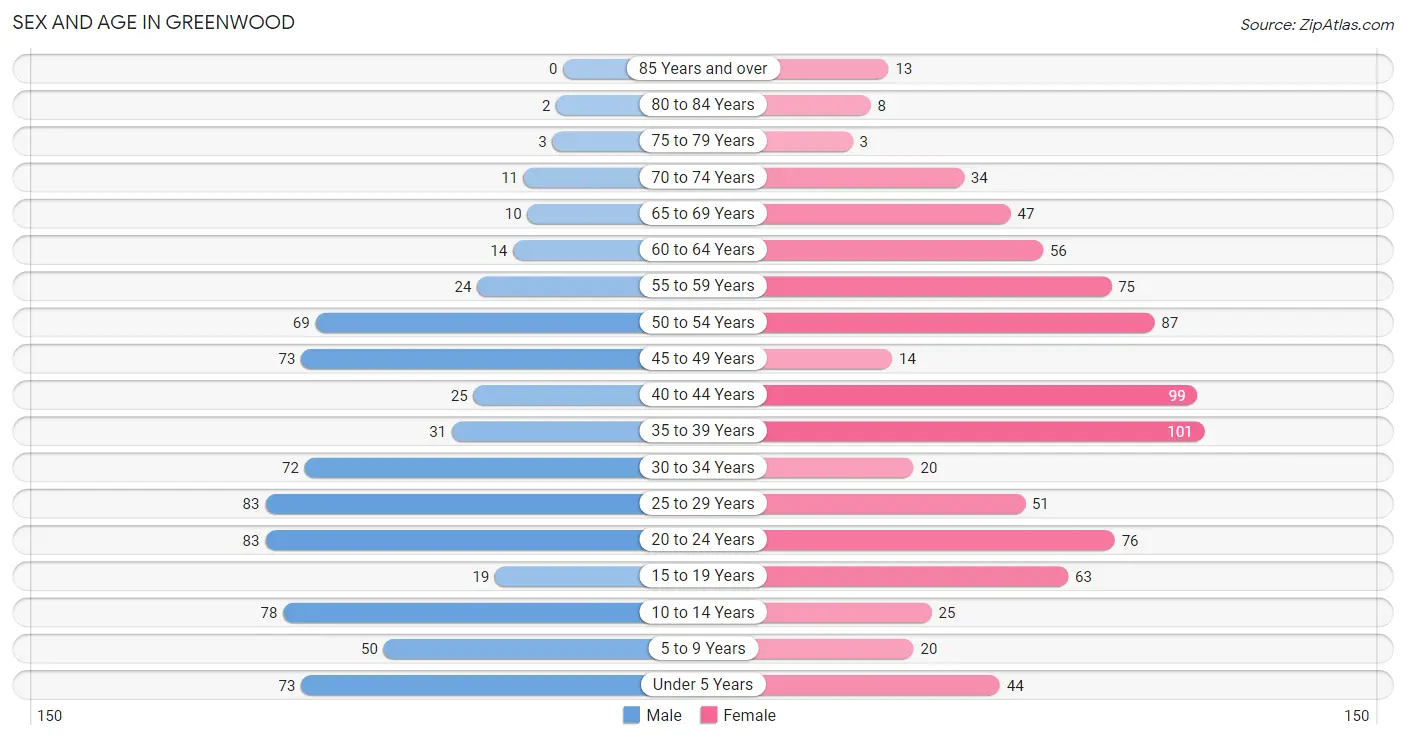
| Age Bracket | Male | Female |
| Under 5 Years | 73 (10.1%) | 44 (5.3%) |
| 5 to 9 Years | 50 (6.9%) | 20 (2.4%) |
| 10 to 14 Years | 78 (10.8%) | 25 (3.0%) |
| 15 to 19 Years | 19 (2.6%) | 63 (7.5%) |
| 20 to 24 Years | 83 (11.5%) | 76 (9.1%) |
| 25 to 29 Years | 83 (11.5%) | 51 (6.1%) |
| 30 to 34 Years | 72 (10.0%) | 20 (2.4%) |
| 35 to 39 Years | 31 (4.3%) | 101 (12.1%) |
| 40 to 44 Years | 25 (3.5%) | 99 (11.8%) |
| 45 to 49 Years | 73 (10.1%) | 14 (1.7%) |
| 50 to 54 Years | 69 (9.6%) | 87 (10.4%) |
| 55 to 59 Years | 24 (3.3%) | 75 (9.0%) |
| 60 to 64 Years | 14 (1.9%) | 56 (6.7%) |
| 65 to 69 Years | 10 (1.4%) | 47 (5.6%) |
| 70 to 74 Years | 11 (1.5%) | 34 (4.1%) |
| 75 to 79 Years | 3 (0.4%) | 3 (0.4%) |
| 80 to 84 Years | 2 (0.3%) | 8 (1.0%) |
| 85 Years and over | 0 (0.0%) | 13 (1.6%) |
| Total | 720 (100.0%) | 836 (100.0%) |
Families and Households in Greenwood
Median Family Size in Greenwood
The median family size in Greenwood is 3.57 persons per family, with single female/mother families (102 | 32.7%) accounting for the largest median family size of 4.1 persons per family. On the other hand, single male/father families (30 | 9.6%) represent the smallest median family size with 2.90 persons per family.
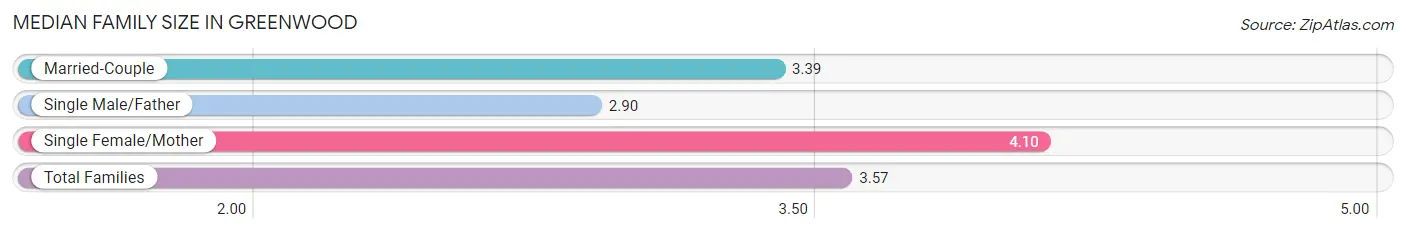
| Family Type | # Families | Family Size |
| Married-Couple | 180 (57.7%) | 3.39 |
| Single Male/Father | 30 (9.6%) | 2.90 |
| Single Female/Mother | 102 (32.7%) | 4.10 |
| Total Families | 312 (100.0%) | 3.57 |
Median Household Size in Greenwood
The median household size in Greenwood is 2.45 persons per household, with single female/mother households (102 | 16.1%) accounting for the largest median household size of 4.33 persons per household. non-family households (323 | 50.9%) represent the smallest median household size with 1.23 persons per household.
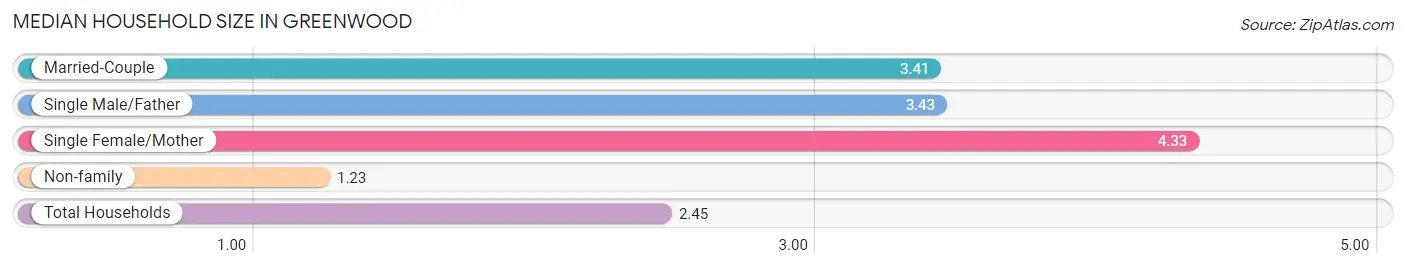
| Household Type | # Households | Household Size |
| Married-Couple | 180 (28.3%) | 3.41 |
| Single Male/Father | 30 (4.7%) | 3.43 |
| Single Female/Mother | 102 (16.1%) | 4.33 |
| Non-family | 323 (50.9%) | 1.23 |
| Total Households | 635 (100.0%) | 2.45 |
Household Size by Marriage Status in Greenwood
Out of a total of 635 households in Greenwood, 312 (49.1%) are family households, while 323 (50.9%) are nonfamily households. The most numerous type of family households are 2-person households, comprising 97, and the most common type of nonfamily households are 1-person households, comprising 268.
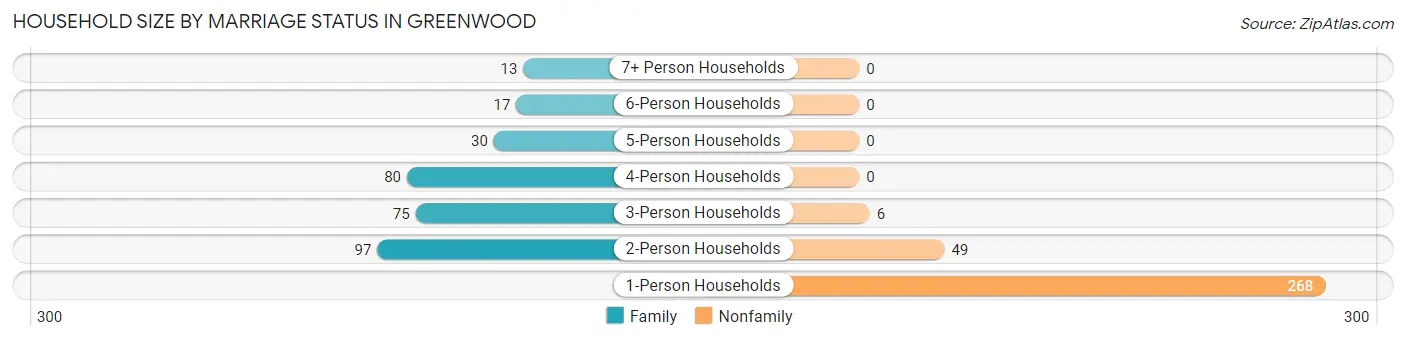
| Household Size | Family Households | Nonfamily Households |
| 1-Person Households | - | 268 (42.2%) |
| 2-Person Households | 97 (15.3%) | 49 (7.7%) |
| 3-Person Households | 75 (11.8%) | 6 (0.9%) |
| 4-Person Households | 80 (12.6%) | 0 (0.0%) |
| 5-Person Households | 30 (4.7%) | 0 (0.0%) |
| 6-Person Households | 17 (2.7%) | 0 (0.0%) |
| 7+ Person Households | 13 (2.1%) | 0 (0.0%) |
| Total | 312 (49.1%) | 323 (50.9%) |
Female Fertility in Greenwood
Fertility by Age in Greenwood
Average fertility rate in Greenwood is 27.0 births per 1,000 women. Women in the age bracket of 20 to 34 years have the highest fertility rate with 82.0 births per 1,000 women. Women in the age bracket of 20 to 34 years acount for 100.0% of all women with births.
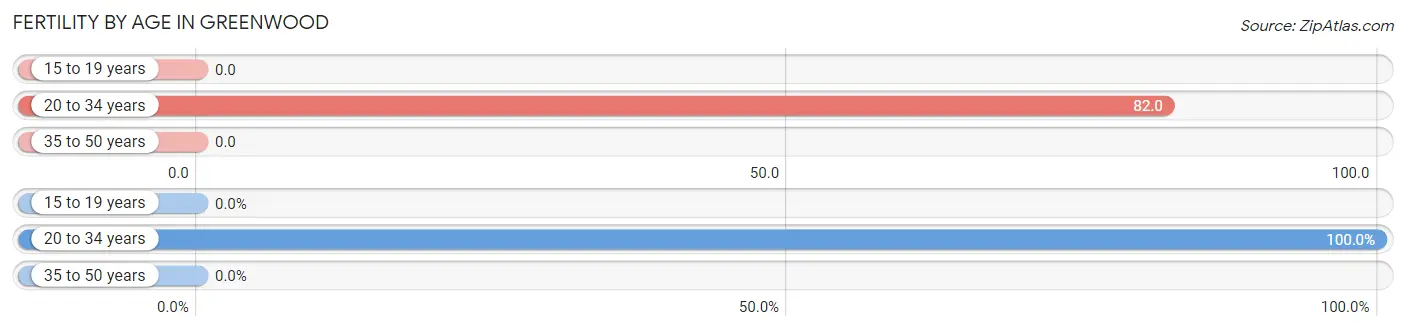
| Age Bracket | Women with Births | Births / 1,000 Women |
| 15 to 19 years | 0 (0.0%) | 0.0 |
| 20 to 34 years | 12 (100.0%) | 82.0 |
| 35 to 50 years | 0 (0.0%) | 0.0 |
| Total | 12 (100.0%) | 27.0 |
Fertility by Age by Marriage Status in Greenwood
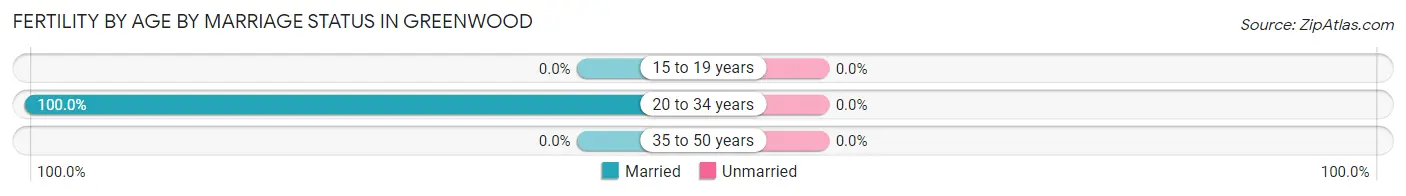
| Age Bracket | Married | Unmarried |
| 15 to 19 years | 0 (0.0%) | 0 (0.0%) |
| 20 to 34 years | 12 (100.0%) | 0 (0.0%) |
| 35 to 50 years | 0 (0.0%) | 0 (0.0%) |
| Total | 12 (100.0%) | 0 (0.0%) |
Fertility by Education in Greenwood
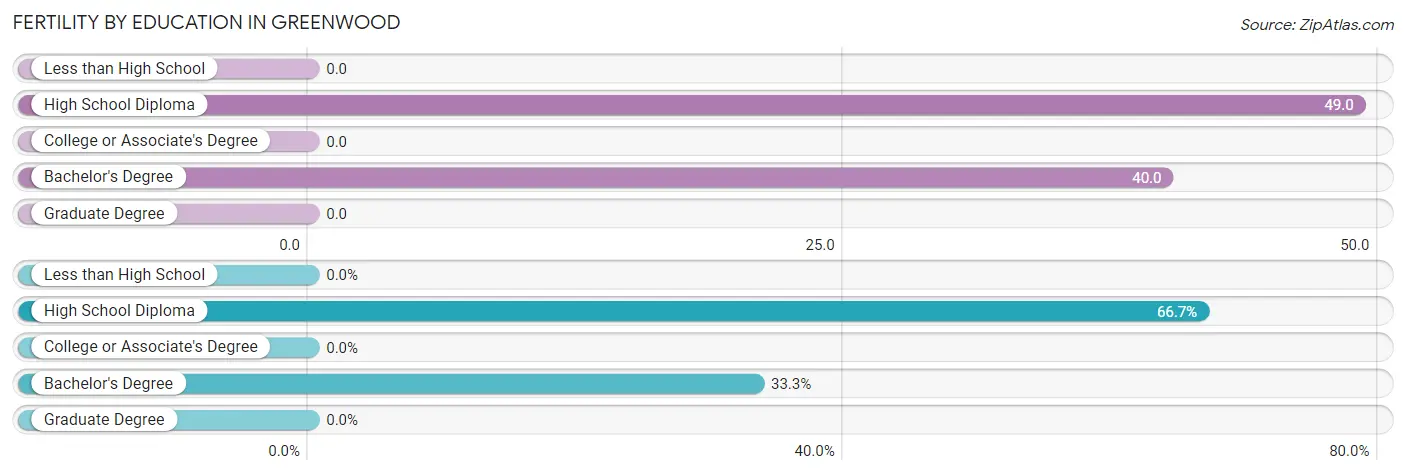
| Educational Attainment | Women with Births | Births / 1,000 Women |
| Less than High School | 0 (0.0%) | 0.0 |
| High School Diploma | 8 (66.7%) | 49.0 |
| College or Associate's Degree | 0 (0.0%) | 0.0 |
| Bachelor's Degree | 4 (33.3%) | 40.0 |
| Graduate Degree | 0 (0.0%) | 0.0 |
| Total | 12 (100.0%) | 27.0 |
Fertility by Education by Marriage Status in Greenwood
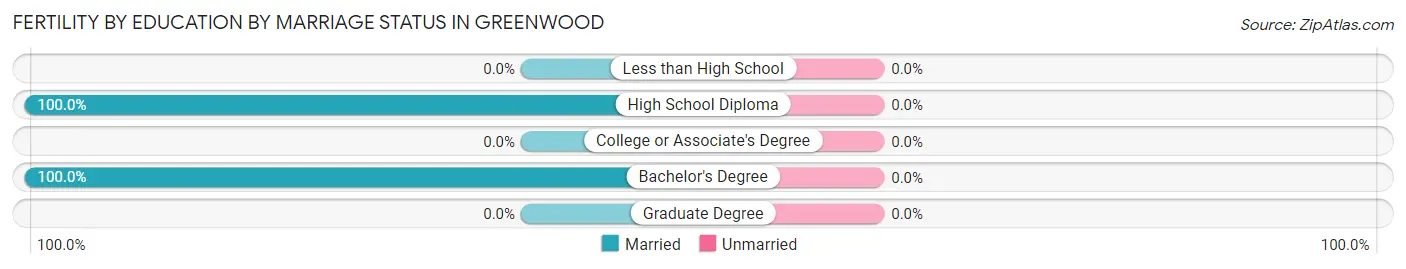
| Educational Attainment | Married | Unmarried |
| Less than High School | 0 (0.0%) | 0 (0.0%) |
| High School Diploma | 8 (100.0%) | 0 (0.0%) |
| College or Associate's Degree | 0 (0.0%) | 0 (0.0%) |
| Bachelor's Degree | 4 (100.0%) | 0 (0.0%) |
| Graduate Degree | 0 (0.0%) | 0 (0.0%) |
| Total | 12 (100.0%) | 0 (0.0%) |
Employment Characteristics in Greenwood
Employment by Class of Employer in Greenwood
Among the 867 employed individuals in Greenwood, private company employees (632 | 72.9%), local government employees (72 | 8.3%), and not-for-profit organizations (59 | 6.8%) make up the most common classes of employment.
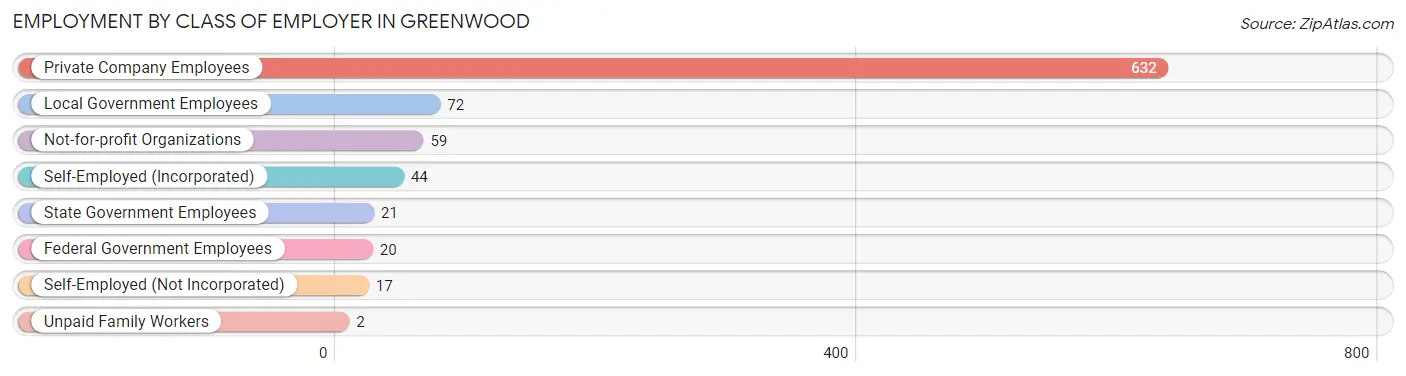
| Employer Class | # Employees | % Employees |
| Private Company Employees | 632 | 72.9% |
| Self-Employed (Incorporated) | 44 | 5.1% |
| Self-Employed (Not Incorporated) | 17 | 2.0% |
| Not-for-profit Organizations | 59 | 6.8% |
| Local Government Employees | 72 | 8.3% |
| State Government Employees | 21 | 2.4% |
| Federal Government Employees | 20 | 2.3% |
| Unpaid Family Workers | 2 | 0.2% |
| Total | 867 | 100.0% |
Employment Status by Age in Greenwood
According to the labor force statistics for Greenwood, out of the total population over 16 years of age (1,250), 73.2% or 915 individuals are in the labor force, with 3.7% or 34 of them unemployed. The age group with the highest labor force participation rate is 30 to 34 years, with 96.7% or 89 individuals in the labor force. Within the labor force, the 60 to 64 years age range has the highest percentage of unemployed individuals, with 44.0% or 11 of them being unemployed.
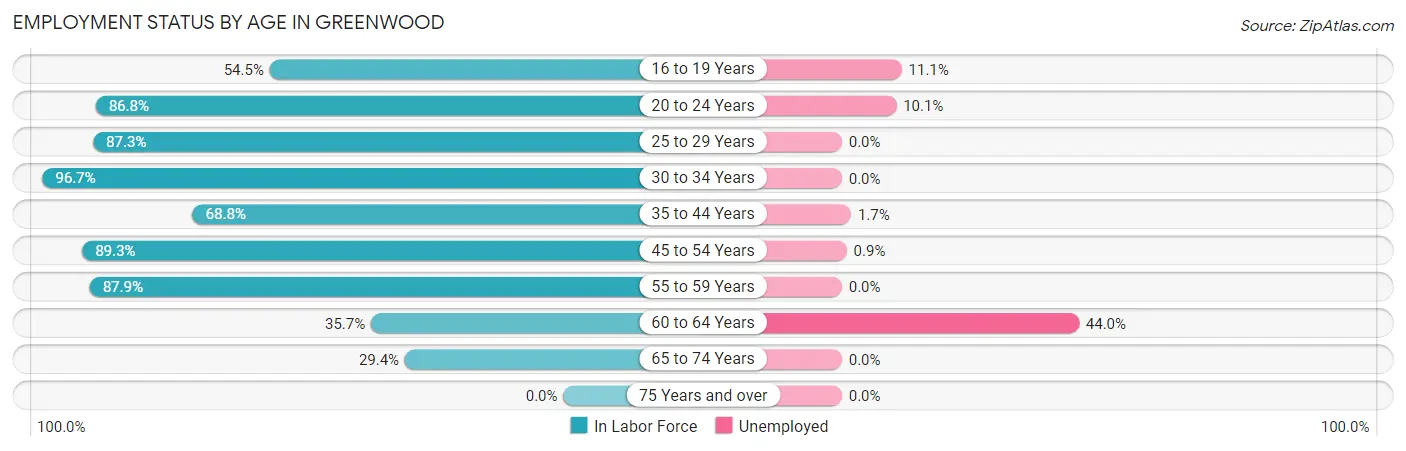
| Age Bracket | In Labor Force | Unemployed |
| 16 to 19 Years | 36 (54.5%) | 4 (11.1%) |
| 20 to 24 Years | 138 (86.8%) | 14 (10.1%) |
| 25 to 29 Years | 117 (87.3%) | 0 (0.0%) |
| 30 to 34 Years | 89 (96.7%) | 0 (0.0%) |
| 35 to 44 Years | 176 (68.8%) | 3 (1.7%) |
| 45 to 54 Years | 217 (89.3%) | 2 (0.9%) |
| 55 to 59 Years | 87 (87.9%) | 0 (0.0%) |
| 60 to 64 Years | 25 (35.7%) | 11 (44.0%) |
| 65 to 74 Years | 30 (29.4%) | 0 (0.0%) |
| 75 Years and over | 0 (0.0%) | 0 (0.0%) |
| Total | 915 (73.2%) | 34 (3.7%) |
Employment Status by Educational Attainment in Greenwood
According to labor force statistics for Greenwood, 79.5% of individuals (711) out of the total population between 25 and 64 years of age (894) are in the labor force, with 2.3% or 16 of them being unemployed. The group with the highest labor force participation rate are those with the educational attainment of bachelor's degree or higher, with 97.7% or 128 individuals in the labor force. Within the labor force, individuals with college / associate degree education have the highest percentage of unemployment, with 4.5% or 16 of them being unemployed.
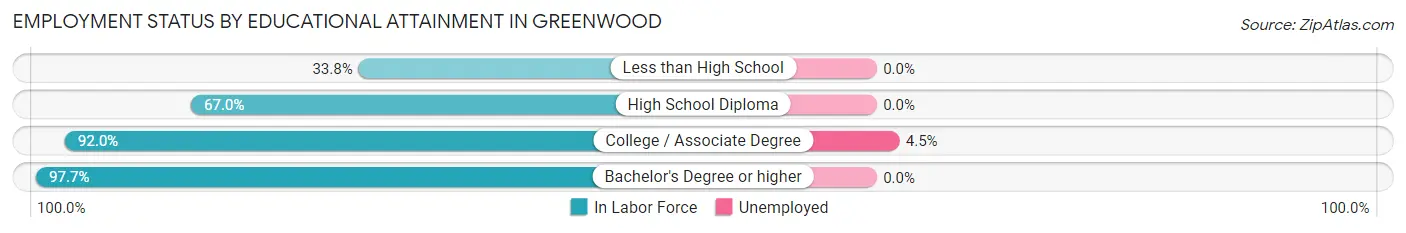
| Educational Attainment | In Labor Force | Unemployed |
| Less than High School | 26 (33.8%) | 0 (0.0%) |
| High School Diploma | 199 (67.0%) | 0 (0.0%) |
| College / Associate Degree | 358 (92.0%) | 18 (4.5%) |
| Bachelor's Degree or higher | 128 (97.7%) | 0 (0.0%) |
| Total | 711 (79.5%) | 21 (2.3%) |
Employment Occupations by Sex in Greenwood
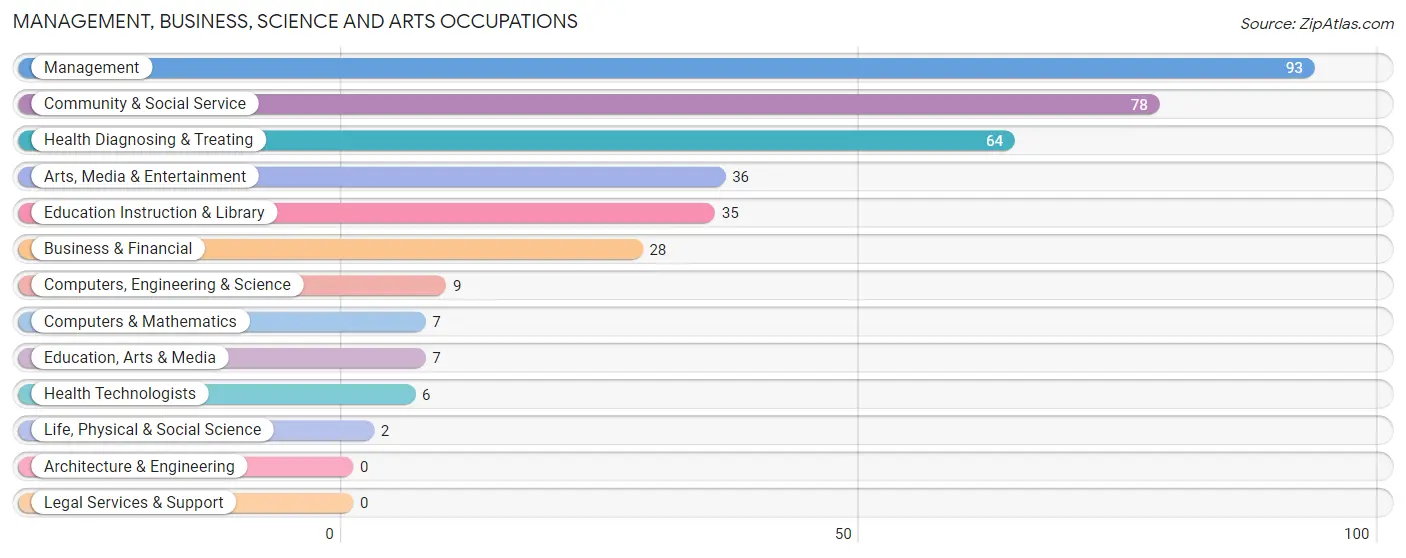
Management, Business, Science and Arts Occupations
The most common Management, Business, Science and Arts occupations in Greenwood are Management (93 | 10.6%), Community & Social Service (78 | 8.9%), Health Diagnosing & Treating (64 | 7.3%), Arts, Media & Entertainment (36 | 4.1%), and Education Instruction & Library (35 | 4.0%).
Management, Business, Science and Arts Occupations by Sex
Within the Management, Business, Science and Arts occupations in Greenwood, the most male-oriented occupations are Life, Physical & Social Science (100.0%), Arts, Media & Entertainment (100.0%), and Management (72.0%), while the most female-oriented occupations are Education, Arts & Media (100.0%), Education Instruction & Library (100.0%), and Health Diagnosing & Treating (93.8%).
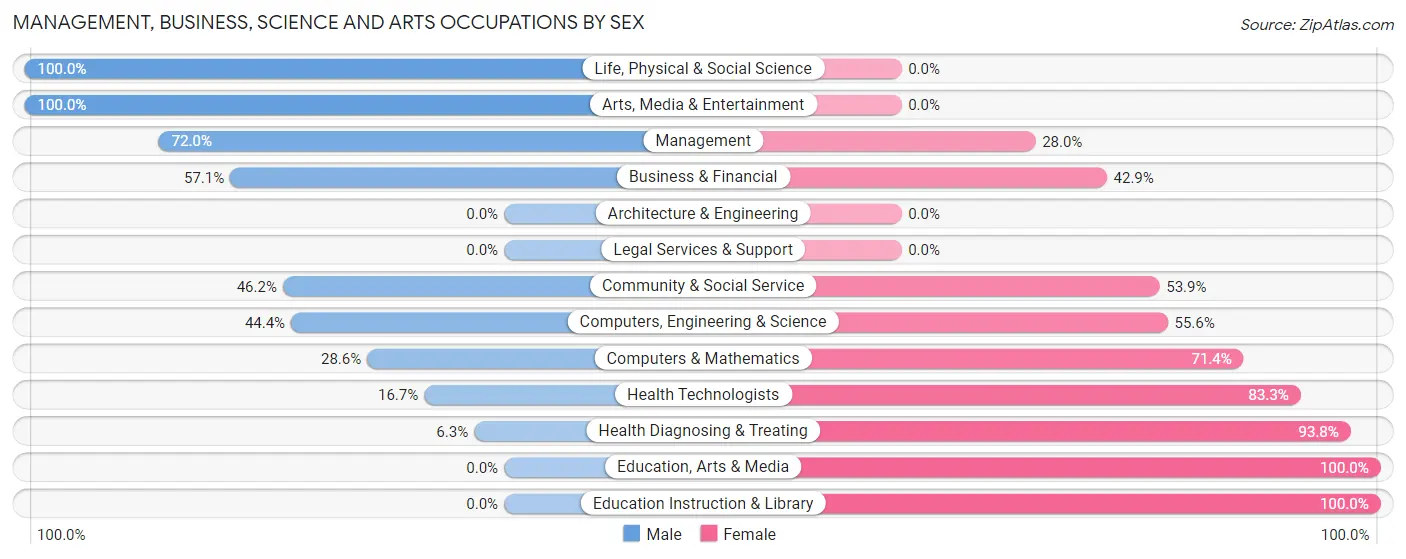
| Occupation | Male | Female |
| Management | 67 (72.0%) | 26 (28.0%) |
| Business & Financial | 16 (57.1%) | 12 (42.9%) |
| Computers, Engineering & Science | 4 (44.4%) | 5 (55.6%) |
| Computers & Mathematics | 2 (28.6%) | 5 (71.4%) |
| Architecture & Engineering | 0 (0.0%) | 0 (0.0%) |
| Life, Physical & Social Science | 2 (100.0%) | 0 (0.0%) |
| Community & Social Service | 36 (46.2%) | 42 (53.8%) |
| Education, Arts & Media | 0 (0.0%) | 7 (100.0%) |
| Legal Services & Support | 0 (0.0%) | 0 (0.0%) |
| Education Instruction & Library | 0 (0.0%) | 35 (100.0%) |
| Arts, Media & Entertainment | 36 (100.0%) | 0 (0.0%) |
| Health Diagnosing & Treating | 4 (6.2%) | 60 (93.8%) |
| Health Technologists | 1 (16.7%) | 5 (83.3%) |
| Total (Category) | 127 (46.7%) | 145 (53.3%) |
| Total (Overall) | 436 (49.7%) | 441 (50.3%) |
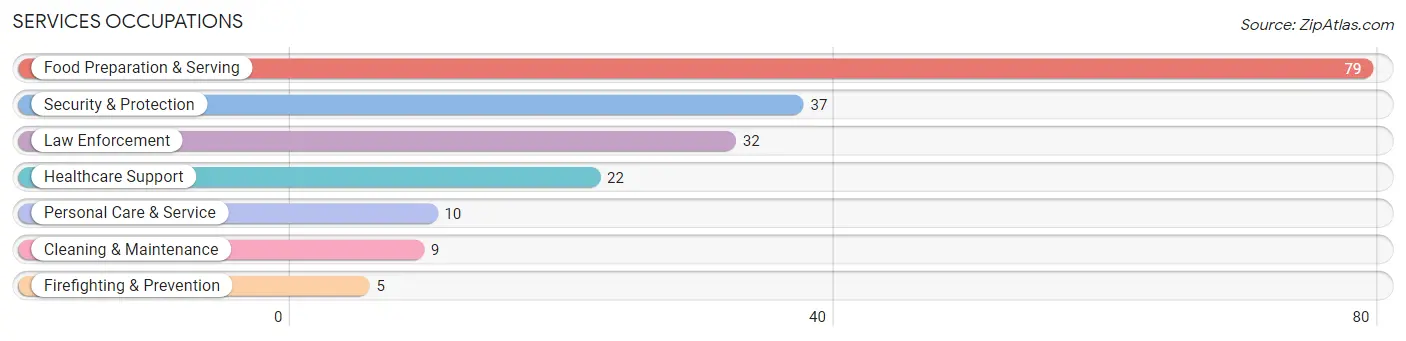
Services Occupations
The most common Services occupations in Greenwood are Food Preparation & Serving (79 | 9.0%), Security & Protection (37 | 4.2%), Law Enforcement (32 | 3.6%), Healthcare Support (22 | 2.5%), and Personal Care & Service (10 | 1.1%).
Services Occupations by Sex
Within the Services occupations in Greenwood, the most male-oriented occupations are Firefighting & Prevention (100.0%), Security & Protection (94.6%), and Law Enforcement (93.8%), while the most female-oriented occupations are Healthcare Support (100.0%), Personal Care & Service (70.0%), and Food Preparation & Serving (46.8%).
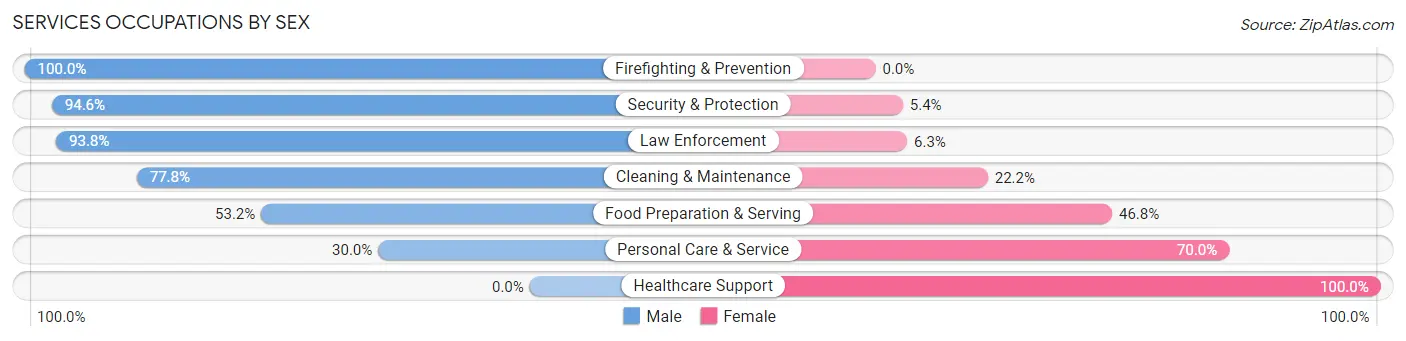
| Occupation | Male | Female |
| Healthcare Support | 0 (0.0%) | 22 (100.0%) |
| Security & Protection | 35 (94.6%) | 2 (5.4%) |
| Firefighting & Prevention | 5 (100.0%) | 0 (0.0%) |
| Law Enforcement | 30 (93.8%) | 2 (6.2%) |
| Food Preparation & Serving | 42 (53.2%) | 37 (46.8%) |
| Cleaning & Maintenance | 7 (77.8%) | 2 (22.2%) |
| Personal Care & Service | 3 (30.0%) | 7 (70.0%) |
| Total (Category) | 87 (55.4%) | 70 (44.6%) |
| Total (Overall) | 436 (49.7%) | 441 (50.3%) |
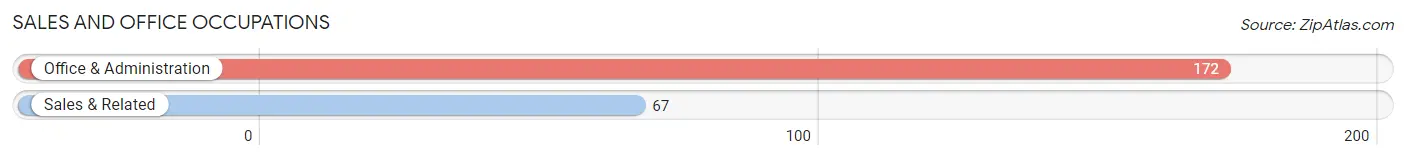
Sales and Office Occupations
The most common Sales and Office occupations in Greenwood are Office & Administration (172 | 19.6%), and Sales & Related (67 | 7.6%).
Sales and Office Occupations by Sex
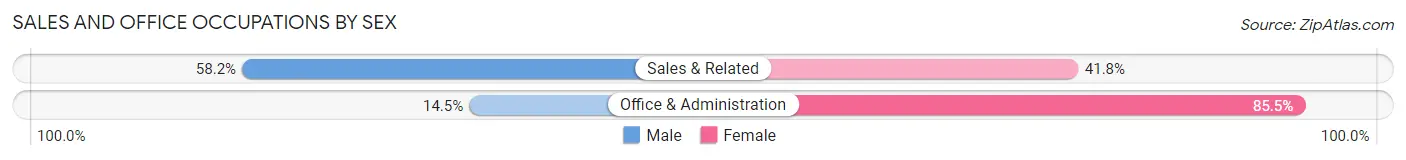
| Occupation | Male | Female |
| Sales & Related | 39 (58.2%) | 28 (41.8%) |
| Office & Administration | 25 (14.5%) | 147 (85.5%) |
| Total (Category) | 64 (26.8%) | 175 (73.2%) |
| Total (Overall) | 436 (49.7%) | 441 (50.3%) |
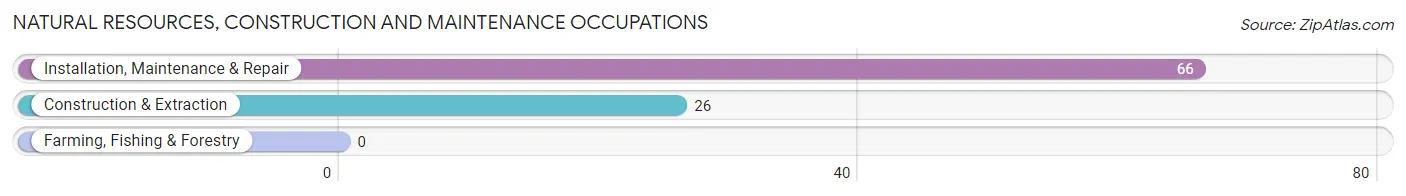
Natural Resources, Construction and Maintenance Occupations
The most common Natural Resources, Construction and Maintenance occupations in Greenwood are Installation, Maintenance & Repair (66 | 7.5%), and Construction & Extraction (26 | 3.0%).
Natural Resources, Construction and Maintenance Occupations by Sex
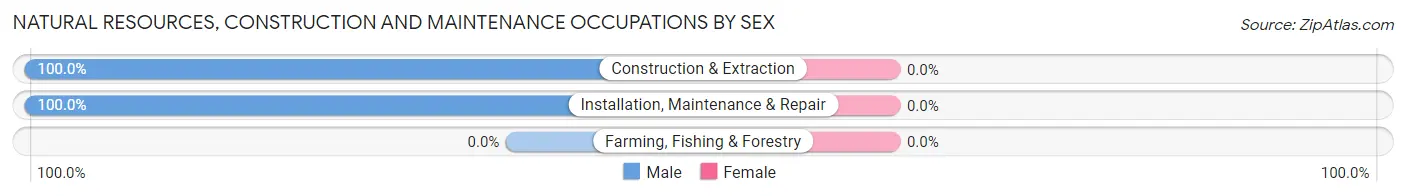
| Occupation | Male | Female |
| Farming, Fishing & Forestry | 0 (0.0%) | 0 (0.0%) |
| Construction & Extraction | 26 (100.0%) | 0 (0.0%) |
| Installation, Maintenance & Repair | 66 (100.0%) | 0 (0.0%) |
| Total (Category) | 92 (100.0%) | 0 (0.0%) |
| Total (Overall) | 436 (49.7%) | 441 (50.3%) |
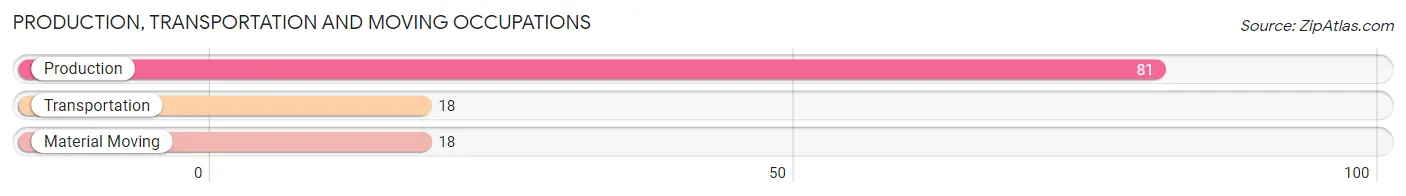
Production, Transportation and Moving Occupations
The most common Production, Transportation and Moving occupations in Greenwood are Production (81 | 9.2%), Transportation (18 | 2.1%), and Material Moving (18 | 2.1%).
Production, Transportation and Moving Occupations by Sex
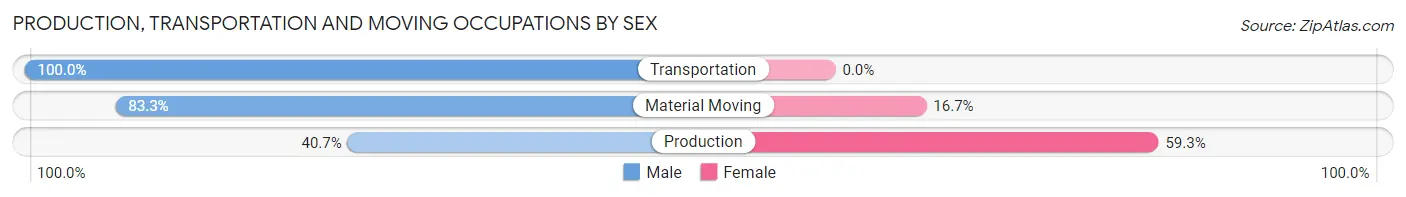
| Occupation | Male | Female |
| Production | 33 (40.7%) | 48 (59.3%) |
| Transportation | 18 (100.0%) | 0 (0.0%) |
| Material Moving | 15 (83.3%) | 3 (16.7%) |
| Total (Category) | 66 (56.4%) | 51 (43.6%) |
| Total (Overall) | 436 (49.7%) | 441 (50.3%) |
Employment Industries by Sex in Greenwood
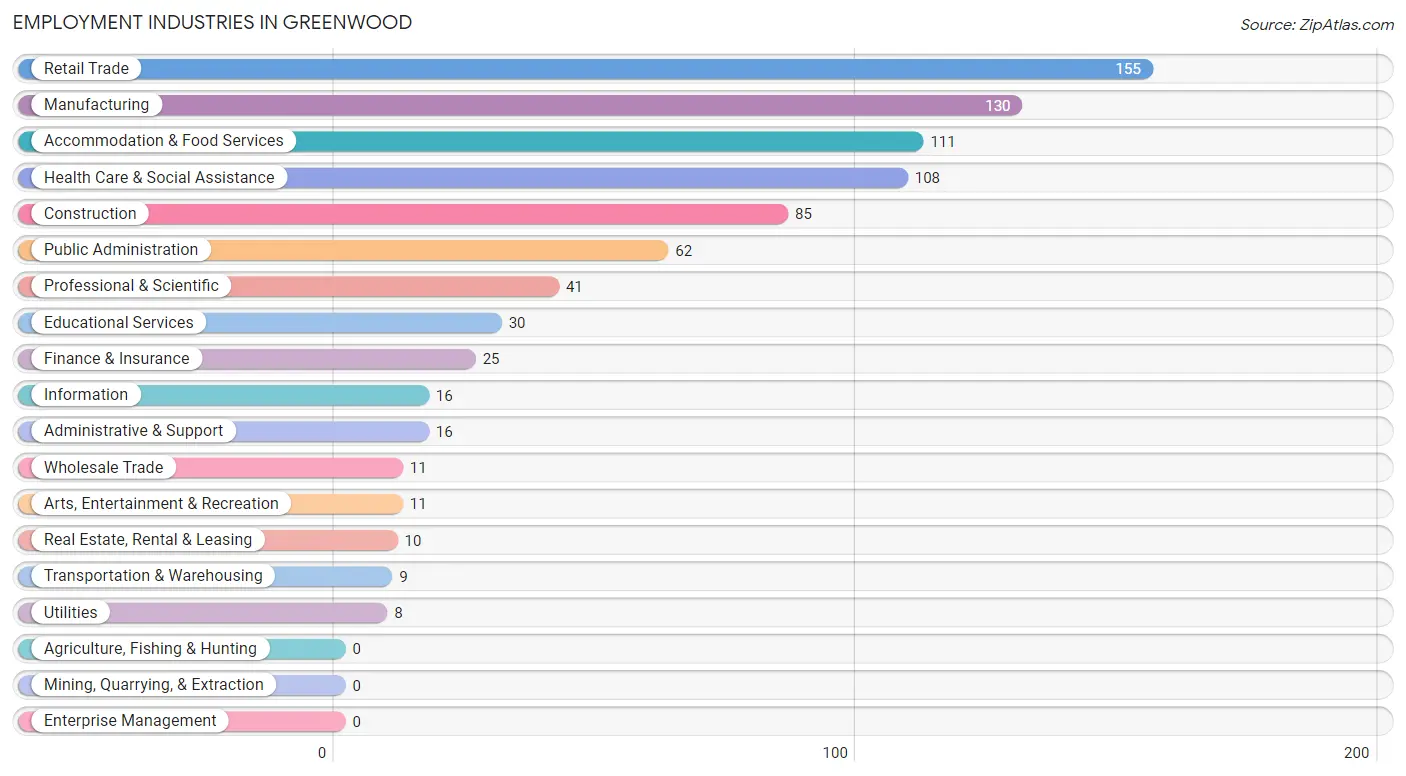
Employment Industries in Greenwood
The major employment industries in Greenwood include Retail Trade (155 | 17.7%), Manufacturing (130 | 14.8%), Accommodation & Food Services (111 | 12.7%), Health Care & Social Assistance (108 | 12.3%), and Construction (85 | 9.7%).
Employment Industries by Sex in Greenwood
The Greenwood industries that see more men than women are Wholesale Trade (100.0%), Transportation & Warehousing (100.0%), and Utilities (100.0%), whereas the industries that tend to have a higher number of women are Finance & Insurance (100.0%), Educational Services (100.0%), and Arts, Entertainment & Recreation (100.0%).
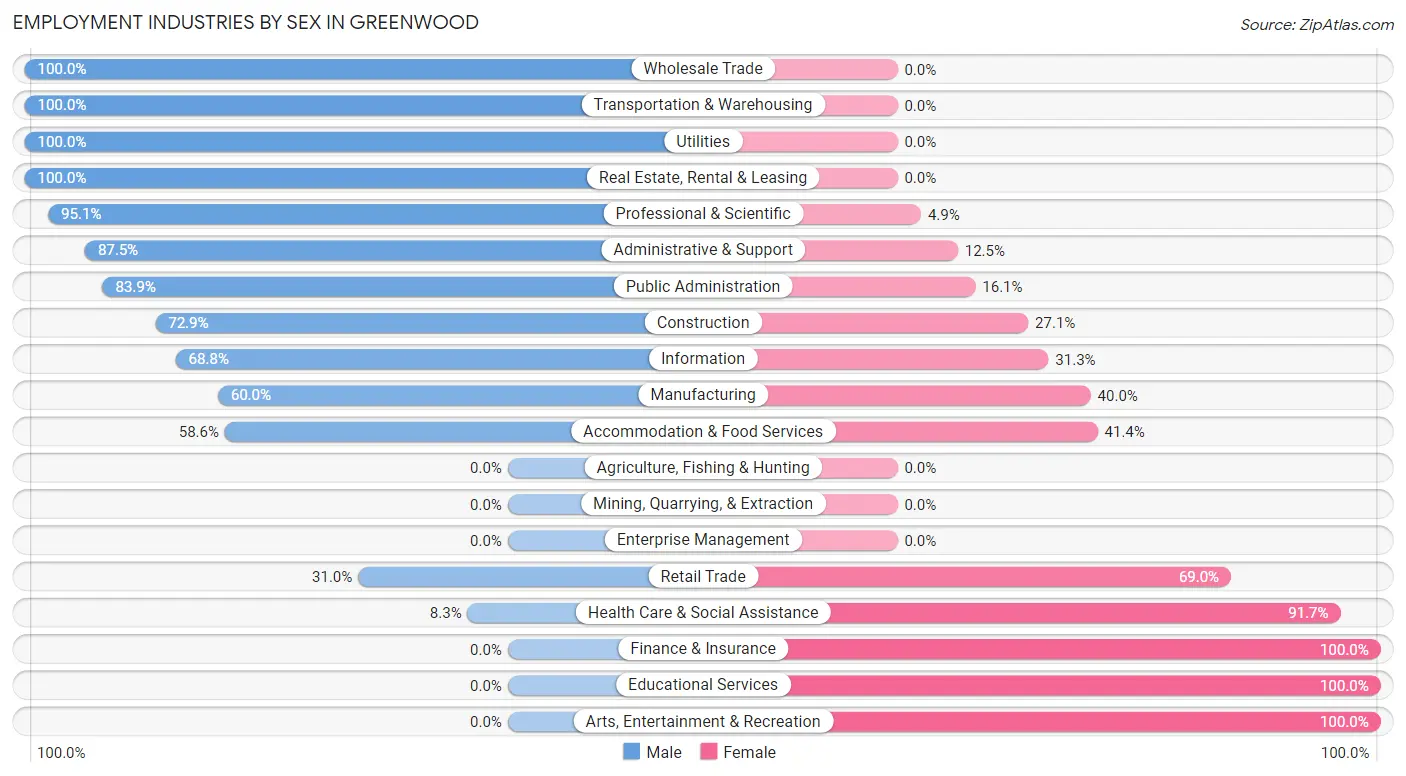
| Industry | Male | Female |
| Agriculture, Fishing & Hunting | 0 (0.0%) | 0 (0.0%) |
| Mining, Quarrying, & Extraction | 0 (0.0%) | 0 (0.0%) |
| Construction | 62 (72.9%) | 23 (27.1%) |
| Manufacturing | 78 (60.0%) | 52 (40.0%) |
| Wholesale Trade | 11 (100.0%) | 0 (0.0%) |
| Retail Trade | 48 (31.0%) | 107 (69.0%) |
| Transportation & Warehousing | 9 (100.0%) | 0 (0.0%) |
| Utilities | 8 (100.0%) | 0 (0.0%) |
| Information | 11 (68.8%) | 5 (31.2%) |
| Finance & Insurance | 0 (0.0%) | 25 (100.0%) |
| Real Estate, Rental & Leasing | 10 (100.0%) | 0 (0.0%) |
| Professional & Scientific | 39 (95.1%) | 2 (4.9%) |
| Enterprise Management | 0 (0.0%) | 0 (0.0%) |
| Administrative & Support | 14 (87.5%) | 2 (12.5%) |
| Educational Services | 0 (0.0%) | 30 (100.0%) |
| Health Care & Social Assistance | 9 (8.3%) | 99 (91.7%) |
| Arts, Entertainment & Recreation | 0 (0.0%) | 11 (100.0%) |
| Accommodation & Food Services | 65 (58.6%) | 46 (41.4%) |
| Public Administration | 52 (83.9%) | 10 (16.1%) |
| Total | 436 (49.7%) | 441 (50.3%) |
Education in Greenwood
School Enrollment in Greenwood
The most common levels of schooling among the 355 students in Greenwood are college / undergraduate (100 | 28.2%), high school (89 | 25.1%), and middle school (87 | 24.5%).
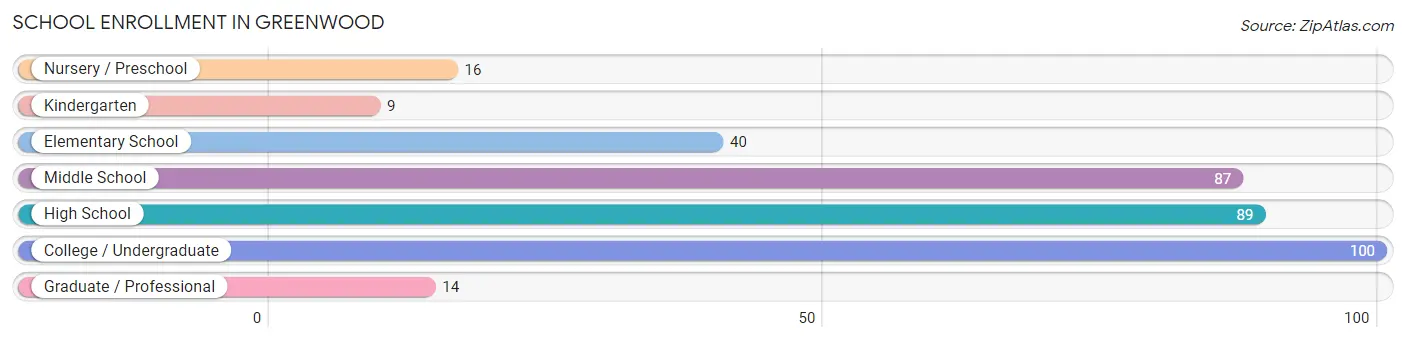
| School Level | # Students | % Students |
| Nursery / Preschool | 16 | 4.5% |
| Kindergarten | 9 | 2.5% |
| Elementary School | 40 | 11.3% |
| Middle School | 87 | 24.5% |
| High School | 89 | 25.1% |
| College / Undergraduate | 100 | 28.2% |
| Graduate / Professional | 14 | 3.9% |
| Total | 355 | 100.0% |
School Enrollment by Age by Funding Source in Greenwood
Out of a total of 355 students who are enrolled in schools in Greenwood, 80 (22.5%) attend a private institution, while the remaining 275 (77.5%) are enrolled in public schools. The age group of 35 years and over has the highest likelihood of being enrolled in private schools, with 53 (73.6% in the age bracket) enrolled. Conversely, the age group of 15 to 17 year olds has the lowest likelihood of being enrolled in a private school, with 46 (100.0% in the age bracket) attending a public institution.
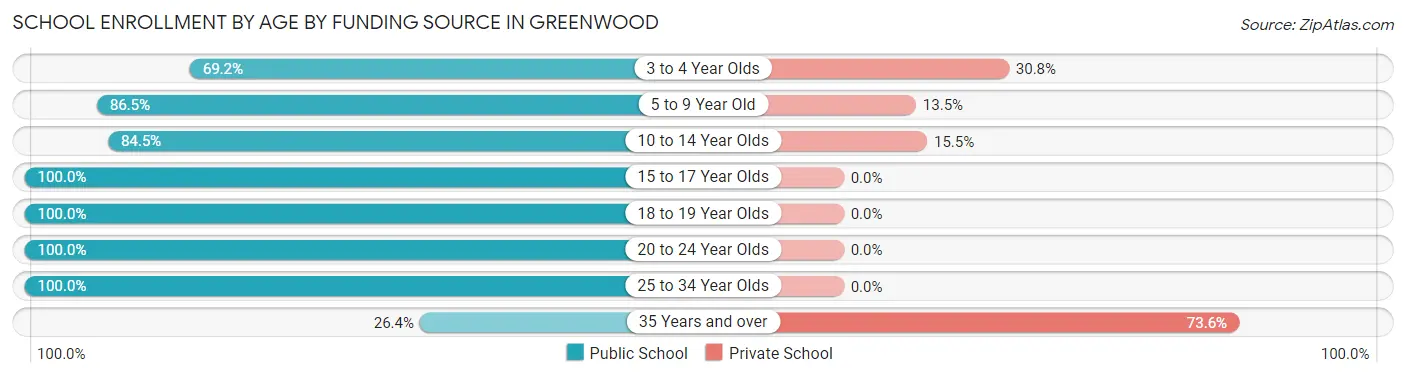
| Age Bracket | Public School | Private School |
| 3 to 4 Year Olds | 9 (69.2%) | 4 (30.8%) |
| 5 to 9 Year Old | 45 (86.5%) | 7 (13.5%) |
| 10 to 14 Year Olds | 87 (84.5%) | 16 (15.5%) |
| 15 to 17 Year Olds | 46 (100.0%) | 0 (0.0%) |
| 18 to 19 Year Olds | 20 (100.0%) | 0 (0.0%) |
| 20 to 24 Year Olds | 35 (100.0%) | 0 (0.0%) |
| 25 to 34 Year Olds | 14 (100.0%) | 0 (0.0%) |
| 35 Years and over | 19 (26.4%) | 53 (73.6%) |
| Total | 275 (77.5%) | 80 (22.5%) |
Educational Attainment by Field of Study in Greenwood
Science & technology (54 | 33.3%), business (24 | 14.8%), education (24 | 14.8%), liberal arts & history (15 | 9.3%), and arts & humanities (13 | 8.0%) are the most common fields of study among 162 individuals in Greenwood who have obtained a bachelor's degree or higher.
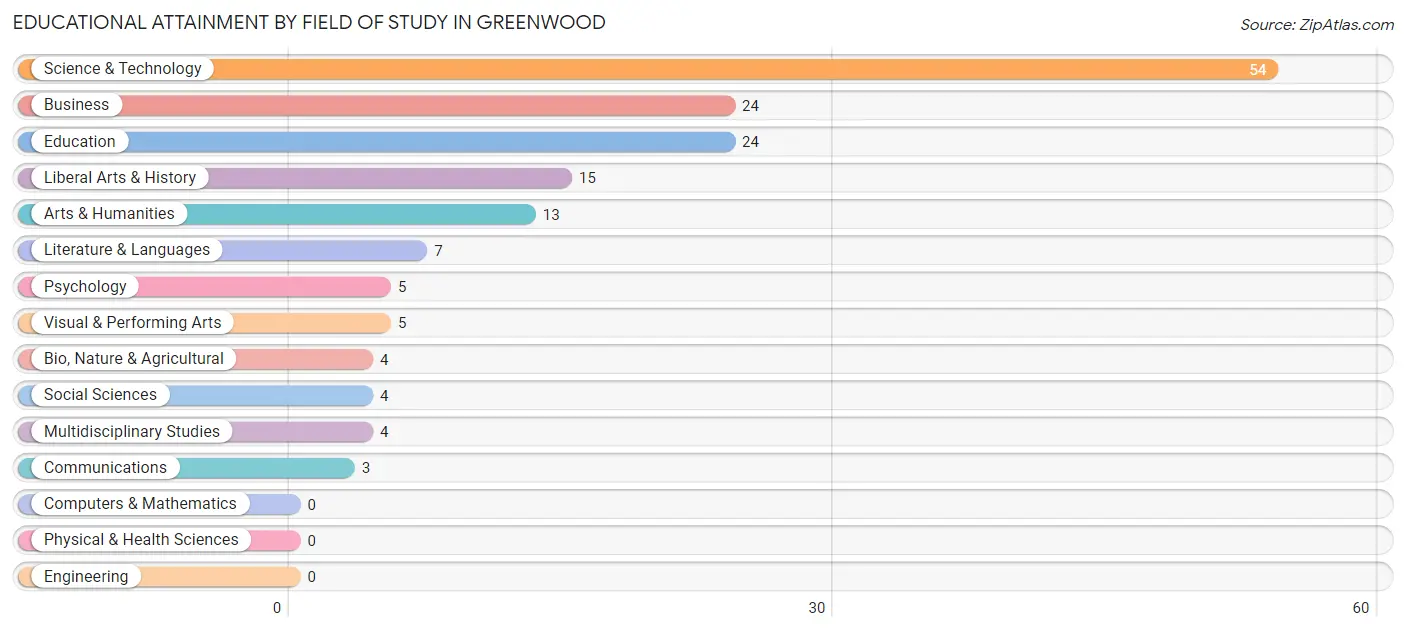
| Field of Study | # Graduates | % Graduates |
| Computers & Mathematics | 0 | 0.0% |
| Bio, Nature & Agricultural | 4 | 2.5% |
| Physical & Health Sciences | 0 | 0.0% |
| Psychology | 5 | 3.1% |
| Social Sciences | 4 | 2.5% |
| Engineering | 0 | 0.0% |
| Multidisciplinary Studies | 4 | 2.5% |
| Science & Technology | 54 | 33.3% |
| Business | 24 | 14.8% |
| Education | 24 | 14.8% |
| Literature & Languages | 7 | 4.3% |
| Liberal Arts & History | 15 | 9.3% |
| Visual & Performing Arts | 5 | 3.1% |
| Communications | 3 | 1.8% |
| Arts & Humanities | 13 | 8.0% |
| Total | 162 | 100.0% |
Transportation & Commute in Greenwood
Vehicle Availability by Sex in Greenwood
The most prevalent vehicle ownership categories in Greenwood are males with 2 vehicles (133, accounting for 30.7%) and females with 2 vehicles (80, making up 30.6%).
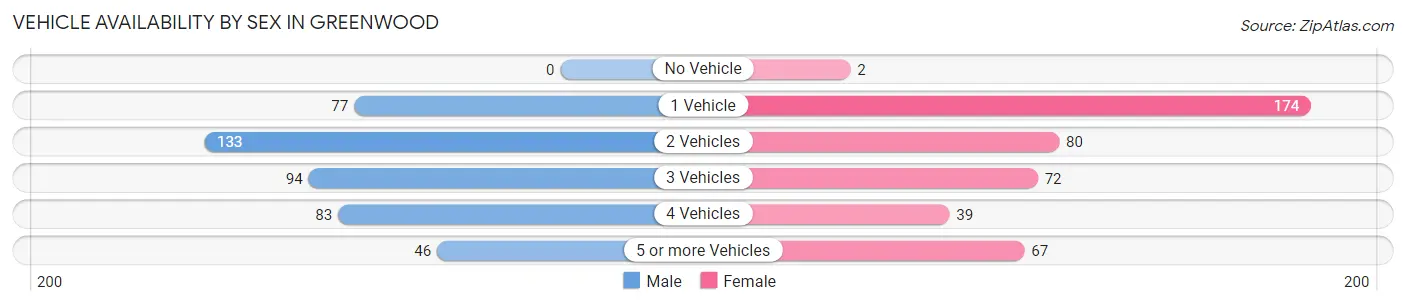
| Vehicles Available | Male | Female |
| No Vehicle | 0 (0.0%) | 2 (0.5%) |
| 1 Vehicle | 77 (17.8%) | 174 (40.1%) |
| 2 Vehicles | 133 (30.7%) | 80 (18.4%) |
| 3 Vehicles | 94 (21.7%) | 72 (16.6%) |
| 4 Vehicles | 83 (19.2%) | 39 (9.0%) |
| 5 or more Vehicles | 46 (10.6%) | 67 (15.4%) |
| Total | 433 (100.0%) | 434 (100.0%) |
Commute Time in Greenwood
The most frequently occuring commute durations in Greenwood are 40 to 44 minutes (175 commuters, 21.5%), 30 to 34 minutes (105 commuters, 12.9%), and 25 to 29 minutes (97 commuters, 11.9%).
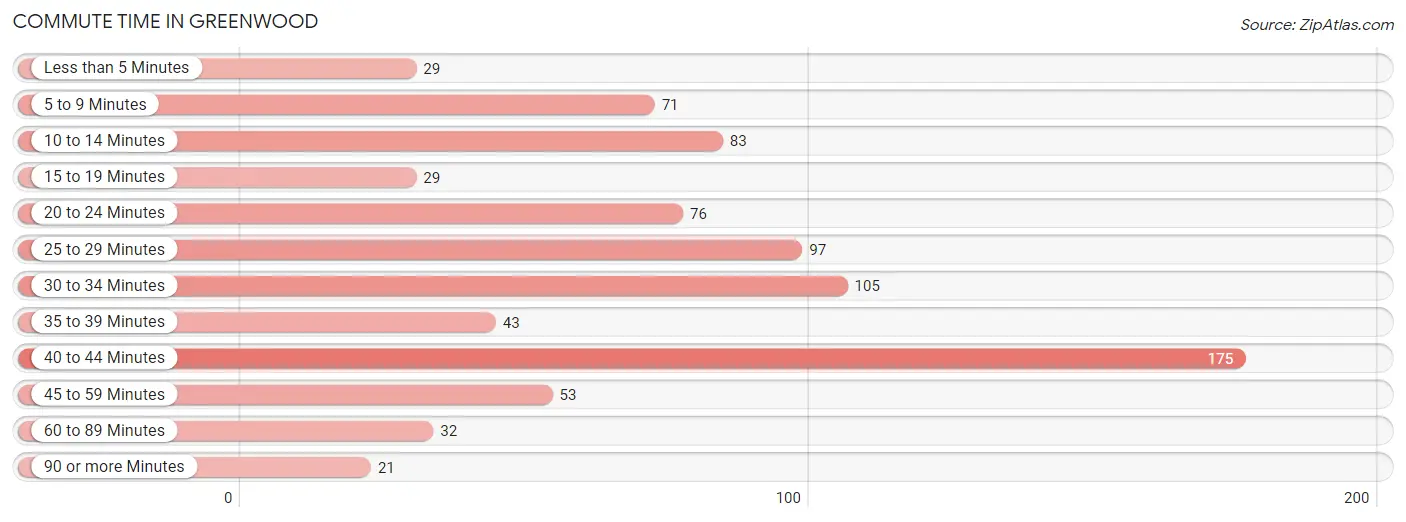
| Commute Time | # Commuters | % Commuters |
| Less than 5 Minutes | 29 | 3.6% |
| 5 to 9 Minutes | 71 | 8.7% |
| 10 to 14 Minutes | 83 | 10.2% |
| 15 to 19 Minutes | 29 | 3.6% |
| 20 to 24 Minutes | 76 | 9.3% |
| 25 to 29 Minutes | 97 | 11.9% |
| 30 to 34 Minutes | 105 | 12.9% |
| 35 to 39 Minutes | 43 | 5.3% |
| 40 to 44 Minutes | 175 | 21.5% |
| 45 to 59 Minutes | 53 | 6.5% |
| 60 to 89 Minutes | 32 | 3.9% |
| 90 or more Minutes | 21 | 2.6% |
Commute Time by Sex in Greenwood
The most common commute times in Greenwood are 40 to 44 minutes (74 commuters, 18.7%) for males and 40 to 44 minutes (101 commuters, 24.1%) for females.
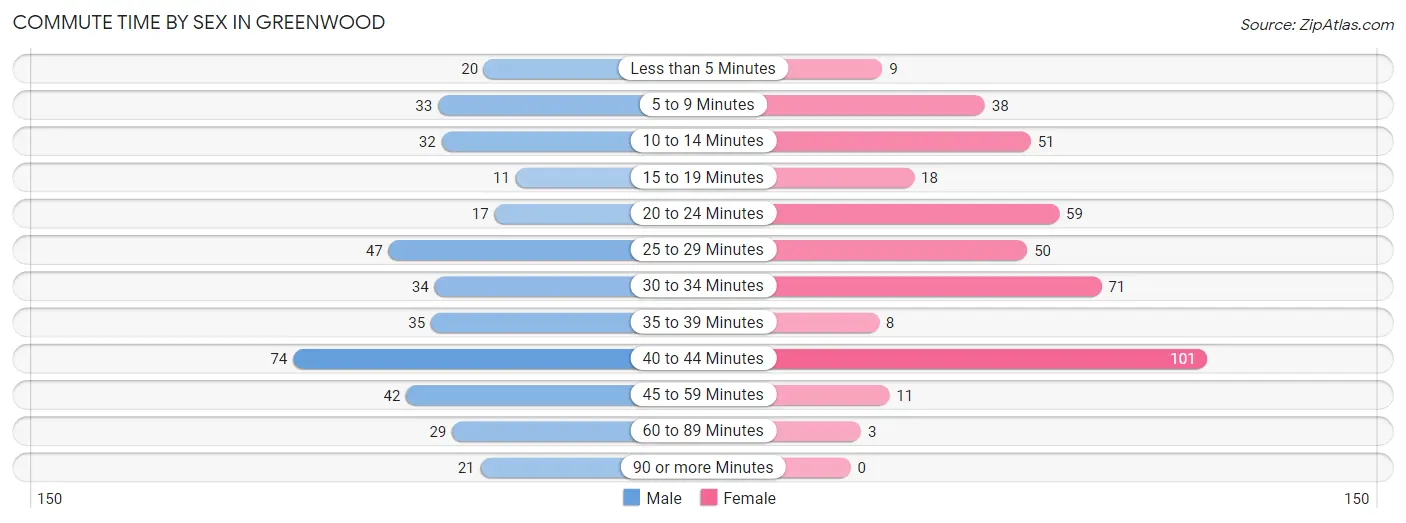
| Commute Time | Male | Female |
| Less than 5 Minutes | 20 (5.1%) | 9 (2.1%) |
| 5 to 9 Minutes | 33 (8.4%) | 38 (9.1%) |
| 10 to 14 Minutes | 32 (8.1%) | 51 (12.2%) |
| 15 to 19 Minutes | 11 (2.8%) | 18 (4.3%) |
| 20 to 24 Minutes | 17 (4.3%) | 59 (14.1%) |
| 25 to 29 Minutes | 47 (11.9%) | 50 (11.9%) |
| 30 to 34 Minutes | 34 (8.6%) | 71 (17.0%) |
| 35 to 39 Minutes | 35 (8.9%) | 8 (1.9%) |
| 40 to 44 Minutes | 74 (18.7%) | 101 (24.1%) |
| 45 to 59 Minutes | 42 (10.6%) | 11 (2.6%) |
| 60 to 89 Minutes | 29 (7.3%) | 3 (0.7%) |
| 90 or more Minutes | 21 (5.3%) | 0 (0.0%) |
Time of Departure to Work by Sex in Greenwood
The most frequent times of departure to work in Greenwood are 8:00 AM to 8:29 AM (75, 19.0%) for males and 6:30 AM to 6:59 AM (65, 15.5%) for females.
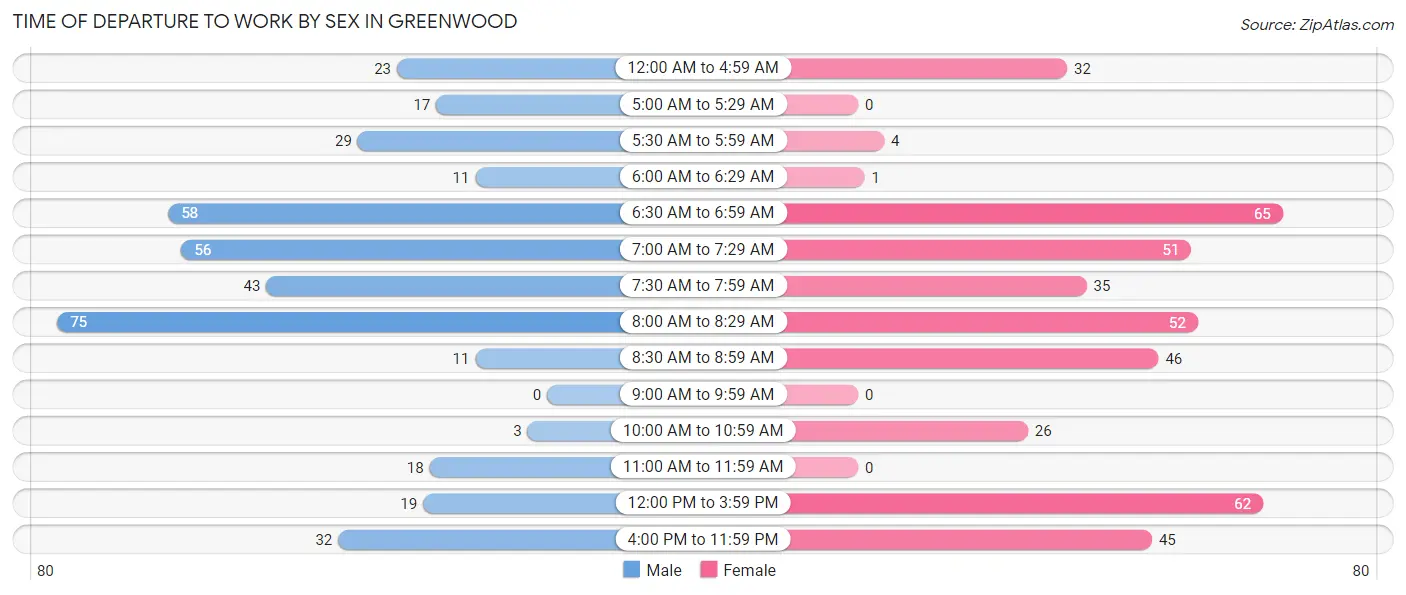
| Time of Departure | Male | Female |
| 12:00 AM to 4:59 AM | 23 (5.8%) | 32 (7.6%) |
| 5:00 AM to 5:29 AM | 17 (4.3%) | 0 (0.0%) |
| 5:30 AM to 5:59 AM | 29 (7.3%) | 4 (0.9%) |
| 6:00 AM to 6:29 AM | 11 (2.8%) | 1 (0.2%) |
| 6:30 AM to 6:59 AM | 58 (14.7%) | 65 (15.5%) |
| 7:00 AM to 7:29 AM | 56 (14.2%) | 51 (12.2%) |
| 7:30 AM to 7:59 AM | 43 (10.9%) | 35 (8.4%) |
| 8:00 AM to 8:29 AM | 75 (19.0%) | 52 (12.4%) |
| 8:30 AM to 8:59 AM | 11 (2.8%) | 46 (11.0%) |
| 9:00 AM to 9:59 AM | 0 (0.0%) | 0 (0.0%) |
| 10:00 AM to 10:59 AM | 3 (0.8%) | 26 (6.2%) |
| 11:00 AM to 11:59 AM | 18 (4.6%) | 0 (0.0%) |
| 12:00 PM to 3:59 PM | 19 (4.8%) | 62 (14.8%) |
| 4:00 PM to 11:59 PM | 32 (8.1%) | 45 (10.7%) |
| Total | 395 (100.0%) | 419 (100.0%) |
Housing Occupancy in Greenwood
Occupancy by Ownership in Greenwood
Of the total 635 dwellings in Greenwood, owner-occupied units account for 260 (40.9%), while renter-occupied units make up 375 (59.1%).
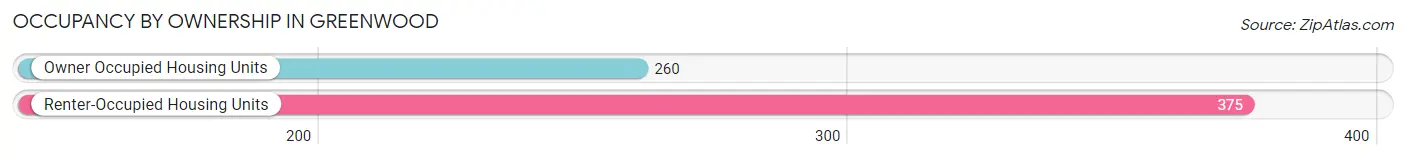
| Occupancy | # Housing Units | % Housing Units |
| Owner Occupied Housing Units | 260 | 40.9% |
| Renter-Occupied Housing Units | 375 | 59.1% |
| Total Occupied Housing Units | 635 | 100.0% |
Occupancy by Household Size in Greenwood
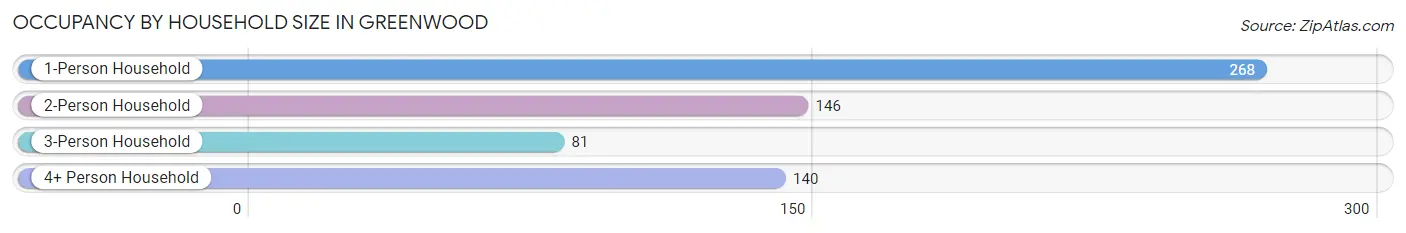
| Household Size | # Housing Units | % Housing Units |
| 1-Person Household | 268 | 42.2% |
| 2-Person Household | 146 | 23.0% |
| 3-Person Household | 81 | 12.8% |
| 4+ Person Household | 140 | 22.1% |
| Total Housing Units | 635 | 100.0% |
Occupancy by Ownership by Household Size in Greenwood
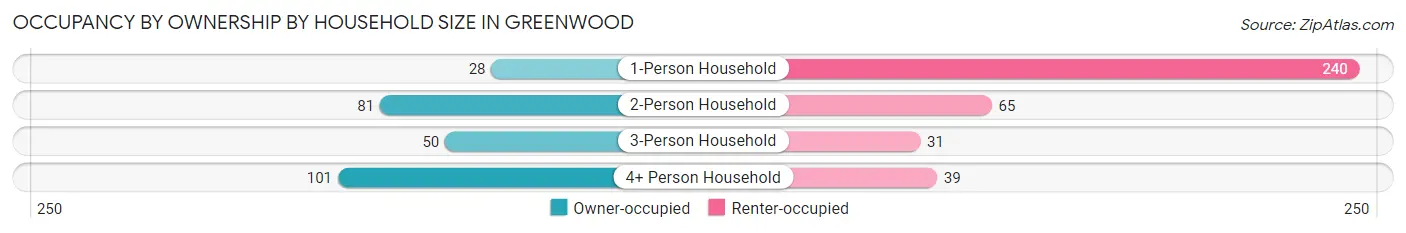
| Household Size | Owner-occupied | Renter-occupied |
| 1-Person Household | 28 (10.4%) | 240 (89.5%) |
| 2-Person Household | 81 (55.5%) | 65 (44.5%) |
| 3-Person Household | 50 (61.7%) | 31 (38.3%) |
| 4+ Person Household | 101 (72.1%) | 39 (27.9%) |
| Total Housing Units | 260 (40.9%) | 375 (59.1%) |
Occupancy by Educational Attainment in Greenwood
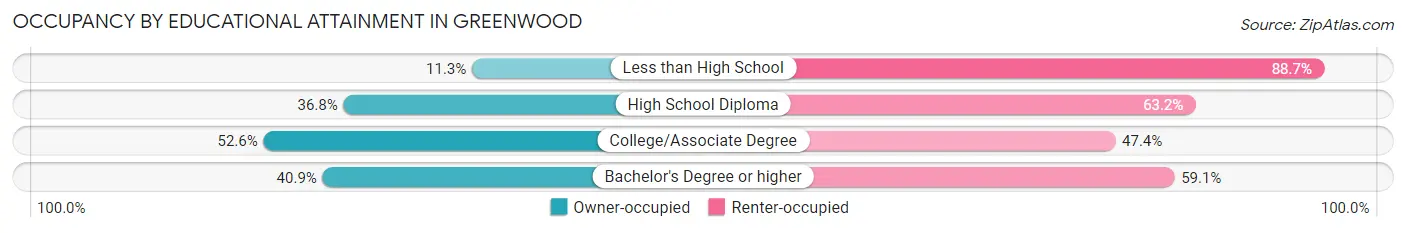
| Household Size | Owner-occupied | Renter-occupied |
| Less than High School | 8 (11.3%) | 63 (88.7%) |
| High School Diploma | 68 (36.8%) | 117 (63.2%) |
| College/Associate Degree | 130 (52.6%) | 117 (47.4%) |
| Bachelor's Degree or higher | 54 (40.9%) | 78 (59.1%) |
Occupancy by Age of Householder in Greenwood
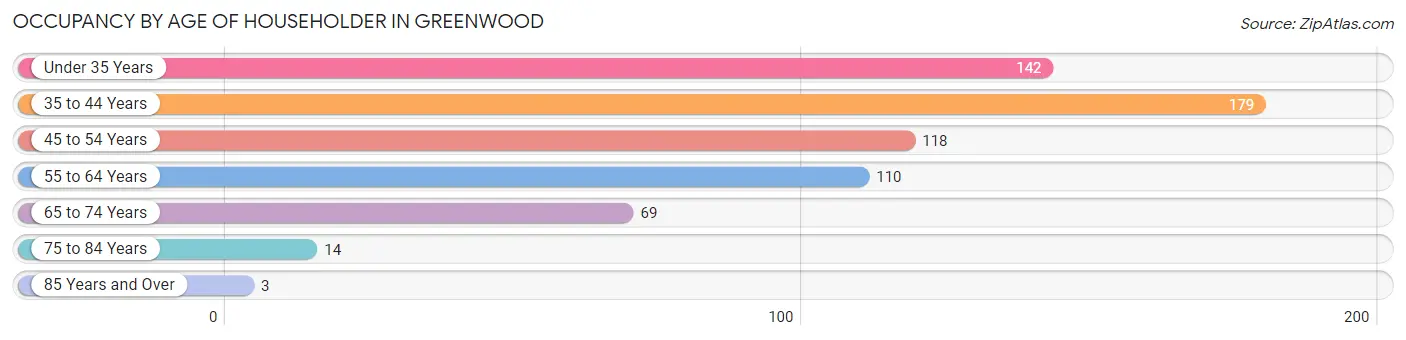
| Age Bracket | # Households | % Households |
| Under 35 Years | 142 | 22.4% |
| 35 to 44 Years | 179 | 28.2% |
| 45 to 54 Years | 118 | 18.6% |
| 55 to 64 Years | 110 | 17.3% |
| 65 to 74 Years | 69 | 10.9% |
| 75 to 84 Years | 14 | 2.2% |
| 85 Years and Over | 3 | 0.5% |
| Total | 635 | 100.0% |
Housing Finances in Greenwood
Median Income by Occupancy in Greenwood
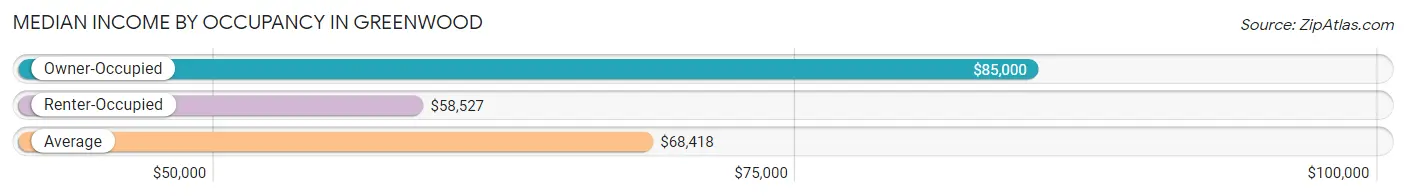
| Occupancy Type | # Households | Median Income |
| Owner-Occupied | 260 (40.9%) | $85,000 |
| Renter-Occupied | 375 (59.1%) | $58,527 |
| Average | 635 (100.0%) | $68,418 |
Occupancy by Householder Income Bracket in Greenwood
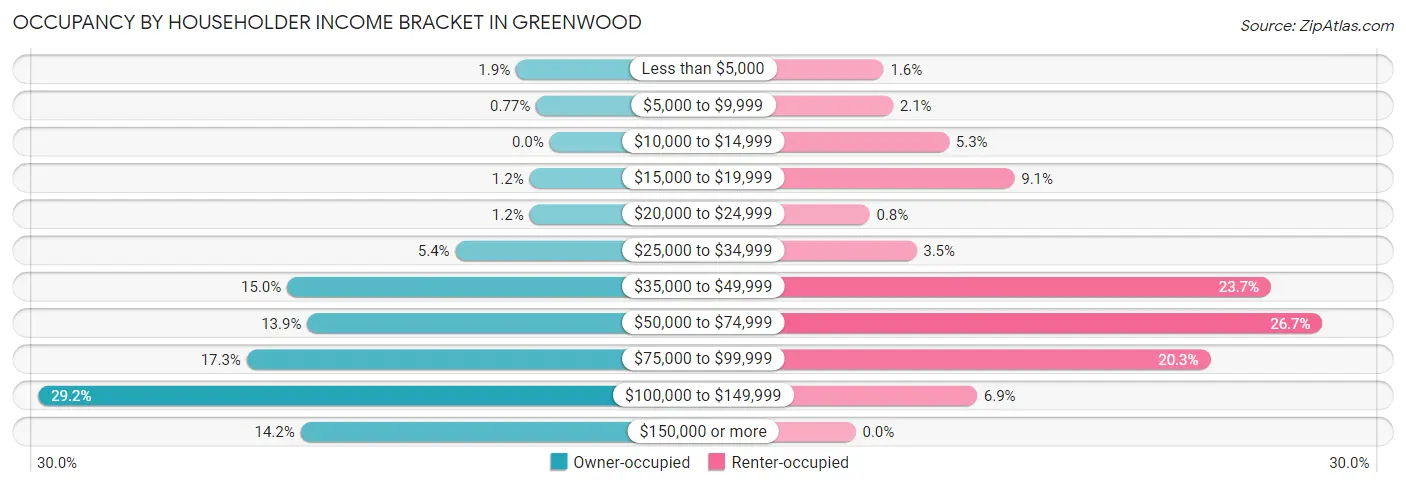
| Income Bracket | Owner-occupied | Renter-occupied |
| Less than $5,000 | 5 (1.9%) | 6 (1.6%) |
| $5,000 to $9,999 | 2 (0.8%) | 8 (2.1%) |
| $10,000 to $14,999 | 0 (0.0%) | 20 (5.3%) |
| $15,000 to $19,999 | 3 (1.1%) | 34 (9.1%) |
| $20,000 to $24,999 | 3 (1.1%) | 3 (0.8%) |
| $25,000 to $34,999 | 14 (5.4%) | 13 (3.5%) |
| $35,000 to $49,999 | 39 (15.0%) | 89 (23.7%) |
| $50,000 to $74,999 | 36 (13.9%) | 100 (26.7%) |
| $75,000 to $99,999 | 45 (17.3%) | 76 (20.3%) |
| $100,000 to $149,999 | 76 (29.2%) | 26 (6.9%) |
| $150,000 or more | 37 (14.2%) | 0 (0.0%) |
| Total | 260 (100.0%) | 375 (100.0%) |
Monthly Housing Cost Tiers in Greenwood
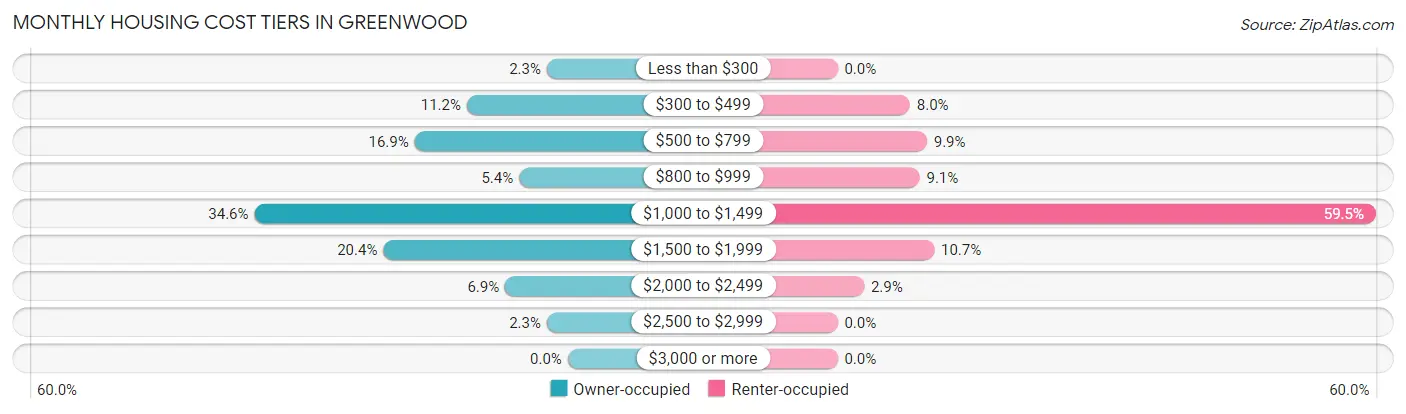
| Monthly Cost | Owner-occupied | Renter-occupied |
| Less than $300 | 6 (2.3%) | 0 (0.0%) |
| $300 to $499 | 29 (11.2%) | 30 (8.0%) |
| $500 to $799 | 44 (16.9%) | 37 (9.9%) |
| $800 to $999 | 14 (5.4%) | 34 (9.1%) |
| $1,000 to $1,499 | 90 (34.6%) | 223 (59.5%) |
| $1,500 to $1,999 | 53 (20.4%) | 40 (10.7%) |
| $2,000 to $2,499 | 18 (6.9%) | 11 (2.9%) |
| $2,500 to $2,999 | 6 (2.3%) | 0 (0.0%) |
| $3,000 or more | 0 (0.0%) | 0 (0.0%) |
| Total | 260 (100.0%) | 375 (100.0%) |
Physical Housing Characteristics in Greenwood
Housing Structures in Greenwood
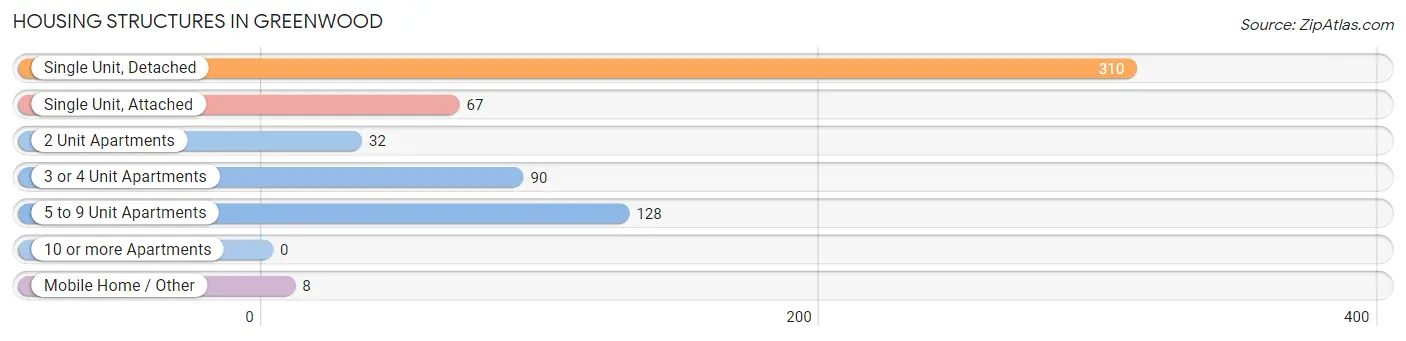
| Structure Type | # Housing Units | % Housing Units |
| Single Unit, Detached | 310 | 48.8% |
| Single Unit, Attached | 67 | 10.5% |
| 2 Unit Apartments | 32 | 5.0% |
| 3 or 4 Unit Apartments | 90 | 14.2% |
| 5 to 9 Unit Apartments | 128 | 20.2% |
| 10 or more Apartments | 0 | 0.0% |
| Mobile Home / Other | 8 | 1.3% |
| Total | 635 | 100.0% |
Housing Structures by Occupancy in Greenwood
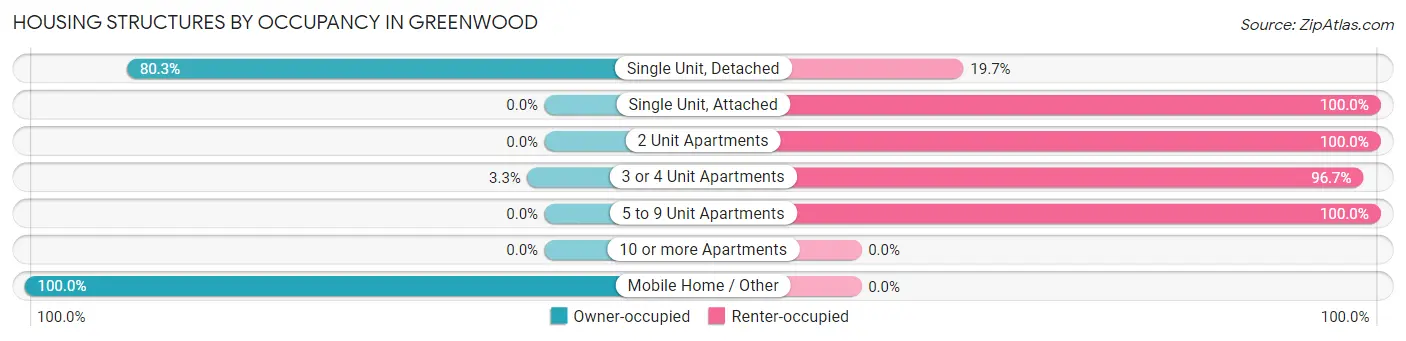
| Structure Type | Owner-occupied | Renter-occupied |
| Single Unit, Detached | 249 (80.3%) | 61 (19.7%) |
| Single Unit, Attached | 0 (0.0%) | 67 (100.0%) |
| 2 Unit Apartments | 0 (0.0%) | 32 (100.0%) |
| 3 or 4 Unit Apartments | 3 (3.3%) | 87 (96.7%) |
| 5 to 9 Unit Apartments | 0 (0.0%) | 128 (100.0%) |
| 10 or more Apartments | 0 (0.0%) | 0 (0.0%) |
| Mobile Home / Other | 8 (100.0%) | 0 (0.0%) |
| Total | 260 (40.9%) | 375 (59.1%) |
Housing Structures by Number of Rooms in Greenwood
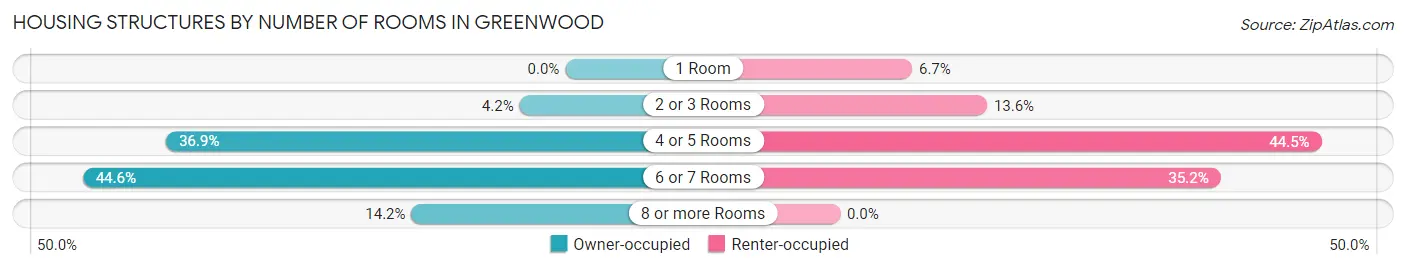
| Number of Rooms | Owner-occupied | Renter-occupied |
| 1 Room | 0 (0.0%) | 25 (6.7%) |
| 2 or 3 Rooms | 11 (4.2%) | 51 (13.6%) |
| 4 or 5 Rooms | 96 (36.9%) | 167 (44.5%) |
| 6 or 7 Rooms | 116 (44.6%) | 132 (35.2%) |
| 8 or more Rooms | 37 (14.2%) | 0 (0.0%) |
| Total | 260 (100.0%) | 375 (100.0%) |
Housing Structure by Heating Type in Greenwood
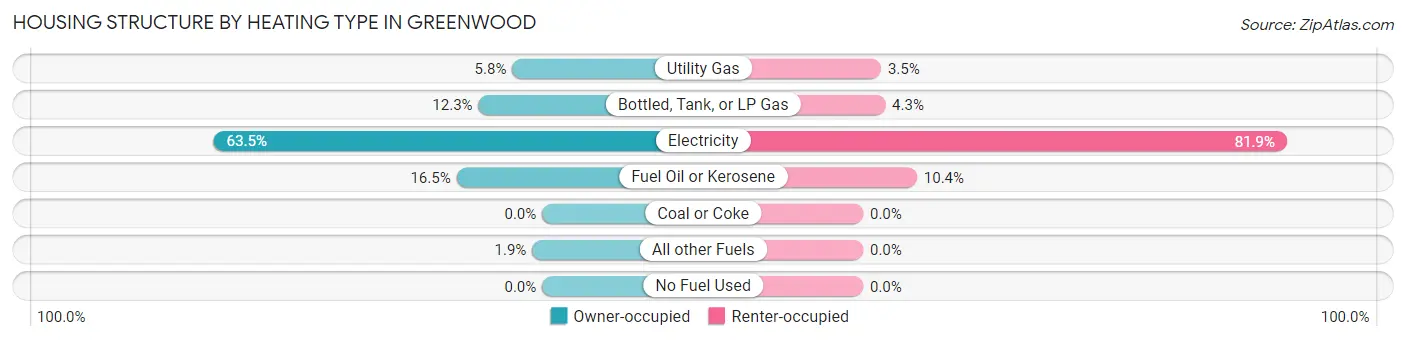
| Heating Type | Owner-occupied | Renter-occupied |
| Utility Gas | 15 (5.8%) | 13 (3.5%) |
| Bottled, Tank, or LP Gas | 32 (12.3%) | 16 (4.3%) |
| Electricity | 165 (63.5%) | 307 (81.9%) |
| Fuel Oil or Kerosene | 43 (16.5%) | 39 (10.4%) |
| Coal or Coke | 0 (0.0%) | 0 (0.0%) |
| All other Fuels | 5 (1.9%) | 0 (0.0%) |
| No Fuel Used | 0 (0.0%) | 0 (0.0%) |
| Total | 260 (100.0%) | 375 (100.0%) |
Household Vehicle Usage in Greenwood
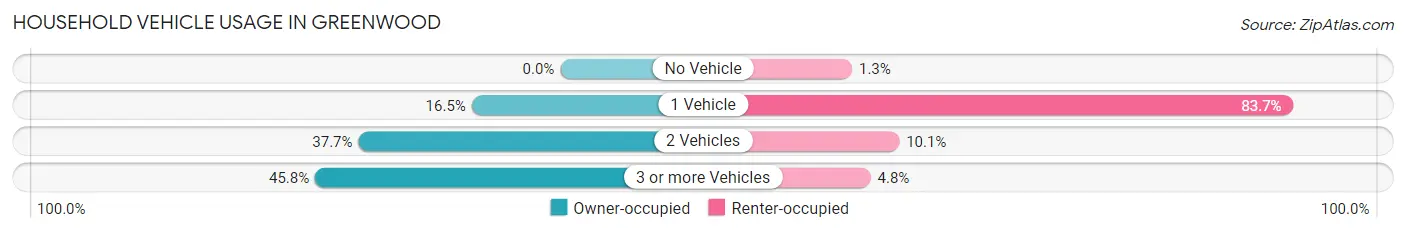
| Vehicles per Household | Owner-occupied | Renter-occupied |
| No Vehicle | 0 (0.0%) | 5 (1.3%) |
| 1 Vehicle | 43 (16.5%) | 314 (83.7%) |
| 2 Vehicles | 98 (37.7%) | 38 (10.1%) |
| 3 or more Vehicles | 119 (45.8%) | 18 (4.8%) |
| Total | 260 (100.0%) | 375 (100.0%) |
Real Estate & Mortgages in Greenwood
Real Estate and Mortgage Overview in Greenwood
| Characteristic | Without Mortgage | With Mortgage |
| Housing Units | 68 | 192 |
| Median Property Value | $206,800 | $207,700 |
| Median Household Income | $91,000 | $16 |
| Monthly Housing Costs | $488 | $0 |
| Real Estate Taxes | $763 | $3 |
Property Value by Mortgage Status in Greenwood
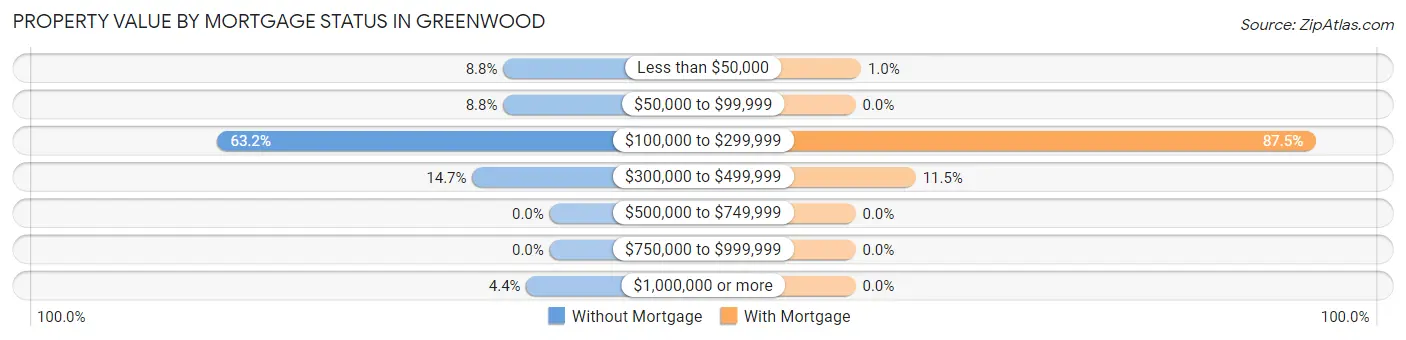
| Property Value | Without Mortgage | With Mortgage |
| Less than $50,000 | 6 (8.8%) | 2 (1.0%) |
| $50,000 to $99,999 | 6 (8.8%) | 0 (0.0%) |
| $100,000 to $299,999 | 43 (63.2%) | 168 (87.5%) |
| $300,000 to $499,999 | 10 (14.7%) | 22 (11.5%) |
| $500,000 to $749,999 | 0 (0.0%) | 0 (0.0%) |
| $750,000 to $999,999 | 0 (0.0%) | 0 (0.0%) |
| $1,000,000 or more | 3 (4.4%) | 0 (0.0%) |
| Total | 68 (100.0%) | 192 (100.0%) |
Household Income by Mortgage Status in Greenwood
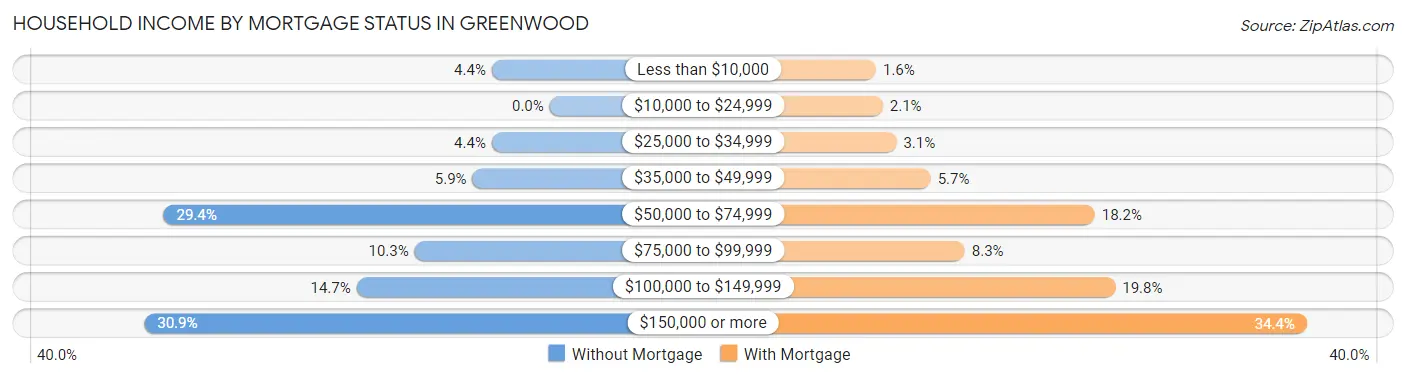
| Household Income | Without Mortgage | With Mortgage |
| Less than $10,000 | 3 (4.4%) | 3 (1.6%) |
| $10,000 to $24,999 | 0 (0.0%) | 4 (2.1%) |
| $25,000 to $34,999 | 3 (4.4%) | 6 (3.1%) |
| $35,000 to $49,999 | 4 (5.9%) | 11 (5.7%) |
| $50,000 to $74,999 | 20 (29.4%) | 35 (18.2%) |
| $75,000 to $99,999 | 7 (10.3%) | 16 (8.3%) |
| $100,000 to $149,999 | 10 (14.7%) | 38 (19.8%) |
| $150,000 or more | 21 (30.9%) | 66 (34.4%) |
| Total | 68 (100.0%) | 192 (100.0%) |
Property Value to Household Income Ratio in Greenwood
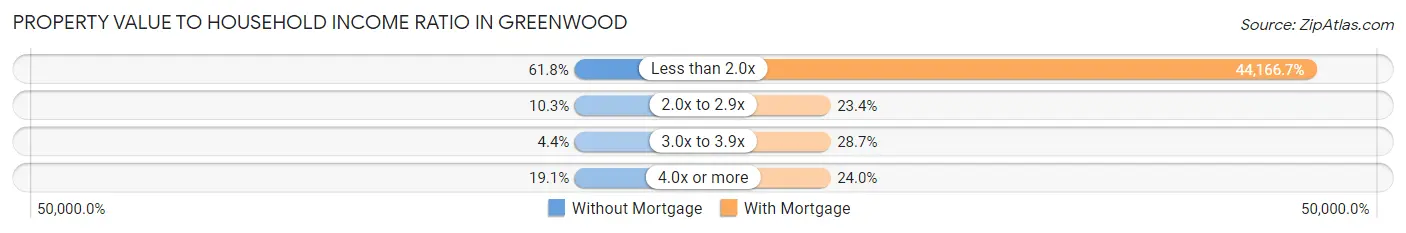
| Value-to-Income Ratio | Without Mortgage | With Mortgage |
| Less than 2.0x | 42 (61.8%) | 84,800 (44,166.7%) |
| 2.0x to 2.9x | 7 (10.3%) | 45 (23.4%) |
| 3.0x to 3.9x | 3 (4.4%) | 55 (28.6%) |
| 4.0x or more | 13 (19.1%) | 46 (24.0%) |
| Total | 68 (100.0%) | 192 (100.0%) |
Real Estate Taxes by Mortgage Status in Greenwood
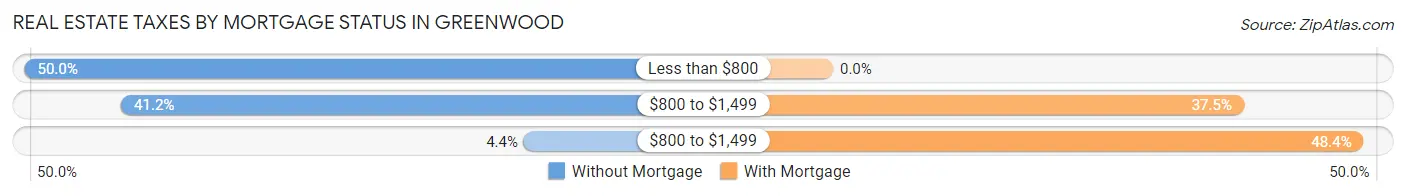
| Property Taxes | Without Mortgage | With Mortgage |
| Less than $800 | 34 (50.0%) | 0 (0.0%) |
| $800 to $1,499 | 28 (41.2%) | 72 (37.5%) |
| $800 to $1,499 | 3 (4.4%) | 93 (48.4%) |
| Total | 68 (100.0%) | 192 (100.0%) |
Health & Disability in Greenwood
Health Insurance Coverage by Age in Greenwood
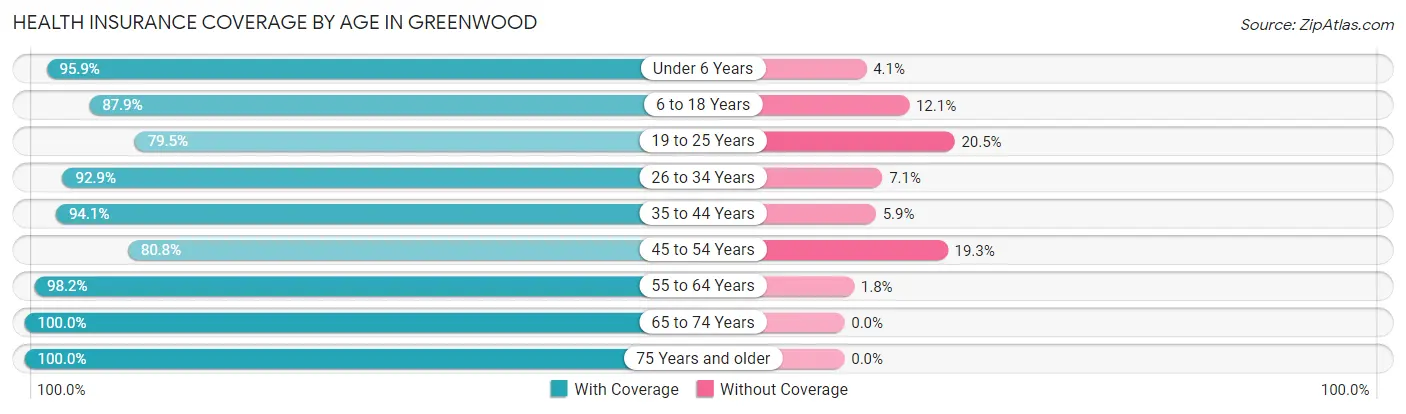
| Age Bracket | With Coverage | Without Coverage |
| Under 6 Years | 141 (95.9%) | 6 (4.1%) |
| 6 to 18 Years | 175 (87.9%) | 24 (12.1%) |
| 19 to 25 Years | 147 (79.5%) | 38 (20.5%) |
| 26 to 34 Years | 210 (92.9%) | 16 (7.1%) |
| 35 to 44 Years | 241 (94.1%) | 15 (5.9%) |
| 45 to 54 Years | 193 (80.7%) | 46 (19.3%) |
| 55 to 64 Years | 166 (98.2%) | 3 (1.8%) |
| 65 to 74 Years | 102 (100.0%) | 0 (0.0%) |
| 75 Years and older | 29 (100.0%) | 0 (0.0%) |
| Total | 1,404 (90.5%) | 148 (9.5%) |
Health Insurance Coverage by Citizenship Status in Greenwood
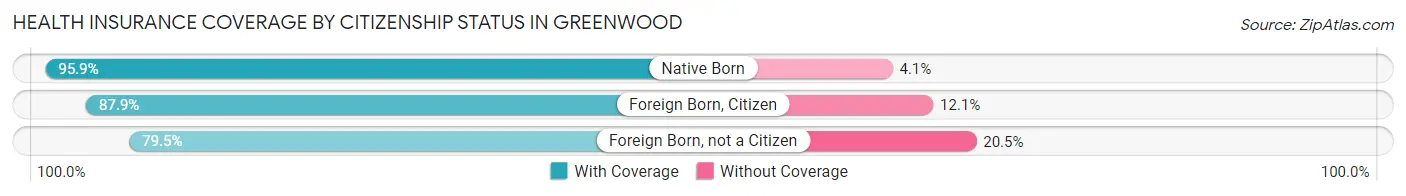
| Citizenship Status | With Coverage | Without Coverage |
| Native Born | 141 (95.9%) | 6 (4.1%) |
| Foreign Born, Citizen | 175 (87.9%) | 24 (12.1%) |
| Foreign Born, not a Citizen | 147 (79.5%) | 38 (20.5%) |
Health Insurance Coverage by Household Income in Greenwood
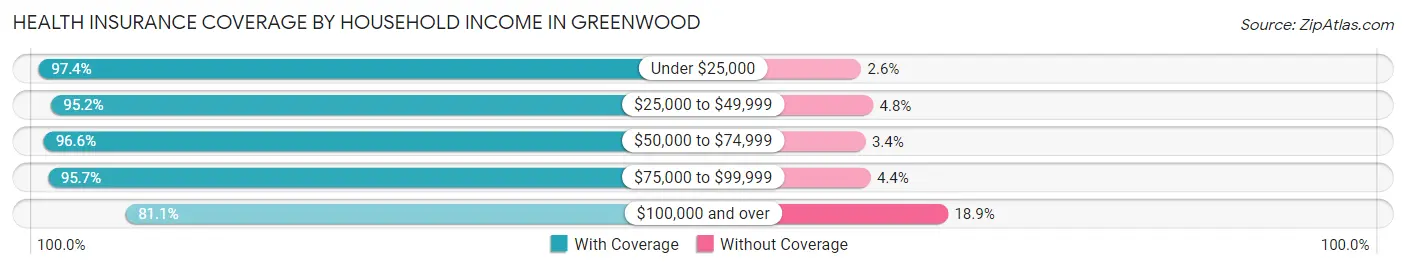
| Household Income | With Coverage | Without Coverage |
| Under $25,000 | 151 (97.4%) | 4 (2.6%) |
| $25,000 to $49,999 | 315 (95.2%) | 16 (4.8%) |
| $50,000 to $74,999 | 227 (96.6%) | 8 (3.4%) |
| $75,000 to $99,999 | 242 (95.7%) | 11 (4.3%) |
| $100,000 and over | 469 (81.1%) | 109 (18.9%) |
Public vs Private Health Insurance Coverage by Age in Greenwood
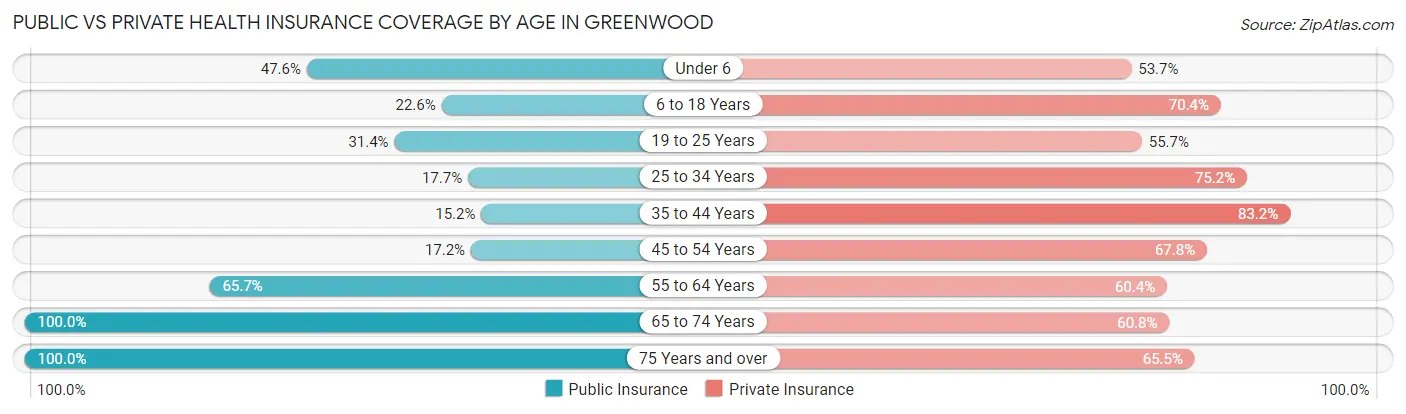
| Age Bracket | Public Insurance | Private Insurance |
| Under 6 | 70 (47.6%) | 79 (53.7%) |
| 6 to 18 Years | 45 (22.6%) | 140 (70.4%) |
| 19 to 25 Years | 58 (31.4%) | 103 (55.7%) |
| 25 to 34 Years | 40 (17.7%) | 170 (75.2%) |
| 35 to 44 Years | 39 (15.2%) | 213 (83.2%) |
| 45 to 54 Years | 41 (17.2%) | 162 (67.8%) |
| 55 to 64 Years | 111 (65.7%) | 102 (60.4%) |
| 65 to 74 Years | 102 (100.0%) | 62 (60.8%) |
| 75 Years and over | 29 (100.0%) | 19 (65.5%) |
| Total | 535 (34.5%) | 1,050 (67.6%) |
Disability Status by Sex by Age in Greenwood
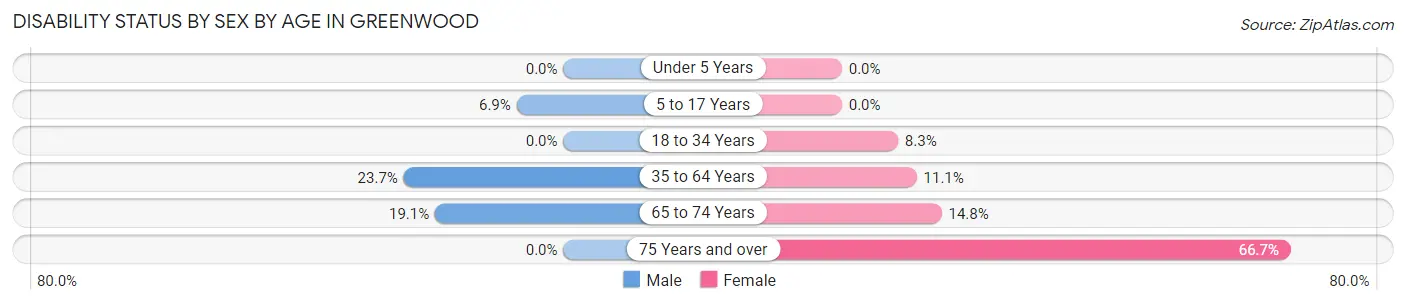
| Age Bracket | Male | Female |
| Under 5 Years | 0 (0.0%) | 0 (0.0%) |
| 5 to 17 Years | 10 (6.9%) | 0 (0.0%) |
| 18 to 34 Years | 0 (0.0%) | 15 (8.3%) |
| 35 to 64 Years | 55 (23.7%) | 48 (11.1%) |
| 65 to 74 Years | 4 (19.1%) | 12 (14.8%) |
| 75 Years and over | 0 (0.0%) | 16 (66.7%) |
Disability Class by Sex by Age in Greenwood
Disability Class: Hearing Difficulty
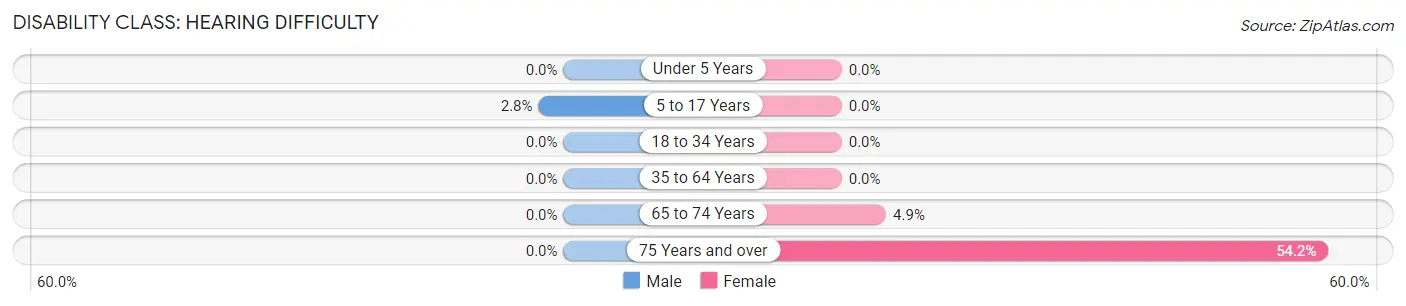
| Age Bracket | Male | Female |
| Under 5 Years | 0 (0.0%) | 0 (0.0%) |
| 5 to 17 Years | 4 (2.8%) | 0 (0.0%) |
| 18 to 34 Years | 0 (0.0%) | 0 (0.0%) |
| 35 to 64 Years | 0 (0.0%) | 0 (0.0%) |
| 65 to 74 Years | 0 (0.0%) | 4 (4.9%) |
| 75 Years and over | 0 (0.0%) | 13 (54.2%) |
Disability Class: Vision Difficulty
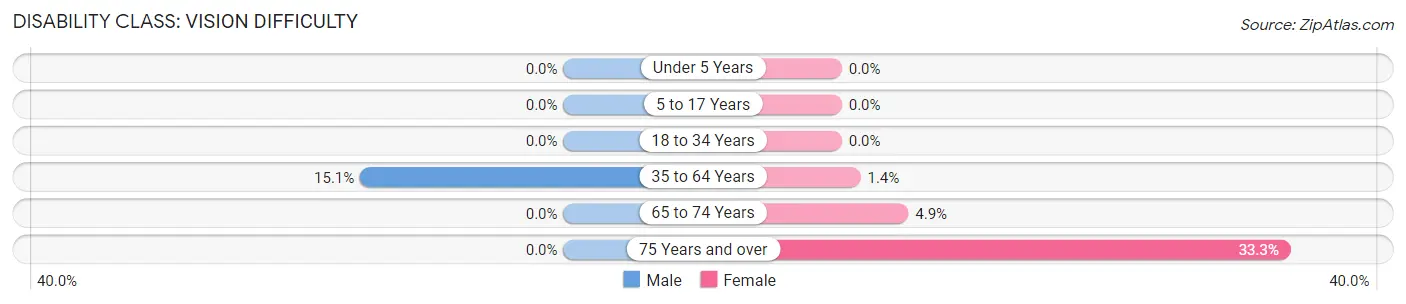
| Age Bracket | Male | Female |
| Under 5 Years | 0 (0.0%) | 0 (0.0%) |
| 5 to 17 Years | 0 (0.0%) | 0 (0.0%) |
| 18 to 34 Years | 0 (0.0%) | 0 (0.0%) |
| 35 to 64 Years | 35 (15.1%) | 6 (1.4%) |
| 65 to 74 Years | 0 (0.0%) | 4 (4.9%) |
| 75 Years and over | 0 (0.0%) | 8 (33.3%) |
Disability Class: Cognitive Difficulty
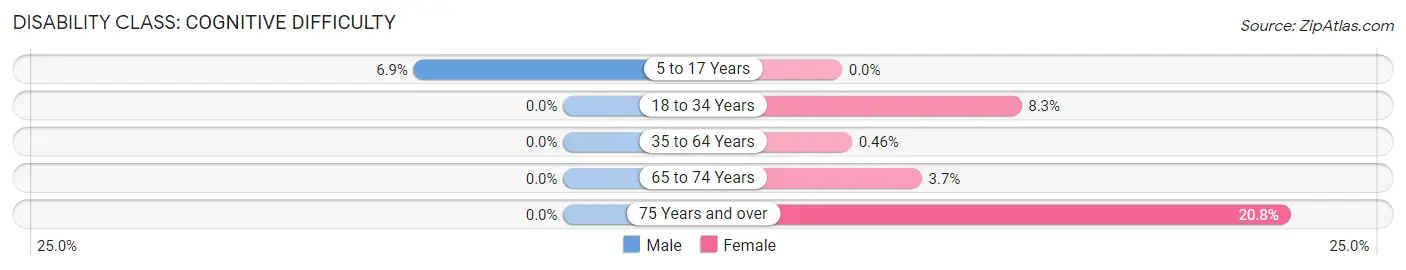
| Age Bracket | Male | Female |
| 5 to 17 Years | 10 (6.9%) | 0 (0.0%) |
| 18 to 34 Years | 0 (0.0%) | 15 (8.3%) |
| 35 to 64 Years | 0 (0.0%) | 2 (0.5%) |
| 65 to 74 Years | 0 (0.0%) | 3 (3.7%) |
| 75 Years and over | 0 (0.0%) | 5 (20.8%) |
Disability Class: Ambulatory Difficulty
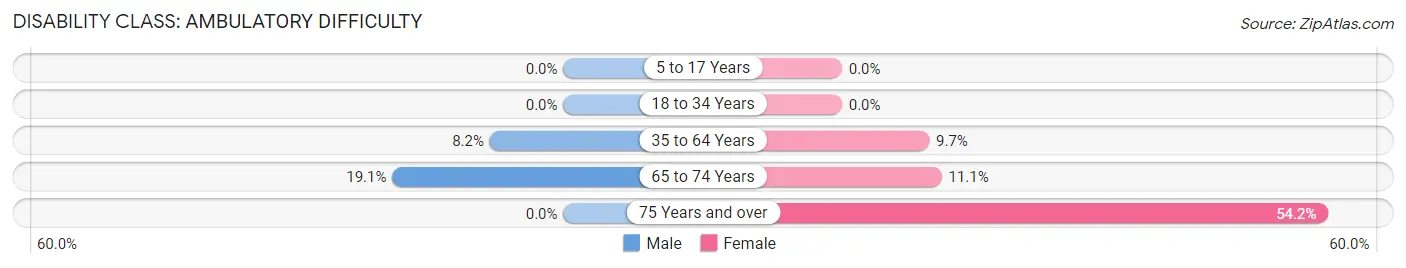
| Age Bracket | Male | Female |
| 5 to 17 Years | 0 (0.0%) | 0 (0.0%) |
| 18 to 34 Years | 0 (0.0%) | 0 (0.0%) |
| 35 to 64 Years | 19 (8.2%) | 42 (9.7%) |
| 65 to 74 Years | 4 (19.1%) | 9 (11.1%) |
| 75 Years and over | 0 (0.0%) | 13 (54.2%) |
Disability Class: Self-Care Difficulty
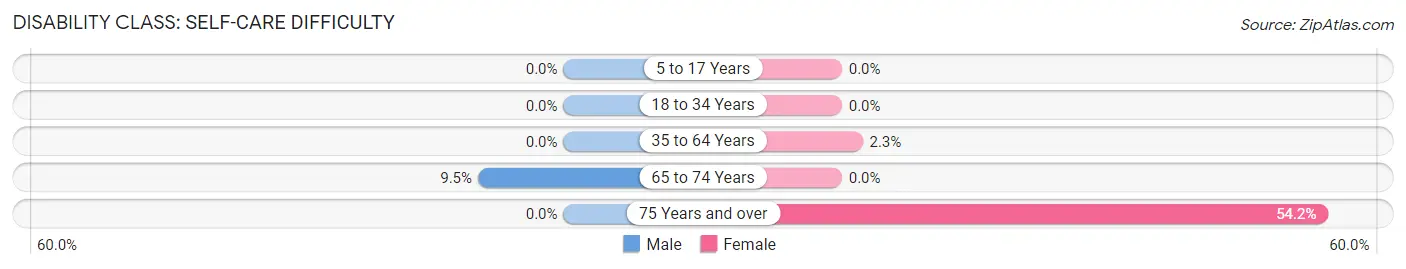
| Age Bracket | Male | Female |
| 5 to 17 Years | 0 (0.0%) | 0 (0.0%) |
| 18 to 34 Years | 0 (0.0%) | 0 (0.0%) |
| 35 to 64 Years | 0 (0.0%) | 10 (2.3%) |
| 65 to 74 Years | 2 (9.5%) | 0 (0.0%) |
| 75 Years and over | 0 (0.0%) | 13 (54.2%) |
Technology Access in Greenwood
Computing Device Access in Greenwood
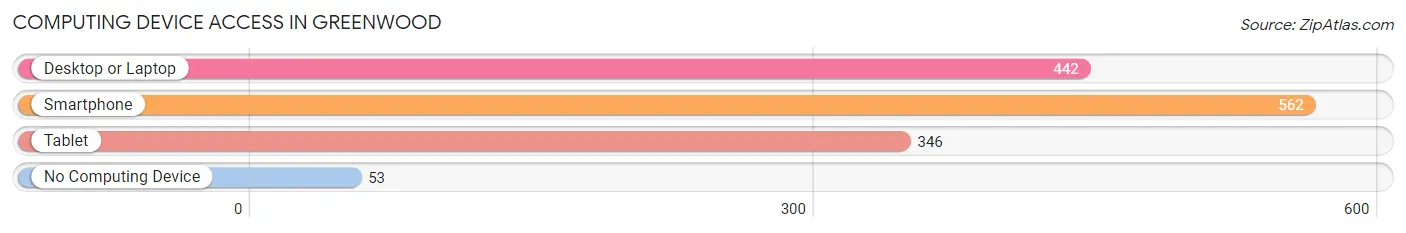
| Device Type | # Households | % Households |
| Desktop or Laptop | 442 | 69.6% |
| Smartphone | 562 | 88.5% |
| Tablet | 346 | 54.5% |
| No Computing Device | 53 | 8.4% |
| Total | 635 | 100.0% |
Internet Access in Greenwood
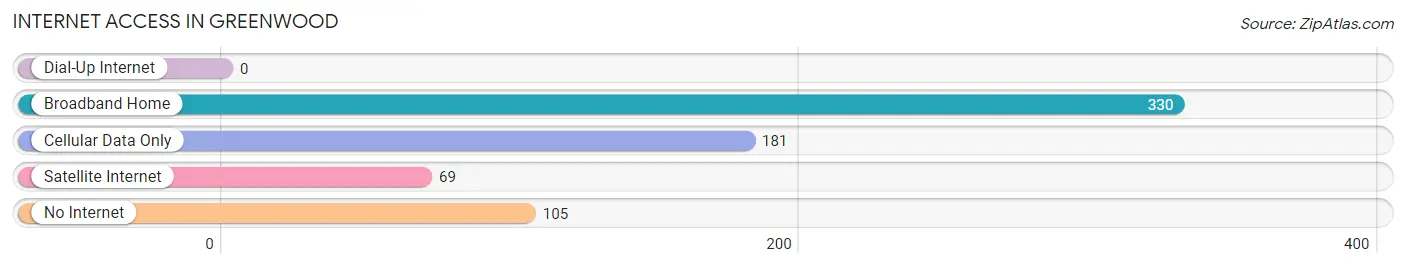
| Internet Type | # Households | % Households |
| Dial-Up Internet | 0 | 0.0% |
| Broadband Home | 330 | 52.0% |
| Cellular Data Only | 181 | 28.5% |
| Satellite Internet | 69 | 10.9% |
| No Internet | 105 | 16.5% |
| Total | 635 | 100.0% |
Greenwood Summary
Greenwood is a small town located in Sussex County, Delaware. It is situated in the southern part of the state, about 20 miles from the Delaware Bay. The town has a population of approximately 2,000 people and is part of the Seaford Micropolitan Statistical Area.
History
Greenwood was founded in 1790 by a group of Quakers from Pennsylvania. The town was named after the Greenwood family, who were among the first settlers. The town was originally a farming community, but it soon developed into a small industrial center. In the late 19th century, the town was home to several mills, including a sawmill, a gristmill, and a paper mill.
In the early 20th century, Greenwood experienced a period of growth and prosperity. The town was home to several businesses, including a cannery, a furniture factory, and a brickyard. The town also had a railroad station, which connected it to other towns in the area.
Geography
Greenwood is located in the southern part of Sussex County, Delaware. It is situated on the Nanticoke River, which flows through the town. The town is surrounded by farmland and is located about 20 miles from the Delaware Bay.
The town has a total area of 1.2 square miles, all of which is land. The town has a humid subtropical climate, with hot, humid summers and mild winters.
Economy
Greenwood is a small town with a limited economy. The town is home to several small businesses, including a grocery store, a hardware store, and a few restaurants. The town also has a few manufacturing companies, including a furniture factory and a paper mill.
The town is also home to a few farms, which produce a variety of crops, including corn, soybeans, and wheat. The town also has a few wineries, which produce a variety of wines.
Demographics
As of the 2010 census, Greenwood had a population of 2,000 people. The town has a median household income of $41,000 and a median family income of $50,000. The town has a poverty rate of 11.7%, which is higher than the national average.
The town is predominantly white, with a small African American population. The town also has a small Hispanic population. The town has a high school graduation rate of 87%, which is higher than the national average.
Conclusion
Greenwood is a small town located in Sussex County, Delaware. The town has a population of approximately 2,000 people and is part of the Seaford Micropolitan Statistical Area. The town was founded in 1790 by a group of Quakers from Pennsylvania and was originally a farming community. In the early 20th century, the town experienced a period of growth and prosperity. Today, Greenwood is a small town with a limited economy. The town is predominantly white, with a small African American and Hispanic population. The town has a median household income of $41,000 and a high school graduation rate of 87%.
Common Questions
What is Per Capita Income in Greenwood?
Per Capita income in Greenwood is $40,531.
What is the Median Family Income in Greenwood?
Median Family Income in Greenwood is $72,000.
What is the Median Household income in Greenwood?
Median Household Income in Greenwood is $68,418.
What is Income or Wage Gap in Greenwood?
Income or Wage Gap in Greenwood is 8.2%.
Women in Greenwood earn 91.8 cents for every dollar earned by a man.
What is Inequality or Gini Index in Greenwood?
Inequality or Gini Index in Greenwood is 0.48.
What is the Total Population of Greenwood?
Total Population of Greenwood is 1,556.
What is the Total Male Population of Greenwood?
Total Male Population of Greenwood is 720.
What is the Total Female Population of Greenwood?
Total Female Population of Greenwood is 836.
What is the Ratio of Males per 100 Females in Greenwood?
There are 86.12 Males per 100 Females in Greenwood.
What is the Ratio of Females per 100 Males in Greenwood?
There are 116.11 Females per 100 Males in Greenwood.
What is the Median Population Age in Greenwood?
Median Population Age in Greenwood is 36.1 Years.
What is the Average Family Size in Greenwood
Average Family Size in Greenwood is 3.6 People.
What is the Average Household Size in Greenwood
Average Household Size in Greenwood is 2.5 People.
How Large is the Labor Force in Greenwood?
There are 915 People in the Labor Forcein in Greenwood.
What is the Percentage of People in the Labor Force in Greenwood?
73.2% of People are in the Labor Force in Greenwood.
What is the Unemployment Rate in Greenwood?
Unemployment Rate in Greenwood is 3.7%.