Cities with the Highest Percentage of Immigrants from Asia in Delaware

RELATED REPORTS & OPTIONS

Asia
Population
Families and Households
Female Fertility
Female Fertility (Unmarried)
Race (Community Size)
Race (Percentage)
Ancestry (Community Size)
AfghanAfricanAlaska NativeAlaskan AthabascanAlbanianAleutAlsatianAmericanApacheArabArapahoArgentineanArmenianAssyrian / Chaldean / SyriacAustralianAustrianBahamianBangladeshiBarbadianBasqueBelgianBelizeanBermudanBhutaneseBlackfeetBolivianBrazilianBritishBritish West IndianBulgarianBurmeseCajunCambodianCanadianCape VerdeanCarpatho RusynCelticCentral AmericanCentral American IndianCherokeeCheyenneChickasawChileanChineseChippewaChoctawColombianColvilleComancheCosta RicanCreeCreekCroatianCrowCubanCypriotCzechCzechoslovakianDanishDelawareDominicanDutchDutch West IndianEastern EuropeanEcuadorianEgyptianEnglishEstonianEthiopianEuropeanFijianFilipinoFinnishFrenchFrench American IndianFrench CanadianGermanGerman RussianGhanaianGreekGuamanian / ChamorroGuatemalanGuyaneseHaitianHmongHonduranHopiHoumaHungarianIcelanderIndian (Asian)IndonesianInupiatIranianIraqiIrishIroquoisIsraeliItalianJamaicanJapaneseJordanianKenyanKiowaKoreanLaotianLatvianLebaneseLiberianLithuanianLumbeeLuxembourgerMacedonianMalaysianMalteseMarshalleseMenomineeMexicanMexican American IndianMongolianMoroccanNative HawaiianNavajoNepaleseNew ZealanderNicaraguanNigerianNorthern EuropeanNorwegianOkinawanOsageOttawaPaiutePakistaniPalestinianPanamanianParaguayanPennsylvania GermanPeruvianPimaPolishPortuguesePotawatomiPuebloPuerto RicanPuget Sound SalishRomanianRussianSalvadoranSamoanScandinavianScotch-IrishScottishSeminoleSenegaleseSerbianShoshoneSierra LeoneanSiouxSlavicSlovakSloveneSomaliSouth AfricanSouth AmericanSouth American IndianSoviet UnionSpaniardSpanishSpanish AmericanSpanish American IndianSri LankanSubsaharan AfricanSudaneseSwedishSwissSyrianTaiwaneseThaiTlingit-HaidaTohono O'OdhamTonganTrinidadian and TobagonianTsimshianTurkishU.S. Virgin IslanderUgandanUkrainianUruguayanUteVenezuelanVietnameseWelshWest IndianYakamaYaquiYugoslavianYumanYup'ikZimbabwean
Ancestry (Percentage)
AfghanAfricanAlaska NativeAlaskan AthabascanAlbanianAleutAlsatianAmericanApacheArabArapahoArgentineanArmenianAssyrian / Chaldean / SyriacAustralianAustrianBahamianBangladeshiBarbadianBasqueBelgianBelizeanBermudanBhutaneseBlackfeetBolivianBrazilianBritishBritish West IndianBulgarianBurmeseCajunCambodianCanadianCape VerdeanCarpatho RusynCelticCentral AmericanCentral American IndianCherokeeCheyenneChickasawChileanChineseChippewaChoctawColombianColvilleComancheCosta RicanCreeCreekCroatianCrowCubanCypriotCzechCzechoslovakianDanishDelawareDominicanDutchDutch West IndianEastern EuropeanEcuadorianEgyptianEnglishEstonianEthiopianEuropeanFijianFilipinoFinnishFrenchFrench American IndianFrench CanadianGermanGerman RussianGhanaianGreekGuamanian / ChamorroGuatemalanGuyaneseHaitianHmongHonduranHopiHoumaHungarianIcelanderIndian (Asian)IndonesianInupiatIranianIraqiIrishIroquoisIsraeliItalianJamaicanJapaneseJordanianKenyanKiowaKoreanLaotianLatvianLebaneseLiberianLithuanianLumbeeLuxembourgerMacedonianMalaysianMalteseMarshalleseMenomineeMexicanMexican American IndianMongolianMoroccanNative HawaiianNavajoNepaleseNew ZealanderNicaraguanNigerianNorthern EuropeanNorwegianOkinawanOsageOttawaPaiutePakistaniPalestinianPanamanianParaguayanPennsylvania GermanPeruvianPimaPolishPortuguesePotawatomiPuebloPuerto RicanPuget Sound SalishRomanianRussianSalvadoranSamoanScandinavianScotch-IrishScottishSeminoleSenegaleseSerbianShoshoneSierra LeoneanSiouxSlavicSlovakSloveneSomaliSouth AfricanSouth AmericanSouth American IndianSoviet UnionSpaniardSpanishSpanish AmericanSpanish American IndianSri LankanSubsaharan AfricanSudaneseSwedishSwissSyrianTaiwaneseThaiTlingit-HaidaTohono O'OdhamTonganTrinidadian and TobagonianTsimshianTurkishU.S. Virgin IslanderUgandanUkrainianUruguayanUteVenezuelanVietnameseWelshWest IndianYakamaYaquiYugoslavianYumanYup'ikZimbabwean
Immigrant Origin (Total)
AfghanistanAfricaAlbaniaArgentinaArmeniaAsiaAustraliaAustriaAzoresBahamasBangladeshBarbadosBelarusBelgiumBelizeBoliviaBosnia and HerzegovinaBrazilBulgariaBurma / MyanmarCabo VerdeCambodiaCameroonCanadaCaribbeanCentral AmericaChileChinaColombiaCongoCosta RicaCroatiaCubaCzechoslovakiaDenmarkDominicaDominican RepublicEastern AfricaEastern AsiaEastern EuropeEcuadorEgyptEl SalvadorEnglandEritreaEthiopiaEuropeFijiFranceGermanyGhanaGreeceGrenadaGuatemalaGuyanaHaitiHondurasHong KongHungaryIndiaIndonesiaIranIraqIrelandIsraelItalyJamaicaJapanJordanKazakhstanKenyaKoreaKuwaitLaosLatin AmericaLatviaLebanonLiberiaLithuaniaMalaysiaMexicoMicronesiaMiddle AfricaMoldovaMoroccoNepalNetherlandsNicaraguaNigeriaNorth MacedoniaNorthern AfricaNorthern EuropeNorwayOceaniaPakistanPanamaPeruPhilippinesPolandPortugalRomaniaRussiaSaudi ArabiaScotlandSenegalSerbiaSierra LeoneSingaporeSomaliaSouth AfricaSouth AmericaSouth Central AsiaSouth Eastern AsiaSouthern EuropeSpainSri LankaSt. Vincent and the GrenadinesSudanSwedenSwitzerlandSyriaTaiwanThailandTrinidad and TobagoTurkeyUgandaUkraineUruguayUzbekistanVenezuelaVietnamWest IndiesWestern AfricaWestern AsiaWestern EuropeYemenZaireZimbabwe
Immigrant Origin (Percentage)
AfghanistanAfricaAlbaniaArgentinaArmeniaAsiaAustraliaAustriaAzoresBahamasBangladeshBarbadosBelarusBelgiumBelizeBoliviaBosnia and HerzegovinaBrazilBulgariaBurma / MyanmarCabo VerdeCambodiaCameroonCanadaCaribbeanCentral AmericaChileChinaColombiaCongoCosta RicaCroatiaCubaCzechoslovakiaDenmarkDominicaDominican RepublicEastern AfricaEastern AsiaEastern EuropeEcuadorEgyptEl SalvadorEnglandEritreaEthiopiaEuropeFijiFranceGermanyGhanaGreeceGrenadaGuatemalaGuyanaHaitiHondurasHong KongHungaryIndiaIndonesiaIranIraqIrelandIsraelItalyJamaicaJapanJordanKazakhstanKenyaKoreaKuwaitLaosLatin AmericaLatviaLebanonLiberiaLithuaniaMalaysiaMexicoMicronesiaMiddle AfricaMoldovaMoroccoNepalNetherlandsNicaraguaNigeriaNorth MacedoniaNorthern AfricaNorthern EuropeNorwayOceaniaPakistanPanamaPeruPhilippinesPolandPortugalRomaniaRussiaSaudi ArabiaScotlandSenegalSerbiaSierra LeoneSingaporeSomaliaSouth AfricaSouth AmericaSouth Central AsiaSouth Eastern AsiaSouthern EuropeSpainSri LankaSt. Vincent and the GrenadinesSudanSwedenSwitzerlandSyriaTaiwanThailandTrinidad and TobagoTurkeyUgandaUkraineUruguayUzbekistanVenezuelaVietnamWest IndiesWestern AfricaWestern AsiaWestern EuropeYemenZaireZimbabwe
Income
Income (Families)
Income (Households)
Poverty
Poverty (Families)
Unemployment
Employment Occupations
Employment Industries
Employer Class
Commute Time
Commute Means
School Enrollment
Education by Degree Field
Occupancy
Finances
Physical Characteristics
Delaware
Compare Cities
Comparison Subject

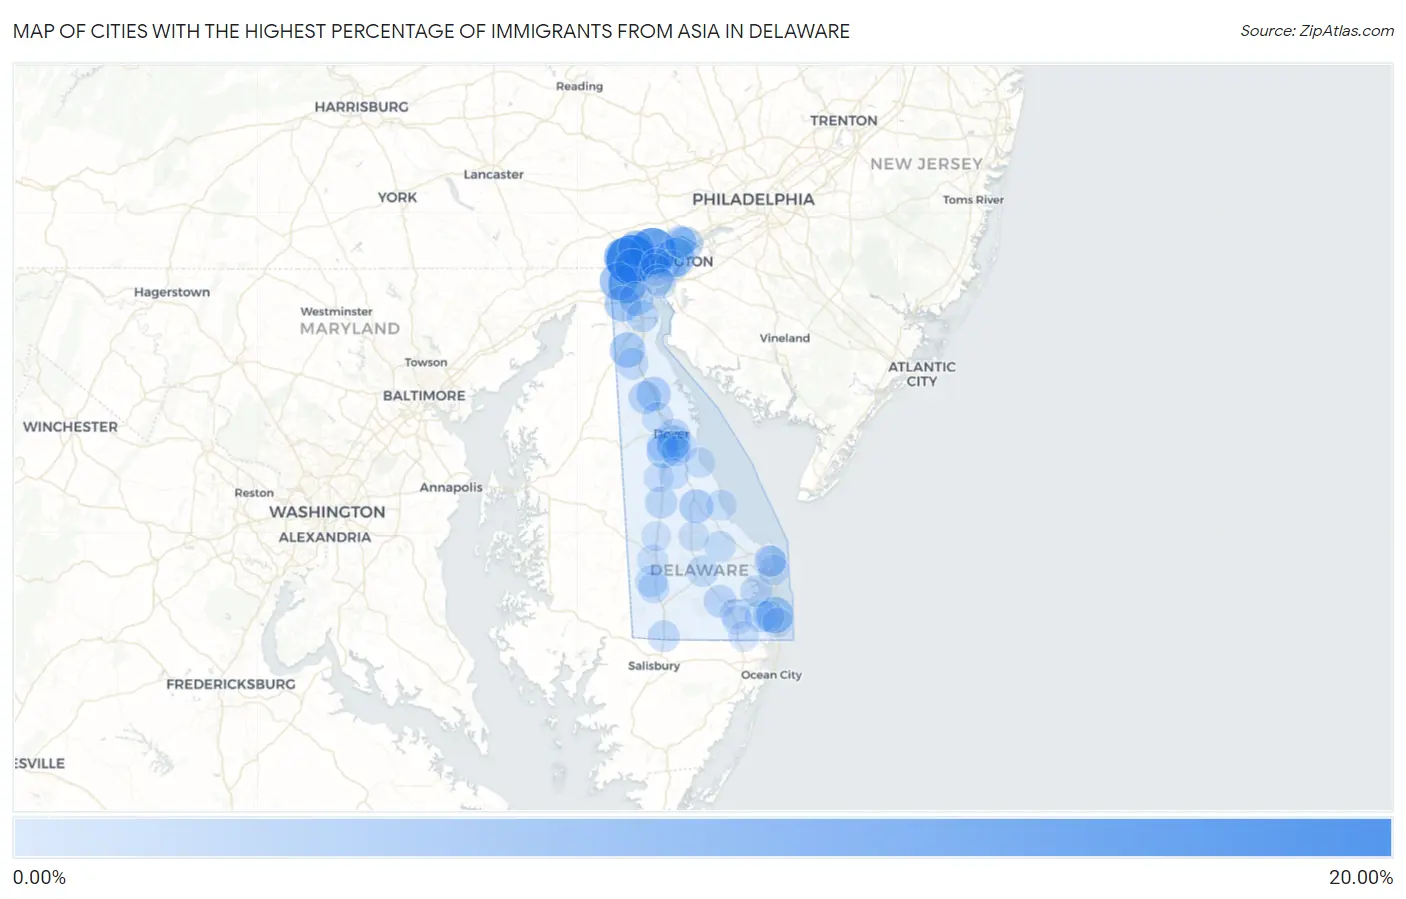
Map of Cities with the Highest Percentage of Immigrants from Asia in Delaware

0.00%
20.00%
Cities with the Highest Percentage of Immigrants from Asia in Delaware Map

Cities with the Highest Percentage of Immigrants from Asia in Delaware

City Asia vs State vs National
1.Pike Creek18.47%3.17%(+15.3)#14.26%(+14.2)#339
2.Greenville15.65%3.17%(+12.5)#24.26%(+11.4)#447
3.North Star8.67%3.17%(+5.51)#34.26%(+4.41)#1,128
4.Edgemoor8.28%3.17%(+5.11)#44.26%(+4.02)#1,212
5.Brookside8.10%3.17%(+4.94)#54.26%(+3.84)#1,242
6.Newark7.26%3.17%(+4.10)#64.26%(+3.00)#1,432
7.Bethany Beach5.92%3.17%(+2.75)#74.26%(+1.66)#1,820
8.Hockessin5.75%3.17%(+2.58)#84.26%(+1.49)#1,892
9.Glasgow5.12%3.17%(+1.95)#94.26%(+0.855)#2,139
10.Middletown4.70%3.17%(+1.53)#104.26%(+0.440)#2,364
11.Pike Creek Valley4.45%3.17%(+1.29)#114.26%(+0.193)#2,507
12.Camden3.78%3.17%(+0.615)#124.26%(-0.479)#2,994
13.Kent Acres3.77%3.17%(+0.600)#134.26%(-0.494)#3,005
14.Smyrna3.69%3.17%(+0.525)#144.26%(-0.570)#3,066
15.Milford3.66%3.17%(+0.496)#154.26%(-0.598)#3,083
16.Bear3.55%3.17%(+0.384)#164.26%(-0.710)#3,191
17.Claymont3.46%3.17%(+0.298)#174.26%(-0.797)#3,254
18.Clayton2.39%3.17%(-0.778)#184.26%(-1.87)#4,624
19.Millsboro2.20%3.17%(-0.970)#194.26%(-2.06)#4,970
20.Millville2.19%3.17%(-0.973)#204.26%(-2.07)#4,977
21.Dover2.06%3.17%(-1.11)#214.26%(-2.20)#5,243
22.Harrington2.02%3.17%(-1.15)#224.26%(-2.24)#5,314
23.Newport1.92%3.17%(-1.24)#234.26%(-2.34)#5,533
24.St Georges1.76%3.17%(-1.40)#244.26%(-2.50)#5,884
25.Rehoboth Beach1.69%3.17%(-1.47)#254.26%(-2.57)#6,072
26.Arden1.53%3.17%(-1.63)#264.26%(-2.73)#6,497
27.Highland Acres1.52%3.17%(-1.65)#274.26%(-2.74)#6,547
28.Long Neck1.48%3.17%(-1.69)#284.26%(-2.79)#6,677
29.Delmar1.46%3.17%(-1.71)#294.26%(-2.80)#6,722
30.Seaford1.44%3.17%(-1.73)#304.26%(-2.82)#6,770
31.Townsend1.43%3.17%(-1.74)#314.26%(-2.83)#6,807
32.Wyoming1.38%3.17%(-1.79)#324.26%(-2.88)#6,960
33.Wilmington1.36%3.17%(-1.81)#334.26%(-2.90)#7,019
34.Dover Base Housing1.26%3.17%(-1.91)#344.26%(-3.00)#7,388
35.Ocean View1.20%3.17%(-1.96)#354.26%(-3.06)#7,578
36.Blades1.15%3.17%(-2.02)#364.26%(-3.11)#7,803
37.Georgetown1.15%3.17%(-2.02)#374.26%(-3.12)#7,805
38.Cheswold1.04%3.17%(-2.13)#384.26%(-3.22)#8,232
39.Ardentown0.90%3.17%(-2.27)#394.26%(-3.36)#8,864
40.Riverview0.84%3.17%(-2.33)#404.26%(-3.42)#9,133
41.Milton0.84%3.17%(-2.33)#414.26%(-3.42)#9,140
42.Elsmere0.63%3.17%(-2.54)#424.26%(-3.63)#10,235
43.Dagsboro0.60%3.17%(-2.57)#434.26%(-3.66)#10,414
44.Bowers0.60%3.17%(-2.57)#444.26%(-3.67)#10,440
45.Wilmington Manor0.59%3.17%(-2.57)#454.26%(-3.67)#10,453
46.Dewey Beach0.56%3.17%(-2.61)#464.26%(-3.70)#10,672
47.Henlopen Acres0.52%3.17%(-2.65)#474.26%(-3.74)#10,918
48.Slaughter Beach0.51%3.17%(-2.66)#484.26%(-3.75)#10,994
49.Bridgeville0.46%3.17%(-2.70)#494.26%(-3.80)#11,298
50.Rising Sun Lebanon0.39%3.17%(-2.77)#504.26%(-3.87)#11,761
51.Selbyville0.38%3.17%(-2.79)#514.26%(-3.88)#11,880
52.Ellendale0.33%3.17%(-2.84)#524.26%(-3.93)#12,206
53.Felton0.26%3.17%(-2.90)#534.26%(-4.00)#12,691
54.New Castle0.24%3.17%(-2.93)#544.26%(-4.02)#12,895
55.South Bethany0.20%3.17%(-2.96)#554.26%(-4.06)#13,130
56.Greenwood0.13%3.17%(-3.04)#564.26%(-4.13)#13,619
57.Frankford0.12%3.17%(-3.05)#574.26%(-4.14)#13,686

Common Questions

What are the Top 10 Cities with the Highest Percentage of Immigrants from Asia in Delaware?
Top 10 Cities with the Highest Percentage of Immigrants from Asia in Delaware are:
#1
18.47%
#2
15.65%
#3
8.67%
#4
8.28%
#5
8.10%
#6
7.26%
#7
5.92%
#8
5.75%
#9
5.12%
#10
4.70%
What city has the Highest Percentage of Immigrants from Asia in Delaware?
Pike Creek has the Highest Percentage of Immigrants from Asia in Delaware with 18.47%.
What is the Percentage of Immigrants from Asia in the State of Delaware?
Percentage of Immigrants from Asia in Delaware is 3.17%.
What is the Percentage of Immigrants from Asia in the United States?
Percentage of Immigrants from Asia in the United States is 4.26%.