Long Neck, DE Map & Demographics
Long Neck Map
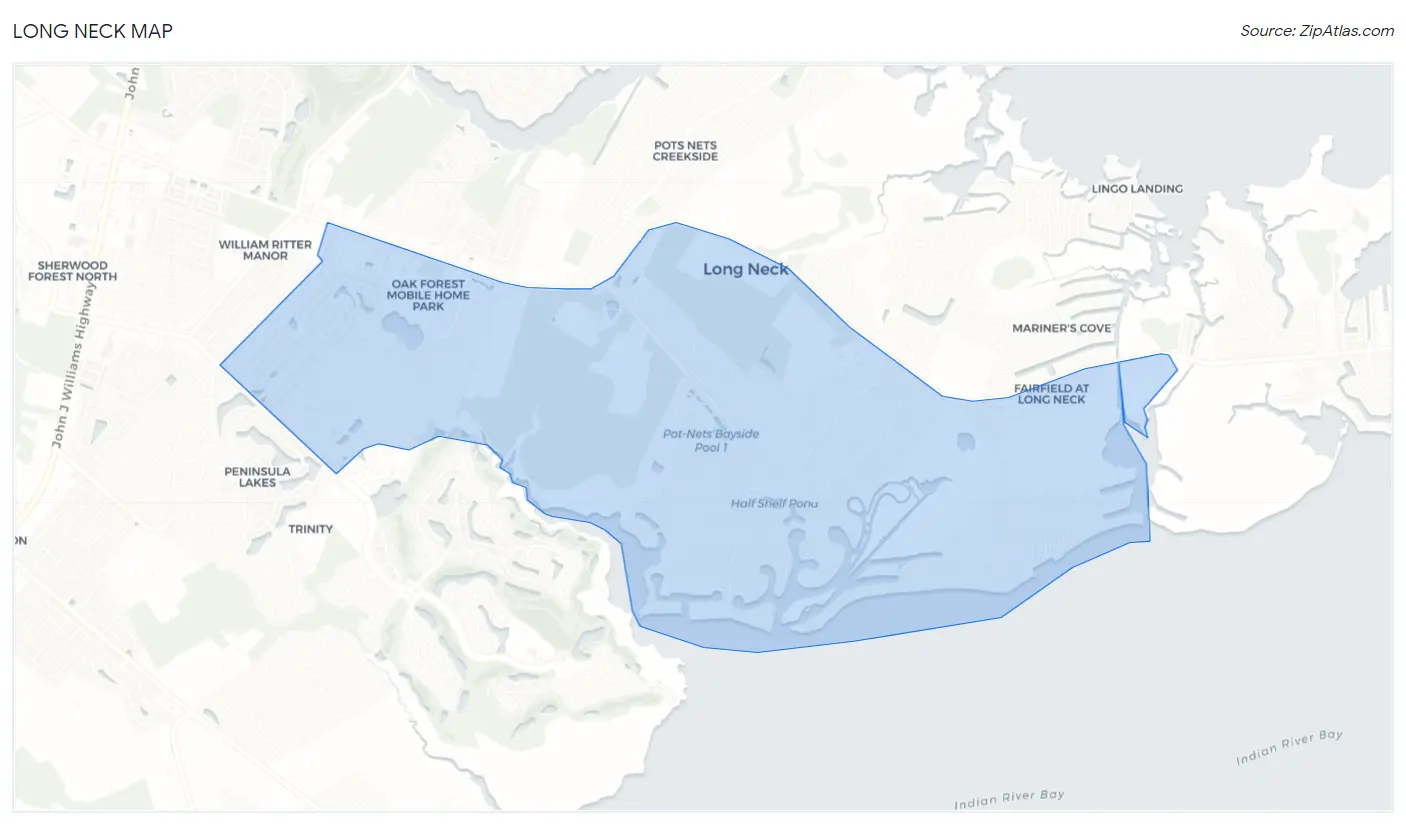
Long Neck Overview
$39,311
PER CAPITA INCOME
$80,000
AVG FAMILY INCOME
$59,563
AVG HOUSEHOLD INCOME
29.5%
WAGE / INCOME GAP [ % ]
70.5¢/ $1
WAGE / INCOME GAP [ $ ]
0.38
INEQUALITY / GINI INDEX
2,983
TOTAL POPULATION
1,228
MALE POPULATION
1,755
FEMALE POPULATION
69.97
MALES / 100 FEMALES
142.92
FEMALES / 100 MALES
61.5
MEDIAN AGE
2.4
AVG FAMILY SIZE
1.9
AVG HOUSEHOLD SIZE
1,433
LABOR FORCE [ PEOPLE ]
51.8%
PERCENT IN LABOR FORCE
7.5%
UNEMPLOYMENT RATE
Long Neck Area Codes
Income in Long Neck
Income Overview in Long Neck
Per Capita Income in Long Neck is $39,311, while median incomes of families and households are $80,000 and $59,563 respectively.
| Characteristic | Number | Measure |
| Per Capita Income | 2,983 | $39,311 |
| Median Family Income | 922 | $80,000 |
| Mean Family Income | 922 | $88,157 |
| Median Household Income | 1,579 | $59,563 |
| Mean Household Income | 1,579 | $73,674 |
| Income Deficit | 922 | $0 |
| Wage / Income Gap (%) | 2,983 | 29.47% |
| Wage / Income Gap ($) | 2,983 | 70.53¢ per $1 |
| Gini / Inequality Index | 2,983 | 0.38 |
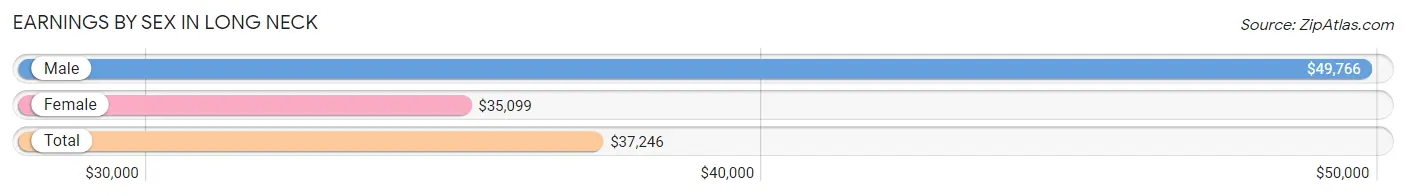
Earnings by Sex in Long Neck
Average Earnings in Long Neck are $37,246, $49,766 for men and $35,099 for women, a difference of 29.5%.
| Sex | Number | Average Earnings |
| Male | 687 (45.7%) | $49,766 |
| Female | 815 (54.3%) | $35,099 |
| Total | 1,502 (100.0%) | $37,246 |
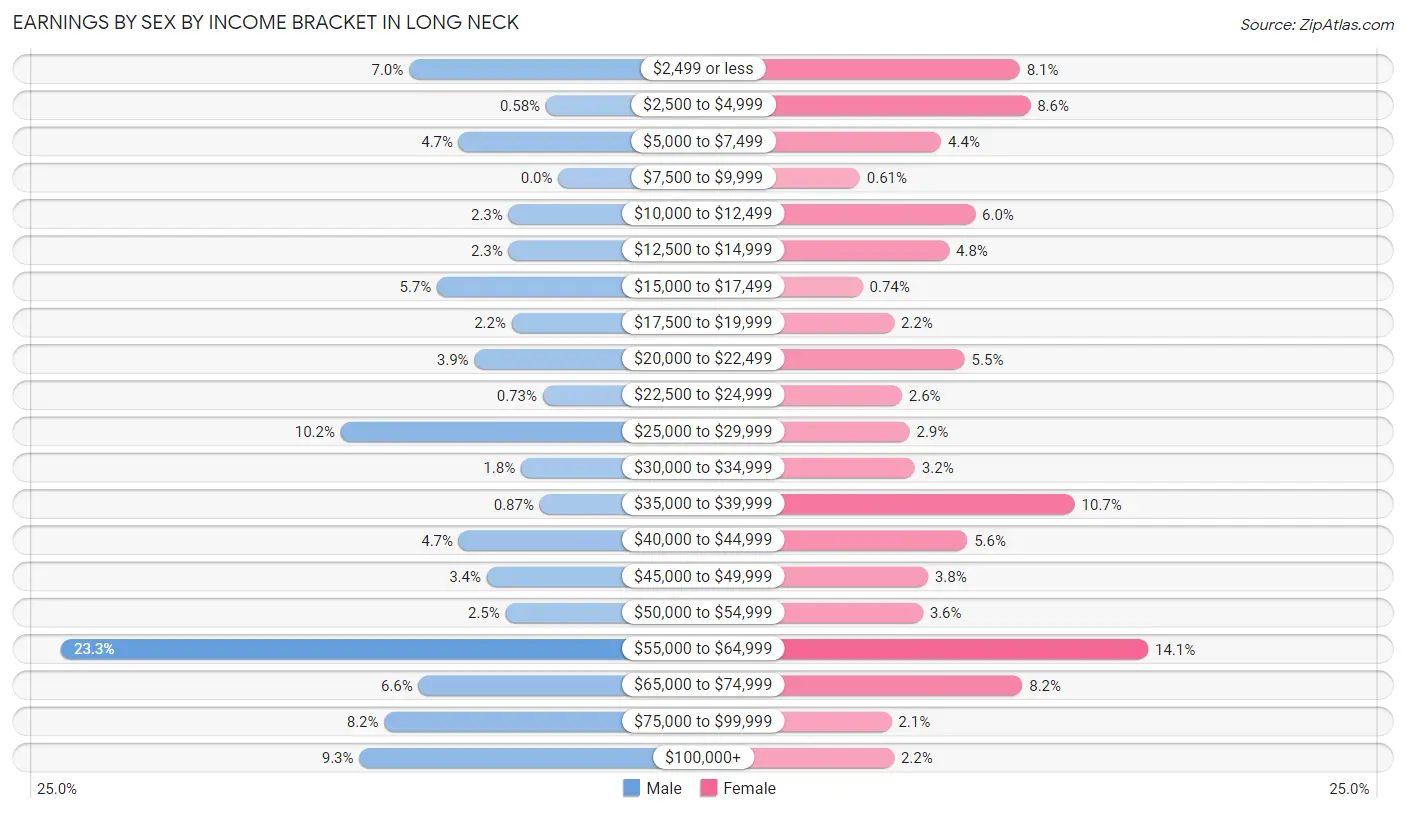
Earnings by Sex by Income Bracket in Long Neck
The most common earnings brackets in Long Neck are $55,000 to $64,999 for men (160 | 23.3%) and $55,000 to $64,999 for women (115 | 14.1%).
| Income | Male | Female |
| $2,499 or less | 48 (7.0%) | 66 (8.1%) |
| $2,500 to $4,999 | 4 (0.6%) | 70 (8.6%) |
| $5,000 to $7,499 | 32 (4.7%) | 36 (4.4%) |
| $7,500 to $9,999 | 0 (0.0%) | 5 (0.6%) |
| $10,000 to $12,499 | 16 (2.3%) | 49 (6.0%) |
| $12,500 to $14,999 | 16 (2.3%) | 39 (4.8%) |
| $15,000 to $17,499 | 39 (5.7%) | 6 (0.7%) |
| $17,500 to $19,999 | 15 (2.2%) | 18 (2.2%) |
| $20,000 to $22,499 | 27 (3.9%) | 45 (5.5%) |
| $22,500 to $24,999 | 5 (0.7%) | 21 (2.6%) |
| $25,000 to $29,999 | 70 (10.2%) | 24 (2.9%) |
| $30,000 to $34,999 | 12 (1.8%) | 26 (3.2%) |
| $35,000 to $39,999 | 6 (0.9%) | 87 (10.7%) |
| $40,000 to $44,999 | 32 (4.7%) | 46 (5.6%) |
| $45,000 to $49,999 | 23 (3.4%) | 31 (3.8%) |
| $50,000 to $54,999 | 17 (2.5%) | 29 (3.6%) |
| $55,000 to $64,999 | 160 (23.3%) | 115 (14.1%) |
| $65,000 to $74,999 | 45 (6.6%) | 67 (8.2%) |
| $75,000 to $99,999 | 56 (8.2%) | 17 (2.1%) |
| $100,000+ | 64 (9.3%) | 18 (2.2%) |
| Total | 687 (100.0%) | 815 (100.0%) |
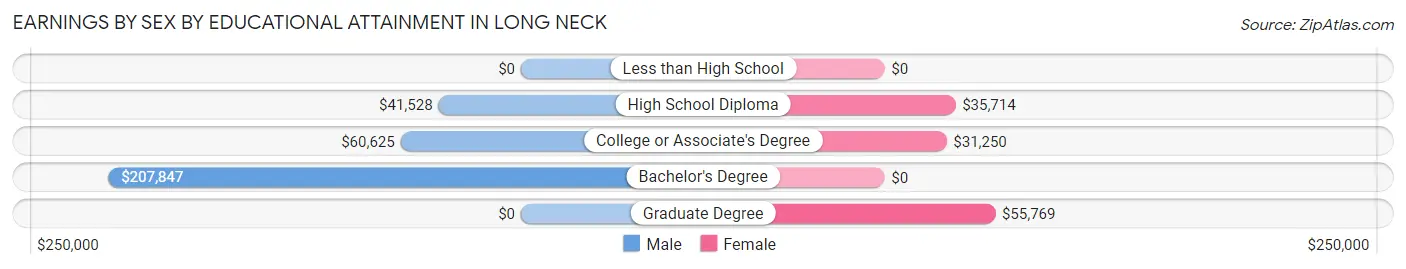
Earnings by Sex by Educational Attainment in Long Neck
Average earnings in Long Neck are $53,088 for men and $35,972 for women, a difference of 32.2%. Men with an educational attainment of bachelor's degree enjoy the highest average annual earnings of $207,847, while those with high school diploma education earn the least with $41,528. Women with an educational attainment of graduate degree earn the most with the average annual earnings of $55,769, while those with college or associate's degree education have the smallest earnings of $31,250.
| Educational Attainment | Male Income | Female Income |
| Less than High School | - | - |
| High School Diploma | $41,528 | $35,714 |
| College or Associate's Degree | $60,625 | $31,250 |
| Bachelor's Degree | $207,847 | $0 |
| Graduate Degree | - | - |
| Total | $53,088 | $35,972 |
Family Income in Long Neck
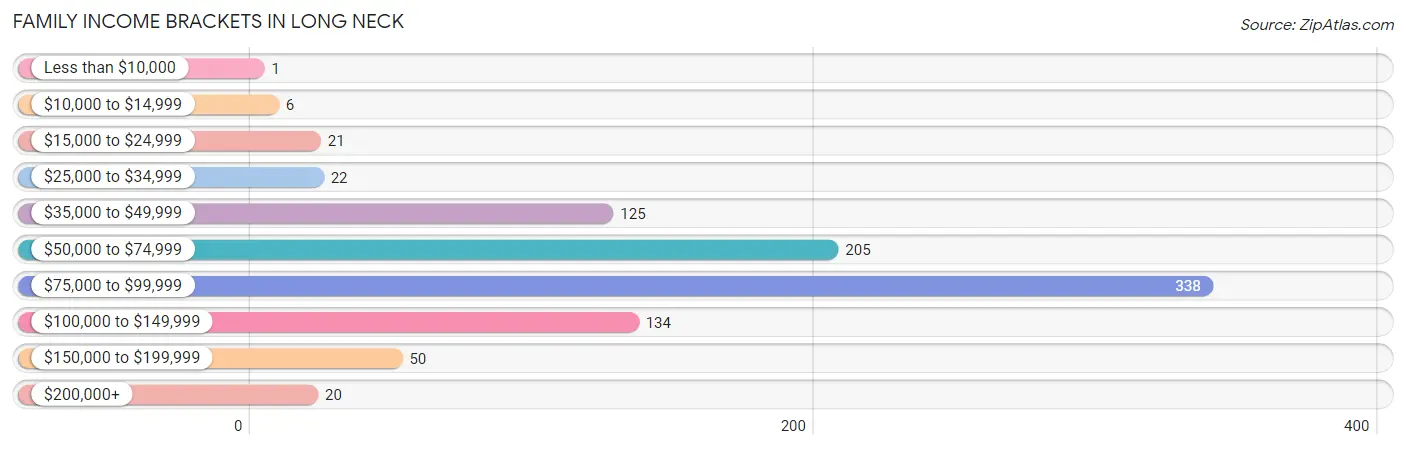
Family Income Brackets in Long Neck
According to the Long Neck family income data, there are 338 families falling into the $75,000 to $99,999 income range, which is the most common income bracket and makes up 36.7% of all families. Conversely, the less than $10,000 income bracket is the least frequent group with only 1 families (0.1%) belonging to this category.
| Income Bracket | # Families | % Families |
| Less than $10,000 | 1 | 0.1% |
| $10,000 to $14,999 | 6 | 0.7% |
| $15,000 to $24,999 | 21 | 2.3% |
| $25,000 to $34,999 | 22 | 2.4% |
| $35,000 to $49,999 | 125 | 13.6% |
| $50,000 to $74,999 | 205 | 22.2% |
| $75,000 to $99,999 | 338 | 36.7% |
| $100,000 to $149,999 | 134 | 14.5% |
| $150,000 to $199,999 | 50 | 5.4% |
| $200,000+ | 20 | 2.2% |
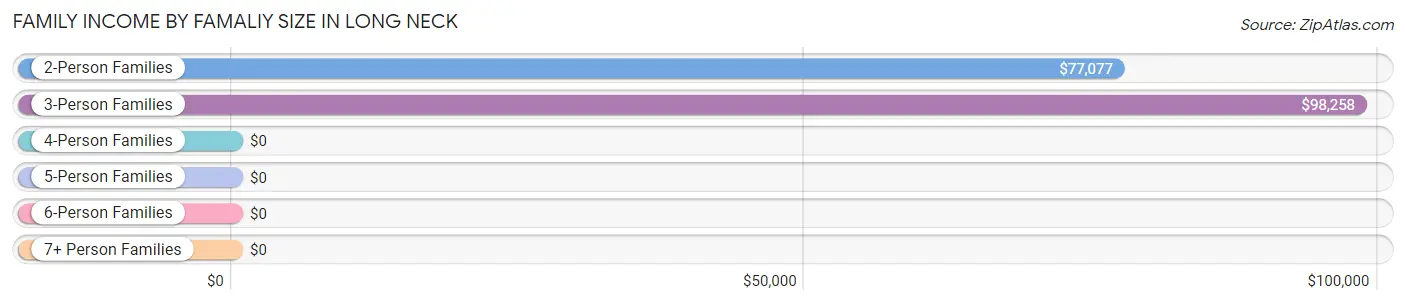
Family Income by Famaliy Size in Long Neck
3-person families (133 | 14.4%) account for the highest median family income in Long Neck with $98,258 per family, while 2-person families (693 | 75.2%) have the highest median income of $38,538 per family member.
| Income Bracket | # Families | Median Income |
| 2-Person Families | 693 (75.2%) | $77,077 |
| 3-Person Families | 133 (14.4%) | $98,258 |
| 4-Person Families | 72 (7.8%) | $0 |
| 5-Person Families | 20 (2.2%) | $0 |
| 6-Person Families | 4 (0.4%) | $0 |
| 7+ Person Families | 0 (0.0%) | $0 |
| Total | 922 (100.0%) | $80,000 |
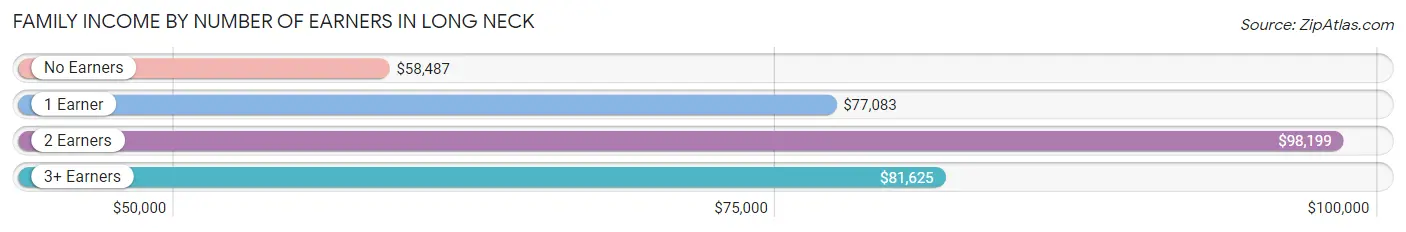
Family Income by Number of Earners in Long Neck
The median family income in Long Neck is $80,000, with families comprising 2 earners (299) having the highest median family income of $98,199, while families with no earners (295) have the lowest median family income of $58,487, accounting for 32.4% and 32.0% of families, respectively.
| Number of Earners | # Families | Median Income |
| No Earners | 295 (32.0%) | $58,487 |
| 1 Earner | 274 (29.7%) | $77,083 |
| 2 Earners | 299 (32.4%) | $98,199 |
| 3+ Earners | 54 (5.9%) | $81,625 |
| Total | 922 (100.0%) | $80,000 |
Household Income in Long Neck
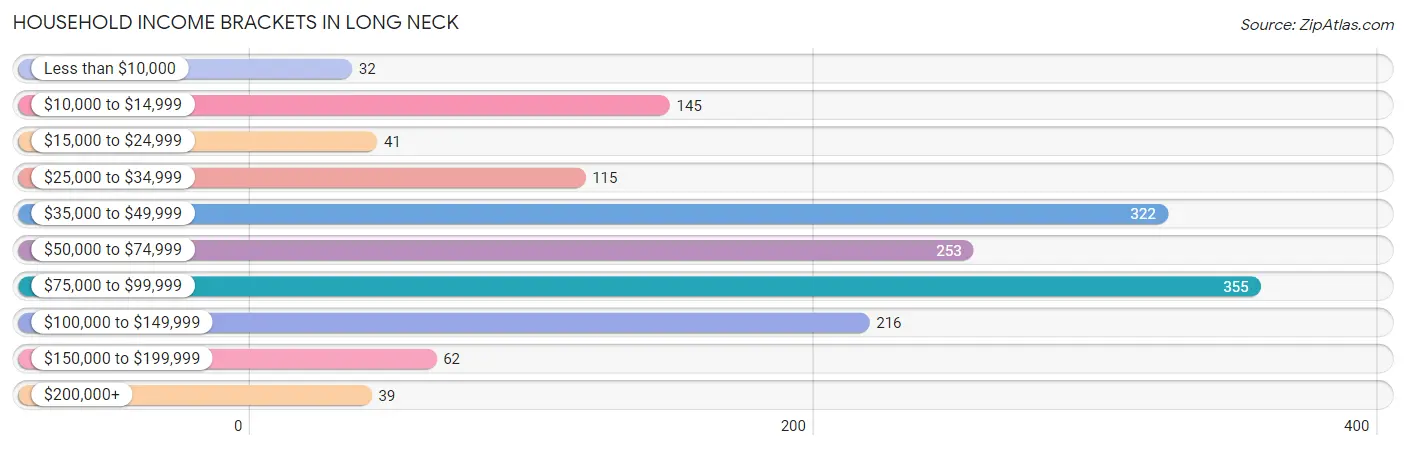
Household Income Brackets in Long Neck
With 355 households falling in the category, the $75,000 to $99,999 income range is the most frequent in Long Neck, accounting for 22.5% of all households. In contrast, only 32 households (2.0%) fall into the less than $10,000 income bracket, making it the least populous group.
| Income Bracket | # Households | % Households |
| Less than $10,000 | 32 | 2.0% |
| $10,000 to $14,999 | 145 | 9.2% |
| $15,000 to $24,999 | 41 | 2.6% |
| $25,000 to $34,999 | 115 | 7.3% |
| $35,000 to $49,999 | 322 | 20.4% |
| $50,000 to $74,999 | 253 | 16.0% |
| $75,000 to $99,999 | 355 | 22.5% |
| $100,000 to $149,999 | 216 | 13.7% |
| $150,000 to $199,999 | 62 | 3.9% |
| $200,000+ | 39 | 2.5% |
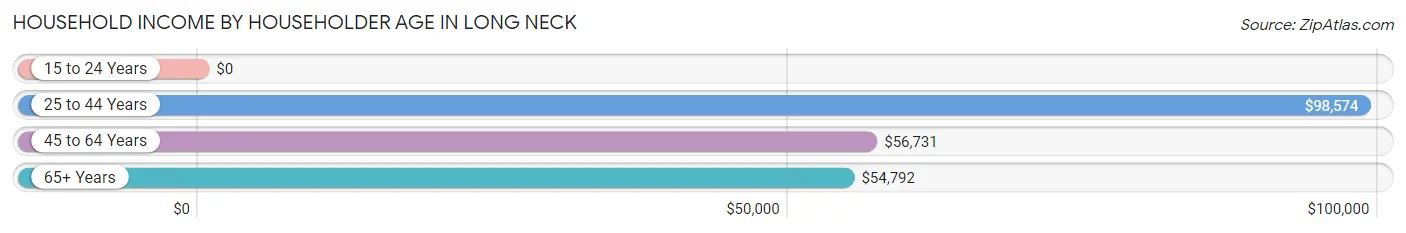
Household Income by Householder Age in Long Neck
The median household income in Long Neck is $59,563, with the highest median household income of $98,574 found in the 25 to 44 years age bracket for the primary householder. A total of 239 households (15.1%) fall into this category.
| Income Bracket | # Households | Median Income |
| 15 to 24 Years | 0 (0.0%) | $0 |
| 25 to 44 Years | 239 (15.1%) | $98,574 |
| 45 to 64 Years | 524 (33.2%) | $56,731 |
| 65+ Years | 816 (51.7%) | $54,792 |
| Total | 1,579 (100.0%) | $59,563 |
Poverty in Long Neck
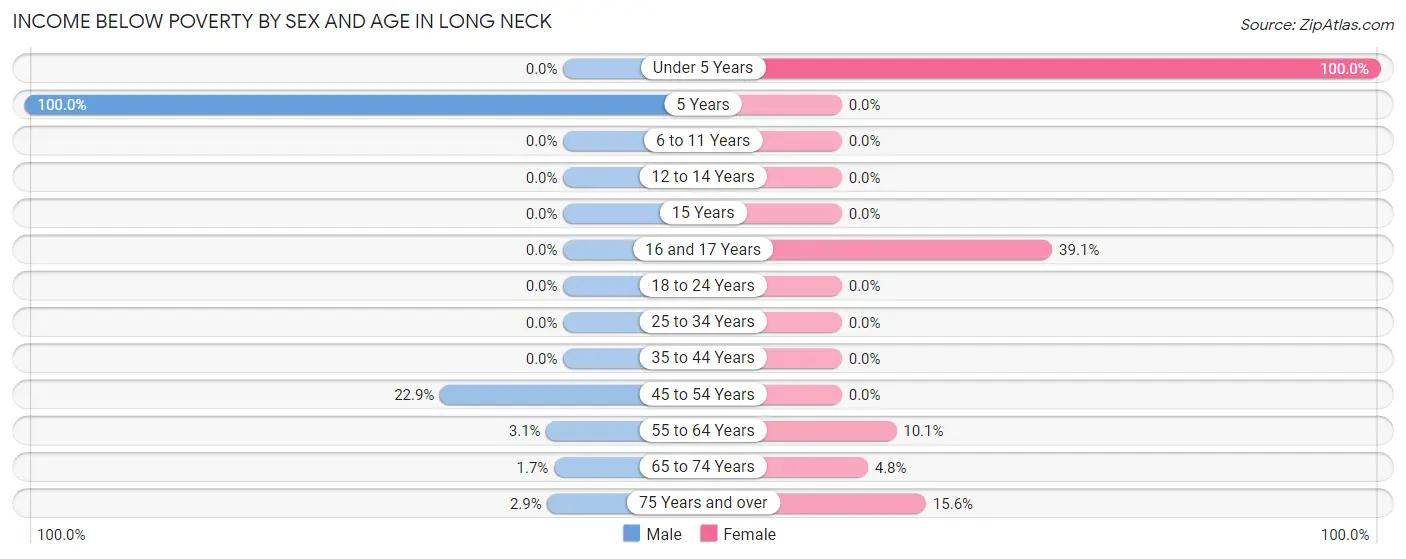
Income Below Poverty by Sex and Age in Long Neck
With 4.1% poverty level for males and 8.6% for females among the residents of Long Neck, 5 year old males and under 5 year old females are the most vulnerable to poverty, with 13 males (100.0%) and 13 females (100.0%) in their respective age groups living below the poverty level.
| Age Bracket | Male | Female |
| Under 5 Years | 0 (0.0%) | 13 (100.0%) |
| 5 Years | 13 (100.0%) | 0 (0.0%) |
| 6 to 11 Years | 0 (0.0%) | 0 (0.0%) |
| 12 to 14 Years | 0 (0.0%) | 0 (0.0%) |
| 15 Years | 0 (0.0%) | 0 (0.0%) |
| 16 and 17 Years | 0 (0.0%) | 41 (39.1%) |
| 18 to 24 Years | 0 (0.0%) | 0 (0.0%) |
| 25 to 34 Years | 0 (0.0%) | 0 (0.0%) |
| 35 to 44 Years | 0 (0.0%) | 0 (0.0%) |
| 45 to 54 Years | 16 (22.9%) | 0 (0.0%) |
| 55 to 64 Years | 9 (3.1%) | 42 (10.1%) |
| 65 to 74 Years | 6 (1.7%) | 27 (4.8%) |
| 75 Years and over | 5 (2.9%) | 27 (15.6%) |
| Total | 49 (4.1%) | 150 (8.6%) |
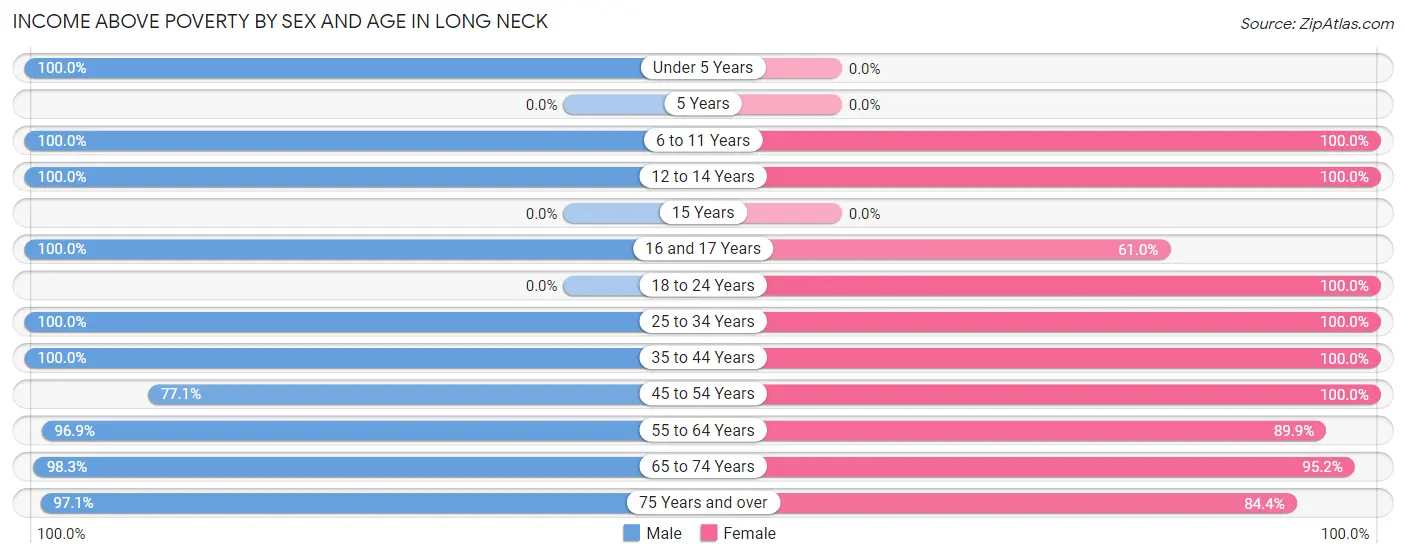
Income Above Poverty by Sex and Age in Long Neck
According to the poverty statistics in Long Neck, males aged under 5 years and females aged 6 to 11 years are the age groups that are most secure financially, with 100.0% of males and 100.0% of females in these age groups living above the poverty line.
| Age Bracket | Male | Female |
| Under 5 Years | 23 (100.0%) | 0 (0.0%) |
| 5 Years | 0 (0.0%) | 0 (0.0%) |
| 6 to 11 Years | 43 (100.0%) | 30 (100.0%) |
| 12 to 14 Years | 16 (100.0%) | 59 (100.0%) |
| 15 Years | 0 (0.0%) | 0 (0.0%) |
| 16 and 17 Years | 11 (100.0%) | 64 (61.0%) |
| 18 to 24 Years | 0 (0.0%) | 22 (100.0%) |
| 25 to 34 Years | 92 (100.0%) | 169 (100.0%) |
| 35 to 44 Years | 132 (100.0%) | 125 (100.0%) |
| 45 to 54 Years | 54 (77.1%) | 84 (100.0%) |
| 55 to 64 Years | 278 (96.9%) | 373 (89.9%) |
| 65 to 74 Years | 346 (98.3%) | 533 (95.2%) |
| 75 Years and over | 165 (97.1%) | 146 (84.4%) |
| Total | 1,160 (96.0%) | 1,605 (91.4%) |
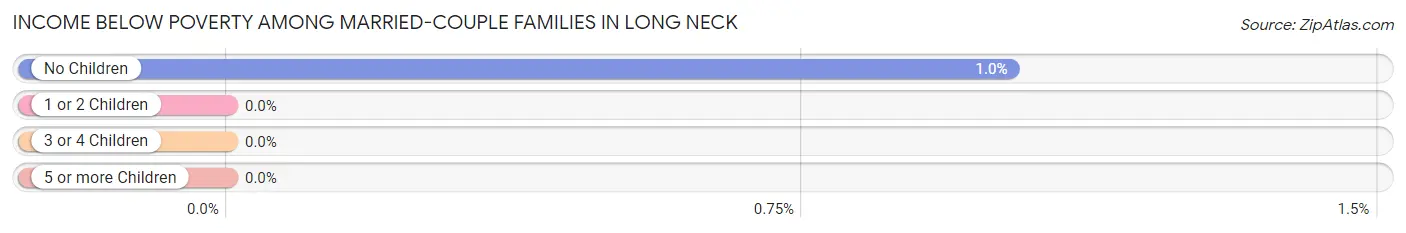
Income Below Poverty Among Married-Couple Families in Long Neck
The poverty statistics for married-couple families in Long Neck show that 0.8% or 7 of the total 841 families live below the poverty line. Families with no children have the highest poverty rate of 1.0%, comprising of 7 families. On the other hand, families with 1 or 2 children have the lowest poverty rate of 0.0%, which includes 0 families.
| Children | Above Poverty | Below Poverty |
| No Children | 678 (99.0%) | 7 (1.0%) |
| 1 or 2 Children | 152 (100.0%) | 0 (0.0%) |
| 3 or 4 Children | 4 (100.0%) | 0 (0.0%) |
| 5 or more Children | 0 (0.0%) | 0 (0.0%) |
| Total | 834 (99.2%) | 7 (0.8%) |
Income Below Poverty Among Single-Parent Households in Long Neck
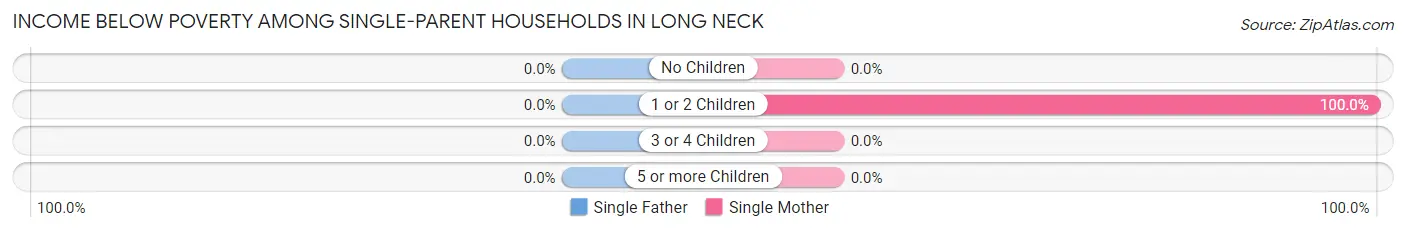
| Children | Single Father | Single Mother |
| No Children | 0 (0.0%) | 0 (0.0%) |
| 1 or 2 Children | 0 (0.0%) | 14 (100.0%) |
| 3 or 4 Children | 0 (0.0%) | 0 (0.0%) |
| 5 or more Children | 0 (0.0%) | 0 (0.0%) |
| Total | 0 (0.0%) | 14 (28.0%) |
Income Below Poverty Among Married-Couple vs Single-Parent Households in Long Neck
The poverty data for Long Neck shows that 7 of the married-couple family households (0.8%) and 14 of the single-parent households (17.3%) are living below the poverty level. Within the married-couple family households, those with no children have the highest poverty rate, with 7 households (1.0%) falling below the poverty line. Among the single-parent households, those with 1 or 2 children have the highest poverty rate, with 14 household (56.0%) living below poverty.
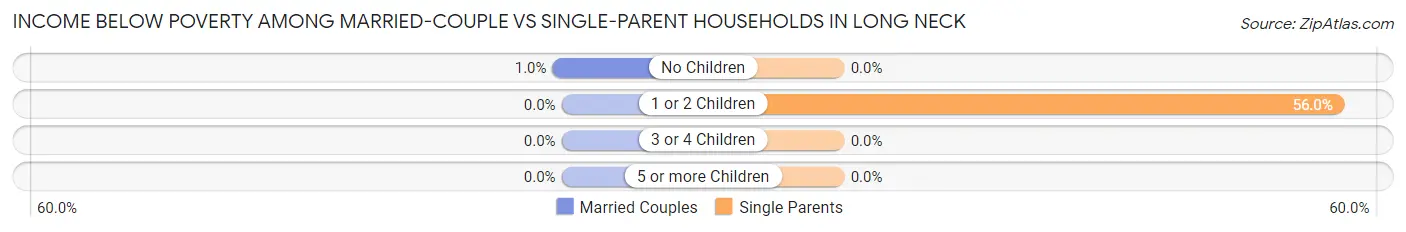
| Children | Married-Couple Families | Single-Parent Households |
| No Children | 7 (1.0%) | 0 (0.0%) |
| 1 or 2 Children | 0 (0.0%) | 14 (56.0%) |
| 3 or 4 Children | 0 (0.0%) | 0 (0.0%) |
| 5 or more Children | 0 (0.0%) | 0 (0.0%) |
| Total | 7 (0.8%) | 14 (17.3%) |
Race in Long Neck
The most populous races in Long Neck are White / Caucasian (2,779 | 93.2%), Black / African American (78 | 2.6%), and Two or more Races (67 | 2.2%).
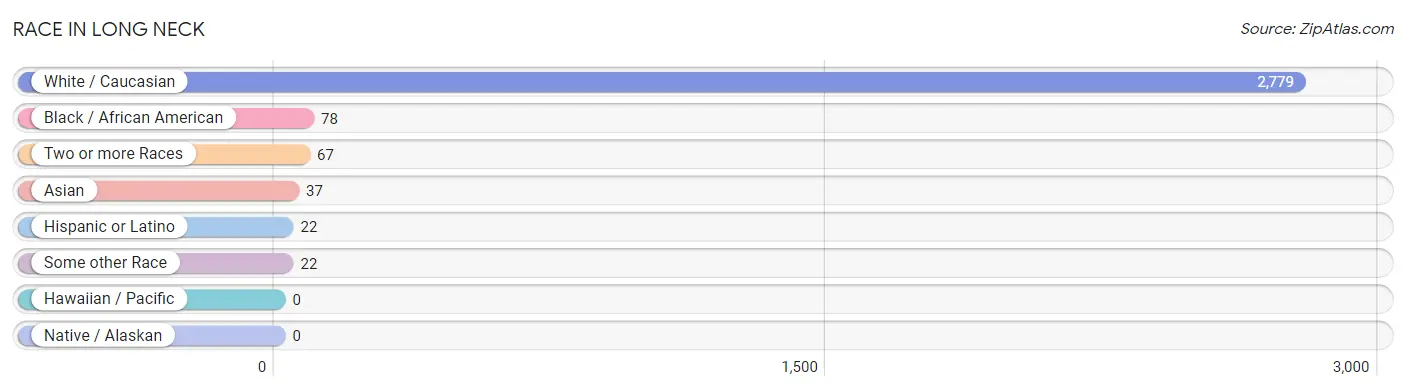
| Race | # Population | % Population |
| Asian | 37 | 1.2% |
| Black / African American | 78 | 2.6% |
| Hawaiian / Pacific | 0 | 0.0% |
| Hispanic or Latino | 22 | 0.7% |
| Native / Alaskan | 0 | 0.0% |
| White / Caucasian | 2,779 | 93.2% |
| Two or more Races | 67 | 2.2% |
| Some other Race | 22 | 0.7% |
| Total | 2,983 | 100.0% |
Ancestry in Long Neck
The most populous ancestries reported in Long Neck are Italian (783 | 26.3%), German (731 | 24.5%), Irish (654 | 21.9%), English (365 | 12.2%), and Polish (173 | 5.8%), together accounting for 90.7% of all Long Neck residents.
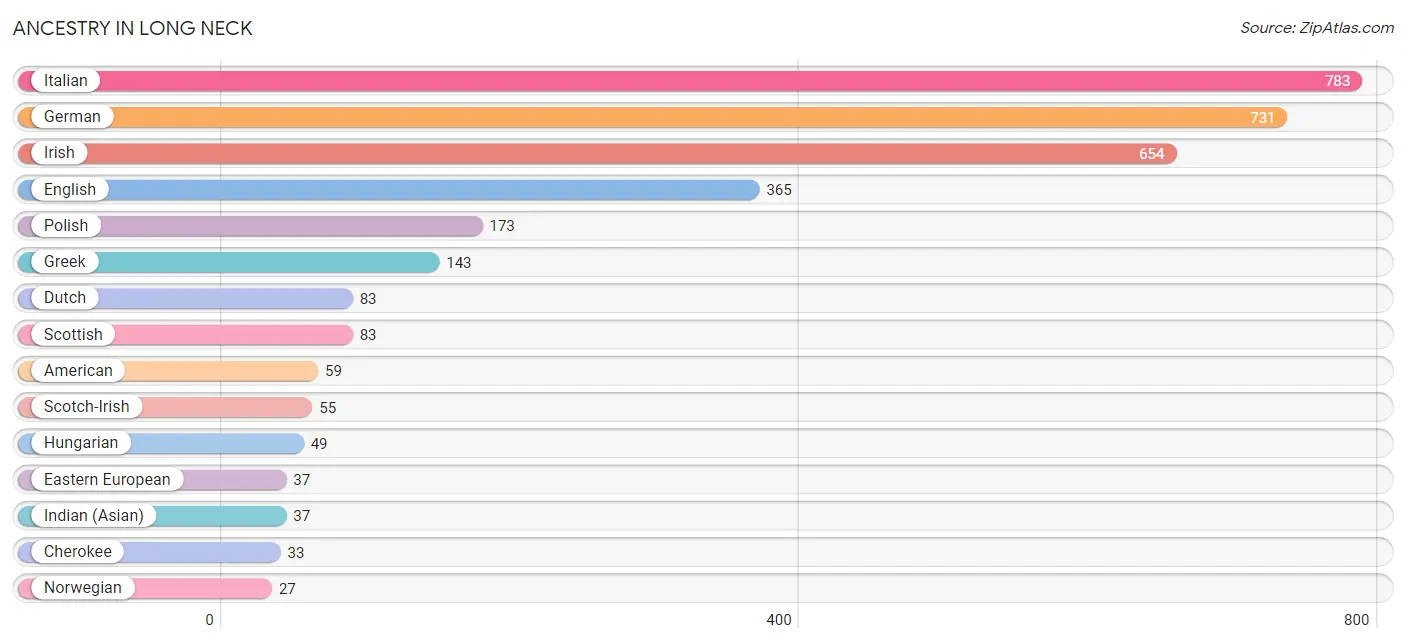
| Ancestry | # Population | % Population |
| American | 59 | 2.0% |
| Arab | 6 | 0.2% |
| British | 7 | 0.2% |
| Central American | 9 | 0.3% |
| Cherokee | 33 | 1.1% |
| Danish | 21 | 0.7% |
| Dutch | 83 | 2.8% |
| Eastern European | 37 | 1.2% |
| English | 365 | 12.2% |
| European | 4 | 0.1% |
| French | 23 | 0.8% |
| German | 731 | 24.5% |
| Greek | 143 | 4.8% |
| Hungarian | 49 | 1.6% |
| Indian (Asian) | 37 | 1.2% |
| Irish | 654 | 21.9% |
| Italian | 783 | 26.3% |
| Lebanese | 6 | 0.2% |
| Norwegian | 27 | 0.9% |
| Paraguayan | 13 | 0.4% |
| Polish | 173 | 5.8% |
| Portuguese | 6 | 0.2% |
| Russian | 18 | 0.6% |
| Salvadoran | 9 | 0.3% |
| Scotch-Irish | 55 | 1.8% |
| Scottish | 83 | 2.8% |
| Slovak | 5 | 0.2% |
| South American | 13 | 0.4% |
| Swiss | 13 | 0.4% |
| Turkish | 7 | 0.2% |
| Welsh | 6 | 0.2% | View All 31 Rows |
Immigrants in Long Neck
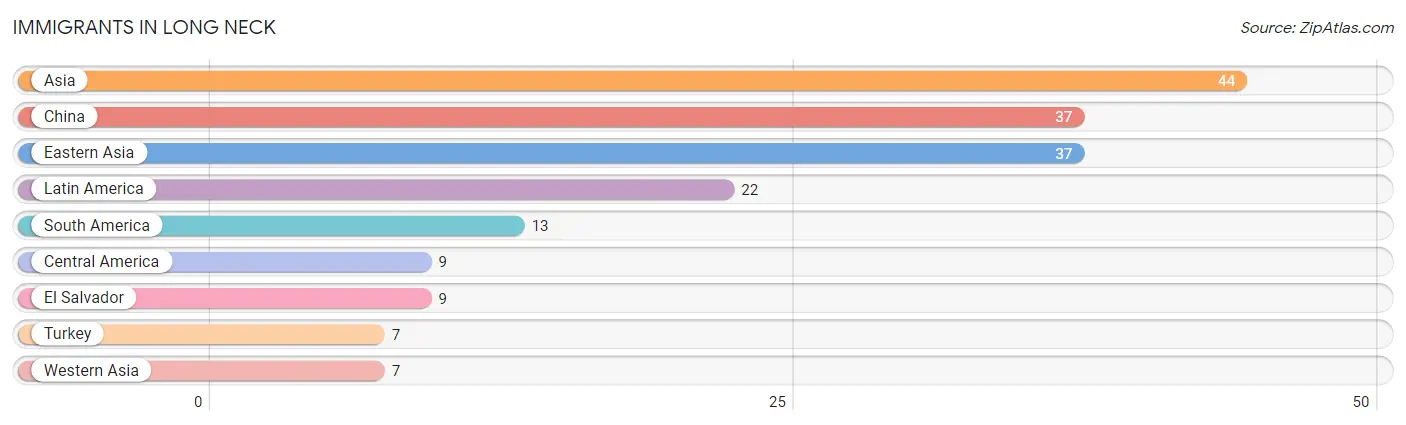
The most numerous immigrant groups reported in Long Neck came from Asia (44 | 1.5%), China (37 | 1.2%), Eastern Asia (37 | 1.2%), Latin America (22 | 0.7%), and South America (13 | 0.4%), together accounting for 5.1% of all Long Neck residents.
| Immigration Origin | # Population | % Population |
| Asia | 44 | 1.5% |
| Central America | 9 | 0.3% |
| China | 37 | 1.2% |
| Eastern Asia | 37 | 1.2% |
| El Salvador | 9 | 0.3% |
| Latin America | 22 | 0.7% |
| South America | 13 | 0.4% |
| Turkey | 7 | 0.2% |
| Western Asia | 7 | 0.2% | View All 9 Rows |
Sex and Age in Long Neck
Sex and Age in Long Neck
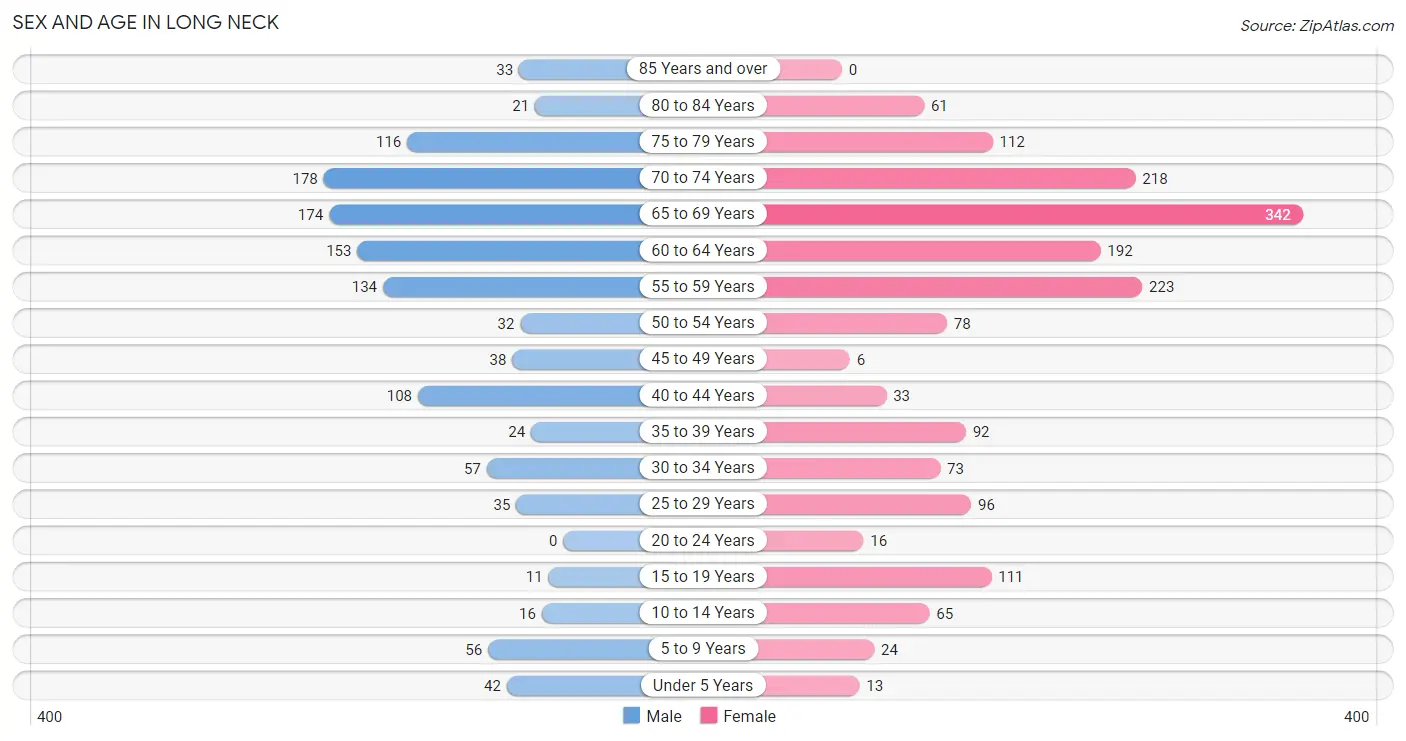
The most populous age groups in Long Neck are 70 to 74 Years (178 | 14.5%) for men and 65 to 69 Years (342 | 19.5%) for women.
| Age Bracket | Male | Female |
| Under 5 Years | 42 (3.4%) | 13 (0.7%) |
| 5 to 9 Years | 56 (4.6%) | 24 (1.4%) |
| 10 to 14 Years | 16 (1.3%) | 65 (3.7%) |
| 15 to 19 Years | 11 (0.9%) | 111 (6.3%) |
| 20 to 24 Years | 0 (0.0%) | 16 (0.9%) |
| 25 to 29 Years | 35 (2.9%) | 96 (5.5%) |
| 30 to 34 Years | 57 (4.6%) | 73 (4.2%) |
| 35 to 39 Years | 24 (1.9%) | 92 (5.2%) |
| 40 to 44 Years | 108 (8.8%) | 33 (1.9%) |
| 45 to 49 Years | 38 (3.1%) | 6 (0.3%) |
| 50 to 54 Years | 32 (2.6%) | 78 (4.4%) |
| 55 to 59 Years | 134 (10.9%) | 223 (12.7%) |
| 60 to 64 Years | 153 (12.5%) | 192 (10.9%) |
| 65 to 69 Years | 174 (14.2%) | 342 (19.5%) |
| 70 to 74 Years | 178 (14.5%) | 218 (12.4%) |
| 75 to 79 Years | 116 (9.5%) | 112 (6.4%) |
| 80 to 84 Years | 21 (1.7%) | 61 (3.5%) |
| 85 Years and over | 33 (2.7%) | 0 (0.0%) |
| Total | 1,228 (100.0%) | 1,755 (100.0%) |
Families and Households in Long Neck
Median Family Size in Long Neck
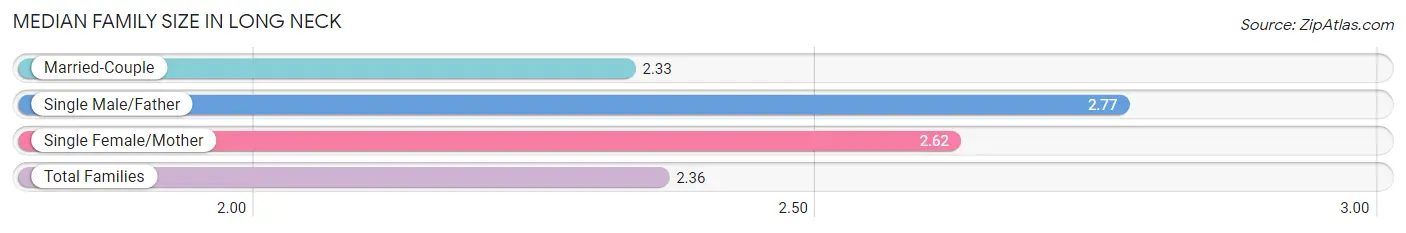
The median family size in Long Neck is 2.36 persons per family, with single male/father families (31 | 3.4%) accounting for the largest median family size of 2.77 persons per family. On the other hand, married-couple families (841 | 91.2%) represent the smallest median family size with 2.33 persons per family.
| Family Type | # Families | Family Size |
| Married-Couple | 841 (91.2%) | 2.33 |
| Single Male/Father | 31 (3.4%) | 2.77 |
| Single Female/Mother | 50 (5.4%) | 2.62 |
| Total Families | 922 (100.0%) | 2.36 |
Median Household Size in Long Neck
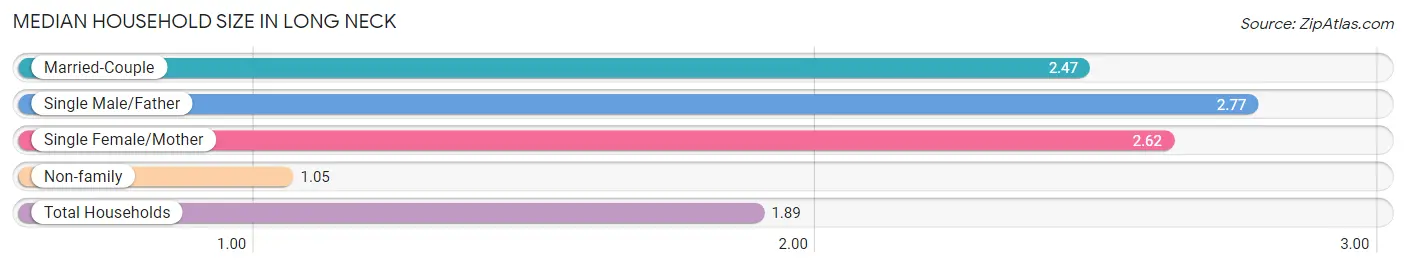
The median household size in Long Neck is 1.89 persons per household, with single male/father households (31 | 2.0%) accounting for the largest median household size of 2.77 persons per household. non-family households (657 | 41.6%) represent the smallest median household size with 1.05 persons per household.
| Household Type | # Households | Household Size |
| Married-Couple | 841 (53.3%) | 2.47 |
| Single Male/Father | 31 (2.0%) | 2.77 |
| Single Female/Mother | 50 (3.2%) | 2.62 |
| Non-family | 657 (41.6%) | 1.05 |
| Total Households | 1,579 (100.0%) | 1.89 |
Household Size by Marriage Status in Long Neck
Out of a total of 1,579 households in Long Neck, 922 (58.4%) are family households, while 657 (41.6%) are nonfamily households. The most numerous type of family households are 2-person households, comprising 681, and the most common type of nonfamily households are 1-person households, comprising 629.
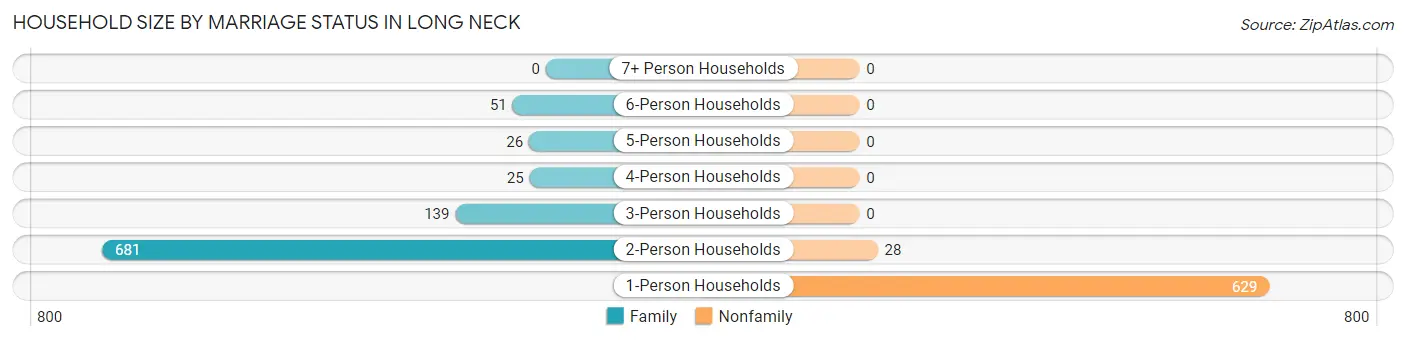
| Household Size | Family Households | Nonfamily Households |
| 1-Person Households | - | 629 (39.8%) |
| 2-Person Households | 681 (43.1%) | 28 (1.8%) |
| 3-Person Households | 139 (8.8%) | 0 (0.0%) |
| 4-Person Households | 25 (1.6%) | 0 (0.0%) |
| 5-Person Households | 26 (1.7%) | 0 (0.0%) |
| 6-Person Households | 51 (3.2%) | 0 (0.0%) |
| 7+ Person Households | 0 (0.0%) | 0 (0.0%) |
| Total | 922 (58.4%) | 657 (41.6%) |
Female Fertility in Long Neck
Fertility by Age in Long Neck
| Age Bracket | Women with Births | Births / 1,000 Women |
| 15 to 19 years | 0 (0.0%) | 0.0 |
| 20 to 34 years | 0 (0.0%) | 0.0 |
| 35 to 50 years | 0 (0.0%) | 0.0 |
| Total | 0 (0.0%) | 0.0 |
Fertility by Age by Marriage Status in Long Neck
| Age Bracket | Married | Unmarried |
| 15 to 19 years | 0 (0.0%) | 0 (0.0%) |
| 20 to 34 years | 0 (0.0%) | 0 (0.0%) |
| 35 to 50 years | 0 (0.0%) | 0 (0.0%) |
| Total | 0 (0.0%) | 0 (0.0%) |
Fertility by Education in Long Neck
| Educational Attainment | Women with Births | Births / 1,000 Women |
| Less than High School | 0 (0.0%) | 0.0 |
| High School Diploma | 0 (0.0%) | 0.0 |
| College or Associate's Degree | 0 (0.0%) | 0.0 |
| Bachelor's Degree | 0 (0.0%) | 0.0 |
| Graduate Degree | 0 (0.0%) | 0.0 |
| Total | 0 (0.0%) | 0.0 |
Fertility by Education by Marriage Status in Long Neck
| Educational Attainment | Married | Unmarried |
| Less than High School | 0 (0.0%) | 0 (0.0%) |
| High School Diploma | 0 (0.0%) | 0 (0.0%) |
| College or Associate's Degree | 0 (0.0%) | 0 (0.0%) |
| Bachelor's Degree | 0 (0.0%) | 0 (0.0%) |
| Graduate Degree | 0 (0.0%) | 0 (0.0%) |
| Total | 0 (0.0%) | 0 (0.0%) |
Employment Characteristics in Long Neck
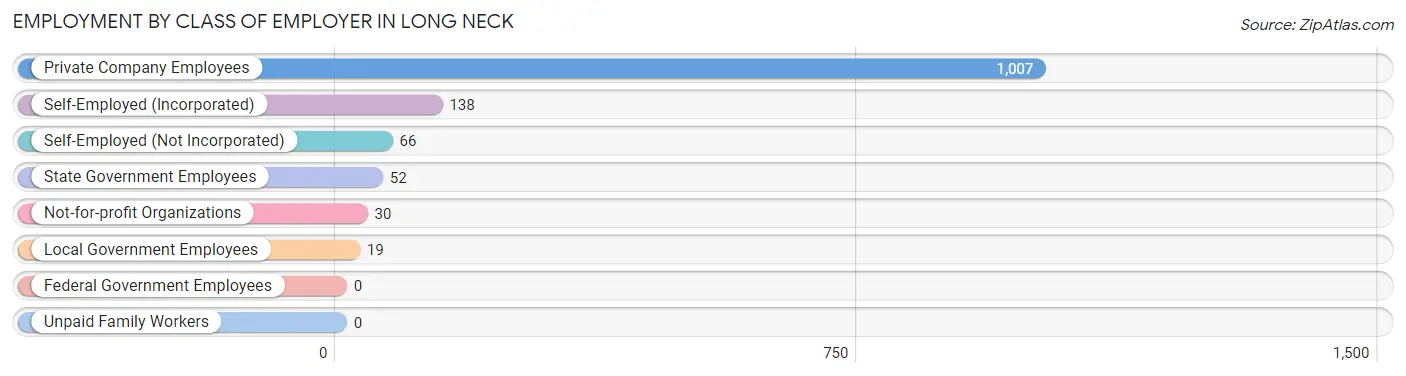
Employment by Class of Employer in Long Neck
Among the 1,312 employed individuals in Long Neck, private company employees (1,007 | 76.7%), self-employed (incorporated) (138 | 10.5%), and self-employed (not incorporated) (66 | 5.0%) make up the most common classes of employment.
| Employer Class | # Employees | % Employees |
| Private Company Employees | 1,007 | 76.7% |
| Self-Employed (Incorporated) | 138 | 10.5% |
| Self-Employed (Not Incorporated) | 66 | 5.0% |
| Not-for-profit Organizations | 30 | 2.3% |
| Local Government Employees | 19 | 1.5% |
| State Government Employees | 52 | 4.0% |
| Federal Government Employees | 0 | 0.0% |
| Unpaid Family Workers | 0 | 0.0% |
| Total | 1,312 | 100.0% |
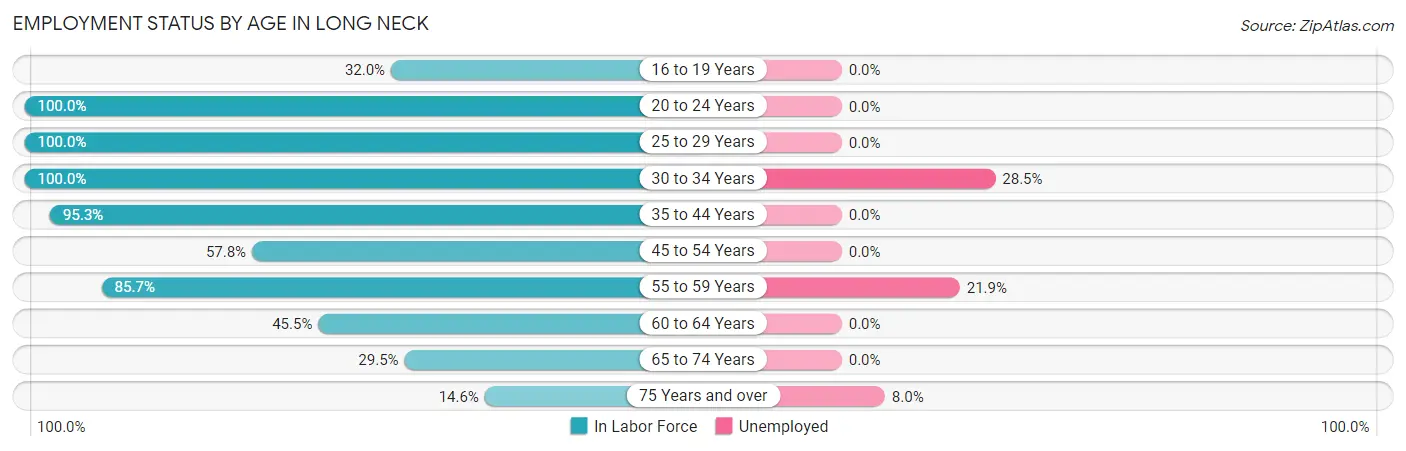
Employment Status by Age in Long Neck
According to the labor force statistics for Long Neck, out of the total population over 16 years of age (2,767), 51.8% or 1,433 individuals are in the labor force, with 7.5% or 107 of them unemployed. The age group with the highest labor force participation rate is 20 to 24 years, with 100.0% or 16 individuals in the labor force. Within the labor force, the 30 to 34 years age range has the highest percentage of unemployed individuals, with 28.5% or 37 of them being unemployed.
| Age Bracket | In Labor Force | Unemployed |
| 16 to 19 Years | 39 (32.0%) | 0 (0.0%) |
| 20 to 24 Years | 16 (100.0%) | 0 (0.0%) |
| 25 to 29 Years | 131 (100.0%) | 0 (0.0%) |
| 30 to 34 Years | 130 (100.0%) | 37 (28.5%) |
| 35 to 44 Years | 245 (95.3%) | 0 (0.0%) |
| 45 to 54 Years | 89 (57.8%) | 0 (0.0%) |
| 55 to 59 Years | 306 (85.7%) | 67 (21.9%) |
| 60 to 64 Years | 157 (45.5%) | 0 (0.0%) |
| 65 to 74 Years | 269 (29.5%) | 0 (0.0%) |
| 75 Years and over | 50 (14.6%) | 4 (8.0%) |
| Total | 1,433 (51.8%) | 107 (7.5%) |
Employment Status by Educational Attainment in Long Neck
According to labor force statistics for Long Neck, 77.0% of individuals (1,058) out of the total population between 25 and 64 years of age (1,374) are in the labor force, with 9.8% or 104 of them being unemployed. The group with the highest labor force participation rate are those with the educational attainment of bachelor's degree or higher, with 93.3% or 249 individuals in the labor force. Within the labor force, individuals with college / associate degree education have the highest percentage of unemployment, with 20.1% or 67 of them being unemployed.
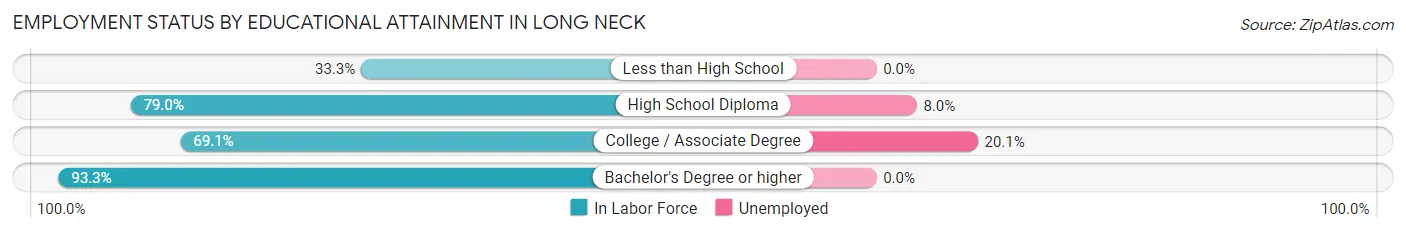
| Educational Attainment | In Labor Force | Unemployed |
| Less than High School | 13 (33.3%) | 0 (0.0%) |
| High School Diploma | 463 (79.0%) | 47 (8.0%) |
| College / Associate Degree | 333 (69.1%) | 97 (20.1%) |
| Bachelor's Degree or higher | 249 (93.3%) | 0 (0.0%) |
| Total | 1,058 (77.0%) | 135 (9.8%) |
Employment Occupations by Sex in Long Neck
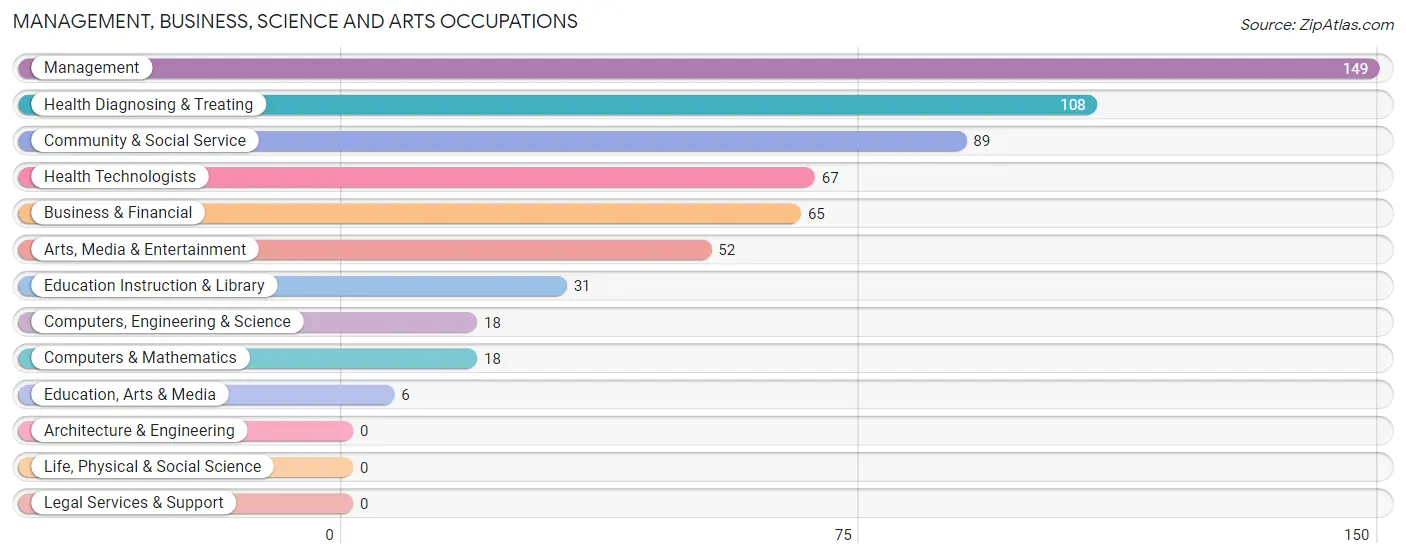
Management, Business, Science and Arts Occupations
The most common Management, Business, Science and Arts occupations in Long Neck are Management (149 | 11.3%), Health Diagnosing & Treating (108 | 8.2%), Community & Social Service (89 | 6.7%), Health Technologists (67 | 5.1%), and Business & Financial (65 | 4.9%).
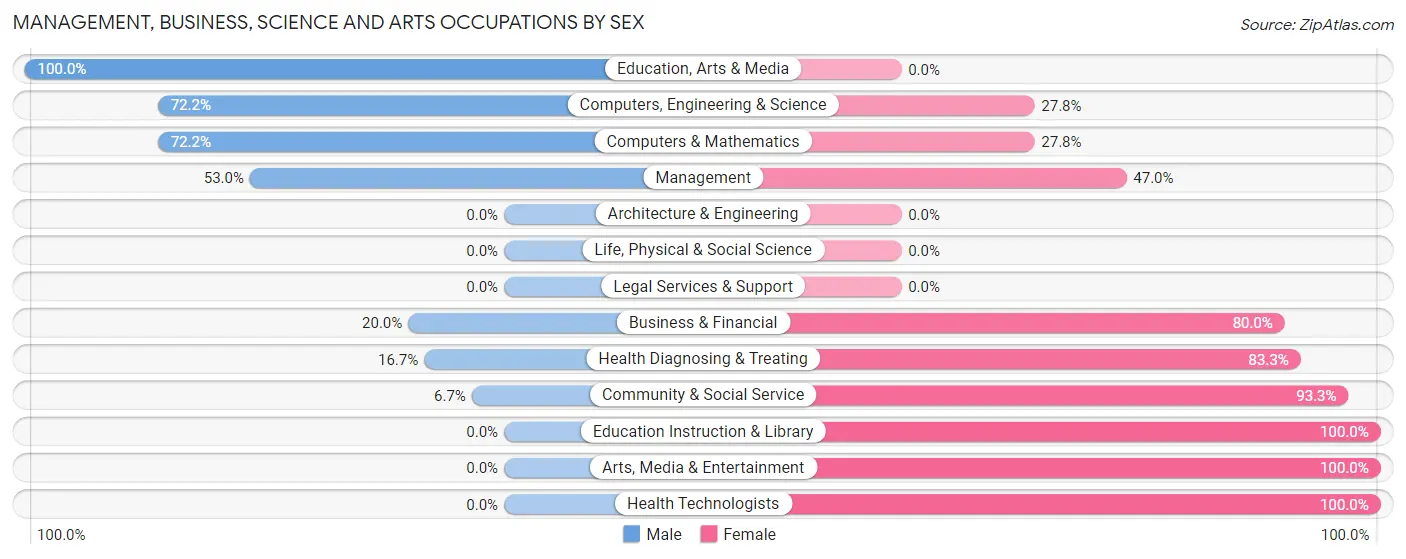
Management, Business, Science and Arts Occupations by Sex
Within the Management, Business, Science and Arts occupations in Long Neck, the most male-oriented occupations are Education, Arts & Media (100.0%), Computers, Engineering & Science (72.2%), and Computers & Mathematics (72.2%), while the most female-oriented occupations are Education Instruction & Library (100.0%), Arts, Media & Entertainment (100.0%), and Health Technologists (100.0%).
| Occupation | Male | Female |
| Management | 79 (53.0%) | 70 (47.0%) |
| Business & Financial | 13 (20.0%) | 52 (80.0%) |
| Computers, Engineering & Science | 13 (72.2%) | 5 (27.8%) |
| Computers & Mathematics | 13 (72.2%) | 5 (27.8%) |
| Architecture & Engineering | 0 (0.0%) | 0 (0.0%) |
| Life, Physical & Social Science | 0 (0.0%) | 0 (0.0%) |
| Community & Social Service | 6 (6.7%) | 83 (93.3%) |
| Education, Arts & Media | 6 (100.0%) | 0 (0.0%) |
| Legal Services & Support | 0 (0.0%) | 0 (0.0%) |
| Education Instruction & Library | 0 (0.0%) | 31 (100.0%) |
| Arts, Media & Entertainment | 0 (0.0%) | 52 (100.0%) |
| Health Diagnosing & Treating | 18 (16.7%) | 90 (83.3%) |
| Health Technologists | 0 (0.0%) | 67 (100.0%) |
| Total (Category) | 129 (30.1%) | 300 (69.9%) |
| Total (Overall) | 564 (42.6%) | 760 (57.4%) |
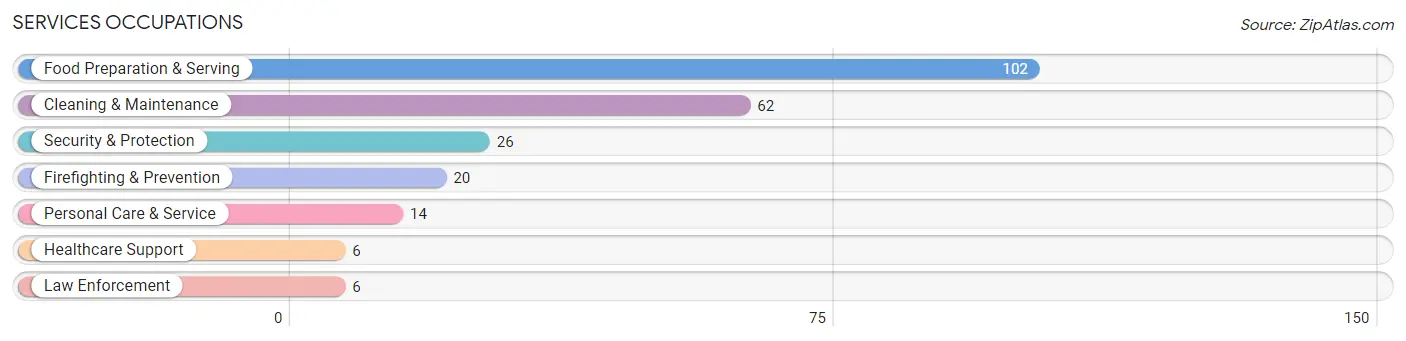
Services Occupations
The most common Services occupations in Long Neck are Food Preparation & Serving (102 | 7.7%), Cleaning & Maintenance (62 | 4.7%), Security & Protection (26 | 2.0%), Firefighting & Prevention (20 | 1.5%), and Personal Care & Service (14 | 1.1%).
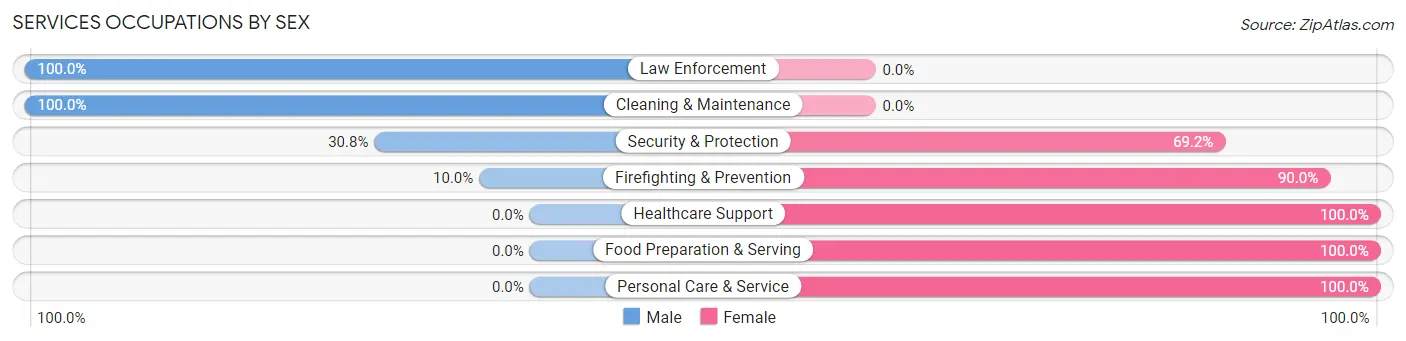
Services Occupations by Sex
Within the Services occupations in Long Neck, the most male-oriented occupations are Law Enforcement (100.0%), Cleaning & Maintenance (100.0%), and Security & Protection (30.8%), while the most female-oriented occupations are Healthcare Support (100.0%), Food Preparation & Serving (100.0%), and Personal Care & Service (100.0%).
| Occupation | Male | Female |
| Healthcare Support | 0 (0.0%) | 6 (100.0%) |
| Security & Protection | 8 (30.8%) | 18 (69.2%) |
| Firefighting & Prevention | 2 (10.0%) | 18 (90.0%) |
| Law Enforcement | 6 (100.0%) | 0 (0.0%) |
| Food Preparation & Serving | 0 (0.0%) | 102 (100.0%) |
| Cleaning & Maintenance | 62 (100.0%) | 0 (0.0%) |
| Personal Care & Service | 0 (0.0%) | 14 (100.0%) |
| Total (Category) | 70 (33.3%) | 140 (66.7%) |
| Total (Overall) | 564 (42.6%) | 760 (57.4%) |
Sales and Office Occupations
The most common Sales and Office occupations in Long Neck are Office & Administration (246 | 18.6%), and Sales & Related (208 | 15.7%).

Sales and Office Occupations by Sex

| Occupation | Male | Female |
| Sales & Related | 111 (53.4%) | 97 (46.6%) |
| Office & Administration | 33 (13.4%) | 213 (86.6%) |
| Total (Category) | 144 (31.7%) | 310 (68.3%) |
| Total (Overall) | 564 (42.6%) | 760 (57.4%) |
Natural Resources, Construction and Maintenance Occupations
The most common Natural Resources, Construction and Maintenance occupations in Long Neck are Construction & Extraction (51 | 3.8%), Installation, Maintenance & Repair (38 | 2.9%), and Farming, Fishing & Forestry (19 | 1.4%).
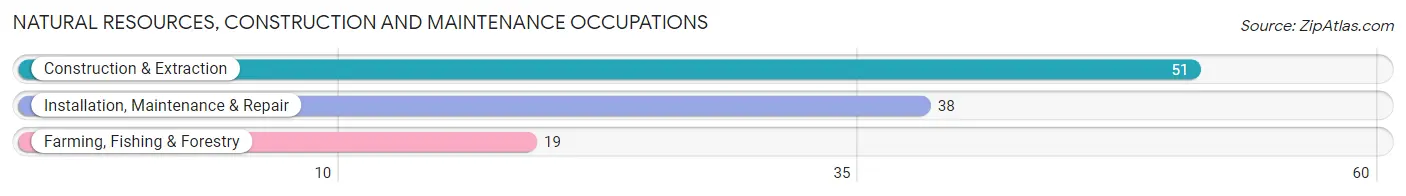
Natural Resources, Construction and Maintenance Occupations by Sex

| Occupation | Male | Female |
| Farming, Fishing & Forestry | 19 (100.0%) | 0 (0.0%) |
| Construction & Extraction | 51 (100.0%) | 0 (0.0%) |
| Installation, Maintenance & Repair | 38 (100.0%) | 0 (0.0%) |
| Total (Category) | 108 (100.0%) | 0 (0.0%) |
| Total (Overall) | 564 (42.6%) | 760 (57.4%) |
Production, Transportation and Moving Occupations
The most common Production, Transportation and Moving occupations in Long Neck are Material Moving (68 | 5.1%), Transportation (30 | 2.3%), and Production (25 | 1.9%).
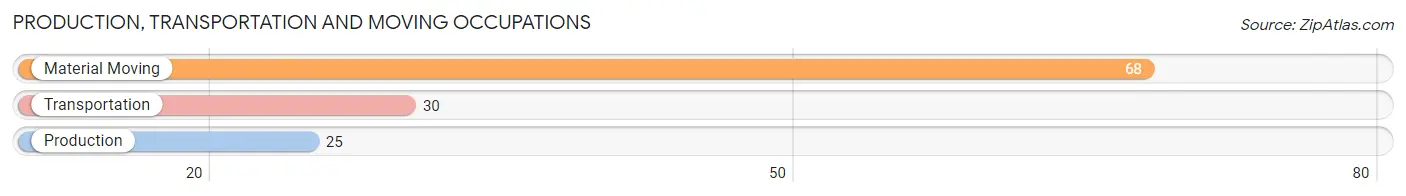
Production, Transportation and Moving Occupations by Sex
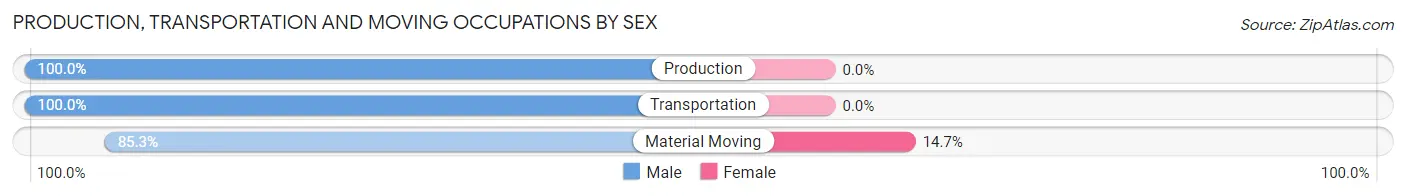
| Occupation | Male | Female |
| Production | 25 (100.0%) | 0 (0.0%) |
| Transportation | 30 (100.0%) | 0 (0.0%) |
| Material Moving | 58 (85.3%) | 10 (14.7%) |
| Total (Category) | 113 (91.9%) | 10 (8.1%) |
| Total (Overall) | 564 (42.6%) | 760 (57.4%) |
Employment Industries by Sex in Long Neck
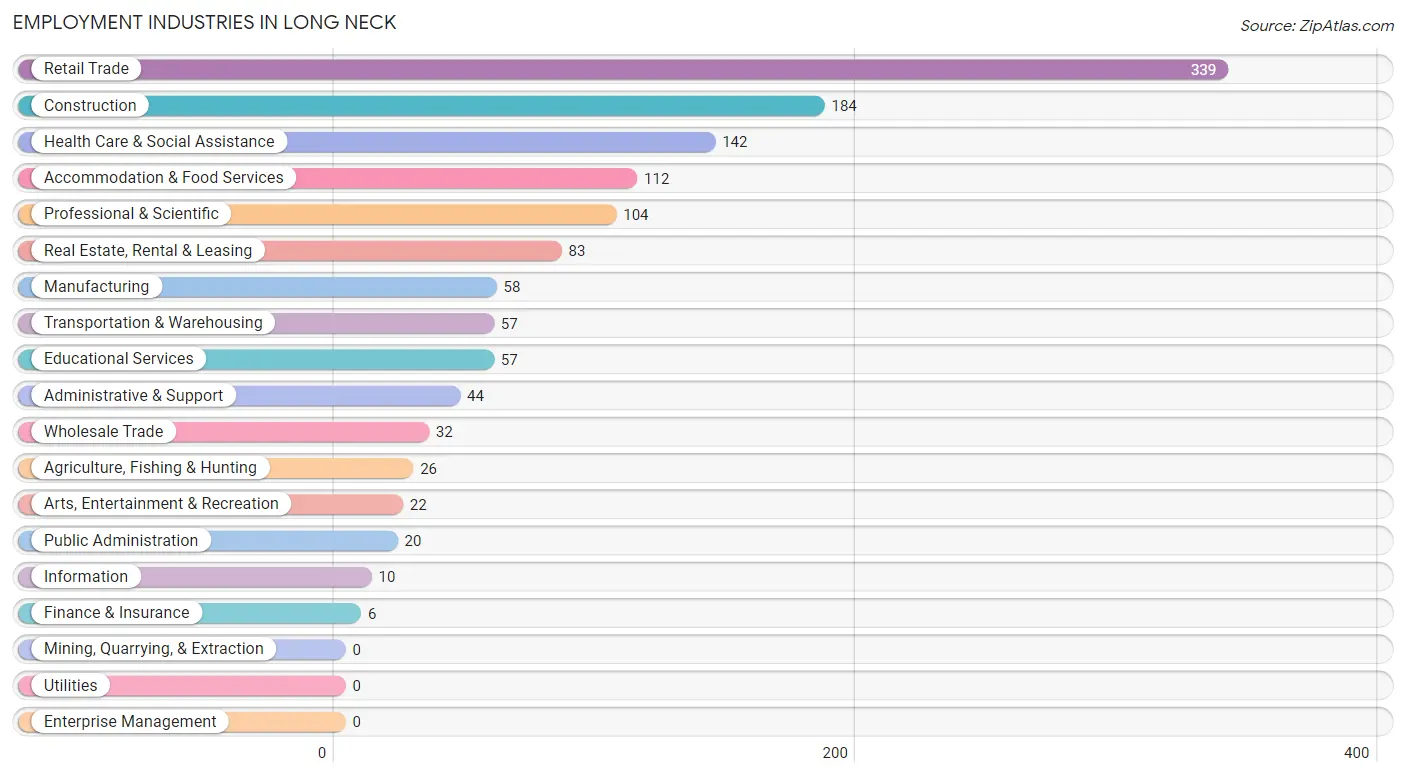
Employment Industries in Long Neck
The major employment industries in Long Neck include Retail Trade (339 | 25.6%), Construction (184 | 13.9%), Health Care & Social Assistance (142 | 10.7%), Accommodation & Food Services (112 | 8.5%), and Professional & Scientific (104 | 7.9%).
Employment Industries by Sex in Long Neck
The Long Neck industries that see more men than women are Agriculture, Fishing & Hunting (100.0%), Finance & Insurance (100.0%), and Public Administration (100.0%), whereas the industries that tend to have a higher number of women are Information (100.0%), Accommodation & Food Services (100.0%), and Health Care & Social Assistance (87.3%).
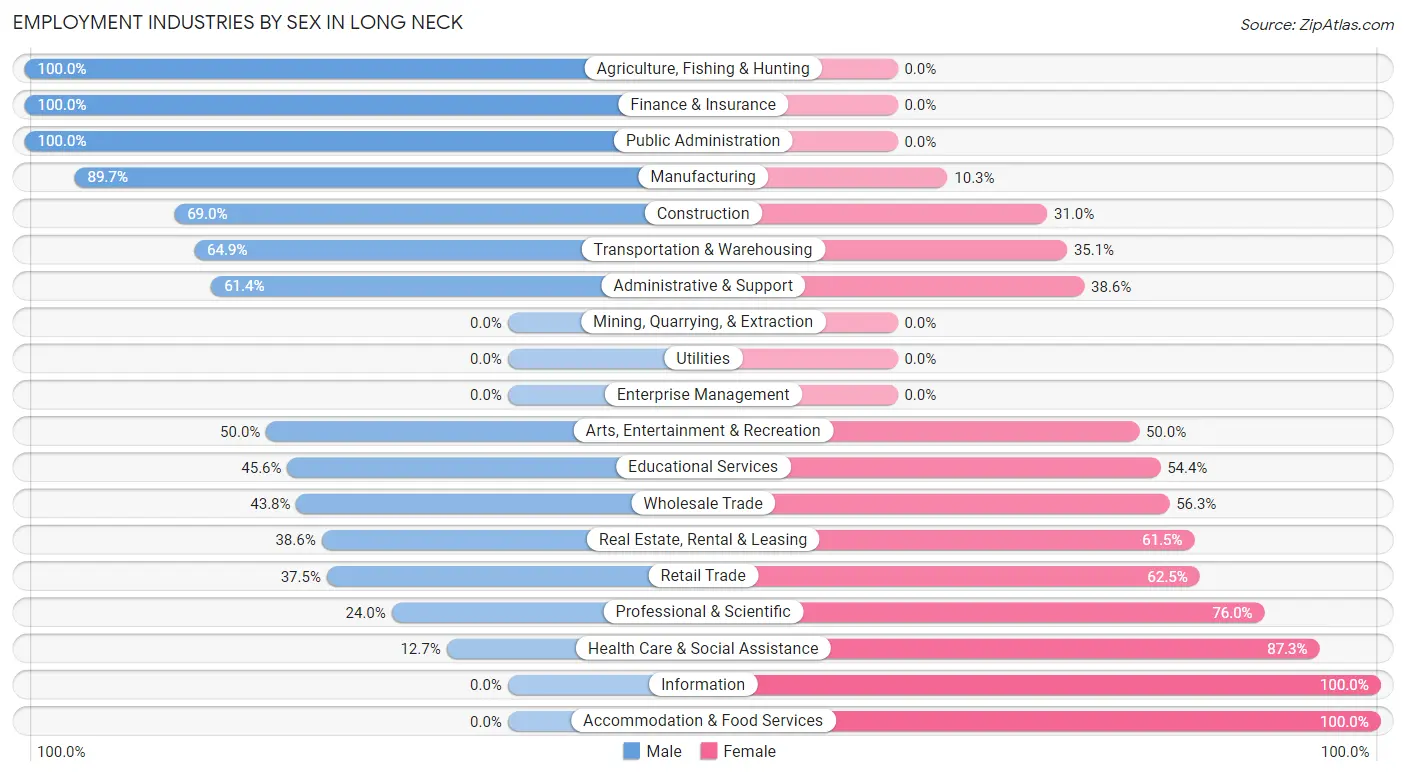
| Industry | Male | Female |
| Agriculture, Fishing & Hunting | 26 (100.0%) | 0 (0.0%) |
| Mining, Quarrying, & Extraction | 0 (0.0%) | 0 (0.0%) |
| Construction | 127 (69.0%) | 57 (31.0%) |
| Manufacturing | 52 (89.7%) | 6 (10.3%) |
| Wholesale Trade | 14 (43.8%) | 18 (56.2%) |
| Retail Trade | 127 (37.5%) | 212 (62.5%) |
| Transportation & Warehousing | 37 (64.9%) | 20 (35.1%) |
| Utilities | 0 (0.0%) | 0 (0.0%) |
| Information | 0 (0.0%) | 10 (100.0%) |
| Finance & Insurance | 6 (100.0%) | 0 (0.0%) |
| Real Estate, Rental & Leasing | 32 (38.6%) | 51 (61.5%) |
| Professional & Scientific | 25 (24.0%) | 79 (76.0%) |
| Enterprise Management | 0 (0.0%) | 0 (0.0%) |
| Administrative & Support | 27 (61.4%) | 17 (38.6%) |
| Educational Services | 26 (45.6%) | 31 (54.4%) |
| Health Care & Social Assistance | 18 (12.7%) | 124 (87.3%) |
| Arts, Entertainment & Recreation | 11 (50.0%) | 11 (50.0%) |
| Accommodation & Food Services | 0 (0.0%) | 112 (100.0%) |
| Public Administration | 20 (100.0%) | 0 (0.0%) |
| Total | 564 (42.6%) | 760 (57.4%) |
Education in Long Neck
School Enrollment in Long Neck
The most common levels of schooling among the 336 students in Long Neck are high school (122 | 36.3%), middle school (81 | 24.1%), and elementary school (67 | 19.9%).
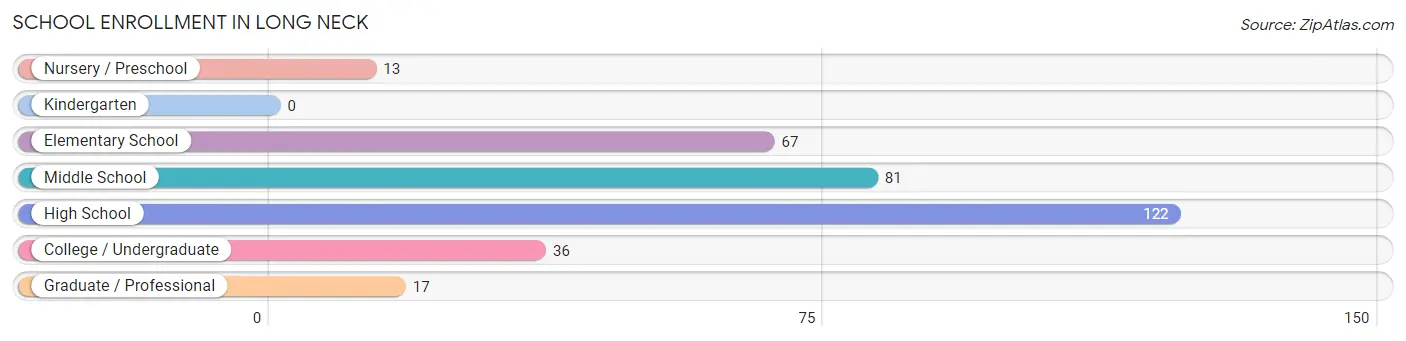
| School Level | # Students | % Students |
| Nursery / Preschool | 13 | 3.9% |
| Kindergarten | 0 | 0.0% |
| Elementary School | 67 | 19.9% |
| Middle School | 81 | 24.1% |
| High School | 122 | 36.3% |
| College / Undergraduate | 36 | 10.7% |
| Graduate / Professional | 17 | 5.1% |
| Total | 336 | 100.0% |
School Enrollment by Age by Funding Source in Long Neck
Out of a total of 336 students who are enrolled in schools in Long Neck, 73 (21.7%) attend a private institution, while the remaining 263 (78.3%) are enrolled in public schools. The age group of 15 to 17 year olds has the highest likelihood of being enrolled in private schools, with 41 (35.3% in the age bracket) enrolled. Conversely, the age group of 5 to 9 year old has the lowest likelihood of being enrolled in a private school, with 80 (100.0% in the age bracket) attending a public institution.
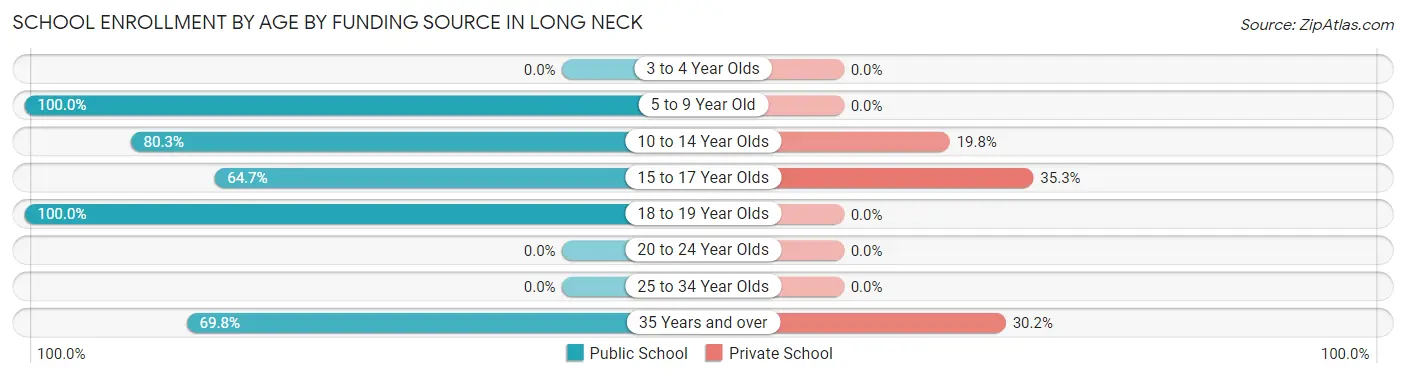
| Age Bracket | Public School | Private School |
| 3 to 4 Year Olds | 0 (0.0%) | 0 (0.0%) |
| 5 to 9 Year Old | 80 (100.0%) | 0 (0.0%) |
| 10 to 14 Year Olds | 65 (80.2%) | 16 (19.8%) |
| 15 to 17 Year Olds | 75 (64.7%) | 41 (35.3%) |
| 18 to 19 Year Olds | 6 (100.0%) | 0 (0.0%) |
| 20 to 24 Year Olds | 0 (0.0%) | 0 (0.0%) |
| 25 to 34 Year Olds | 0 (0.0%) | 0 (0.0%) |
| 35 Years and over | 37 (69.8%) | 16 (30.2%) |
| Total | 263 (78.3%) | 73 (21.7%) |
Educational Attainment by Field of Study in Long Neck
Science & technology (100 | 22.0%), psychology (88 | 19.4%), business (83 | 18.3%), education (78 | 17.2%), and literature & languages (25 | 5.5%) are the most common fields of study among 454 individuals in Long Neck who have obtained a bachelor's degree or higher.
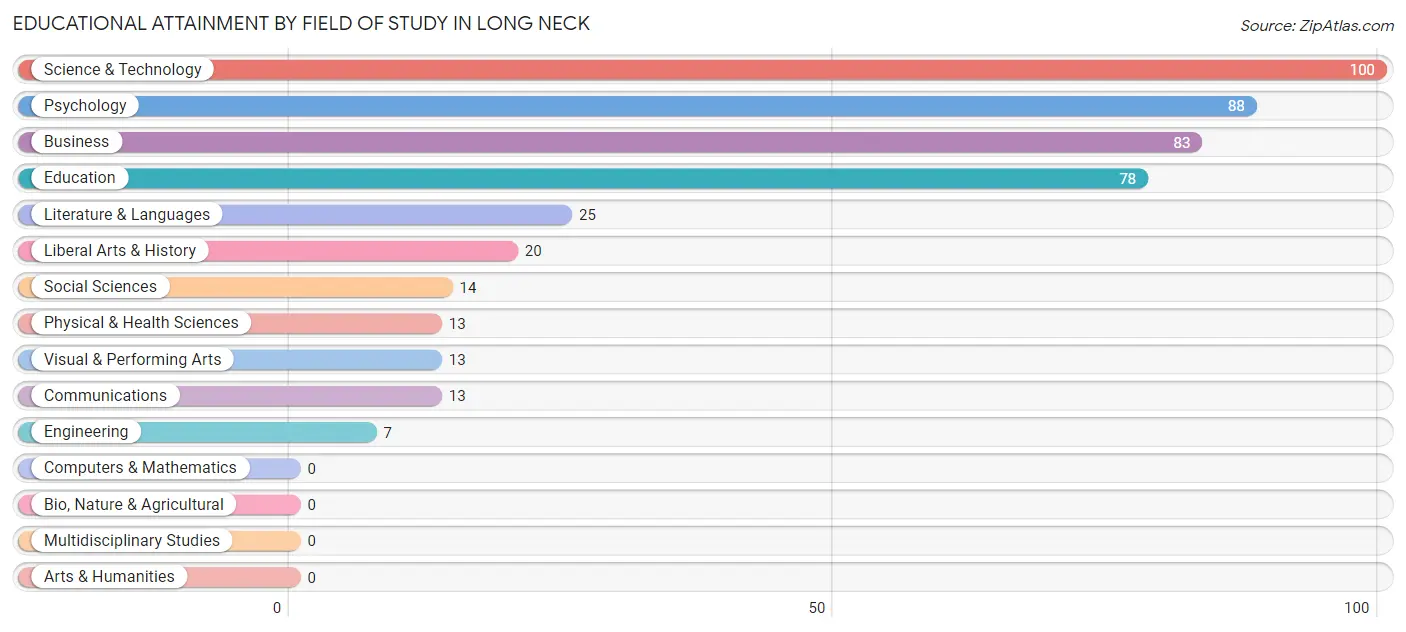
| Field of Study | # Graduates | % Graduates |
| Computers & Mathematics | 0 | 0.0% |
| Bio, Nature & Agricultural | 0 | 0.0% |
| Physical & Health Sciences | 13 | 2.9% |
| Psychology | 88 | 19.4% |
| Social Sciences | 14 | 3.1% |
| Engineering | 7 | 1.5% |
| Multidisciplinary Studies | 0 | 0.0% |
| Science & Technology | 100 | 22.0% |
| Business | 83 | 18.3% |
| Education | 78 | 17.2% |
| Literature & Languages | 25 | 5.5% |
| Liberal Arts & History | 20 | 4.4% |
| Visual & Performing Arts | 13 | 2.9% |
| Communications | 13 | 2.9% |
| Arts & Humanities | 0 | 0.0% |
| Total | 454 | 100.0% |
Transportation & Commute in Long Neck
Vehicle Availability by Sex in Long Neck
The most prevalent vehicle ownership categories in Long Neck are males with 2 vehicles (303, accounting for 54.3%) and females with 2 vehicles (350, making up 40.2%).
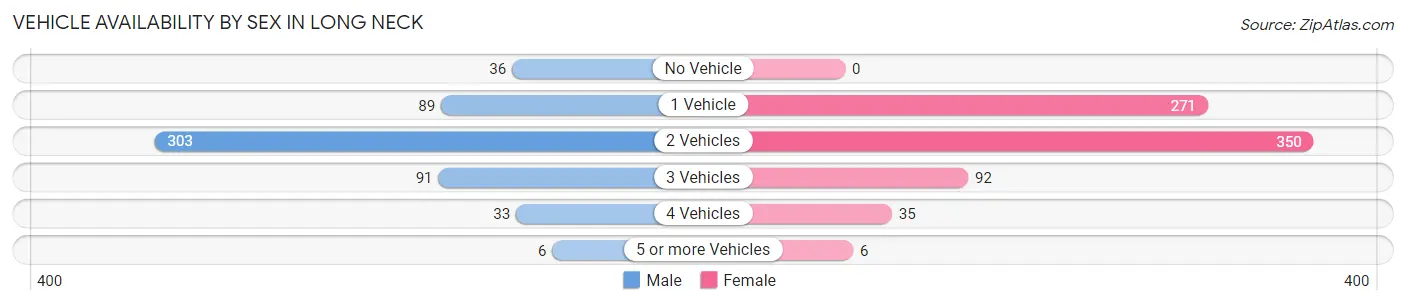
| Vehicles Available | Male | Female |
| No Vehicle | 36 (6.5%) | 0 (0.0%) |
| 1 Vehicle | 89 (16.0%) | 271 (35.9%) |
| 2 Vehicles | 303 (54.3%) | 350 (46.4%) |
| 3 Vehicles | 91 (16.3%) | 92 (12.2%) |
| 4 Vehicles | 33 (5.9%) | 35 (4.6%) |
| 5 or more Vehicles | 6 (1.1%) | 6 (0.8%) |
| Total | 558 (100.0%) | 754 (100.0%) |
Commute Time in Long Neck
The most frequently occuring commute durations in Long Neck are 5 to 9 minutes (181 commuters, 15.2%), 45 to 59 minutes (161 commuters, 13.5%), and 30 to 34 minutes (151 commuters, 12.7%).
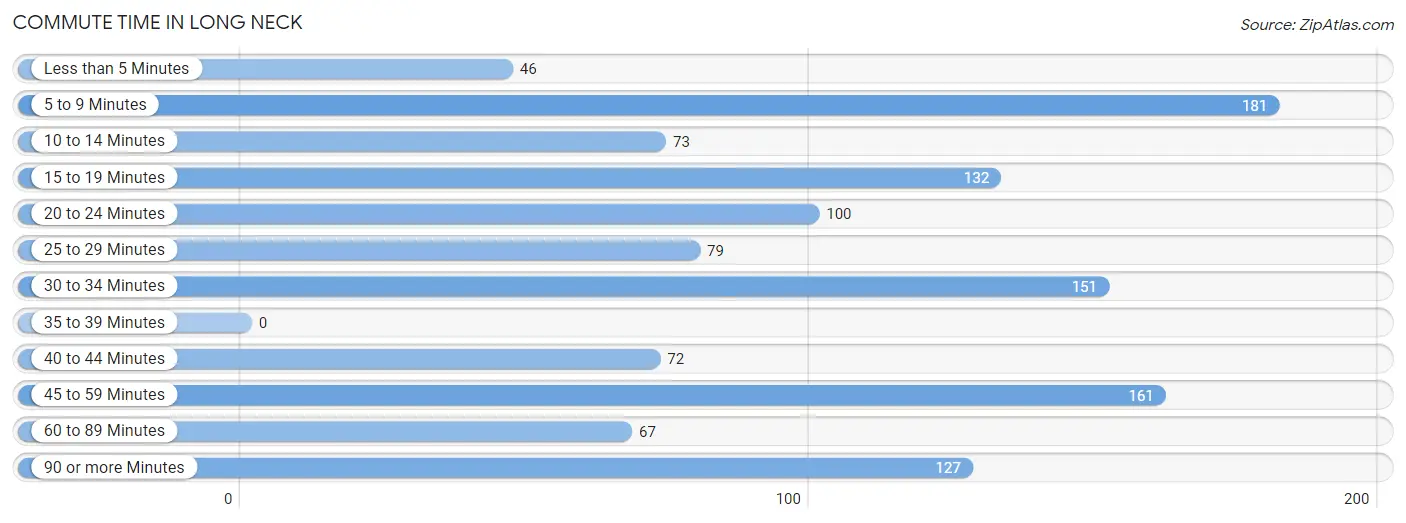
| Commute Time | # Commuters | % Commuters |
| Less than 5 Minutes | 46 | 3.9% |
| 5 to 9 Minutes | 181 | 15.2% |
| 10 to 14 Minutes | 73 | 6.1% |
| 15 to 19 Minutes | 132 | 11.1% |
| 20 to 24 Minutes | 100 | 8.4% |
| 25 to 29 Minutes | 79 | 6.6% |
| 30 to 34 Minutes | 151 | 12.7% |
| 35 to 39 Minutes | 0 | 0.0% |
| 40 to 44 Minutes | 72 | 6.1% |
| 45 to 59 Minutes | 161 | 13.5% |
| 60 to 89 Minutes | 67 | 5.6% |
| 90 or more Minutes | 127 | 10.7% |
Commute Time by Sex in Long Neck
The most common commute times in Long Neck are 90 or more minutes (114 commuters, 21.4%) for males and 15 to 19 minutes (126 commuters, 19.2%) for females.
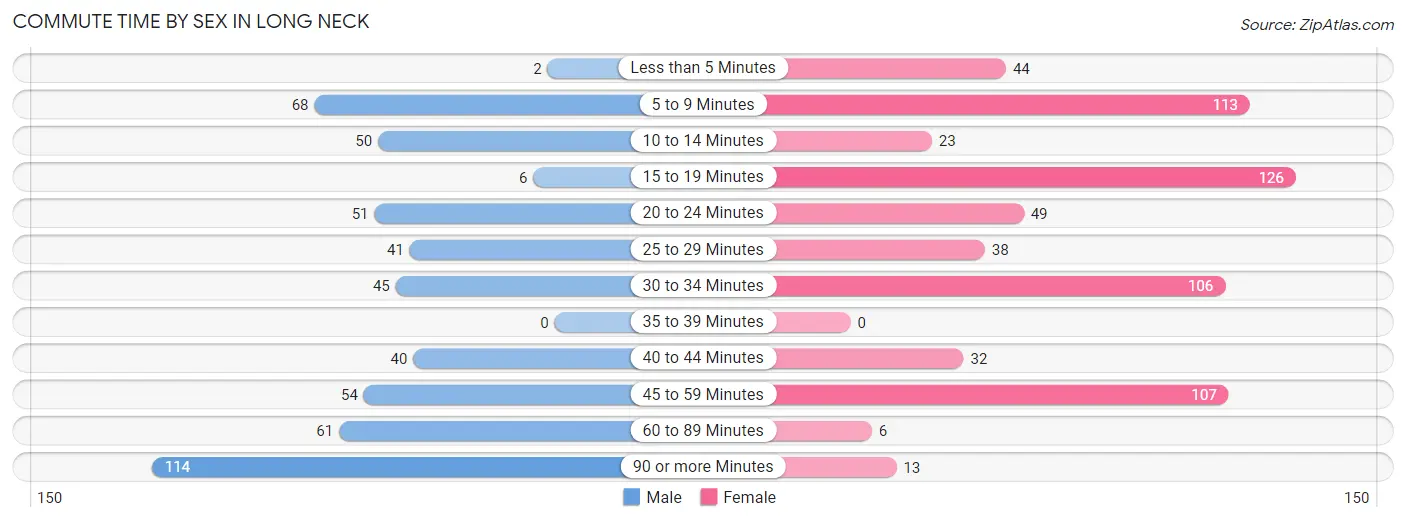
| Commute Time | Male | Female |
| Less than 5 Minutes | 2 (0.4%) | 44 (6.7%) |
| 5 to 9 Minutes | 68 (12.8%) | 113 (17.2%) |
| 10 to 14 Minutes | 50 (9.4%) | 23 (3.5%) |
| 15 to 19 Minutes | 6 (1.1%) | 126 (19.2%) |
| 20 to 24 Minutes | 51 (9.6%) | 49 (7.5%) |
| 25 to 29 Minutes | 41 (7.7%) | 38 (5.8%) |
| 30 to 34 Minutes | 45 (8.5%) | 106 (16.1%) |
| 35 to 39 Minutes | 0 (0.0%) | 0 (0.0%) |
| 40 to 44 Minutes | 40 (7.5%) | 32 (4.9%) |
| 45 to 59 Minutes | 54 (10.2%) | 107 (16.3%) |
| 60 to 89 Minutes | 61 (11.5%) | 6 (0.9%) |
| 90 or more Minutes | 114 (21.4%) | 13 (2.0%) |
Time of Departure to Work by Sex in Long Neck
The most frequent times of departure to work in Long Neck are 7:00 AM to 7:29 AM (109, 20.5%) for males and 6:30 AM to 6:59 AM (141, 21.5%) for females.
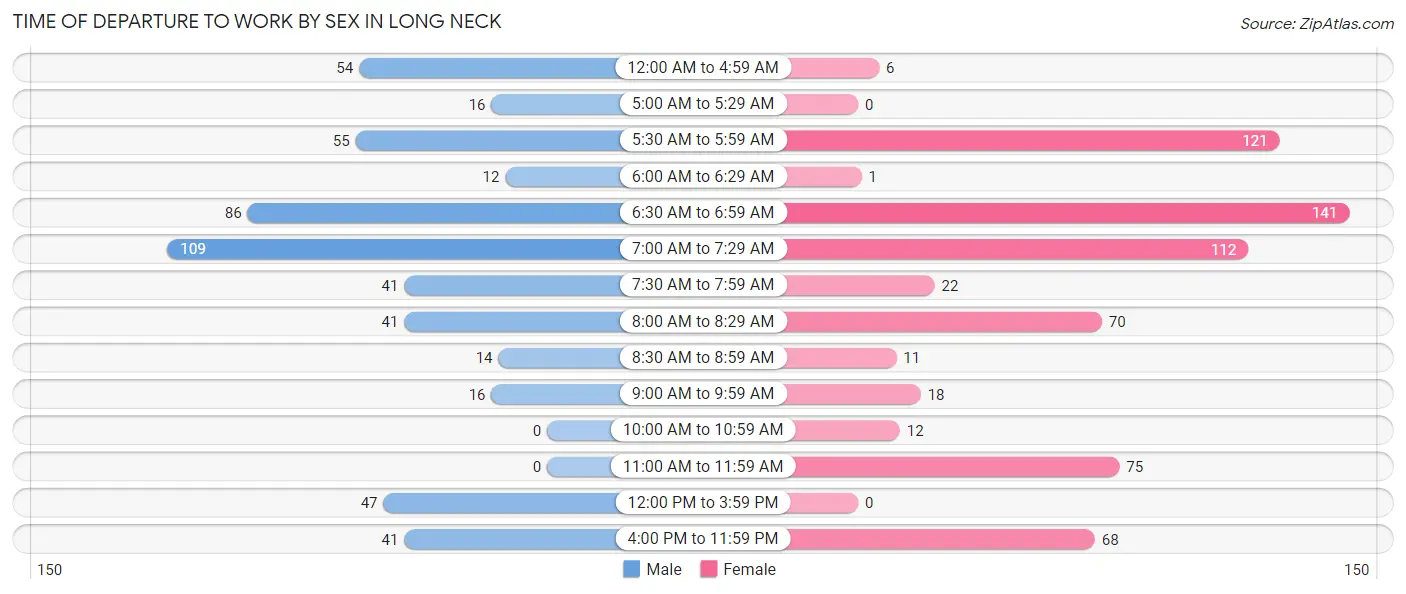
| Time of Departure | Male | Female |
| 12:00 AM to 4:59 AM | 54 (10.2%) | 6 (0.9%) |
| 5:00 AM to 5:29 AM | 16 (3.0%) | 0 (0.0%) |
| 5:30 AM to 5:59 AM | 55 (10.3%) | 121 (18.4%) |
| 6:00 AM to 6:29 AM | 12 (2.3%) | 1 (0.2%) |
| 6:30 AM to 6:59 AM | 86 (16.2%) | 141 (21.5%) |
| 7:00 AM to 7:29 AM | 109 (20.5%) | 112 (17.1%) |
| 7:30 AM to 7:59 AM | 41 (7.7%) | 22 (3.4%) |
| 8:00 AM to 8:29 AM | 41 (7.7%) | 70 (10.6%) |
| 8:30 AM to 8:59 AM | 14 (2.6%) | 11 (1.7%) |
| 9:00 AM to 9:59 AM | 16 (3.0%) | 18 (2.7%) |
| 10:00 AM to 10:59 AM | 0 (0.0%) | 12 (1.8%) |
| 11:00 AM to 11:59 AM | 0 (0.0%) | 75 (11.4%) |
| 12:00 PM to 3:59 PM | 47 (8.8%) | 0 (0.0%) |
| 4:00 PM to 11:59 PM | 41 (7.7%) | 68 (10.3%) |
| Total | 532 (100.0%) | 657 (100.0%) |
Housing Occupancy in Long Neck
Occupancy by Ownership in Long Neck
Of the total 1,579 dwellings in Long Neck, owner-occupied units account for 1,365 (86.5%), while renter-occupied units make up 214 (13.6%).
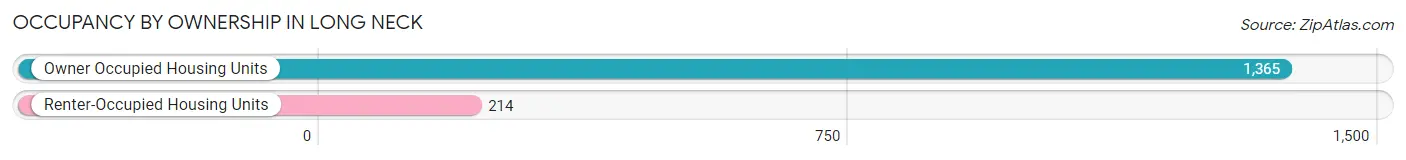
| Occupancy | # Housing Units | % Housing Units |
| Owner Occupied Housing Units | 1,365 | 86.5% |
| Renter-Occupied Housing Units | 214 | 13.6% |
| Total Occupied Housing Units | 1,579 | 100.0% |
Occupancy by Household Size in Long Neck
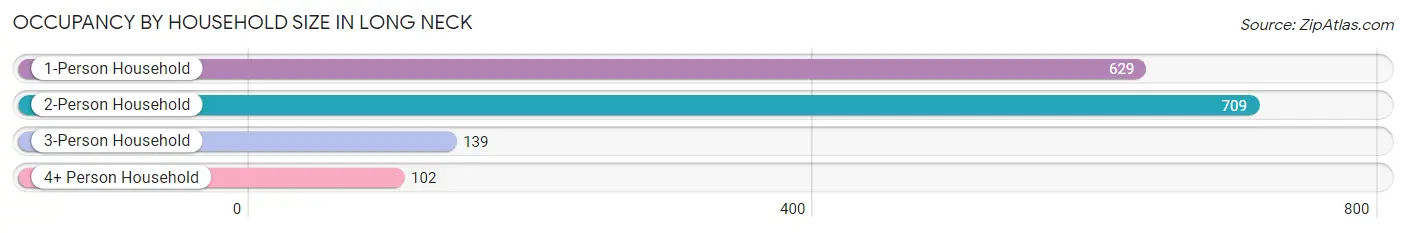
| Household Size | # Housing Units | % Housing Units |
| 1-Person Household | 629 | 39.8% |
| 2-Person Household | 709 | 44.9% |
| 3-Person Household | 139 | 8.8% |
| 4+ Person Household | 102 | 6.5% |
| Total Housing Units | 1,579 | 100.0% |
Occupancy by Ownership by Household Size in Long Neck
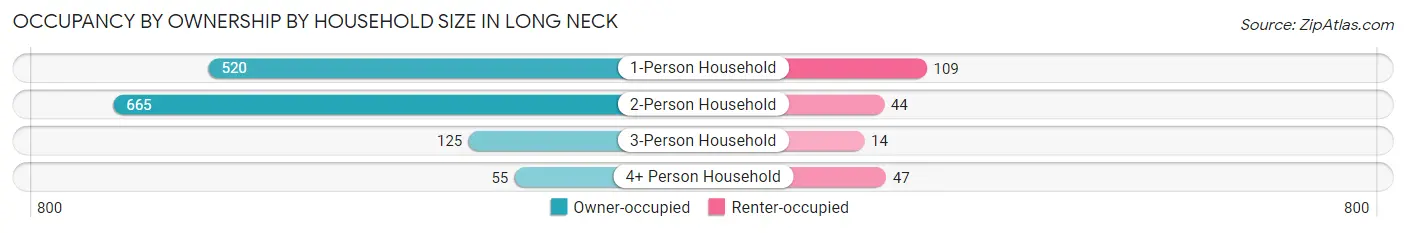
| Household Size | Owner-occupied | Renter-occupied |
| 1-Person Household | 520 (82.7%) | 109 (17.3%) |
| 2-Person Household | 665 (93.8%) | 44 (6.2%) |
| 3-Person Household | 125 (89.9%) | 14 (10.1%) |
| 4+ Person Household | 55 (53.9%) | 47 (46.1%) |
| Total Housing Units | 1,365 (86.5%) | 214 (13.6%) |
Occupancy by Educational Attainment in Long Neck
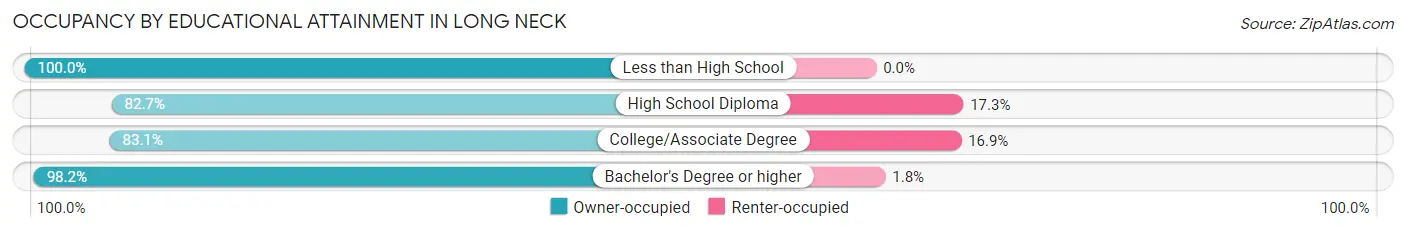
| Household Size | Owner-occupied | Renter-occupied |
| Less than High School | 31 (100.0%) | 0 (0.0%) |
| High School Diploma | 513 (82.7%) | 107 (17.3%) |
| College/Associate Degree | 498 (83.1%) | 101 (16.9%) |
| Bachelor's Degree or higher | 323 (98.2%) | 6 (1.8%) |
Occupancy by Age of Householder in Long Neck
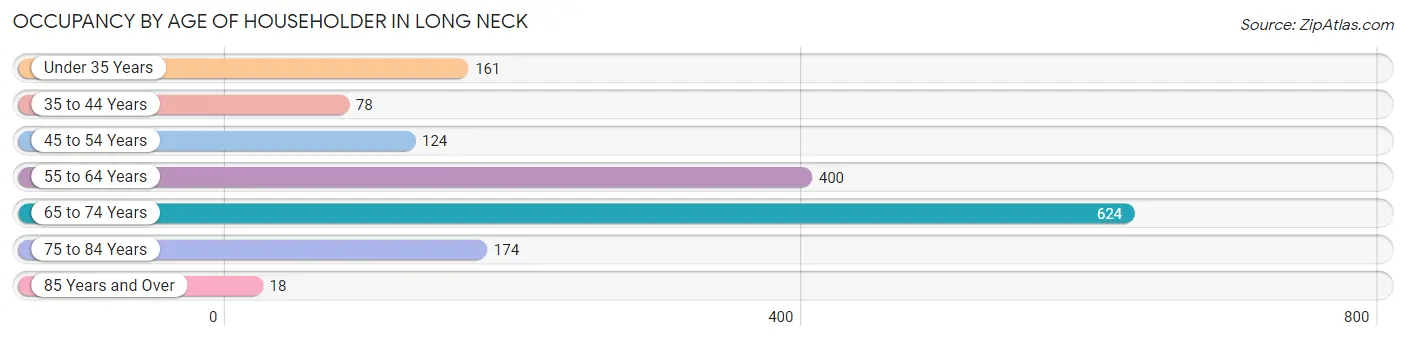
| Age Bracket | # Households | % Households |
| Under 35 Years | 161 | 10.2% |
| 35 to 44 Years | 78 | 4.9% |
| 45 to 54 Years | 124 | 7.9% |
| 55 to 64 Years | 400 | 25.3% |
| 65 to 74 Years | 624 | 39.5% |
| 75 to 84 Years | 174 | 11.0% |
| 85 Years and Over | 18 | 1.1% |
| Total | 1,579 | 100.0% |
Housing Finances in Long Neck
Median Income by Occupancy in Long Neck
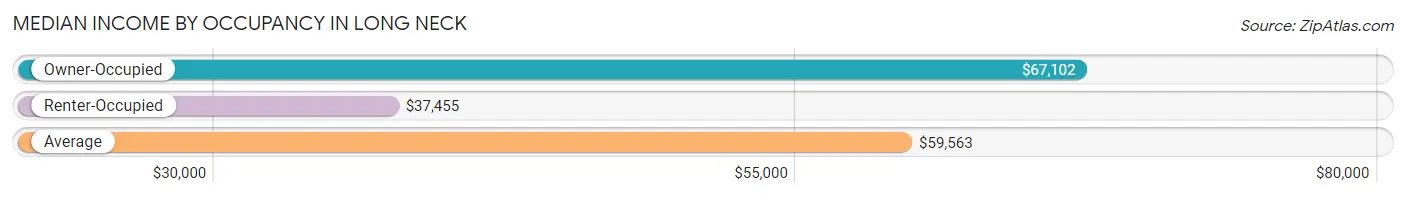
| Occupancy Type | # Households | Median Income |
| Owner-Occupied | 1,365 (86.5%) | $67,102 |
| Renter-Occupied | 214 (13.6%) | $37,455 |
| Average | 1,579 (100.0%) | $59,563 |
Occupancy by Householder Income Bracket in Long Neck
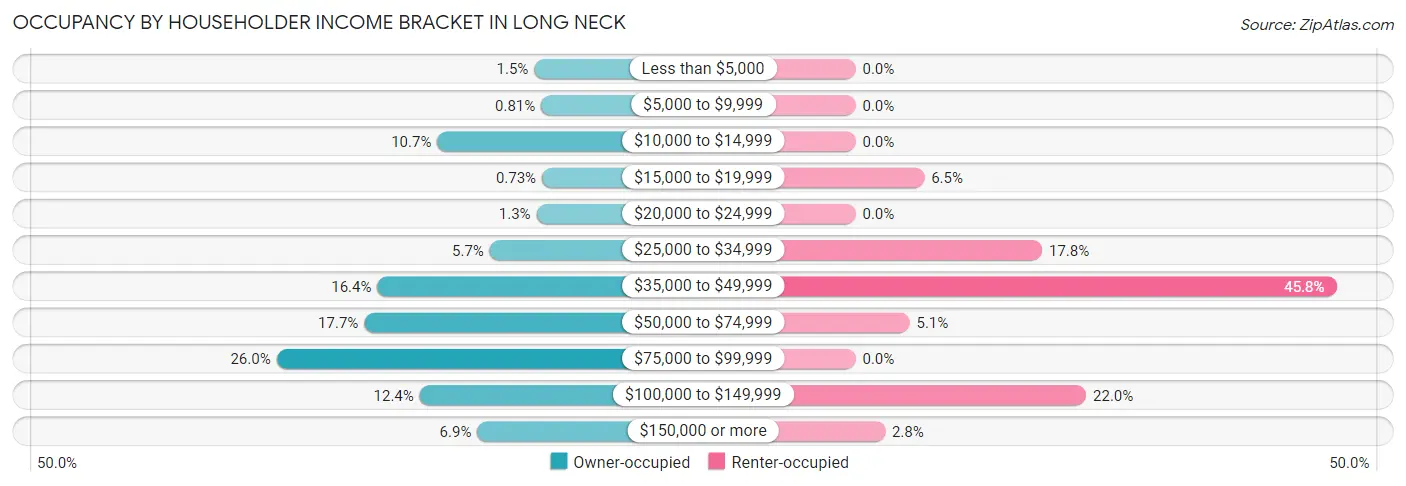
| Income Bracket | Owner-occupied | Renter-occupied |
| Less than $5,000 | 20 (1.5%) | 0 (0.0%) |
| $5,000 to $9,999 | 11 (0.8%) | 0 (0.0%) |
| $10,000 to $14,999 | 146 (10.7%) | 0 (0.0%) |
| $15,000 to $19,999 | 10 (0.7%) | 14 (6.5%) |
| $20,000 to $24,999 | 17 (1.3%) | 0 (0.0%) |
| $25,000 to $34,999 | 78 (5.7%) | 38 (17.8%) |
| $35,000 to $49,999 | 224 (16.4%) | 98 (45.8%) |
| $50,000 to $74,999 | 241 (17.7%) | 11 (5.1%) |
| $75,000 to $99,999 | 355 (26.0%) | 0 (0.0%) |
| $100,000 to $149,999 | 169 (12.4%) | 47 (22.0%) |
| $150,000 or more | 94 (6.9%) | 6 (2.8%) |
| Total | 1,365 (100.0%) | 214 (100.0%) |
Monthly Housing Cost Tiers in Long Neck
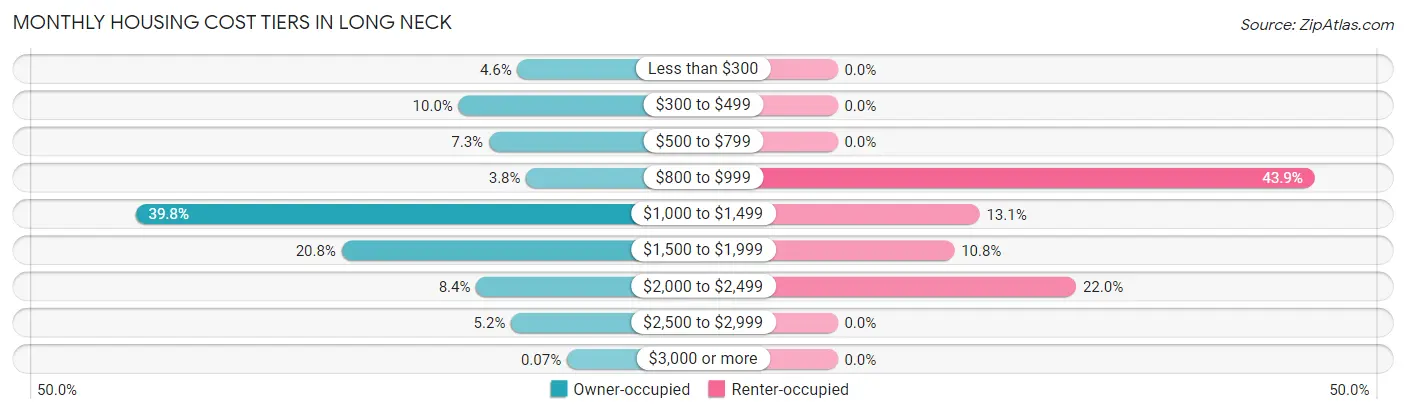
| Monthly Cost | Owner-occupied | Renter-occupied |
| Less than $300 | 63 (4.6%) | 0 (0.0%) |
| $300 to $499 | 137 (10.0%) | 0 (0.0%) |
| $500 to $799 | 99 (7.2%) | 0 (0.0%) |
| $800 to $999 | 52 (3.8%) | 94 (43.9%) |
| $1,000 to $1,499 | 543 (39.8%) | 28 (13.1%) |
| $1,500 to $1,999 | 284 (20.8%) | 23 (10.7%) |
| $2,000 to $2,499 | 115 (8.4%) | 47 (22.0%) |
| $2,500 to $2,999 | 71 (5.2%) | 0 (0.0%) |
| $3,000 or more | 1 (0.1%) | 0 (0.0%) |
| Total | 1,365 (100.0%) | 214 (100.0%) |
Physical Housing Characteristics in Long Neck
Housing Structures in Long Neck
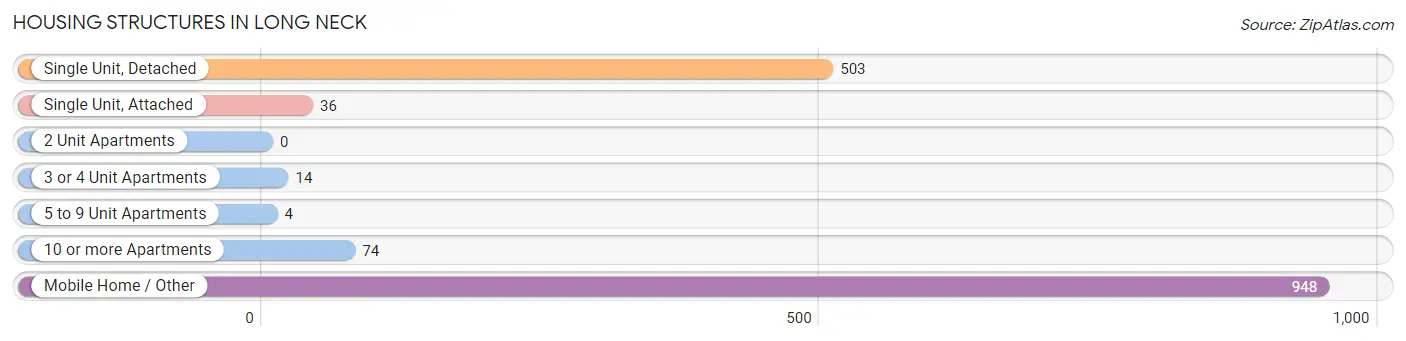
| Structure Type | # Housing Units | % Housing Units |
| Single Unit, Detached | 503 | 31.9% |
| Single Unit, Attached | 36 | 2.3% |
| 2 Unit Apartments | 0 | 0.0% |
| 3 or 4 Unit Apartments | 14 | 0.9% |
| 5 to 9 Unit Apartments | 4 | 0.3% |
| 10 or more Apartments | 74 | 4.7% |
| Mobile Home / Other | 948 | 60.0% |
| Total | 1,579 | 100.0% |
Housing Structures by Occupancy in Long Neck
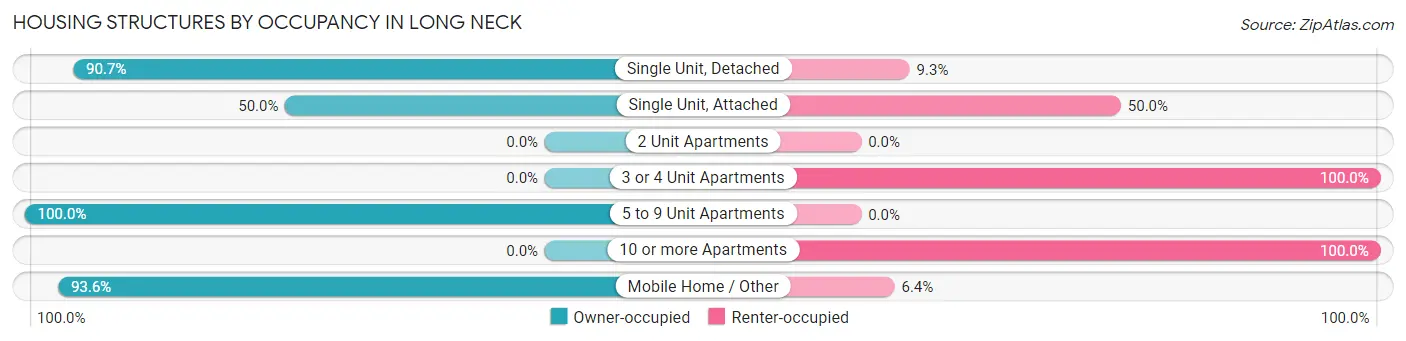
| Structure Type | Owner-occupied | Renter-occupied |
| Single Unit, Detached | 456 (90.7%) | 47 (9.3%) |
| Single Unit, Attached | 18 (50.0%) | 18 (50.0%) |
| 2 Unit Apartments | 0 (0.0%) | 0 (0.0%) |
| 3 or 4 Unit Apartments | 0 (0.0%) | 14 (100.0%) |
| 5 to 9 Unit Apartments | 4 (100.0%) | 0 (0.0%) |
| 10 or more Apartments | 0 (0.0%) | 74 (100.0%) |
| Mobile Home / Other | 887 (93.6%) | 61 (6.4%) |
| Total | 1,365 (86.5%) | 214 (13.6%) |
Housing Structures by Number of Rooms in Long Neck
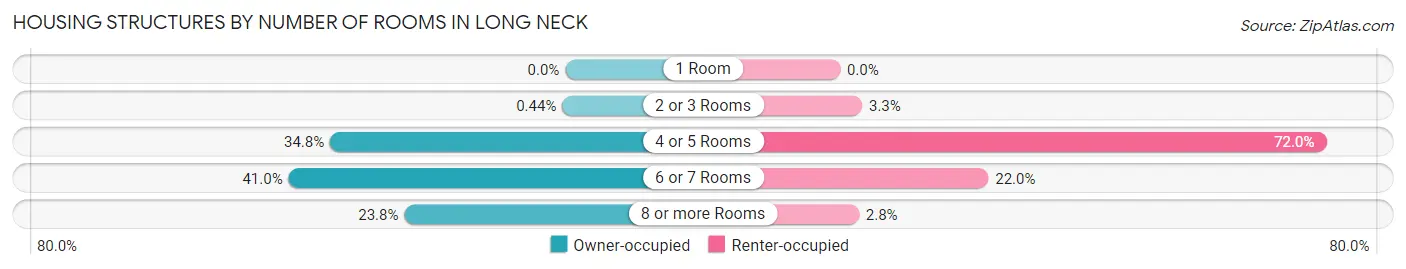
| Number of Rooms | Owner-occupied | Renter-occupied |
| 1 Room | 0 (0.0%) | 0 (0.0%) |
| 2 or 3 Rooms | 6 (0.4%) | 7 (3.3%) |
| 4 or 5 Rooms | 475 (34.8%) | 154 (72.0%) |
| 6 or 7 Rooms | 559 (40.9%) | 47 (22.0%) |
| 8 or more Rooms | 325 (23.8%) | 6 (2.8%) |
| Total | 1,365 (100.0%) | 214 (100.0%) |
Housing Structure by Heating Type in Long Neck
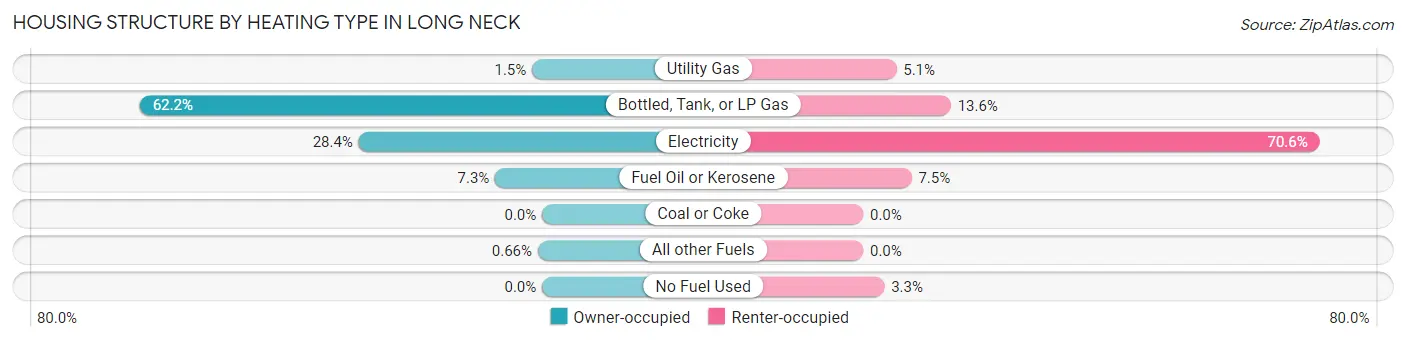
| Heating Type | Owner-occupied | Renter-occupied |
| Utility Gas | 21 (1.5%) | 11 (5.1%) |
| Bottled, Tank, or LP Gas | 849 (62.2%) | 29 (13.6%) |
| Electricity | 387 (28.3%) | 151 (70.6%) |
| Fuel Oil or Kerosene | 99 (7.2%) | 16 (7.5%) |
| Coal or Coke | 0 (0.0%) | 0 (0.0%) |
| All other Fuels | 9 (0.7%) | 0 (0.0%) |
| No Fuel Used | 0 (0.0%) | 7 (3.3%) |
| Total | 1,365 (100.0%) | 214 (100.0%) |
Household Vehicle Usage in Long Neck
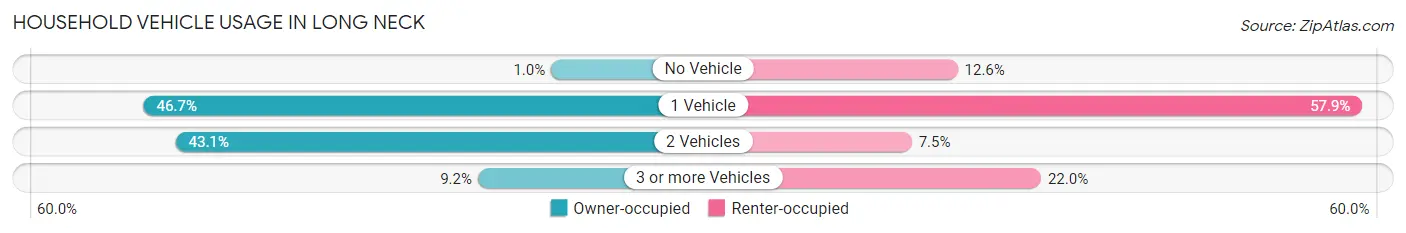
| Vehicles per Household | Owner-occupied | Renter-occupied |
| No Vehicle | 14 (1.0%) | 27 (12.6%) |
| 1 Vehicle | 637 (46.7%) | 124 (57.9%) |
| 2 Vehicles | 588 (43.1%) | 16 (7.5%) |
| 3 or more Vehicles | 126 (9.2%) | 47 (22.0%) |
| Total | 1,365 (100.0%) | 214 (100.0%) |
Real Estate & Mortgages in Long Neck
Real Estate and Mortgage Overview in Long Neck
| Characteristic | Without Mortgage | With Mortgage |
| Housing Units | 882 | 483 |
| Median Property Value | $94,500 | $268,300 |
| Median Household Income | $59,500 | $33 |
| Monthly Housing Costs | $1,252 | $0 |
| Real Estate Taxes | $414 | $80 |
Property Value by Mortgage Status in Long Neck
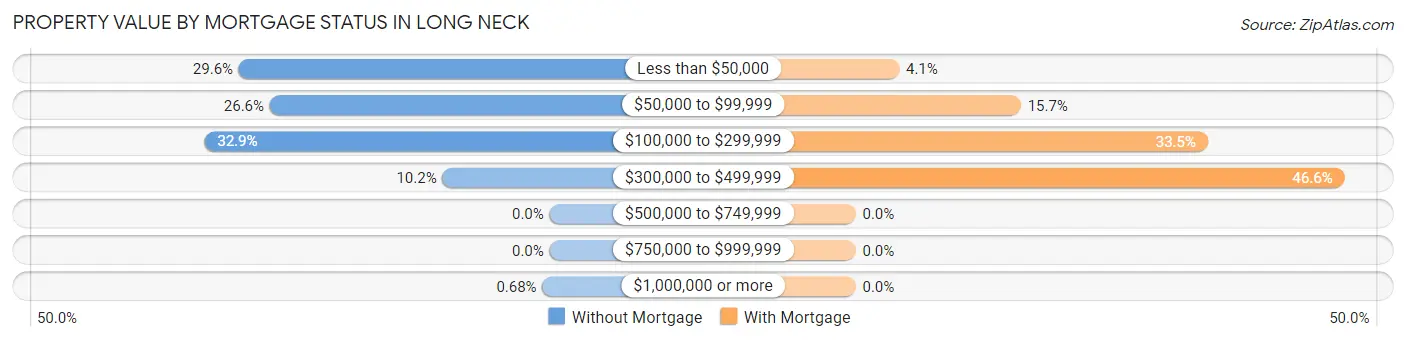
| Property Value | Without Mortgage | With Mortgage |
| Less than $50,000 | 261 (29.6%) | 20 (4.1%) |
| $50,000 to $99,999 | 235 (26.6%) | 76 (15.7%) |
| $100,000 to $299,999 | 290 (32.9%) | 162 (33.5%) |
| $300,000 to $499,999 | 90 (10.2%) | 225 (46.6%) |
| $500,000 to $749,999 | 0 (0.0%) | 0 (0.0%) |
| $750,000 to $999,999 | 0 (0.0%) | 0 (0.0%) |
| $1,000,000 or more | 6 (0.7%) | 0 (0.0%) |
| Total | 882 (100.0%) | 483 (100.0%) |
Household Income by Mortgage Status in Long Neck
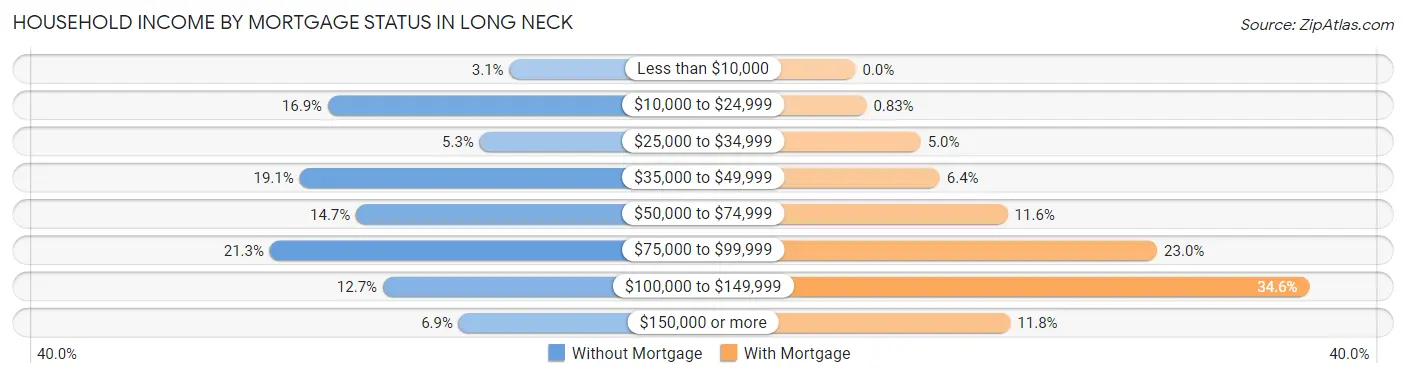
| Household Income | Without Mortgage | With Mortgage |
| Less than $10,000 | 27 (3.1%) | 0 (0.0%) |
| $10,000 to $24,999 | 149 (16.9%) | 4 (0.8%) |
| $25,000 to $34,999 | 47 (5.3%) | 24 (5.0%) |
| $35,000 to $49,999 | 168 (19.1%) | 31 (6.4%) |
| $50,000 to $74,999 | 130 (14.7%) | 56 (11.6%) |
| $75,000 to $99,999 | 188 (21.3%) | 111 (23.0%) |
| $100,000 to $149,999 | 112 (12.7%) | 167 (34.6%) |
| $150,000 or more | 61 (6.9%) | 57 (11.8%) |
| Total | 882 (100.0%) | 483 (100.0%) |
Property Value to Household Income Ratio in Long Neck
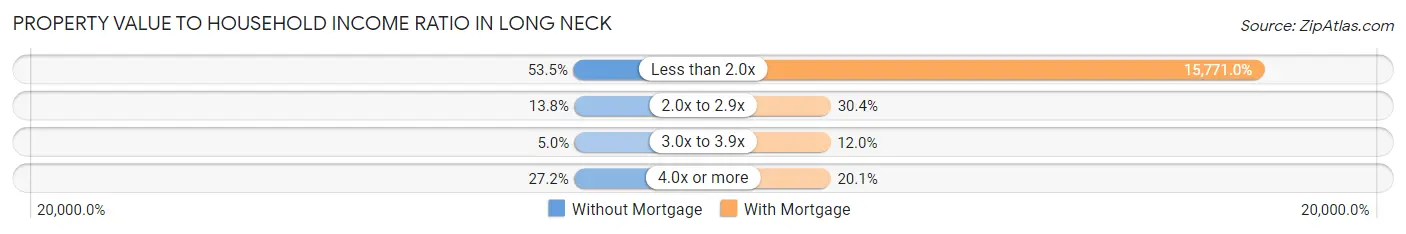
| Value-to-Income Ratio | Without Mortgage | With Mortgage |
| Less than 2.0x | 472 (53.5%) | 76,174 (15,771.0%) |
| 2.0x to 2.9x | 122 (13.8%) | 147 (30.4%) |
| 3.0x to 3.9x | 44 (5.0%) | 58 (12.0%) |
| 4.0x or more | 240 (27.2%) | 97 (20.1%) |
| Total | 882 (100.0%) | 483 (100.0%) |
Real Estate Taxes by Mortgage Status in Long Neck
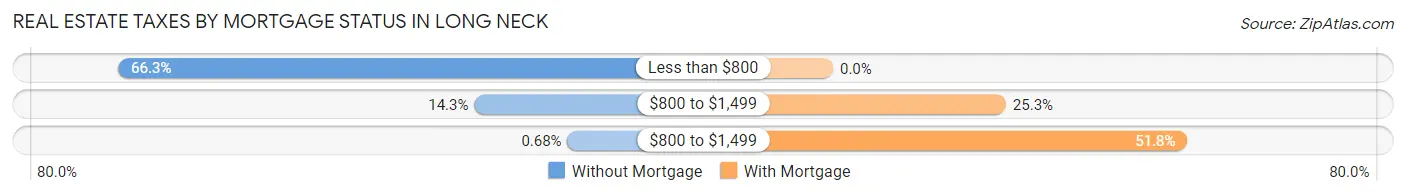
| Property Taxes | Without Mortgage | With Mortgage |
| Less than $800 | 585 (66.3%) | 0 (0.0%) |
| $800 to $1,499 | 126 (14.3%) | 122 (25.3%) |
| $800 to $1,499 | 6 (0.7%) | 250 (51.8%) |
| Total | 882 (100.0%) | 483 (100.0%) |
Health & Disability in Long Neck
Health Insurance Coverage by Age in Long Neck
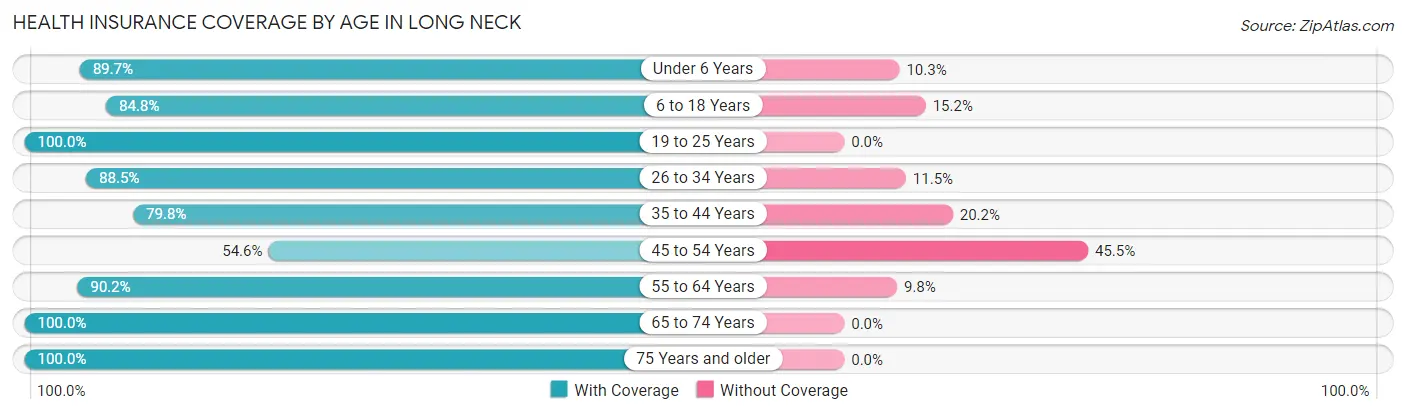
| Age Bracket | With Coverage | Without Coverage |
| Under 6 Years | 61 (89.7%) | 7 (10.3%) |
| 6 to 18 Years | 229 (84.8%) | 41 (15.2%) |
| 19 to 25 Years | 16 (100.0%) | 0 (0.0%) |
| 26 to 34 Years | 231 (88.5%) | 30 (11.5%) |
| 35 to 44 Years | 205 (79.8%) | 52 (20.2%) |
| 45 to 54 Years | 84 (54.5%) | 70 (45.5%) |
| 55 to 64 Years | 633 (90.2%) | 69 (9.8%) |
| 65 to 74 Years | 912 (100.0%) | 0 (0.0%) |
| 75 Years and older | 343 (100.0%) | 0 (0.0%) |
| Total | 2,714 (91.0%) | 269 (9.0%) |
Health Insurance Coverage by Citizenship Status in Long Neck
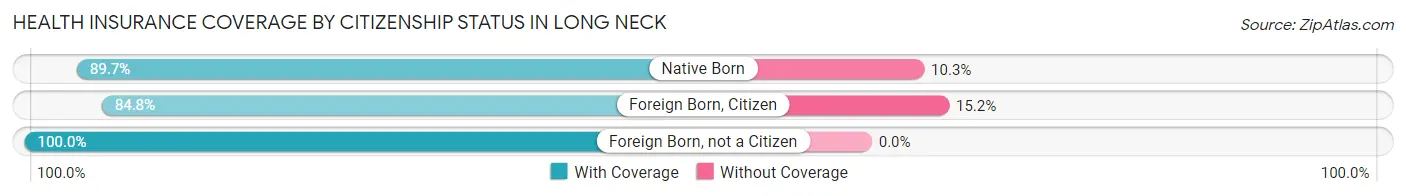
| Citizenship Status | With Coverage | Without Coverage |
| Native Born | 61 (89.7%) | 7 (10.3%) |
| Foreign Born, Citizen | 229 (84.8%) | 41 (15.2%) |
| Foreign Born, not a Citizen | 16 (100.0%) | 0 (0.0%) |
Health Insurance Coverage by Household Income in Long Neck
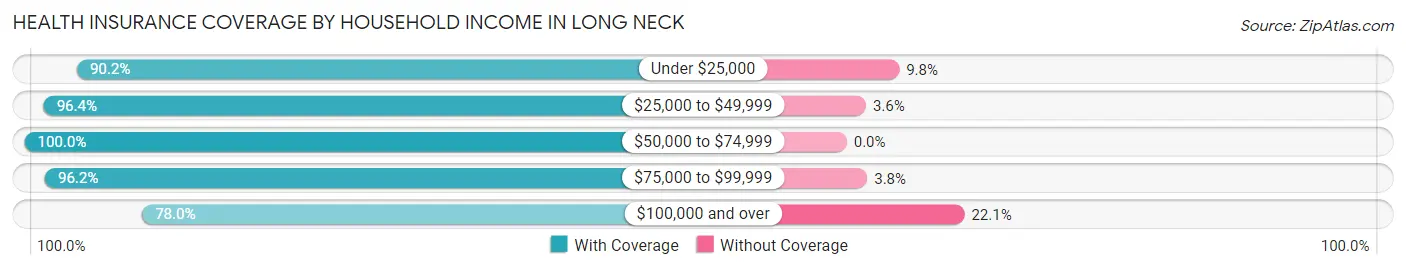
| Household Income | With Coverage | Without Coverage |
| Under $25,000 | 248 (90.2%) | 27 (9.8%) |
| $25,000 to $49,999 | 617 (96.4%) | 23 (3.6%) |
| $50,000 to $74,999 | 429 (100.0%) | 0 (0.0%) |
| $75,000 to $99,999 | 752 (96.2%) | 30 (3.8%) |
| $100,000 and over | 668 (77.9%) | 189 (22.1%) |
Public vs Private Health Insurance Coverage by Age in Long Neck
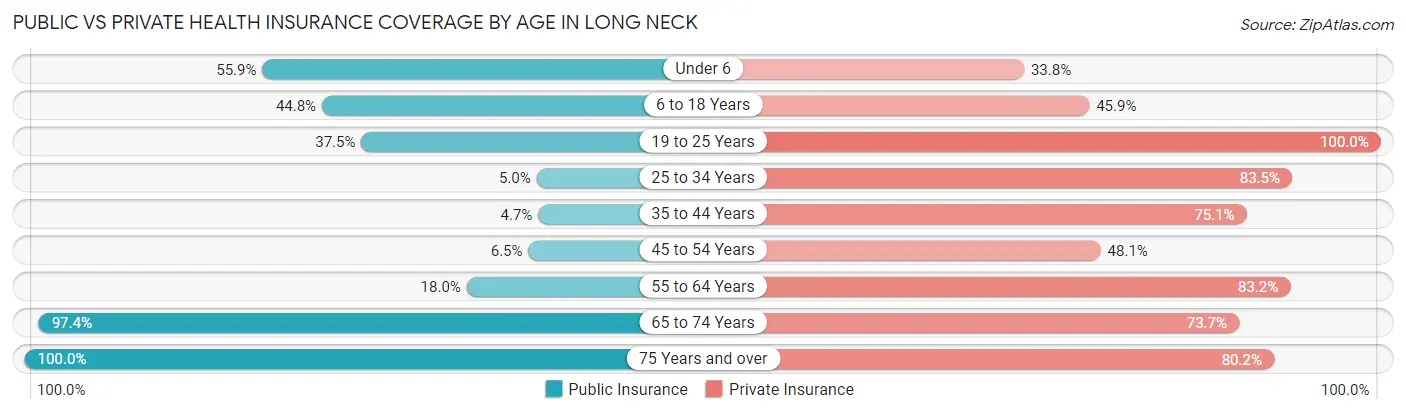
| Age Bracket | Public Insurance | Private Insurance |
| Under 6 | 38 (55.9%) | 23 (33.8%) |
| 6 to 18 Years | 121 (44.8%) | 124 (45.9%) |
| 19 to 25 Years | 6 (37.5%) | 16 (100.0%) |
| 25 to 34 Years | 13 (5.0%) | 218 (83.5%) |
| 35 to 44 Years | 12 (4.7%) | 193 (75.1%) |
| 45 to 54 Years | 10 (6.5%) | 74 (48.0%) |
| 55 to 64 Years | 126 (17.9%) | 584 (83.2%) |
| 65 to 74 Years | 888 (97.4%) | 672 (73.7%) |
| 75 Years and over | 343 (100.0%) | 275 (80.2%) |
| Total | 1,557 (52.2%) | 2,179 (73.1%) |
Disability Status by Sex by Age in Long Neck
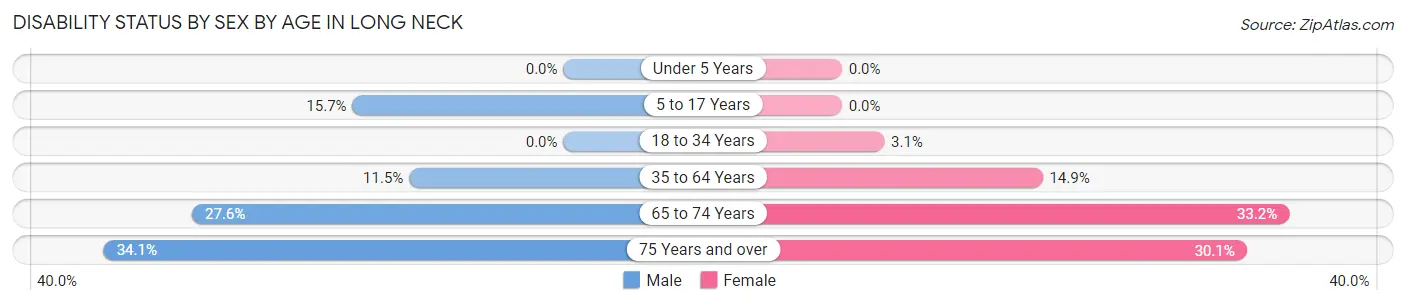
| Age Bracket | Male | Female |
| Under 5 Years | 0 (0.0%) | 0 (0.0%) |
| 5 to 17 Years | 13 (15.7%) | 0 (0.0%) |
| 18 to 34 Years | 0 (0.0%) | 6 (3.1%) |
| 35 to 64 Years | 56 (11.5%) | 93 (14.9%) |
| 65 to 74 Years | 97 (27.6%) | 186 (33.2%) |
| 75 Years and over | 58 (34.1%) | 52 (30.1%) |
Disability Class by Sex by Age in Long Neck
Disability Class: Hearing Difficulty
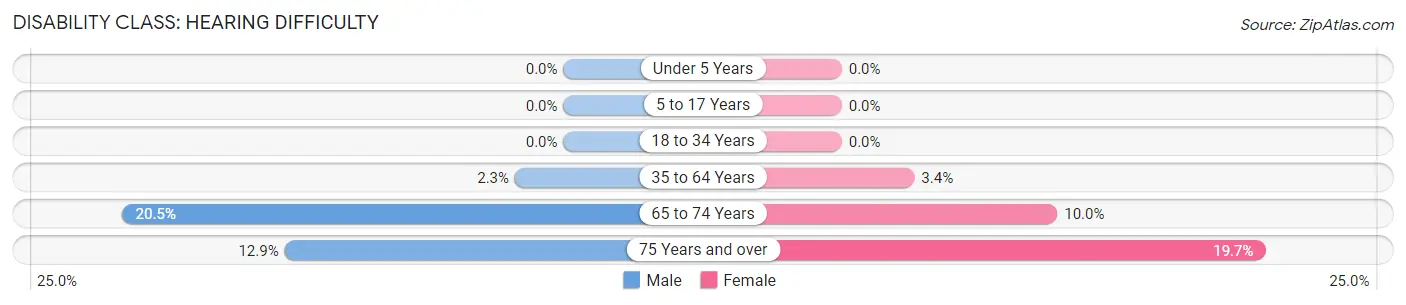
| Age Bracket | Male | Female |
| Under 5 Years | 0 (0.0%) | 0 (0.0%) |
| 5 to 17 Years | 0 (0.0%) | 0 (0.0%) |
| 18 to 34 Years | 0 (0.0%) | 0 (0.0%) |
| 35 to 64 Years | 11 (2.2%) | 21 (3.4%) |
| 65 to 74 Years | 72 (20.4%) | 56 (10.0%) |
| 75 Years and over | 22 (12.9%) | 34 (19.7%) |
Disability Class: Vision Difficulty
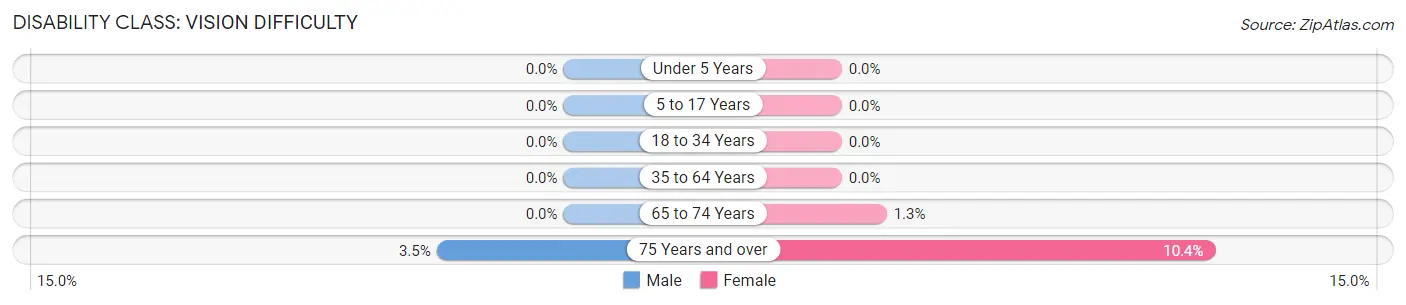
| Age Bracket | Male | Female |
| Under 5 Years | 0 (0.0%) | 0 (0.0%) |
| 5 to 17 Years | 0 (0.0%) | 0 (0.0%) |
| 18 to 34 Years | 0 (0.0%) | 0 (0.0%) |
| 35 to 64 Years | 0 (0.0%) | 0 (0.0%) |
| 65 to 74 Years | 0 (0.0%) | 7 (1.3%) |
| 75 Years and over | 6 (3.5%) | 18 (10.4%) |
Disability Class: Cognitive Difficulty
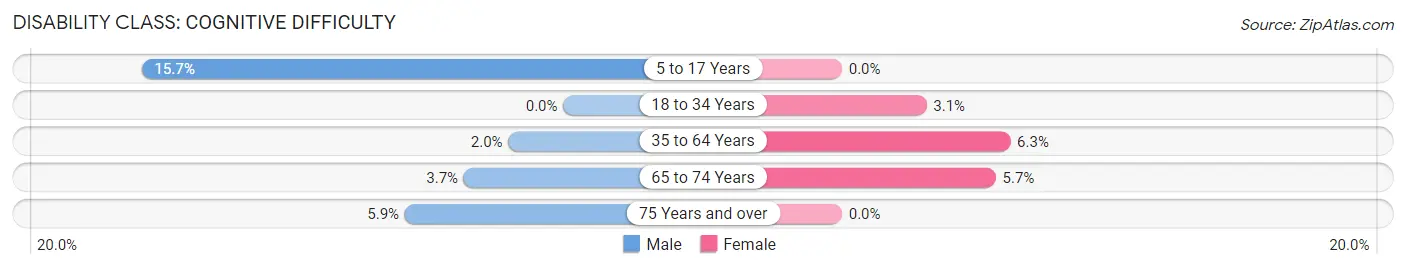
| Age Bracket | Male | Female |
| 5 to 17 Years | 13 (15.7%) | 0 (0.0%) |
| 18 to 34 Years | 0 (0.0%) | 6 (3.1%) |
| 35 to 64 Years | 10 (2.0%) | 39 (6.2%) |
| 65 to 74 Years | 13 (3.7%) | 32 (5.7%) |
| 75 Years and over | 10 (5.9%) | 0 (0.0%) |
Disability Class: Ambulatory Difficulty
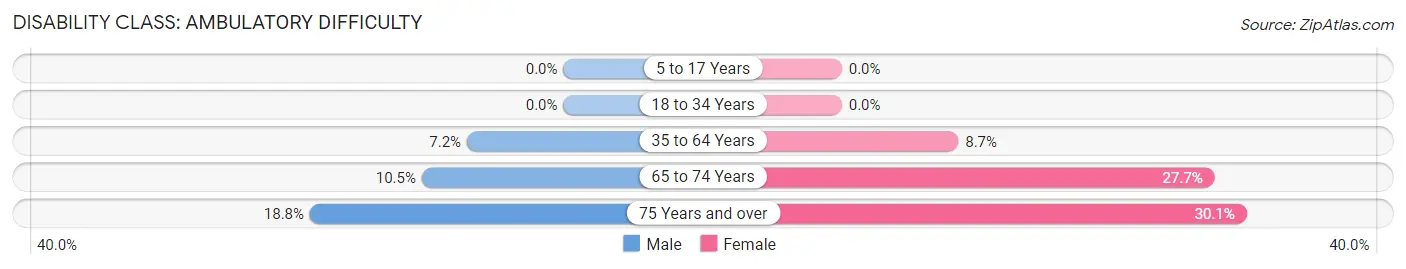
| Age Bracket | Male | Female |
| 5 to 17 Years | 0 (0.0%) | 0 (0.0%) |
| 18 to 34 Years | 0 (0.0%) | 0 (0.0%) |
| 35 to 64 Years | 35 (7.2%) | 54 (8.6%) |
| 65 to 74 Years | 37 (10.5%) | 155 (27.7%) |
| 75 Years and over | 32 (18.8%) | 52 (30.1%) |
Disability Class: Self-Care Difficulty
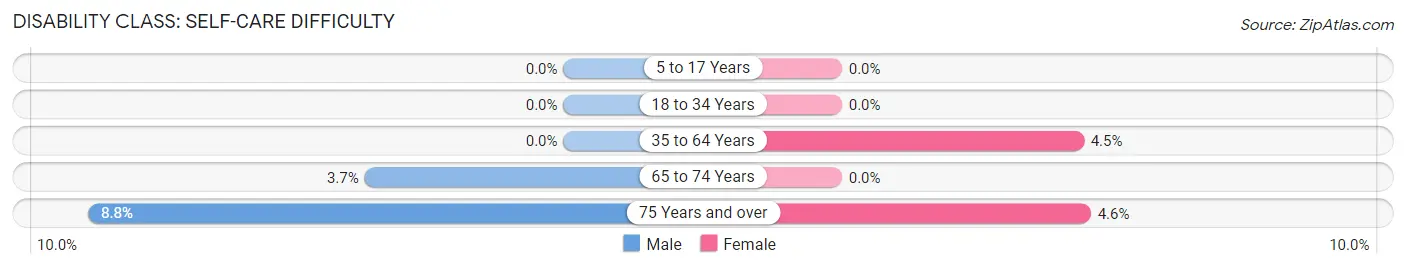
| Age Bracket | Male | Female |
| 5 to 17 Years | 0 (0.0%) | 0 (0.0%) |
| 18 to 34 Years | 0 (0.0%) | 0 (0.0%) |
| 35 to 64 Years | 0 (0.0%) | 28 (4.5%) |
| 65 to 74 Years | 13 (3.7%) | 0 (0.0%) |
| 75 Years and over | 15 (8.8%) | 8 (4.6%) |
Technology Access in Long Neck
Computing Device Access in Long Neck
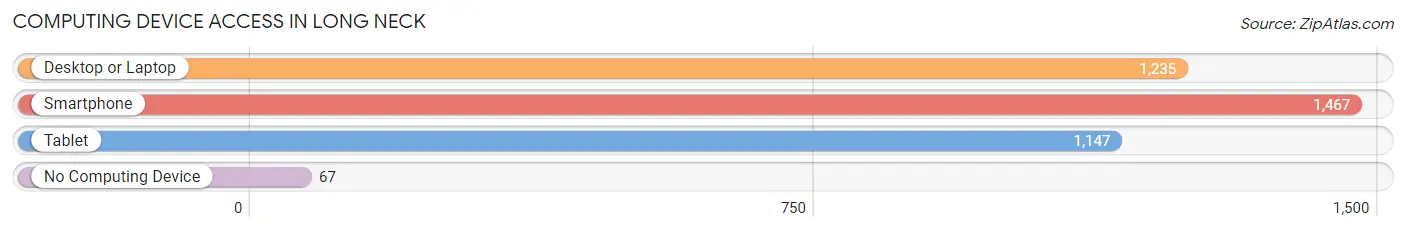
| Device Type | # Households | % Households |
| Desktop or Laptop | 1,235 | 78.2% |
| Smartphone | 1,467 | 92.9% |
| Tablet | 1,147 | 72.6% |
| No Computing Device | 67 | 4.2% |
| Total | 1,579 | 100.0% |
Internet Access in Long Neck
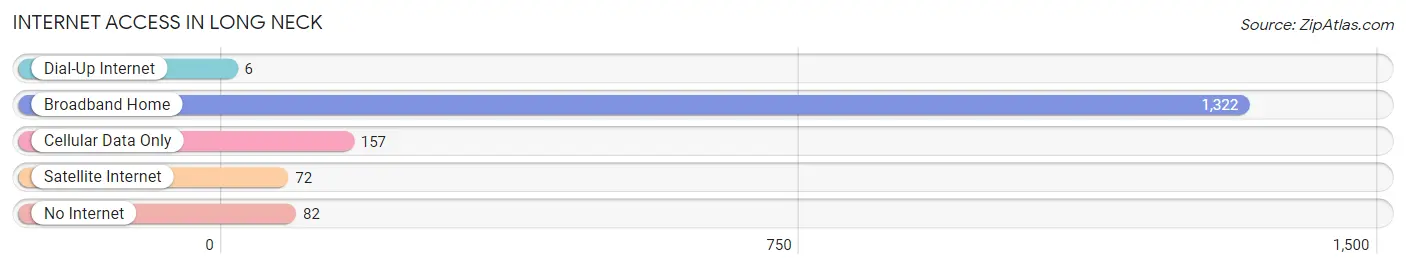
| Internet Type | # Households | % Households |
| Dial-Up Internet | 6 | 0.4% |
| Broadband Home | 1,322 | 83.7% |
| Cellular Data Only | 157 | 9.9% |
| Satellite Internet | 72 | 4.6% |
| No Internet | 82 | 5.2% |
| Total | 1,579 | 100.0% |
Long Neck Summary
Long Neck is an unincorporated community located in Sussex County, Delaware. It is situated in the southern part of the state, approximately 8 miles south of the town of Millsboro. The community is bordered by the Indian River Bay to the east and the Rehoboth Bay to the west. The population of Long Neck was estimated to be 4,845 in 2019.
History
Long Neck was first settled in the late 17th century by English colonists. The area was originally known as “Long Neck Point” and was part of the original land grant given to William Penn in 1682. The area was primarily used for farming and fishing until the early 19th century when it began to develop into a resort community. The first hotel was built in 1820 and the area quickly became a popular destination for vacationers.
In the late 19th century, the area began to develop into a residential community. The first post office was established in 1891 and the community was officially incorporated in 1901. The town was named after the long neck of land that juts out into the Indian River Bay.
Geography
Long Neck is located in southern Delaware, approximately 8 miles south of the town of Millsboro. The community is bordered by the Indian River Bay to the east and the Rehoboth Bay to the west. The area is mostly flat with some rolling hills. The climate is humid subtropical with hot, humid summers and mild winters.
Economy
The economy of Long Neck is largely based on tourism and the service industry. The area is home to several resorts, hotels, and restaurants that cater to tourists. There are also several marinas and boatyards in the area that provide services to boaters. The area is also home to several retail stores and other businesses.
Demographics
As of 2019, the population of Long Neck was estimated to be 4,845. The racial makeup of the community was 87.3% White, 8.2% African American, 1.2% Asian, and 3.3% from other races. The median household income was $50,945 and the median home value was $269,000.
Conclusion
Long Neck is an unincorporated community located in Sussex County, Delaware. It is situated in the southern part of the state, approximately 8 miles south of the town of Millsboro. The community is bordered by the Indian River Bay to the east and the Rehoboth Bay to the west. The population of Long Neck was estimated to be 4,845 in 2019. The economy of Long Neck is largely based on tourism and the service industry. The area is home to several resorts, hotels, and restaurants that cater to tourists. The racial makeup of the community was 87.3% White, 8.2% African American, 1.2% Asian, and 3.3% from other races. The median household income was $50,945 and the median home value was $269,000.
Common Questions
What is Per Capita Income in Long Neck?
Per Capita income in Long Neck is $39,311.
What is the Median Family Income in Long Neck?
Median Family Income in Long Neck is $80,000.
What is the Median Household income in Long Neck?
Median Household Income in Long Neck is $59,563.
What is Income or Wage Gap in Long Neck?
Income or Wage Gap in Long Neck is 29.5%.
Women in Long Neck earn 70.5 cents for every dollar earned by a man.
What is Inequality or Gini Index in Long Neck?
Inequality or Gini Index in Long Neck is 0.38.
What is the Total Population of Long Neck?
Total Population of Long Neck is 2,983.
What is the Total Male Population of Long Neck?
Total Male Population of Long Neck is 1,228.
What is the Total Female Population of Long Neck?
Total Female Population of Long Neck is 1,755.
What is the Ratio of Males per 100 Females in Long Neck?
There are 69.97 Males per 100 Females in Long Neck.
What is the Ratio of Females per 100 Males in Long Neck?
There are 142.92 Females per 100 Males in Long Neck.
What is the Median Population Age in Long Neck?
Median Population Age in Long Neck is 61.5 Years.
What is the Average Family Size in Long Neck
Average Family Size in Long Neck is 2.4 People.
What is the Average Household Size in Long Neck
Average Household Size in Long Neck is 1.9 People.
How Large is the Labor Force in Long Neck?
There are 1,433 People in the Labor Forcein in Long Neck.
What is the Percentage of People in the Labor Force in Long Neck?
51.8% of People are in the Labor Force in Long Neck.
What is the Unemployment Rate in Long Neck?
Unemployment Rate in Long Neck is 7.5%.