Middletown, DE Map & Demographics
Middletown Map
Middletown Overview
$48,426
PER CAPITA INCOME
$117,049
AVG FAMILY INCOME
$104,662
AVG HOUSEHOLD INCOME
35.1%
WAGE / INCOME GAP [ % ]
64.9¢/ $1
WAGE / INCOME GAP [ $ ]
$16,863
FAMILY INCOME DEFICIT
0.42
INEQUALITY / GINI INDEX
23,573
TOTAL POPULATION
10,465
MALE POPULATION
13,108
FEMALE POPULATION
79.84
MALES / 100 FEMALES
125.26
FEMALES / 100 MALES
37.3
MEDIAN AGE
3.3
AVG FAMILY SIZE
2.8
AVG HOUSEHOLD SIZE
11,934
LABOR FORCE [ PEOPLE ]
66.5%
PERCENT IN LABOR FORCE
7.2%
UNEMPLOYMENT RATE
Middletown Zip Codes
Middletown Area Codes
Income in Middletown
Income Overview in Middletown
Per Capita Income in Middletown is $48,426, while median incomes of families and households are $117,049 and $104,662 respectively.
| Characteristic | Number | Measure |
| Per Capita Income | 23,573 | $48,426 |
| Median Family Income | 5,974 | $117,049 |
| Mean Family Income | 5,974 | $125,330 |
| Median Household Income | 8,444 | $104,662 |
| Mean Household Income | 8,444 | $127,215 |
| Income Deficit | 5,974 | $16,863 |
| Wage / Income Gap (%) | 23,573 | 35.10% |
| Wage / Income Gap ($) | 23,573 | 64.90¢ per $1 |
| Gini / Inequality Index | 23,573 | 0.42 |
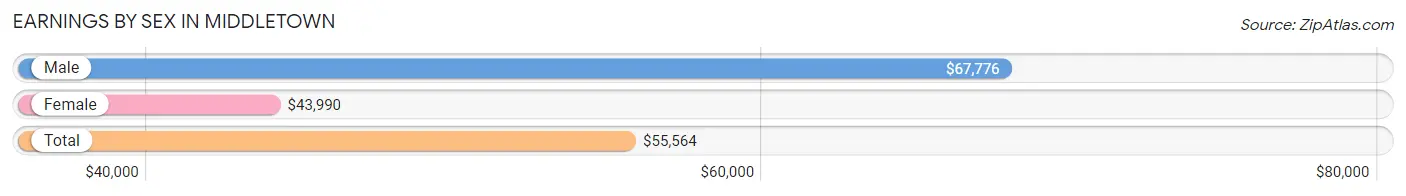
Earnings by Sex in Middletown
Average Earnings in Middletown are $55,564, $67,776 for men and $43,990 for women, a difference of 35.1%.
| Sex | Number | Average Earnings |
| Male | 5,409 (45.9%) | $67,776 |
| Female | 6,365 (54.1%) | $43,990 |
| Total | 11,774 (100.0%) | $55,564 |
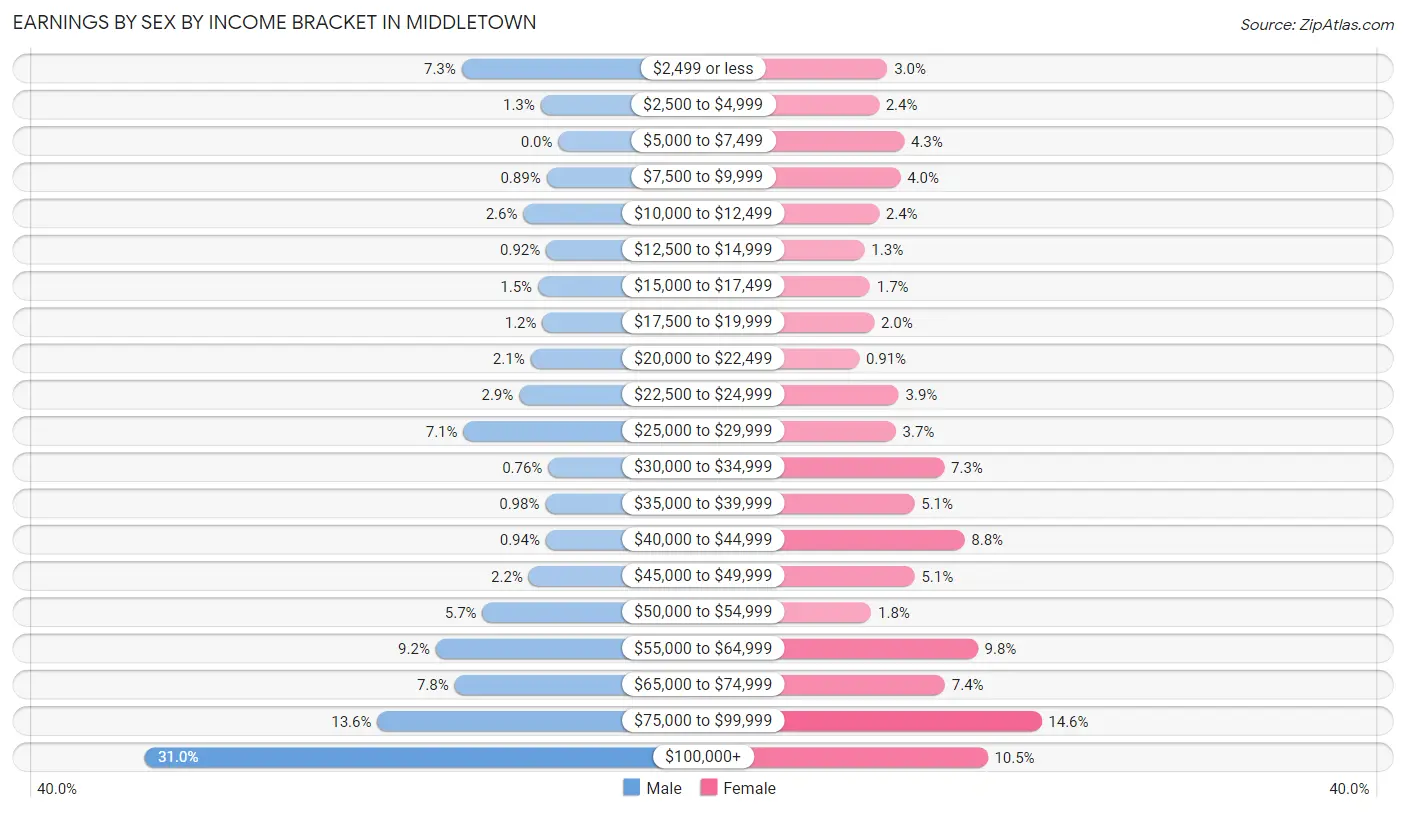
Earnings by Sex by Income Bracket in Middletown
The most common earnings brackets in Middletown are $100,000+ for men (1,675 | 31.0%) and $75,000 to $99,999 for women (928 | 14.6%).
| Income | Male | Female |
| $2,499 or less | 392 (7.2%) | 193 (3.0%) |
| $2,500 to $4,999 | 72 (1.3%) | 152 (2.4%) |
| $5,000 to $7,499 | 0 (0.0%) | 273 (4.3%) |
| $7,500 to $9,999 | 48 (0.9%) | 255 (4.0%) |
| $10,000 to $12,499 | 142 (2.6%) | 153 (2.4%) |
| $12,500 to $14,999 | 50 (0.9%) | 84 (1.3%) |
| $15,000 to $17,499 | 83 (1.5%) | 110 (1.7%) |
| $17,500 to $19,999 | 65 (1.2%) | 130 (2.0%) |
| $20,000 to $22,499 | 113 (2.1%) | 58 (0.9%) |
| $22,500 to $24,999 | 159 (2.9%) | 247 (3.9%) |
| $25,000 to $29,999 | 385 (7.1%) | 233 (3.7%) |
| $30,000 to $34,999 | 41 (0.8%) | 464 (7.3%) |
| $35,000 to $39,999 | 53 (1.0%) | 322 (5.1%) |
| $40,000 to $44,999 | 51 (0.9%) | 561 (8.8%) |
| $45,000 to $49,999 | 120 (2.2%) | 323 (5.1%) |
| $50,000 to $54,999 | 308 (5.7%) | 116 (1.8%) |
| $55,000 to $64,999 | 497 (9.2%) | 624 (9.8%) |
| $65,000 to $74,999 | 421 (7.8%) | 468 (7.3%) |
| $75,000 to $99,999 | 734 (13.6%) | 928 (14.6%) |
| $100,000+ | 1,675 (31.0%) | 671 (10.5%) |
| Total | 5,409 (100.0%) | 6,365 (100.0%) |
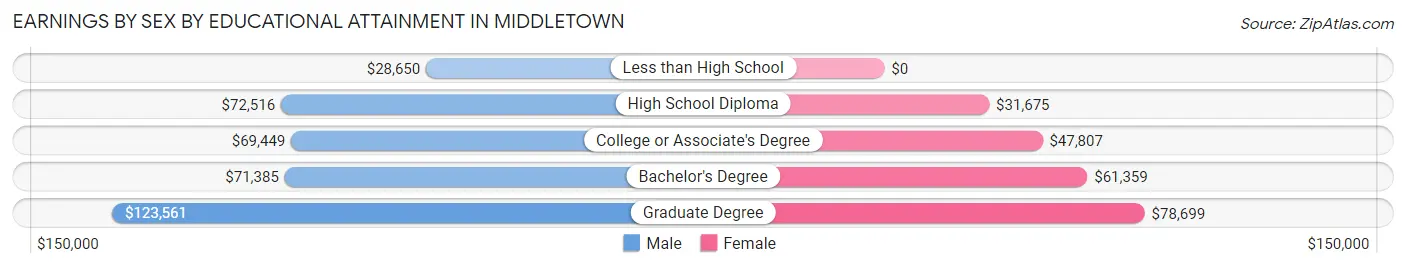
Earnings by Sex by Educational Attainment in Middletown
Average earnings in Middletown are $74,327 for men and $51,387 for women, a difference of 30.9%. Men with an educational attainment of graduate degree enjoy the highest average annual earnings of $123,561, while those with less than high school education earn the least with $28,650. Women with an educational attainment of graduate degree earn the most with the average annual earnings of $78,699, while those with high school diploma education have the smallest earnings of $31,675.
| Educational Attainment | Male Income | Female Income |
| Less than High School | $28,650 | $0 |
| High School Diploma | $72,516 | $31,675 |
| College or Associate's Degree | $69,449 | $47,807 |
| Bachelor's Degree | $71,385 | $61,359 |
| Graduate Degree | $123,561 | $78,699 |
| Total | $74,327 | $51,387 |
Family Income in Middletown
Family Income Brackets in Middletown
According to the Middletown family income data, there are 1,810 families falling into the $100,000 to $149,999 income range, which is the most common income bracket and makes up 30.3% of all families.
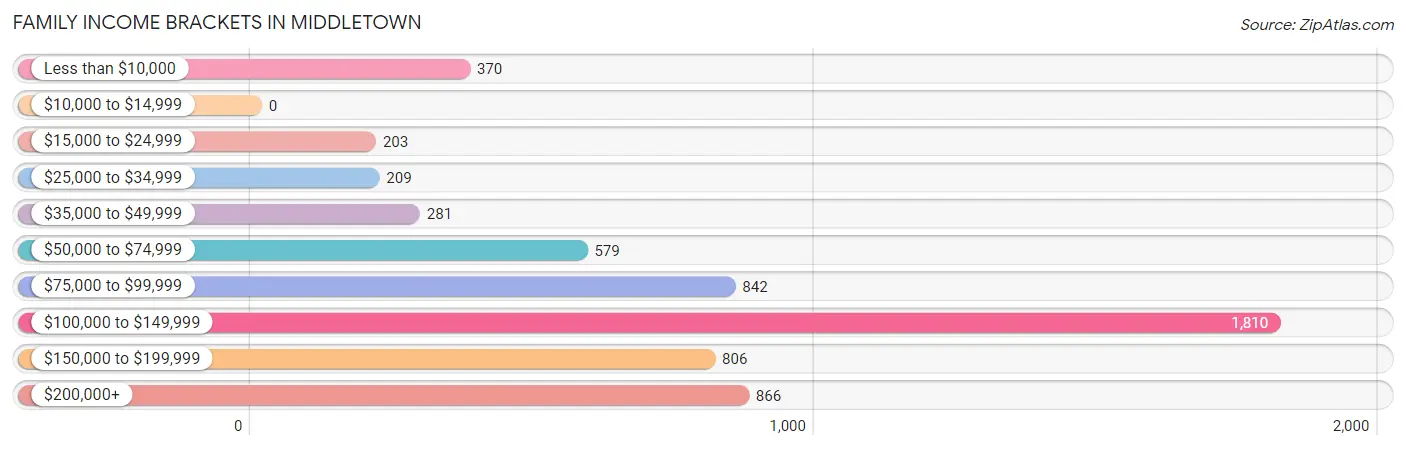
| Income Bracket | # Families | % Families |
| Less than $10,000 | 370 | 6.2% |
| $10,000 to $14,999 | 0 | 0.0% |
| $15,000 to $24,999 | 203 | 3.4% |
| $25,000 to $34,999 | 209 | 3.5% |
| $35,000 to $49,999 | 281 | 4.7% |
| $50,000 to $74,999 | 579 | 9.7% |
| $75,000 to $99,999 | 842 | 14.1% |
| $100,000 to $149,999 | 1,810 | 30.3% |
| $150,000 to $199,999 | 806 | 13.5% |
| $200,000+ | 866 | 14.5% |
Family Income by Famaliy Size in Middletown
6-person families (74 | 1.2%) account for the highest median family income in Middletown with $196,364 per family, while 2-person families (2,194 | 36.7%) have the highest median income of $44,494 per family member.
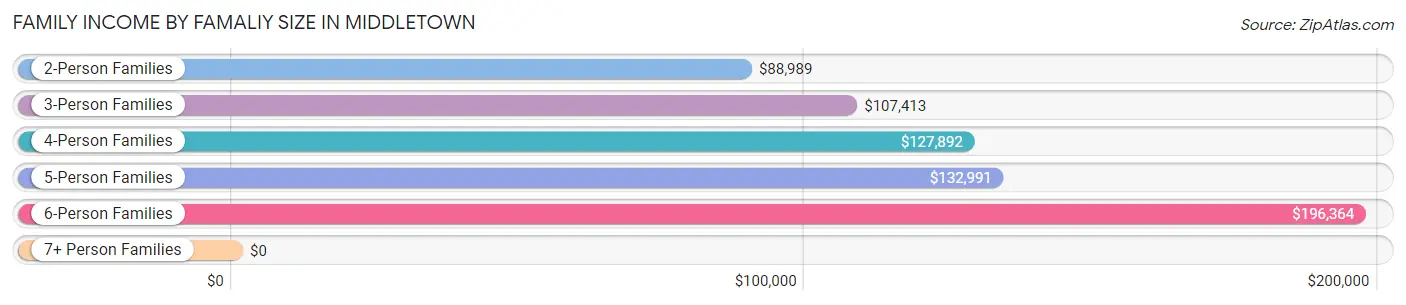
| Income Bracket | # Families | Median Income |
| 2-Person Families | 2,194 (36.7%) | $88,989 |
| 3-Person Families | 1,793 (30.0%) | $107,413 |
| 4-Person Families | 1,580 (26.5%) | $127,892 |
| 5-Person Families | 203 (3.4%) | $132,991 |
| 6-Person Families | 74 (1.2%) | $196,364 |
| 7+ Person Families | 130 (2.2%) | $0 |
| Total | 5,974 (100.0%) | $117,049 |
Family Income by Number of Earners in Middletown
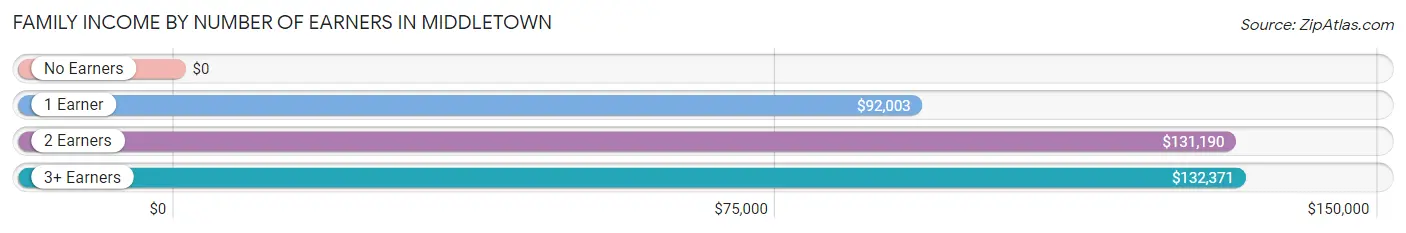
| Number of Earners | # Families | Median Income |
| No Earners | 1,148 (19.2%) | $0 |
| 1 Earner | 1,643 (27.5%) | $92,003 |
| 2 Earners | 2,226 (37.3%) | $131,190 |
| 3+ Earners | 957 (16.0%) | $132,371 |
| Total | 5,974 (100.0%) | $117,049 |
Household Income in Middletown
Household Income Brackets in Middletown
With 2,457 households falling in the category, the $100,000 to $149,999 income range is the most frequent in Middletown, accounting for 29.1% of all households. In contrast, only 17 households (0.2%) fall into the $10,000 to $14,999 income bracket, making it the least populous group.
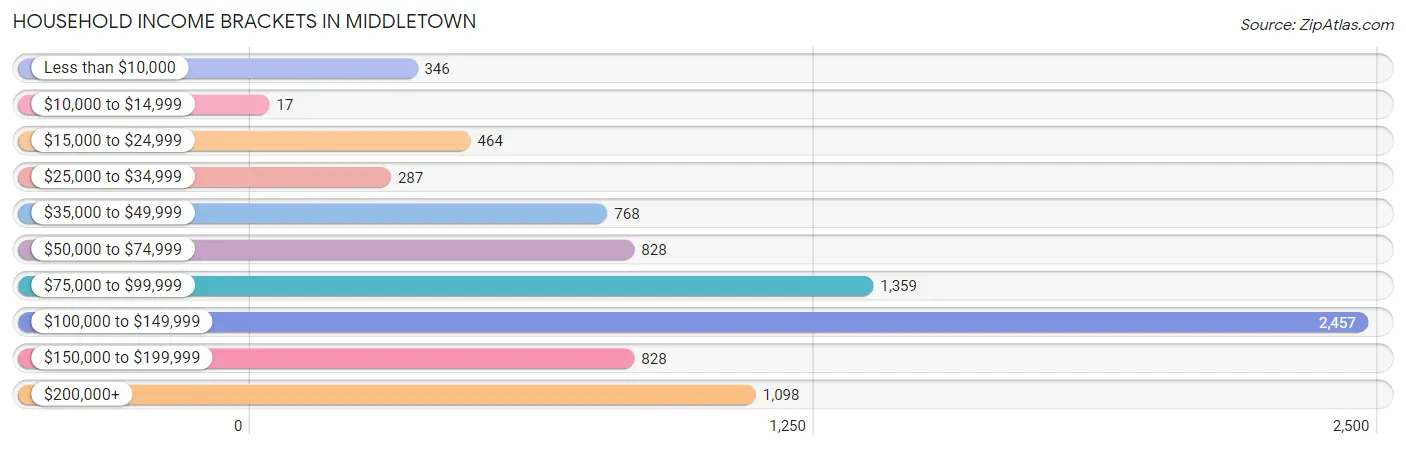
| Income Bracket | # Households | % Households |
| Less than $10,000 | 346 | 4.1% |
| $10,000 to $14,999 | 17 | 0.2% |
| $15,000 to $24,999 | 464 | 5.5% |
| $25,000 to $34,999 | 287 | 3.4% |
| $35,000 to $49,999 | 768 | 9.1% |
| $50,000 to $74,999 | 828 | 9.8% |
| $75,000 to $99,999 | 1,359 | 16.1% |
| $100,000 to $149,999 | 2,457 | 29.1% |
| $150,000 to $199,999 | 828 | 9.8% |
| $200,000+ | 1,098 | 13.0% |
Household Income by Householder Age in Middletown
The median household income in Middletown is $104,662, with the highest median household income of $116,972 found in the 45 to 64 years age bracket for the primary householder. A total of 3,169 households (37.5%) fall into this category. Meanwhile, the 15 to 24 years age bracket for the primary householder has the lowest median household income of $0, with 52 households (0.6%) in this group.
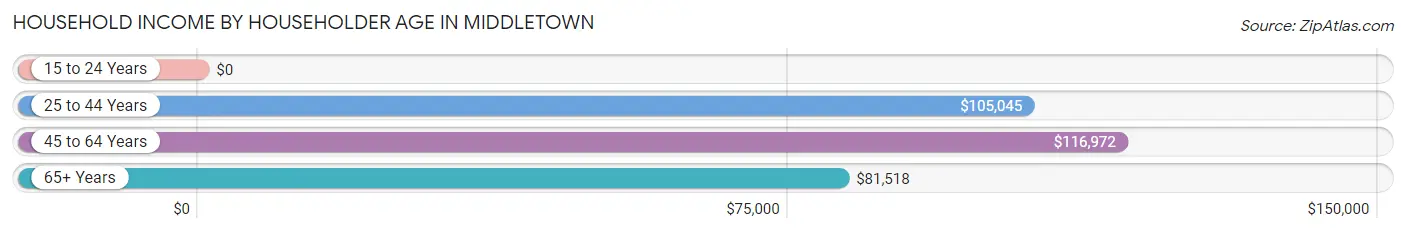
| Income Bracket | # Households | Median Income |
| 15 to 24 Years | 52 (0.6%) | $0 |
| 25 to 44 Years | 2,746 (32.5%) | $105,045 |
| 45 to 64 Years | 3,169 (37.5%) | $116,972 |
| 65+ Years | 2,477 (29.3%) | $81,518 |
| Total | 8,444 (100.0%) | $104,662 |
Poverty in Middletown
Income Below Poverty by Sex and Age in Middletown
With 7.0% poverty level for males and 6.6% for females among the residents of Middletown, 15 year old males and under 5 year old females are the most vulnerable to poverty, with 45 males (36.3%) and 157 females (28.4%) in their respective age groups living below the poverty level.
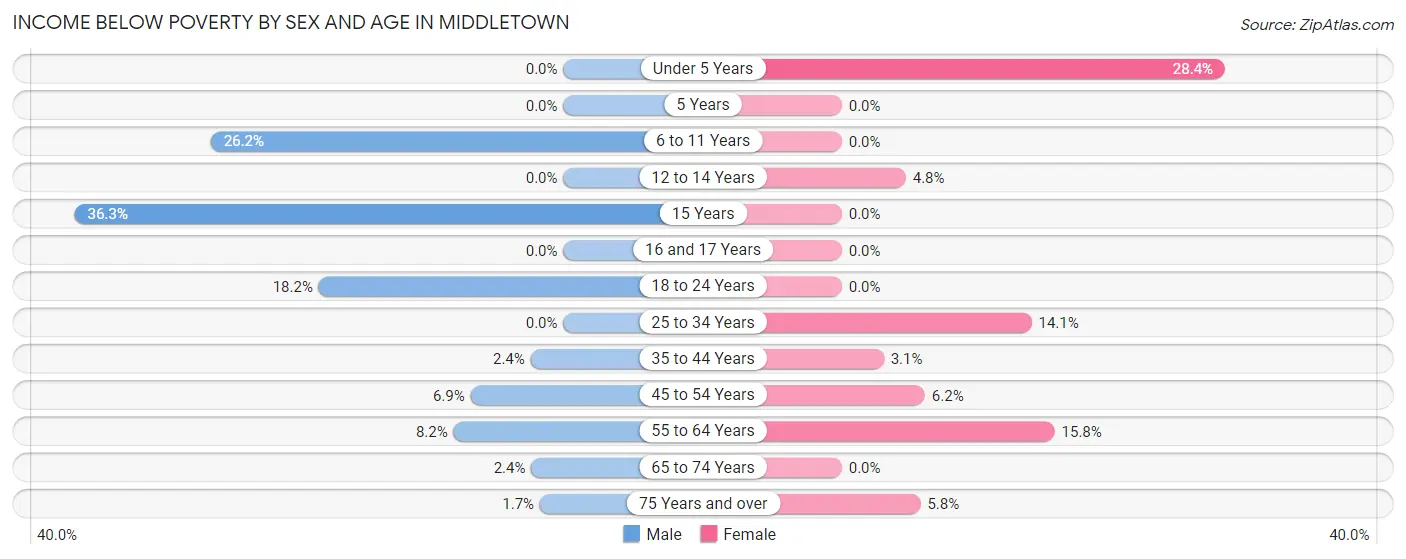
| Age Bracket | Male | Female |
| Under 5 Years | 0 (0.0%) | 157 (28.4%) |
| 5 Years | 0 (0.0%) | 0 (0.0%) |
| 6 to 11 Years | 260 (26.2%) | 0 (0.0%) |
| 12 to 14 Years | 0 (0.0%) | 27 (4.8%) |
| 15 Years | 45 (36.3%) | 0 (0.0%) |
| 16 and 17 Years | 0 (0.0%) | 0 (0.0%) |
| 18 to 24 Years | 170 (18.2%) | 0 (0.0%) |
| 25 to 34 Years | 0 (0.0%) | 242 (14.1%) |
| 35 to 44 Years | 27 (2.4%) | 45 (3.1%) |
| 45 to 54 Years | 95 (6.9%) | 92 (6.2%) |
| 55 to 64 Years | 92 (8.2%) | 216 (15.8%) |
| 65 to 74 Years | 15 (2.4%) | 0 (0.0%) |
| 75 Years and over | 16 (1.7%) | 70 (5.8%) |
| Total | 720 (7.0%) | 849 (6.6%) |
Income Above Poverty by Sex and Age in Middletown
According to the poverty statistics in Middletown, males aged under 5 years and females aged 5 years are the age groups that are most secure financially, with 100.0% of males and 100.0% of females in these age groups living above the poverty line.
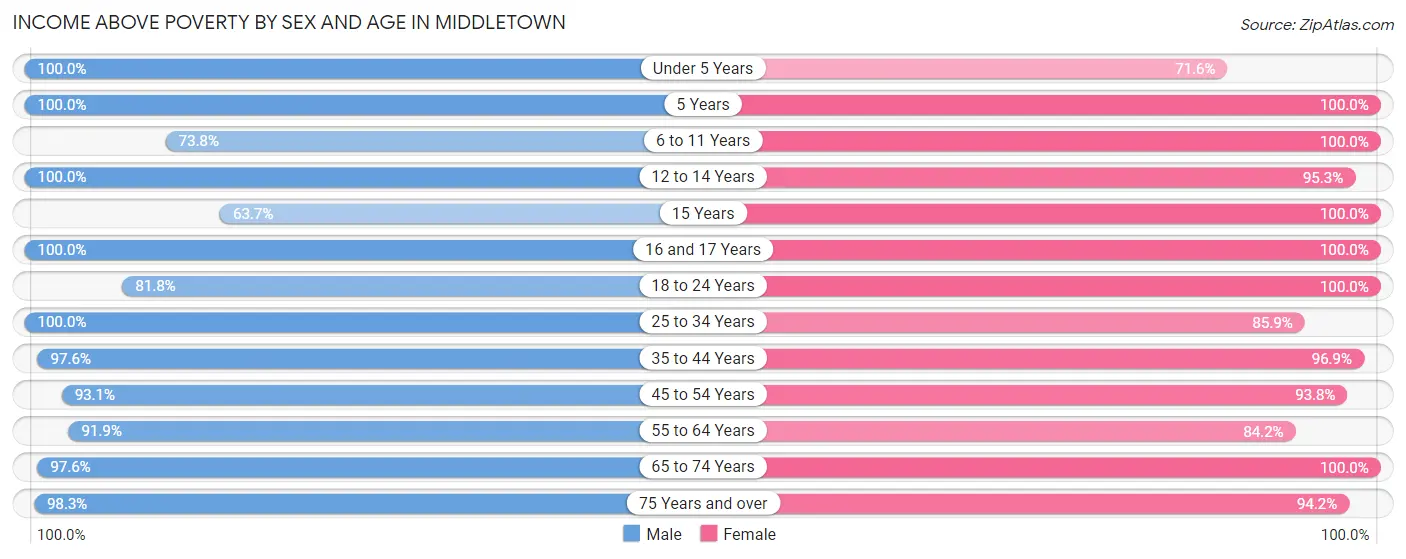
| Age Bracket | Male | Female |
| Under 5 Years | 533 (100.0%) | 395 (71.6%) |
| 5 Years | 84 (100.0%) | 98 (100.0%) |
| 6 to 11 Years | 733 (73.8%) | 1,357 (100.0%) |
| 12 to 14 Years | 791 (100.0%) | 541 (95.3%) |
| 15 Years | 79 (63.7%) | 231 (100.0%) |
| 16 and 17 Years | 431 (100.0%) | 693 (100.0%) |
| 18 to 24 Years | 766 (81.8%) | 717 (100.0%) |
| 25 to 34 Years | 1,277 (100.0%) | 1,476 (85.9%) |
| 35 to 44 Years | 1,082 (97.6%) | 1,402 (96.9%) |
| 45 to 54 Years | 1,284 (93.1%) | 1,398 (93.8%) |
| 55 to 64 Years | 1,037 (91.8%) | 1,151 (84.2%) |
| 65 to 74 Years | 616 (97.6%) | 1,400 (100.0%) |
| 75 Years and over | 906 (98.3%) | 1,128 (94.2%) |
| Total | 9,619 (93.0%) | 11,987 (93.4%) |
Income Below Poverty Among Married-Couple Families in Middletown
The poverty statistics for married-couple families in Middletown show that 1.7% or 72 of the total 4,181 families live below the poverty line. Families with no children have the highest poverty rate of 2.2%, comprising of 46 families. On the other hand, families with 3 or 4 children have the lowest poverty rate of 0.0%, which includes 0 families.
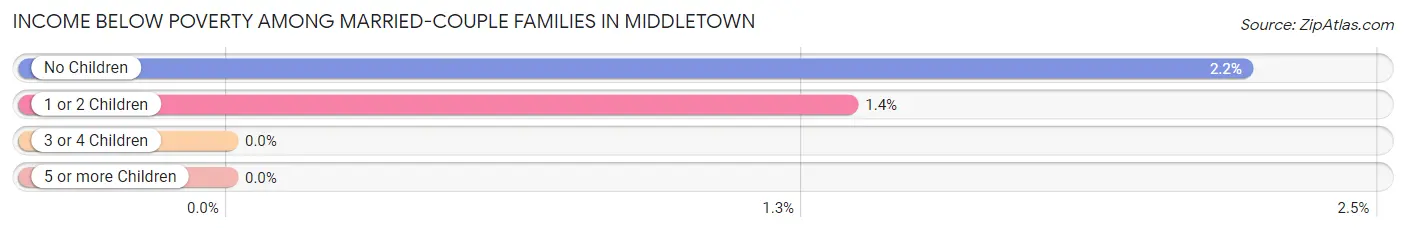
| Children | Above Poverty | Below Poverty |
| No Children | 2,037 (97.8%) | 46 (2.2%) |
| 1 or 2 Children | 1,901 (98.7%) | 26 (1.3%) |
| 3 or 4 Children | 136 (100.0%) | 0 (0.0%) |
| 5 or more Children | 35 (100.0%) | 0 (0.0%) |
| Total | 4,109 (98.3%) | 72 (1.7%) |
Income Below Poverty Among Single-Parent Households in Middletown
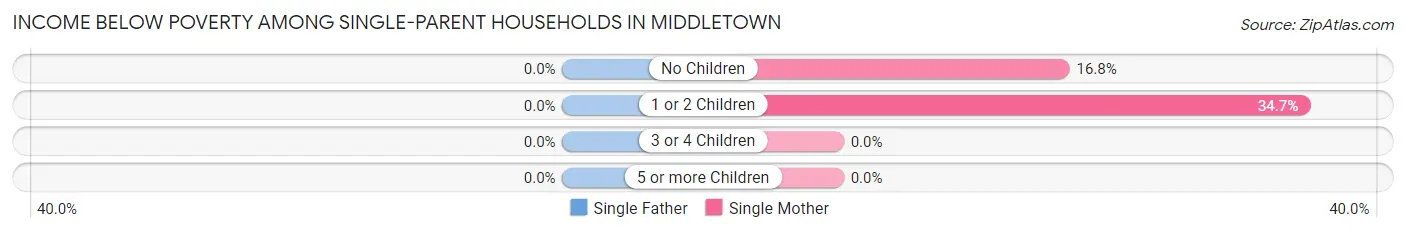
| Children | Single Father | Single Mother |
| No Children | 0 (0.0%) | 85 (16.8%) |
| 1 or 2 Children | 0 (0.0%) | 297 (34.7%) |
| 3 or 4 Children | 0 (0.0%) | 0 (0.0%) |
| 5 or more Children | 0 (0.0%) | 0 (0.0%) |
| Total | 0 (0.0%) | 382 (26.3%) |
Income Below Poverty Among Married-Couple vs Single-Parent Households in Middletown
The poverty data for Middletown shows that 72 of the married-couple family households (1.7%) and 382 of the single-parent households (21.3%) are living below the poverty level. Within the married-couple family households, those with no children have the highest poverty rate, with 46 households (2.2%) falling below the poverty line. Among the single-parent households, those with 1 or 2 children have the highest poverty rate, with 297 household (28.3%) living below poverty.
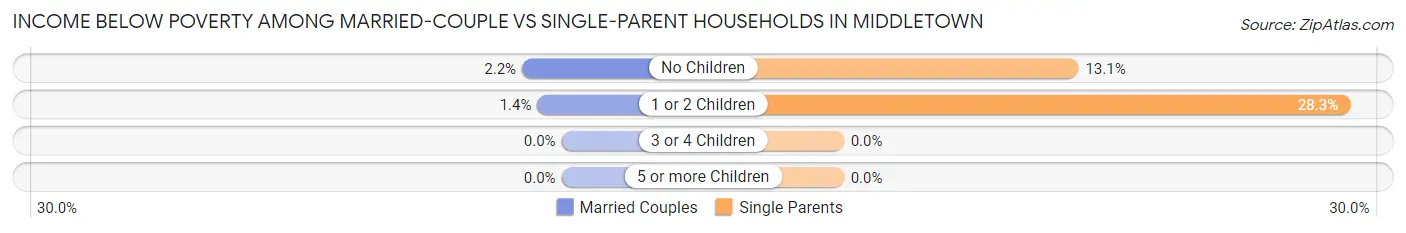
| Children | Married-Couple Families | Single-Parent Households |
| No Children | 46 (2.2%) | 85 (13.1%) |
| 1 or 2 Children | 26 (1.3%) | 297 (28.3%) |
| 3 or 4 Children | 0 (0.0%) | 0 (0.0%) |
| 5 or more Children | 0 (0.0%) | 0 (0.0%) |
| Total | 72 (1.7%) | 382 (21.3%) |
Race in Middletown
The most populous races in Middletown are White / Caucasian (13,130 | 55.7%), Black / African American (7,172 | 30.4%), and Hispanic or Latino (1,504 | 6.4%).
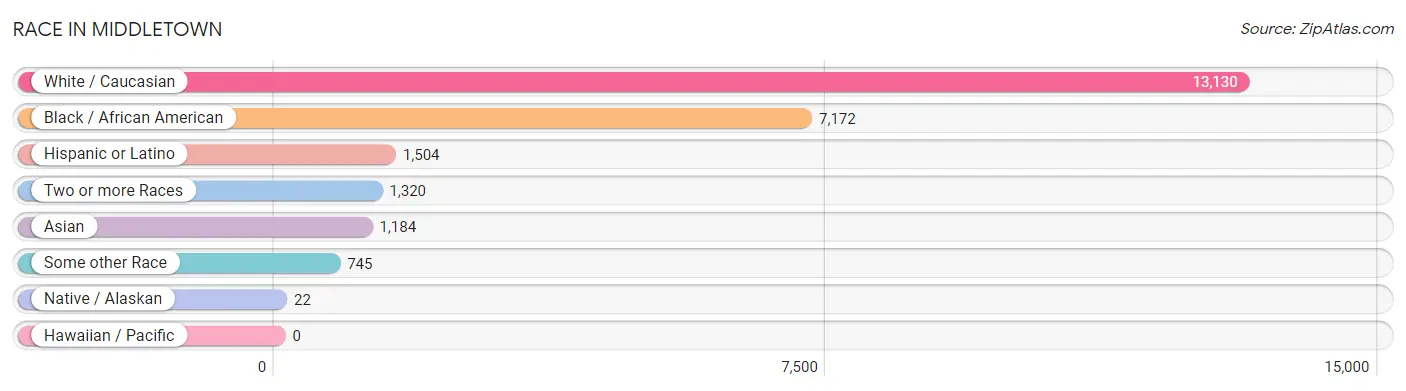
| Race | # Population | % Population |
| Asian | 1,184 | 5.0% |
| Black / African American | 7,172 | 30.4% |
| Hawaiian / Pacific | 0 | 0.0% |
| Hispanic or Latino | 1,504 | 6.4% |
| Native / Alaskan | 22 | 0.1% |
| White / Caucasian | 13,130 | 55.7% |
| Two or more Races | 1,320 | 5.6% |
| Some other Race | 745 | 3.2% |
| Total | 23,573 | 100.0% |
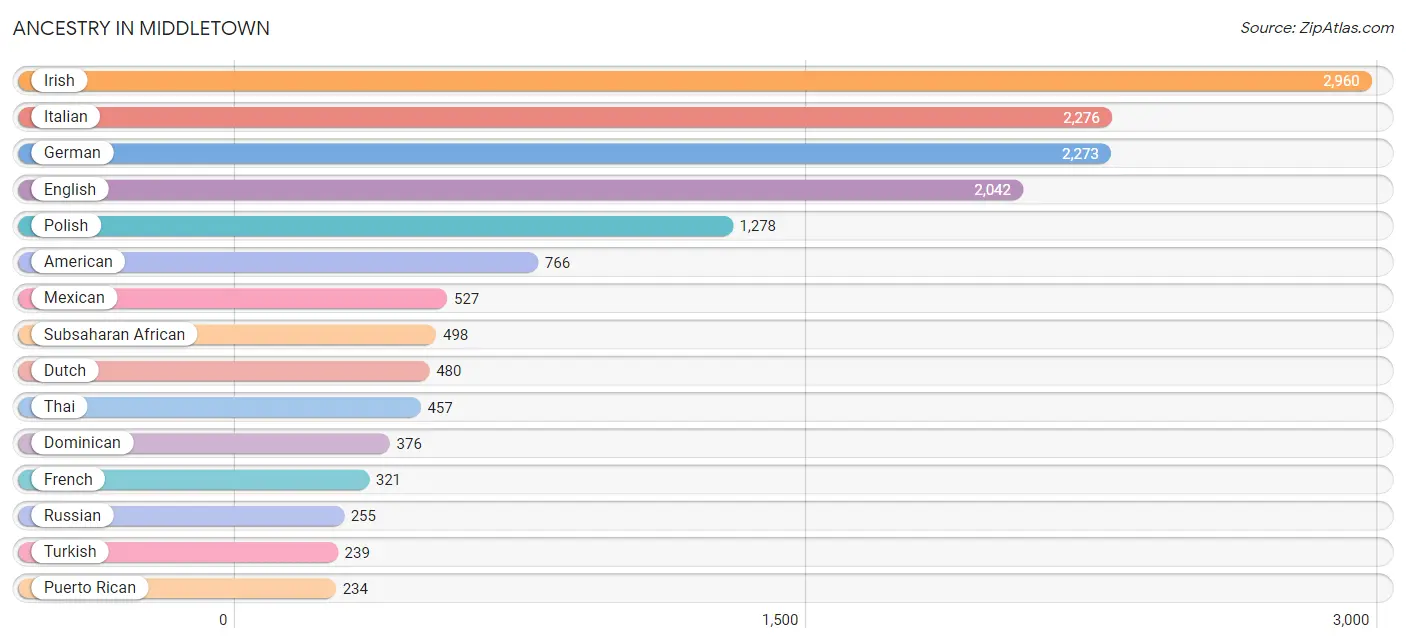
Ancestry in Middletown
The most populous ancestries reported in Middletown are Irish (2,960 | 12.6%), Italian (2,276 | 9.7%), German (2,273 | 9.6%), English (2,042 | 8.7%), and Polish (1,278 | 5.4%), together accounting for 45.9% of all Middletown residents.
| Ancestry | # Population | % Population |
| African | 81 | 0.3% |
| American | 766 | 3.3% |
| Arab | 45 | 0.2% |
| Austrian | 66 | 0.3% |
| Blackfeet | 142 | 0.6% |
| British | 13 | 0.1% |
| British West Indian | 40 | 0.2% |
| Canadian | 112 | 0.5% |
| Central American | 43 | 0.2% |
| Central American Indian | 22 | 0.1% |
| Cherokee | 142 | 0.6% |
| Chilean | 96 | 0.4% |
| Colombian | 27 | 0.1% |
| Croatian | 14 | 0.1% |
| Cuban | 24 | 0.1% |
| Czechoslovakian | 19 | 0.1% |
| Danish | 74 | 0.3% |
| Dominican | 376 | 1.6% |
| Dutch | 480 | 2.0% |
| Egyptian | 13 | 0.1% |
| English | 2,042 | 8.7% |
| European | 144 | 0.6% |
| French | 321 | 1.4% |
| French Canadian | 30 | 0.1% |
| German | 2,273 | 9.6% |
| Ghanaian | 109 | 0.5% |
| Greek | 144 | 0.6% |
| Guatemalan | 22 | 0.1% |
| Haitian | 121 | 0.5% |
| Hungarian | 27 | 0.1% |
| Indian (Asian) | 103 | 0.4% |
| Irish | 2,960 | 12.6% |
| Italian | 2,276 | 9.7% |
| Jamaican | 18 | 0.1% |
| Korean | 218 | 0.9% |
| Lebanese | 13 | 0.1% |
| Lithuanian | 54 | 0.2% |
| Mexican | 527 | 2.2% |
| Nigerian | 205 | 0.9% |
| Northern European | 47 | 0.2% |
| Norwegian | 180 | 0.8% |
| Panamanian | 21 | 0.1% |
| Pennsylvania German | 11 | 0.1% |
| Polish | 1,278 | 5.4% |
| Puerto Rican | 234 | 1.0% |
| Russian | 255 | 1.1% |
| Scotch-Irish | 55 | 0.2% |
| Scottish | 225 | 0.9% |
| Sierra Leonean | 103 | 0.4% |
| Slavic | 64 | 0.3% |
| Slovak | 62 | 0.3% |
| South American | 167 | 0.7% |
| Spaniard | 53 | 0.2% |
| Sri Lankan | 121 | 0.5% |
| Subsaharan African | 498 | 2.1% |
| Swedish | 83 | 0.4% |
| Swiss | 63 | 0.3% |
| Thai | 457 | 1.9% |
| Turkish | 239 | 1.0% |
| Ukrainian | 68 | 0.3% |
| Venezuelan | 44 | 0.2% |
| Vietnamese | 19 | 0.1% | View All 62 Rows |
Immigrants in Middletown
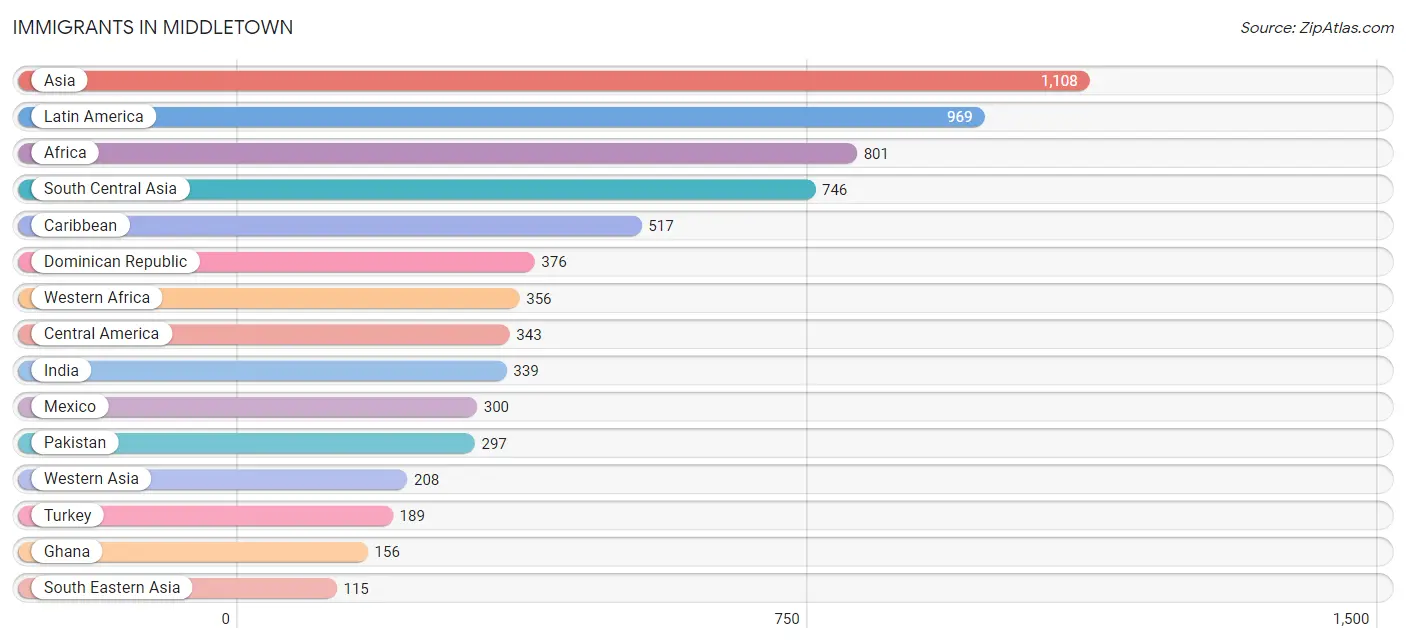
The most numerous immigrant groups reported in Middletown came from Asia (1,108 | 4.7%), Latin America (969 | 4.1%), Africa (801 | 3.4%), South Central Asia (746 | 3.2%), and Caribbean (517 | 2.2%), together accounting for 17.6% of all Middletown residents.
| Immigration Origin | # Population | % Population |
| Africa | 801 | 3.4% |
| Argentina | 38 | 0.2% |
| Asia | 1,108 | 4.7% |
| Bangladesh | 19 | 0.1% |
| Cameroon | 54 | 0.2% |
| Canada | 27 | 0.1% |
| Caribbean | 517 | 2.2% |
| Central America | 343 | 1.5% |
| China | 39 | 0.2% |
| Colombia | 27 | 0.1% |
| Cuba | 24 | 0.1% |
| Dominican Republic | 376 | 1.6% |
| Eastern Africa | 20 | 0.1% |
| Eastern Asia | 39 | 0.2% |
| Eastern Europe | 17 | 0.1% |
| England | 3 | 0.0% |
| Europe | 50 | 0.2% |
| Germany | 15 | 0.1% |
| Ghana | 156 | 0.7% |
| Guatemala | 22 | 0.1% |
| Haiti | 64 | 0.3% |
| India | 339 | 1.4% |
| Jordan | 19 | 0.1% |
| Kenya | 20 | 0.1% |
| Latin America | 969 | 4.1% |
| Liberia | 63 | 0.3% |
| Malaysia | 64 | 0.3% |
| Mexico | 300 | 1.3% |
| Middle Africa | 54 | 0.2% |
| Nigeria | 86 | 0.4% |
| Northern Europe | 3 | 0.0% |
| Pakistan | 297 | 1.3% |
| Panama | 21 | 0.1% |
| Philippines | 51 | 0.2% |
| Poland | 17 | 0.1% |
| Sierra Leone | 51 | 0.2% |
| South Africa | 9 | 0.0% |
| South America | 109 | 0.5% |
| South Central Asia | 746 | 3.2% |
| South Eastern Asia | 115 | 0.5% |
| Sri Lanka | 91 | 0.4% |
| Switzerland | 15 | 0.1% |
| Trinidad and Tobago | 17 | 0.1% |
| Turkey | 189 | 0.8% |
| Venezuela | 44 | 0.2% |
| Western Africa | 356 | 1.5% |
| Western Asia | 208 | 0.9% |
| Western Europe | 30 | 0.1% | View All 48 Rows |
Sex and Age in Middletown
Sex and Age in Middletown
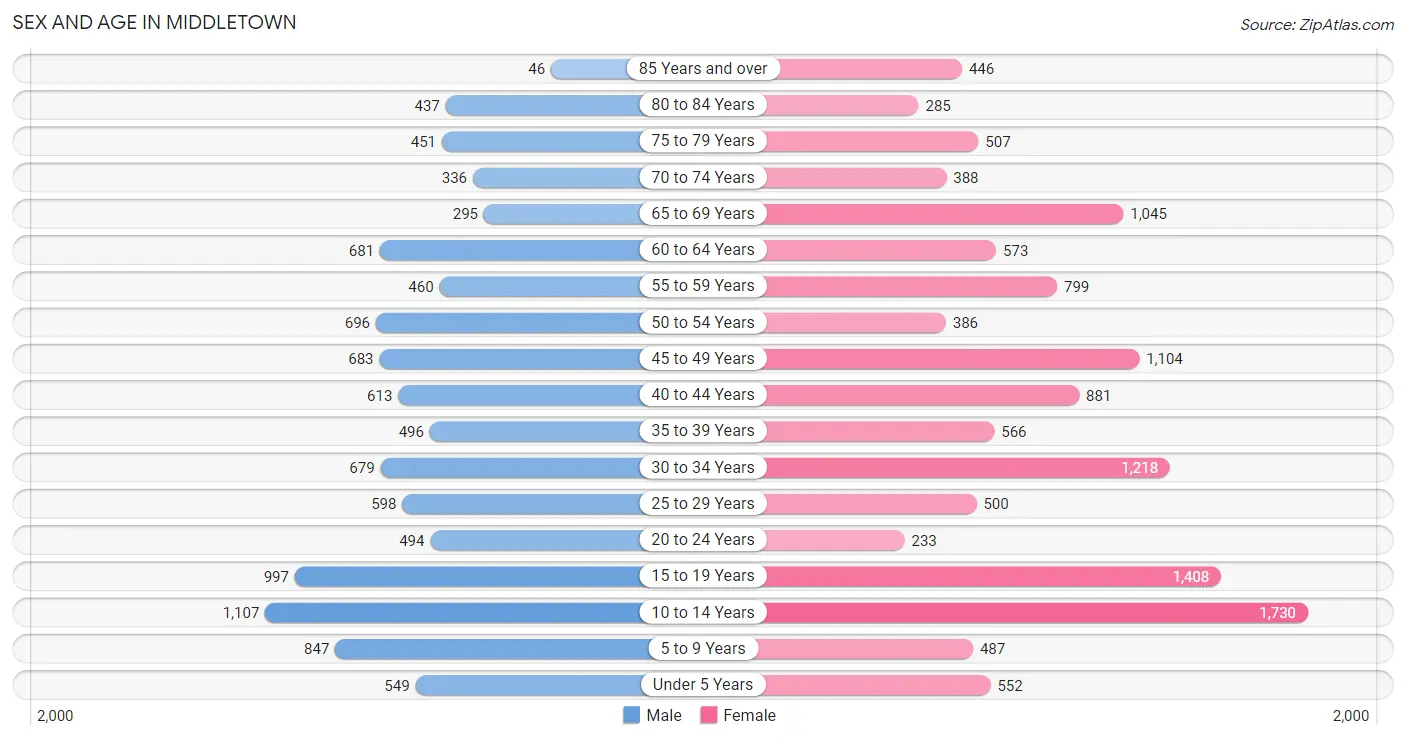
The most populous age groups in Middletown are 10 to 14 Years (1,107 | 10.6%) for men and 10 to 14 Years (1,730 | 13.2%) for women.
| Age Bracket | Male | Female |
| Under 5 Years | 549 (5.2%) | 552 (4.2%) |
| 5 to 9 Years | 847 (8.1%) | 487 (3.7%) |
| 10 to 14 Years | 1,107 (10.6%) | 1,730 (13.2%) |
| 15 to 19 Years | 997 (9.5%) | 1,408 (10.7%) |
| 20 to 24 Years | 494 (4.7%) | 233 (1.8%) |
| 25 to 29 Years | 598 (5.7%) | 500 (3.8%) |
| 30 to 34 Years | 679 (6.5%) | 1,218 (9.3%) |
| 35 to 39 Years | 496 (4.7%) | 566 (4.3%) |
| 40 to 44 Years | 613 (5.9%) | 881 (6.7%) |
| 45 to 49 Years | 683 (6.5%) | 1,104 (8.4%) |
| 50 to 54 Years | 696 (6.7%) | 386 (2.9%) |
| 55 to 59 Years | 460 (4.4%) | 799 (6.1%) |
| 60 to 64 Years | 681 (6.5%) | 573 (4.4%) |
| 65 to 69 Years | 295 (2.8%) | 1,045 (8.0%) |
| 70 to 74 Years | 336 (3.2%) | 388 (3.0%) |
| 75 to 79 Years | 451 (4.3%) | 507 (3.9%) |
| 80 to 84 Years | 437 (4.2%) | 285 (2.2%) |
| 85 Years and over | 46 (0.4%) | 446 (3.4%) |
| Total | 10,465 (100.0%) | 13,108 (100.0%) |
Families and Households in Middletown
Median Family Size in Middletown
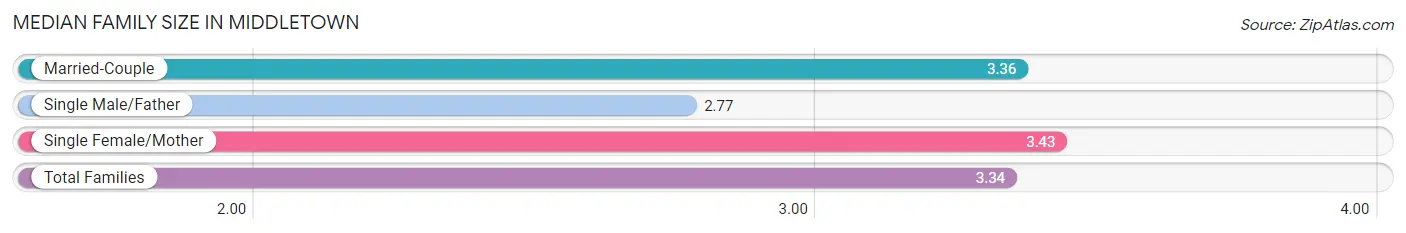
The median family size in Middletown is 3.34 persons per family, with single female/mother families (1,455 | 24.4%) accounting for the largest median family size of 3.43 persons per family. On the other hand, single male/father families (338 | 5.7%) represent the smallest median family size with 2.77 persons per family.
| Family Type | # Families | Family Size |
| Married-Couple | 4,181 (70.0%) | 3.36 |
| Single Male/Father | 338 (5.7%) | 2.77 |
| Single Female/Mother | 1,455 (24.4%) | 3.43 |
| Total Families | 5,974 (100.0%) | 3.34 |
Median Household Size in Middletown
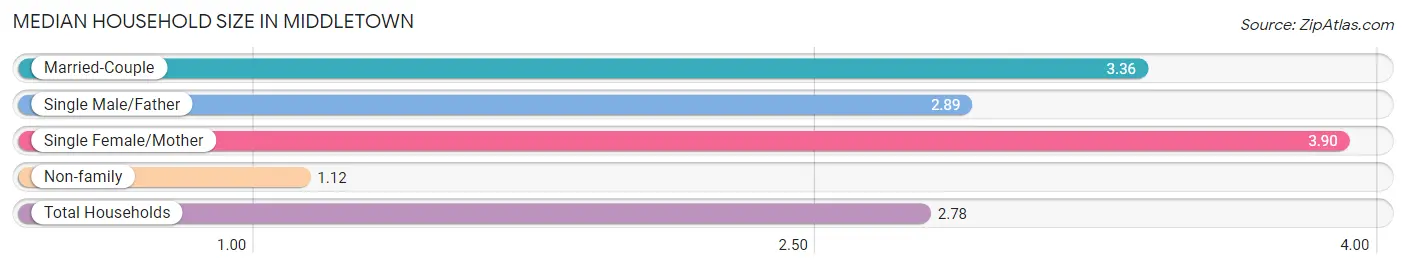
The median household size in Middletown is 2.78 persons per household, with single female/mother households (1,455 | 17.2%) accounting for the largest median household size of 3.9 persons per household. non-family households (2,470 | 29.2%) represent the smallest median household size with 1.12 persons per household.
| Household Type | # Households | Household Size |
| Married-Couple | 4,181 (49.5%) | 3.36 |
| Single Male/Father | 338 (4.0%) | 2.89 |
| Single Female/Mother | 1,455 (17.2%) | 3.90 |
| Non-family | 2,470 (29.2%) | 1.12 |
| Total Households | 8,444 (100.0%) | 2.78 |
Household Size by Marriage Status in Middletown
Out of a total of 8,444 households in Middletown, 5,974 (70.8%) are family households, while 2,470 (29.2%) are nonfamily households. The most numerous type of family households are 2-person households, comprising 2,061, and the most common type of nonfamily households are 1-person households, comprising 2,079.
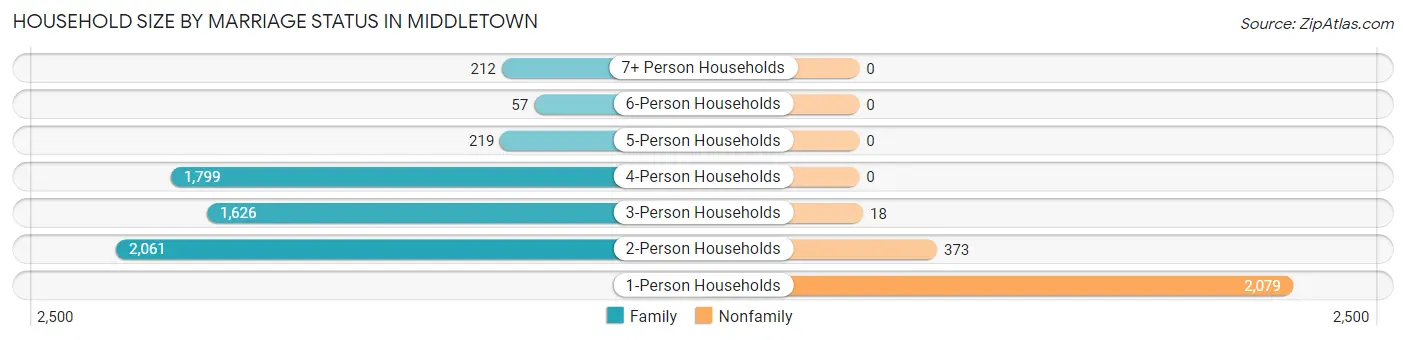
| Household Size | Family Households | Nonfamily Households |
| 1-Person Households | - | 2,079 (24.6%) |
| 2-Person Households | 2,061 (24.4%) | 373 (4.4%) |
| 3-Person Households | 1,626 (19.3%) | 18 (0.2%) |
| 4-Person Households | 1,799 (21.3%) | 0 (0.0%) |
| 5-Person Households | 219 (2.6%) | 0 (0.0%) |
| 6-Person Households | 57 (0.7%) | 0 (0.0%) |
| 7+ Person Households | 212 (2.5%) | 0 (0.0%) |
| Total | 5,974 (70.8%) | 2,470 (29.2%) |
Female Fertility in Middletown
Fertility by Age in Middletown
Average fertility rate in Middletown is 41.0 births per 1,000 women. Women in the age bracket of 20 to 34 years have the highest fertility rate with 72.0 births per 1,000 women. Women in the age bracket of 20 to 34 years acount for 56.7% of all women with births.
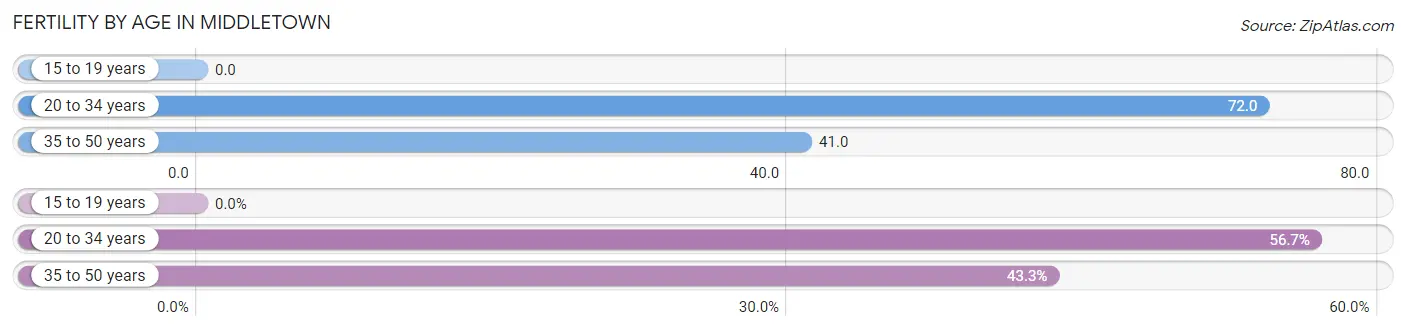
| Age Bracket | Women with Births | Births / 1,000 Women |
| 15 to 19 years | 0 (0.0%) | 0.0 |
| 20 to 34 years | 140 (56.7%) | 72.0 |
| 35 to 50 years | 107 (43.3%) | 41.0 |
| Total | 247 (100.0%) | 41.0 |
Fertility by Age by Marriage Status in Middletown
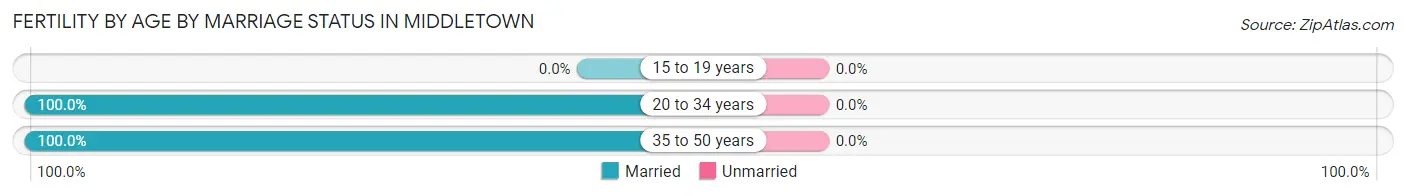
| Age Bracket | Married | Unmarried |
| 15 to 19 years | 0 (0.0%) | 0 (0.0%) |
| 20 to 34 years | 140 (100.0%) | 0 (0.0%) |
| 35 to 50 years | 107 (100.0%) | 0 (0.0%) |
| Total | 247 (100.0%) | 0 (0.0%) |
Fertility by Education in Middletown
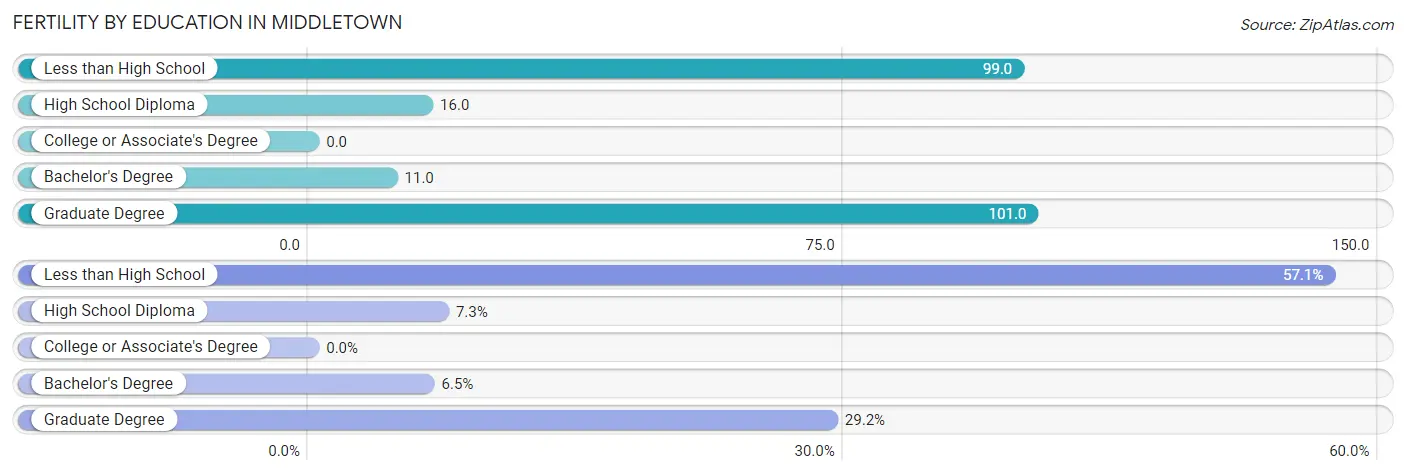
| Educational Attainment | Women with Births | Births / 1,000 Women |
| Less than High School | 141 (57.1%) | 99.0 |
| High School Diploma | 18 (7.3%) | 16.0 |
| College or Associate's Degree | 0 (0.0%) | 0.0 |
| Bachelor's Degree | 16 (6.5%) | 11.0 |
| Graduate Degree | 72 (29.1%) | 101.0 |
| Total | 247 (100.0%) | 41.0 |
Fertility by Education by Marriage Status in Middletown
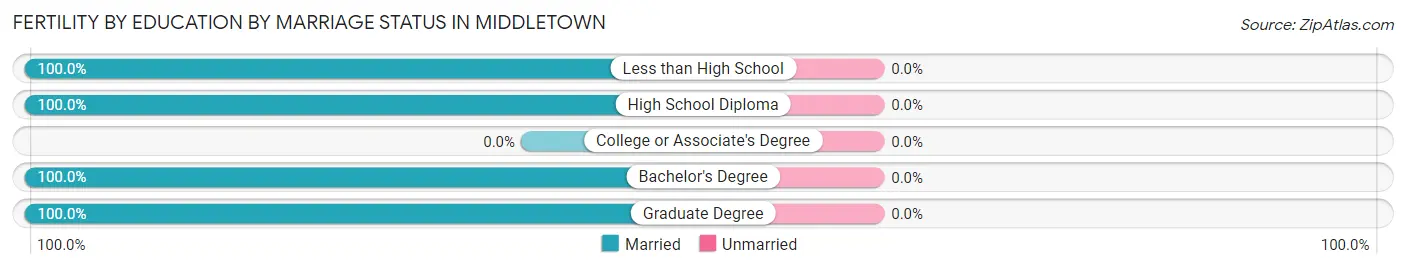
| Educational Attainment | Married | Unmarried |
| Less than High School | 141 (100.0%) | 0 (0.0%) |
| High School Diploma | 18 (100.0%) | 0 (0.0%) |
| College or Associate's Degree | 0 (0.0%) | 0 (0.0%) |
| Bachelor's Degree | 16 (100.0%) | 0 (0.0%) |
| Graduate Degree | 72 (100.0%) | 0 (0.0%) |
| Total | 247 (100.0%) | 0 (0.0%) |
Employment Characteristics in Middletown
Employment by Class of Employer in Middletown
Among the 10,907 employed individuals in Middletown, private company employees (7,317 | 67.1%), not-for-profit organizations (1,573 | 14.4%), and state government employees (602 | 5.5%) make up the most common classes of employment.
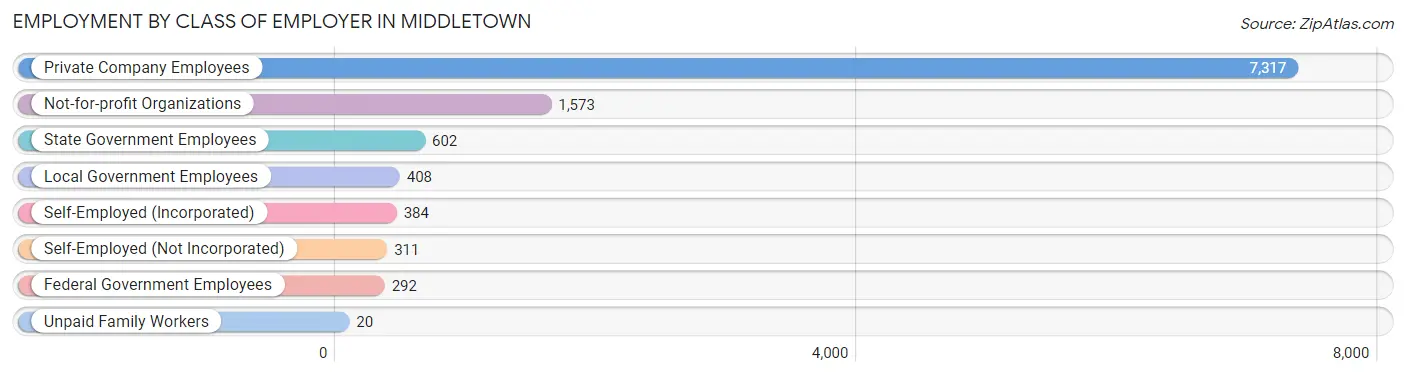
| Employer Class | # Employees | % Employees |
| Private Company Employees | 7,317 | 67.1% |
| Self-Employed (Incorporated) | 384 | 3.5% |
| Self-Employed (Not Incorporated) | 311 | 2.9% |
| Not-for-profit Organizations | 1,573 | 14.4% |
| Local Government Employees | 408 | 3.7% |
| State Government Employees | 602 | 5.5% |
| Federal Government Employees | 292 | 2.7% |
| Unpaid Family Workers | 20 | 0.2% |
| Total | 10,907 | 100.0% |
Employment Status by Age in Middletown
According to the labor force statistics for Middletown, out of the total population over 16 years of age (17,946), 66.5% or 11,934 individuals are in the labor force, with 7.2% or 859 of them unemployed. The age group with the highest labor force participation rate is 30 to 34 years, with 96.1% or 1,823 individuals in the labor force. Within the labor force, the 20 to 24 years age range has the highest percentage of unemployed individuals, with 23.8% or 88 of them being unemployed.
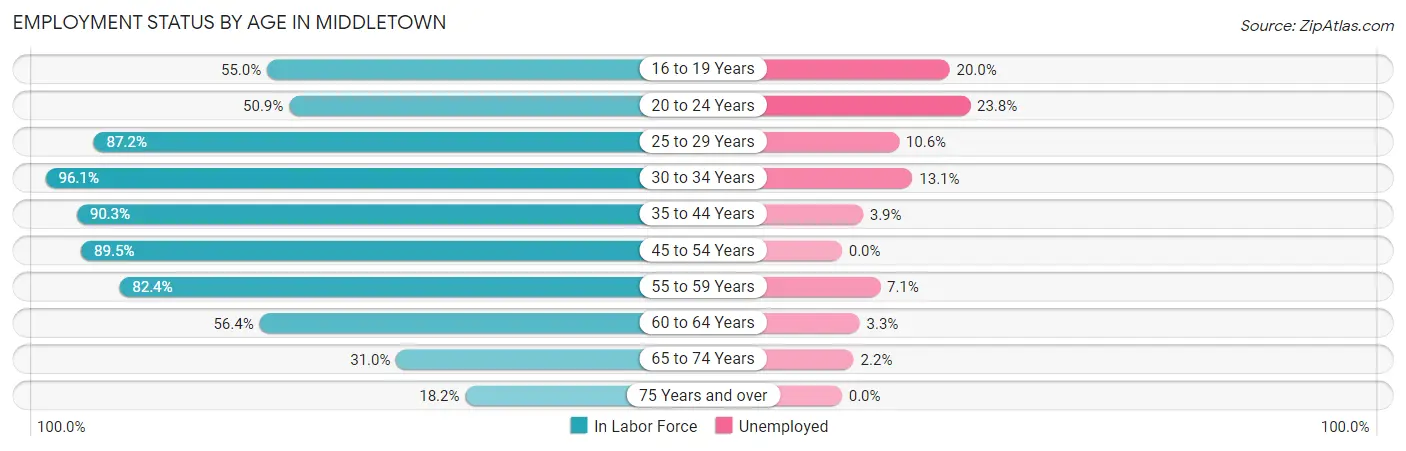
| Age Bracket | In Labor Force | Unemployed |
| 16 to 19 Years | 1,128 (55.0%) | 226 (20.0%) |
| 20 to 24 Years | 370 (50.9%) | 88 (23.8%) |
| 25 to 29 Years | 957 (87.2%) | 101 (10.6%) |
| 30 to 34 Years | 1,823 (96.1%) | 239 (13.1%) |
| 35 to 44 Years | 2,308 (90.3%) | 90 (3.9%) |
| 45 to 54 Years | 2,568 (89.5%) | 0 (0.0%) |
| 55 to 59 Years | 1,037 (82.4%) | 74 (7.1%) |
| 60 to 64 Years | 707 (56.4%) | 23 (3.3%) |
| 65 to 74 Years | 640 (31.0%) | 14 (2.2%) |
| 75 Years and over | 395 (18.2%) | 0 (0.0%) |
| Total | 11,934 (66.5%) | 859 (7.2%) |
Employment Status by Educational Attainment in Middletown
According to labor force statistics for Middletown, 86.0% of individuals (9,402) out of the total population between 25 and 64 years of age (10,933) are in the labor force, with 5.6% or 527 of them being unemployed. The group with the highest labor force participation rate are those with the educational attainment of bachelor's degree or higher, with 95.4% or 4,636 individuals in the labor force. Within the labor force, individuals with high school diploma education have the highest percentage of unemployment, with 22.6% or 334 of them being unemployed.
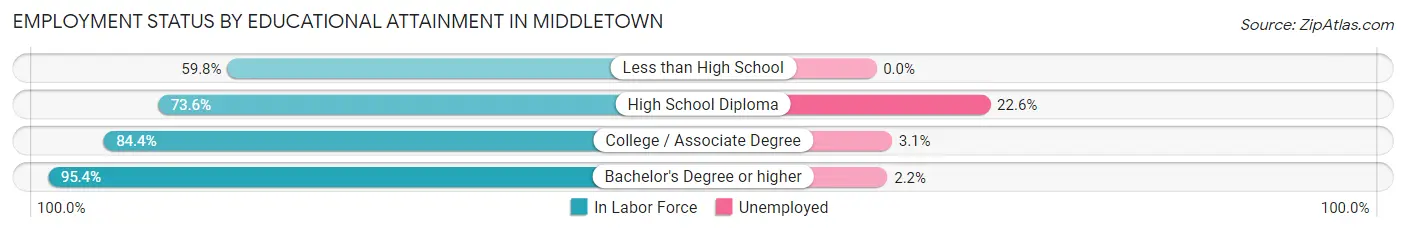
| Educational Attainment | In Labor Force | Unemployed |
| Less than High School | 348 (59.8%) | 0 (0.0%) |
| High School Diploma | 1,479 (73.6%) | 454 (22.6%) |
| College / Associate Degree | 2,938 (84.4%) | 108 (3.1%) |
| Bachelor's Degree or higher | 4,636 (95.4%) | 107 (2.2%) |
| Total | 9,402 (86.0%) | 612 (5.6%) |
Employment Occupations by Sex in Middletown
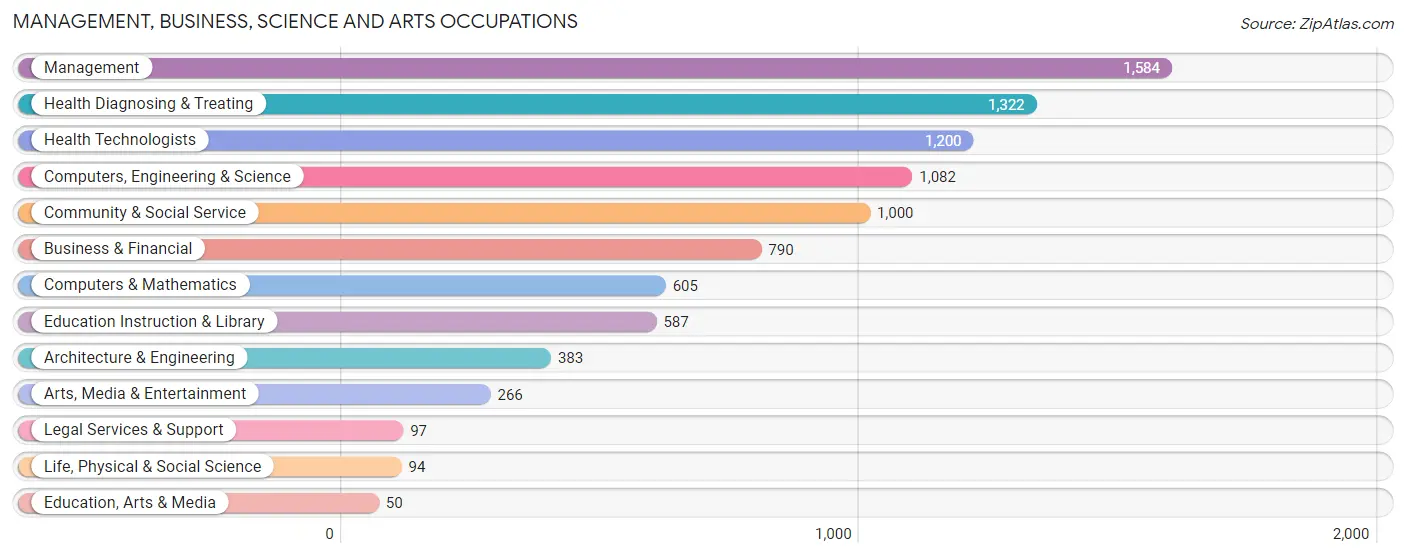
Management, Business, Science and Arts Occupations
The most common Management, Business, Science and Arts occupations in Middletown are Management (1,584 | 14.3%), Health Diagnosing & Treating (1,322 | 12.0%), Health Technologists (1,200 | 10.8%), Computers, Engineering & Science (1,082 | 9.8%), and Community & Social Service (1,000 | 9.0%).
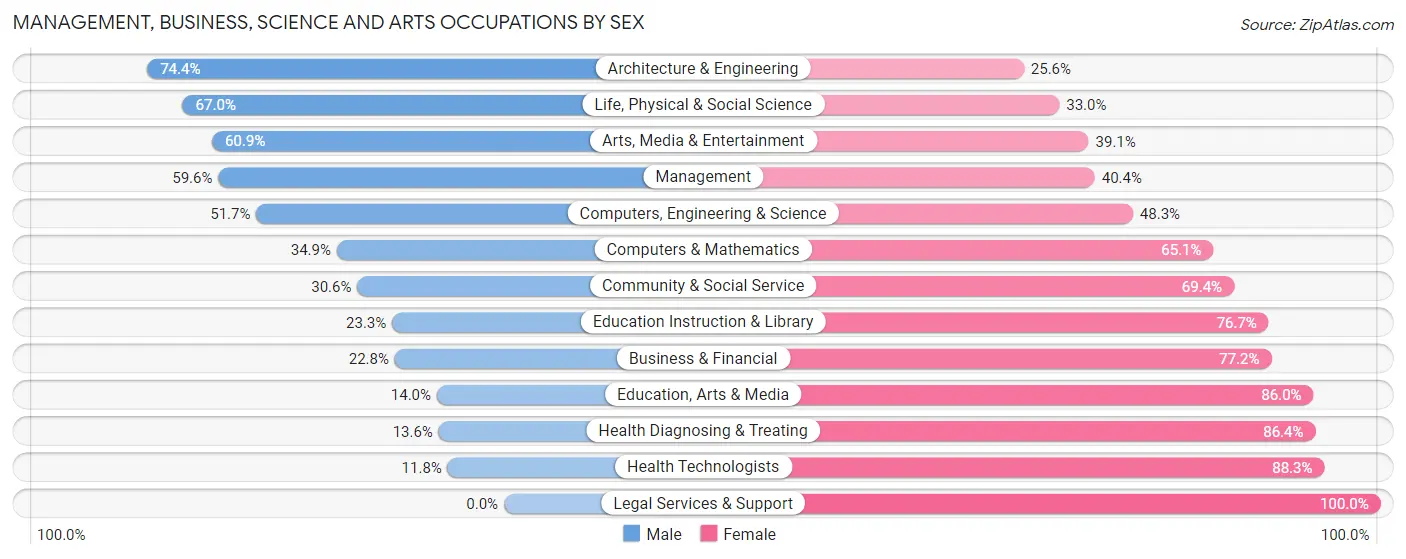
Management, Business, Science and Arts Occupations by Sex
Within the Management, Business, Science and Arts occupations in Middletown, the most male-oriented occupations are Architecture & Engineering (74.4%), Life, Physical & Social Science (67.0%), and Arts, Media & Entertainment (60.9%), while the most female-oriented occupations are Legal Services & Support (100.0%), Health Technologists (88.2%), and Health Diagnosing & Treating (86.4%).
| Occupation | Male | Female |
| Management | 944 (59.6%) | 640 (40.4%) |
| Business & Financial | 180 (22.8%) | 610 (77.2%) |
| Computers, Engineering & Science | 559 (51.7%) | 523 (48.3%) |
| Computers & Mathematics | 211 (34.9%) | 394 (65.1%) |
| Architecture & Engineering | 285 (74.4%) | 98 (25.6%) |
| Life, Physical & Social Science | 63 (67.0%) | 31 (33.0%) |
| Community & Social Service | 306 (30.6%) | 694 (69.4%) |
| Education, Arts & Media | 7 (14.0%) | 43 (86.0%) |
| Legal Services & Support | 0 (0.0%) | 97 (100.0%) |
| Education Instruction & Library | 137 (23.3%) | 450 (76.7%) |
| Arts, Media & Entertainment | 162 (60.9%) | 104 (39.1%) |
| Health Diagnosing & Treating | 180 (13.6%) | 1,142 (86.4%) |
| Health Technologists | 141 (11.7%) | 1,059 (88.2%) |
| Total (Category) | 2,169 (37.5%) | 3,609 (62.5%) |
| Total (Overall) | 5,054 (45.7%) | 6,001 (54.3%) |
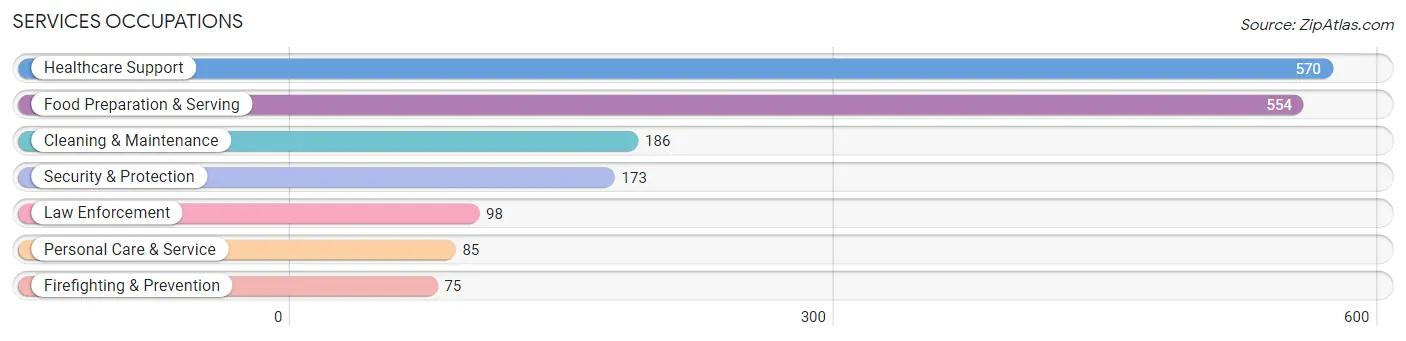
Services Occupations
The most common Services occupations in Middletown are Healthcare Support (570 | 5.2%), Food Preparation & Serving (554 | 5.0%), Cleaning & Maintenance (186 | 1.7%), Security & Protection (173 | 1.6%), and Law Enforcement (98 | 0.9%).
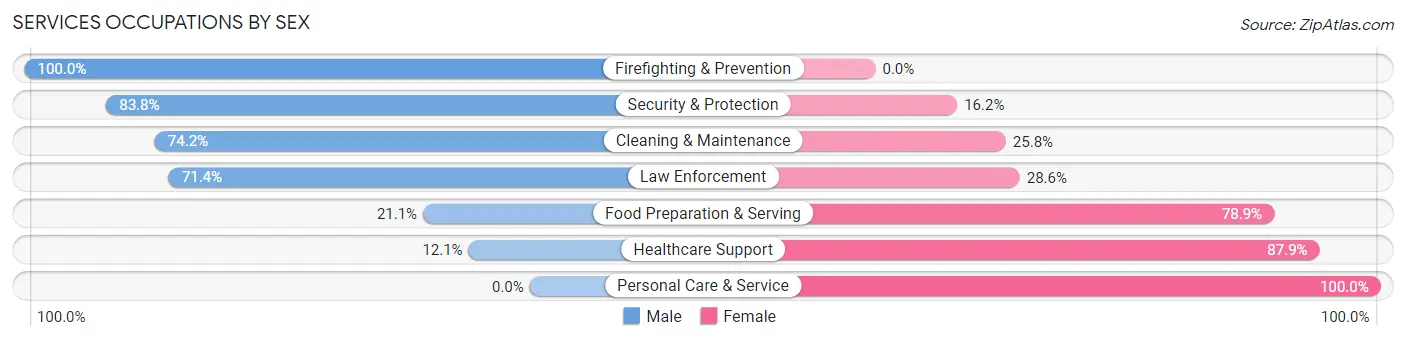
Services Occupations by Sex
Within the Services occupations in Middletown, the most male-oriented occupations are Firefighting & Prevention (100.0%), Security & Protection (83.8%), and Cleaning & Maintenance (74.2%), while the most female-oriented occupations are Personal Care & Service (100.0%), Healthcare Support (87.9%), and Food Preparation & Serving (78.9%).
| Occupation | Male | Female |
| Healthcare Support | 69 (12.1%) | 501 (87.9%) |
| Security & Protection | 145 (83.8%) | 28 (16.2%) |
| Firefighting & Prevention | 75 (100.0%) | 0 (0.0%) |
| Law Enforcement | 70 (71.4%) | 28 (28.6%) |
| Food Preparation & Serving | 117 (21.1%) | 437 (78.9%) |
| Cleaning & Maintenance | 138 (74.2%) | 48 (25.8%) |
| Personal Care & Service | 0 (0.0%) | 85 (100.0%) |
| Total (Category) | 469 (29.9%) | 1,099 (70.1%) |
| Total (Overall) | 5,054 (45.7%) | 6,001 (54.3%) |
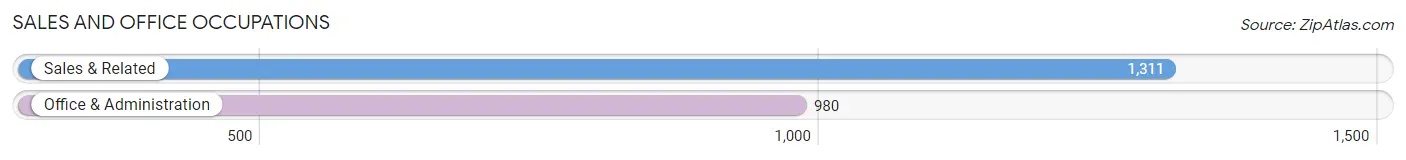
Sales and Office Occupations
The most common Sales and Office occupations in Middletown are Sales & Related (1,311 | 11.9%), and Office & Administration (980 | 8.9%).
Sales and Office Occupations by Sex
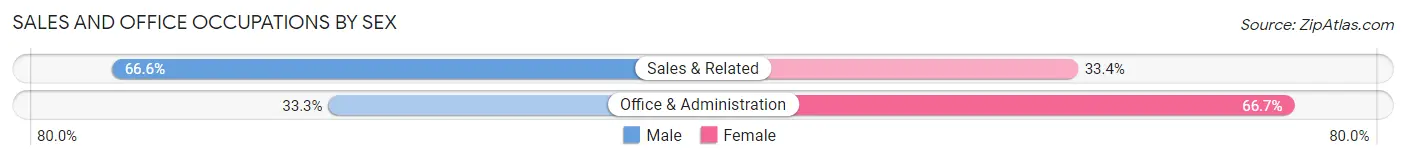
| Occupation | Male | Female |
| Sales & Related | 873 (66.6%) | 438 (33.4%) |
| Office & Administration | 326 (33.3%) | 654 (66.7%) |
| Total (Category) | 1,199 (52.3%) | 1,092 (47.7%) |
| Total (Overall) | 5,054 (45.7%) | 6,001 (54.3%) |
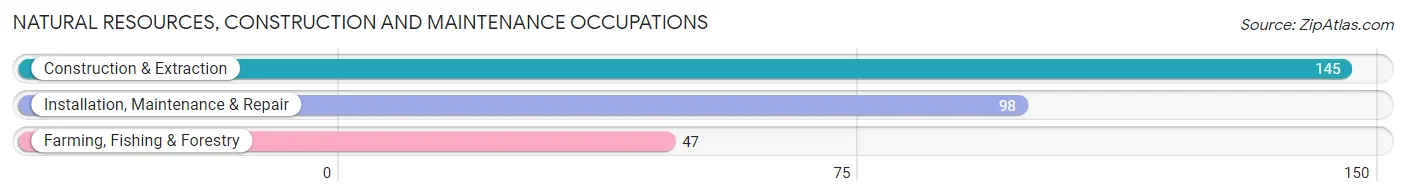
Natural Resources, Construction and Maintenance Occupations
The most common Natural Resources, Construction and Maintenance occupations in Middletown are Construction & Extraction (145 | 1.3%), Installation, Maintenance & Repair (98 | 0.9%), and Farming, Fishing & Forestry (47 | 0.4%).
Natural Resources, Construction and Maintenance Occupations by Sex
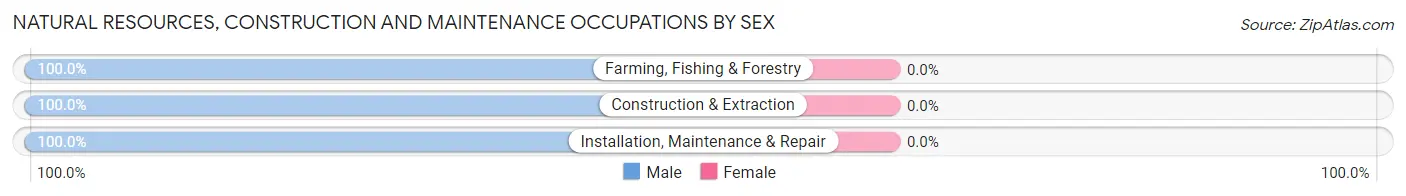
| Occupation | Male | Female |
| Farming, Fishing & Forestry | 47 (100.0%) | 0 (0.0%) |
| Construction & Extraction | 145 (100.0%) | 0 (0.0%) |
| Installation, Maintenance & Repair | 98 (100.0%) | 0 (0.0%) |
| Total (Category) | 290 (100.0%) | 0 (0.0%) |
| Total (Overall) | 5,054 (45.7%) | 6,001 (54.3%) |
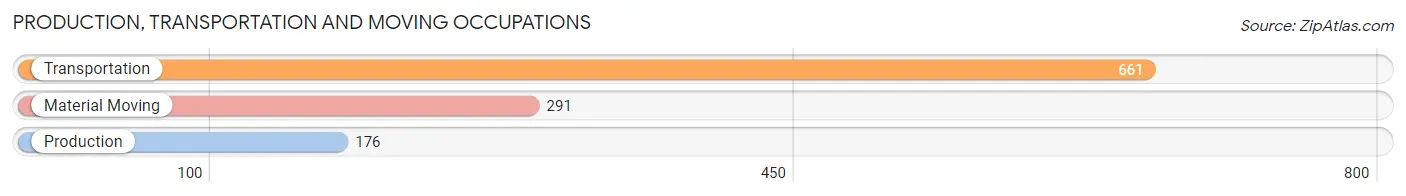
Production, Transportation and Moving Occupations
The most common Production, Transportation and Moving occupations in Middletown are Transportation (661 | 6.0%), Material Moving (291 | 2.6%), and Production (176 | 1.6%).
Production, Transportation and Moving Occupations by Sex

| Occupation | Male | Female |
| Production | 135 (76.7%) | 41 (23.3%) |
| Transportation | 551 (83.4%) | 110 (16.6%) |
| Material Moving | 241 (82.8%) | 50 (17.2%) |
| Total (Category) | 927 (82.2%) | 201 (17.8%) |
| Total (Overall) | 5,054 (45.7%) | 6,001 (54.3%) |
Employment Industries by Sex in Middletown
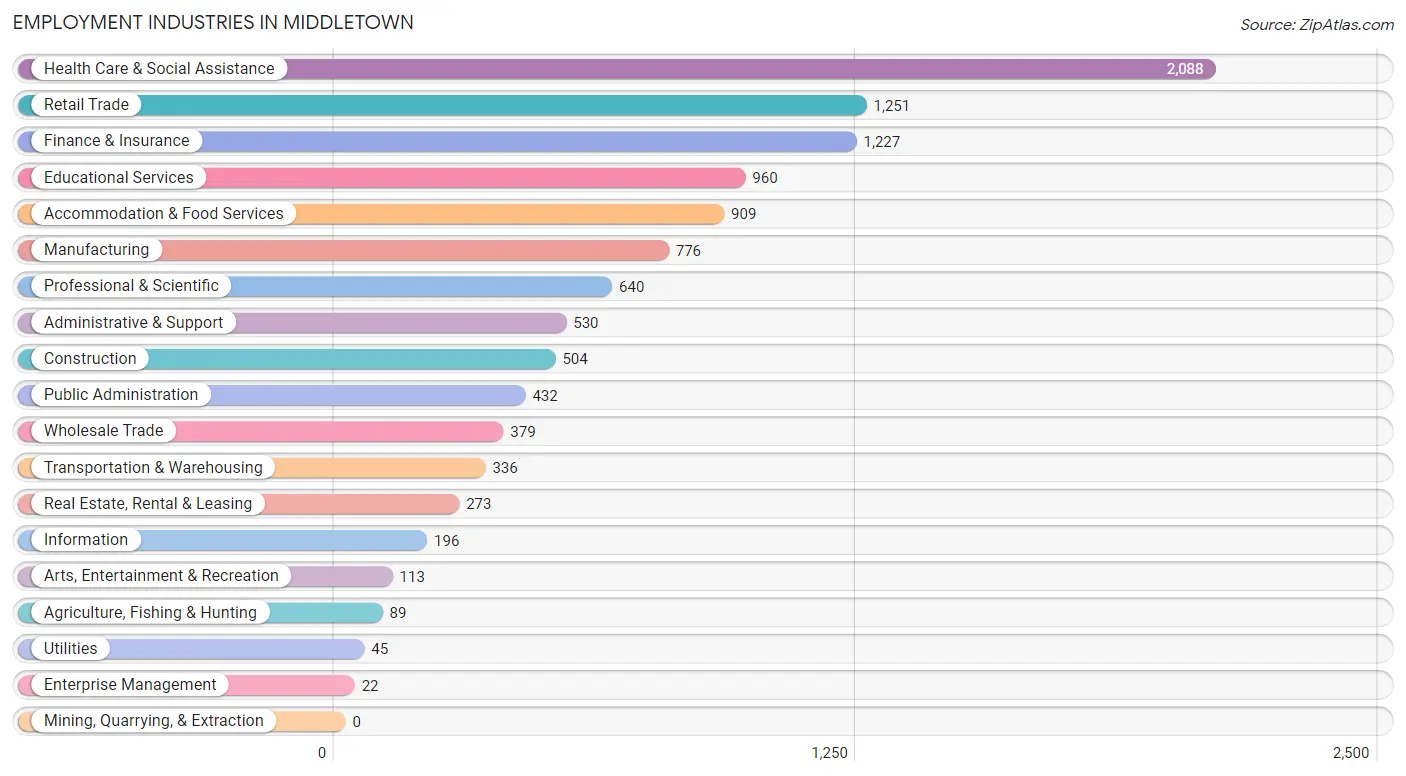
Employment Industries in Middletown
The major employment industries in Middletown include Health Care & Social Assistance (2,088 | 18.9%), Retail Trade (1,251 | 11.3%), Finance & Insurance (1,227 | 11.1%), Educational Services (960 | 8.7%), and Accommodation & Food Services (909 | 8.2%).
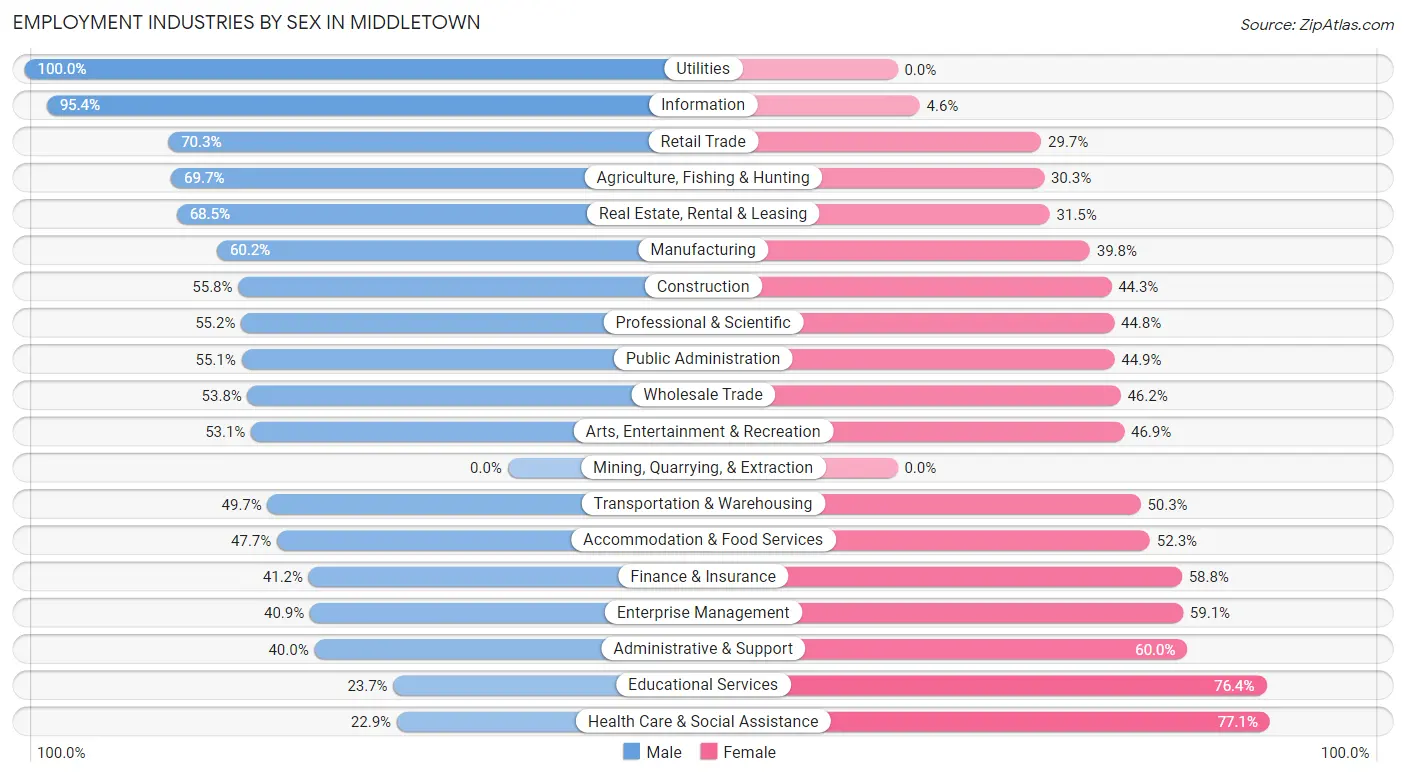
Employment Industries by Sex in Middletown
The Middletown industries that see more men than women are Utilities (100.0%), Information (95.4%), and Retail Trade (70.3%), whereas the industries that tend to have a higher number of women are Health Care & Social Assistance (77.1%), Educational Services (76.3%), and Administrative & Support (60.0%).
| Industry | Male | Female |
| Agriculture, Fishing & Hunting | 62 (69.7%) | 27 (30.3%) |
| Mining, Quarrying, & Extraction | 0 (0.0%) | 0 (0.0%) |
| Construction | 281 (55.7%) | 223 (44.3%) |
| Manufacturing | 467 (60.2%) | 309 (39.8%) |
| Wholesale Trade | 204 (53.8%) | 175 (46.2%) |
| Retail Trade | 879 (70.3%) | 372 (29.7%) |
| Transportation & Warehousing | 167 (49.7%) | 169 (50.3%) |
| Utilities | 45 (100.0%) | 0 (0.0%) |
| Information | 187 (95.4%) | 9 (4.6%) |
| Finance & Insurance | 505 (41.2%) | 722 (58.8%) |
| Real Estate, Rental & Leasing | 187 (68.5%) | 86 (31.5%) |
| Professional & Scientific | 353 (55.2%) | 287 (44.8%) |
| Enterprise Management | 9 (40.9%) | 13 (59.1%) |
| Administrative & Support | 212 (40.0%) | 318 (60.0%) |
| Educational Services | 227 (23.6%) | 733 (76.3%) |
| Health Care & Social Assistance | 479 (22.9%) | 1,609 (77.1%) |
| Arts, Entertainment & Recreation | 60 (53.1%) | 53 (46.9%) |
| Accommodation & Food Services | 434 (47.7%) | 475 (52.3%) |
| Public Administration | 238 (55.1%) | 194 (44.9%) |
| Total | 5,054 (45.7%) | 6,001 (54.3%) |
Education in Middletown
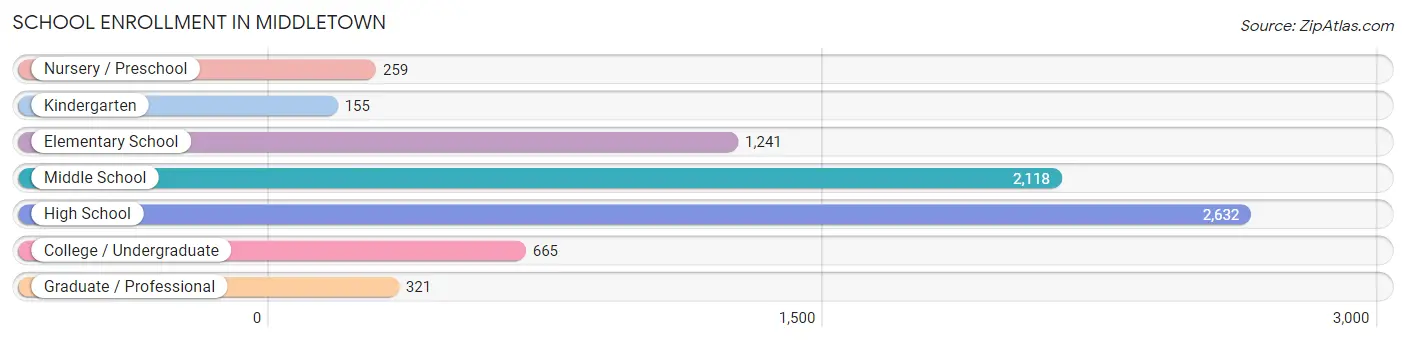
School Enrollment in Middletown
The most common levels of schooling among the 7,391 students in Middletown are high school (2,632 | 35.6%), middle school (2,118 | 28.7%), and elementary school (1,241 | 16.8%).
| School Level | # Students | % Students |
| Nursery / Preschool | 259 | 3.5% |
| Kindergarten | 155 | 2.1% |
| Elementary School | 1,241 | 16.8% |
| Middle School | 2,118 | 28.7% |
| High School | 2,632 | 35.6% |
| College / Undergraduate | 665 | 9.0% |
| Graduate / Professional | 321 | 4.3% |
| Total | 7,391 | 100.0% |
School Enrollment by Age by Funding Source in Middletown
Out of a total of 7,391 students who are enrolled in schools in Middletown, 687 (9.3%) attend a private institution, while the remaining 6,704 (90.7%) are enrolled in public schools. The age group of 35 years and over has the highest likelihood of being enrolled in private schools, with 204 (82.6% in the age bracket) enrolled. Conversely, the age group of 5 to 9 year old has the lowest likelihood of being enrolled in a private school, with 1,180 (95.5% in the age bracket) attending a public institution.
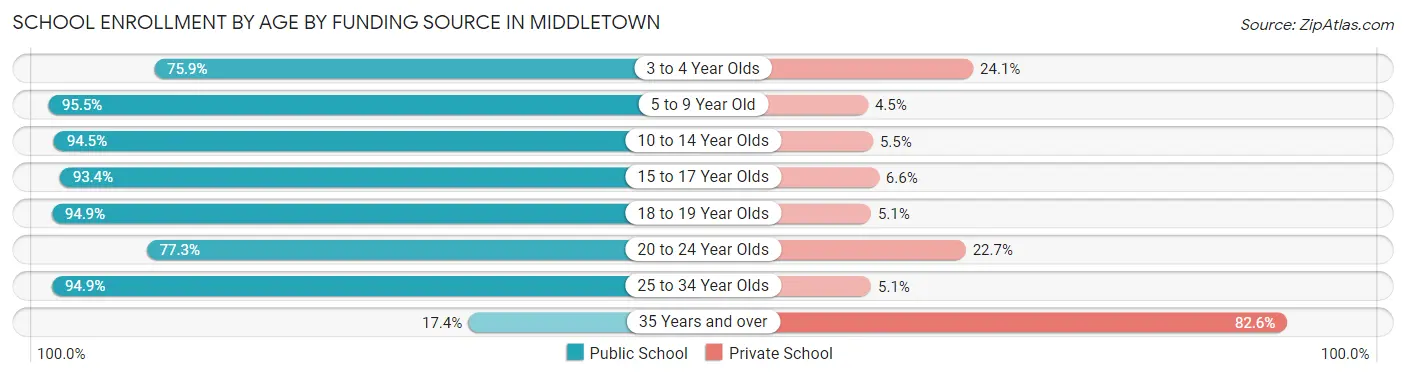
| Age Bracket | Public School | Private School |
| 3 to 4 Year Olds | 151 (75.9%) | 48 (24.1%) |
| 5 to 9 Year Old | 1,180 (95.5%) | 56 (4.5%) |
| 10 to 14 Year Olds | 2,598 (94.5%) | 150 (5.5%) |
| 15 to 17 Year Olds | 1,382 (93.4%) | 97 (6.6%) |
| 18 to 19 Year Olds | 879 (94.9%) | 47 (5.1%) |
| 20 to 24 Year Olds | 248 (77.3%) | 73 (22.7%) |
| 25 to 34 Year Olds | 223 (94.9%) | 12 (5.1%) |
| 35 Years and over | 43 (17.4%) | 204 (82.6%) |
| Total | 6,704 (90.7%) | 687 (9.3%) |
Educational Attainment by Field of Study in Middletown
Business (1,899 | 28.2%), science & technology (927 | 13.8%), education (867 | 12.9%), bio, nature & agricultural (480 | 7.1%), and engineering (411 | 6.1%) are the most common fields of study among 6,737 individuals in Middletown who have obtained a bachelor's degree or higher.
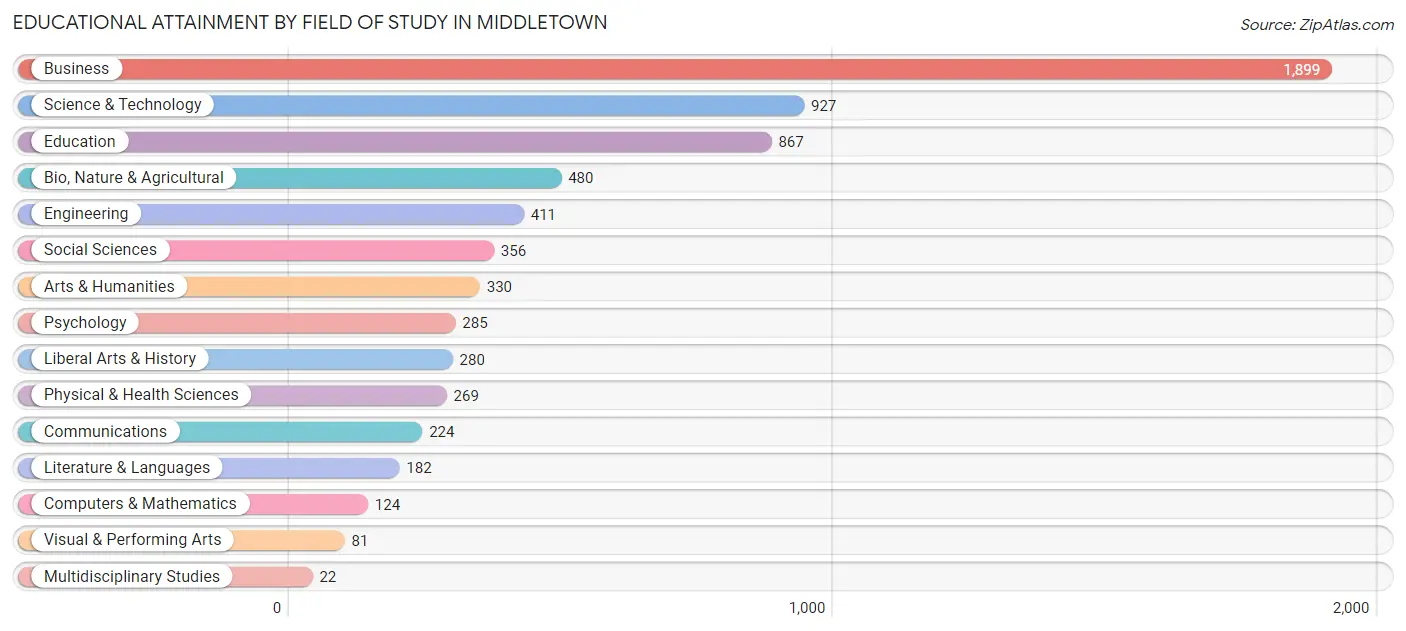
| Field of Study | # Graduates | % Graduates |
| Computers & Mathematics | 124 | 1.8% |
| Bio, Nature & Agricultural | 480 | 7.1% |
| Physical & Health Sciences | 269 | 4.0% |
| Psychology | 285 | 4.2% |
| Social Sciences | 356 | 5.3% |
| Engineering | 411 | 6.1% |
| Multidisciplinary Studies | 22 | 0.3% |
| Science & Technology | 927 | 13.8% |
| Business | 1,899 | 28.2% |
| Education | 867 | 12.9% |
| Literature & Languages | 182 | 2.7% |
| Liberal Arts & History | 280 | 4.2% |
| Visual & Performing Arts | 81 | 1.2% |
| Communications | 224 | 3.3% |
| Arts & Humanities | 330 | 4.9% |
| Total | 6,737 | 100.0% |
Transportation & Commute in Middletown
Vehicle Availability by Sex in Middletown
The most prevalent vehicle ownership categories in Middletown are males with 2 vehicles (2,898, accounting for 57.5%) and females with 2 vehicles (2,989, making up 49.4%).
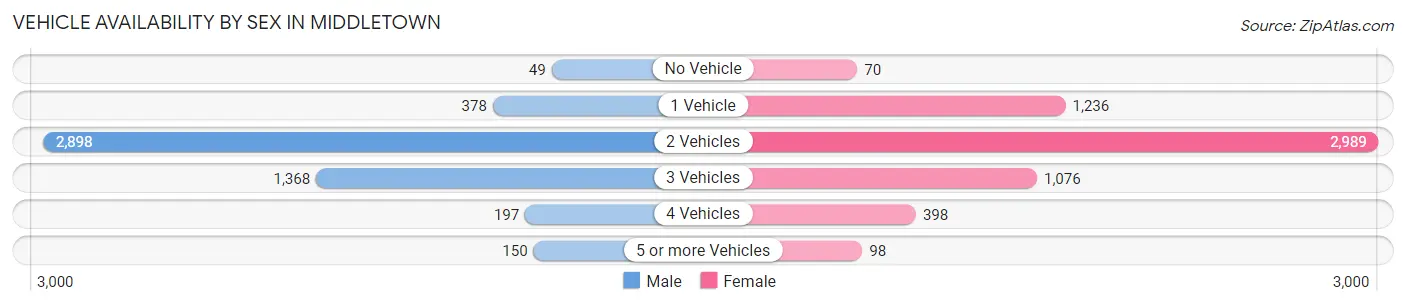
| Vehicles Available | Male | Female |
| No Vehicle | 49 (1.0%) | 70 (1.2%) |
| 1 Vehicle | 378 (7.5%) | 1,236 (21.1%) |
| 2 Vehicles | 2,898 (57.5%) | 2,989 (50.9%) |
| 3 Vehicles | 1,368 (27.1%) | 1,076 (18.3%) |
| 4 Vehicles | 197 (3.9%) | 398 (6.8%) |
| 5 or more Vehicles | 150 (3.0%) | 98 (1.7%) |
| Total | 5,040 (100.0%) | 5,867 (100.0%) |
Commute Time in Middletown
The most frequently occuring commute durations in Middletown are 30 to 34 minutes (1,784 commuters, 18.5%), 25 to 29 minutes (1,303 commuters, 13.5%), and 20 to 24 minutes (1,049 commuters, 10.9%).
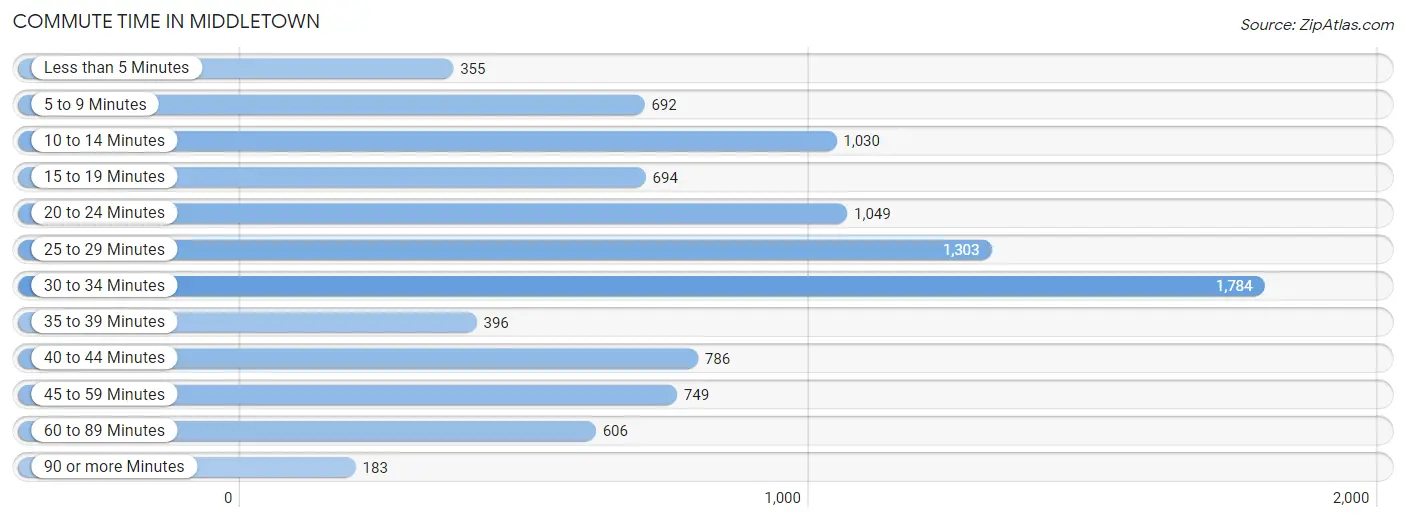
| Commute Time | # Commuters | % Commuters |
| Less than 5 Minutes | 355 | 3.7% |
| 5 to 9 Minutes | 692 | 7.2% |
| 10 to 14 Minutes | 1,030 | 10.7% |
| 15 to 19 Minutes | 694 | 7.2% |
| 20 to 24 Minutes | 1,049 | 10.9% |
| 25 to 29 Minutes | 1,303 | 13.5% |
| 30 to 34 Minutes | 1,784 | 18.5% |
| 35 to 39 Minutes | 396 | 4.1% |
| 40 to 44 Minutes | 786 | 8.2% |
| 45 to 59 Minutes | 749 | 7.8% |
| 60 to 89 Minutes | 606 | 6.3% |
| 90 or more Minutes | 183 | 1.9% |
Commute Time by Sex in Middletown
The most common commute times in Middletown are 25 to 29 minutes (743 commuters, 16.3%) for males and 30 to 34 minutes (1,304 commuters, 25.8%) for females.
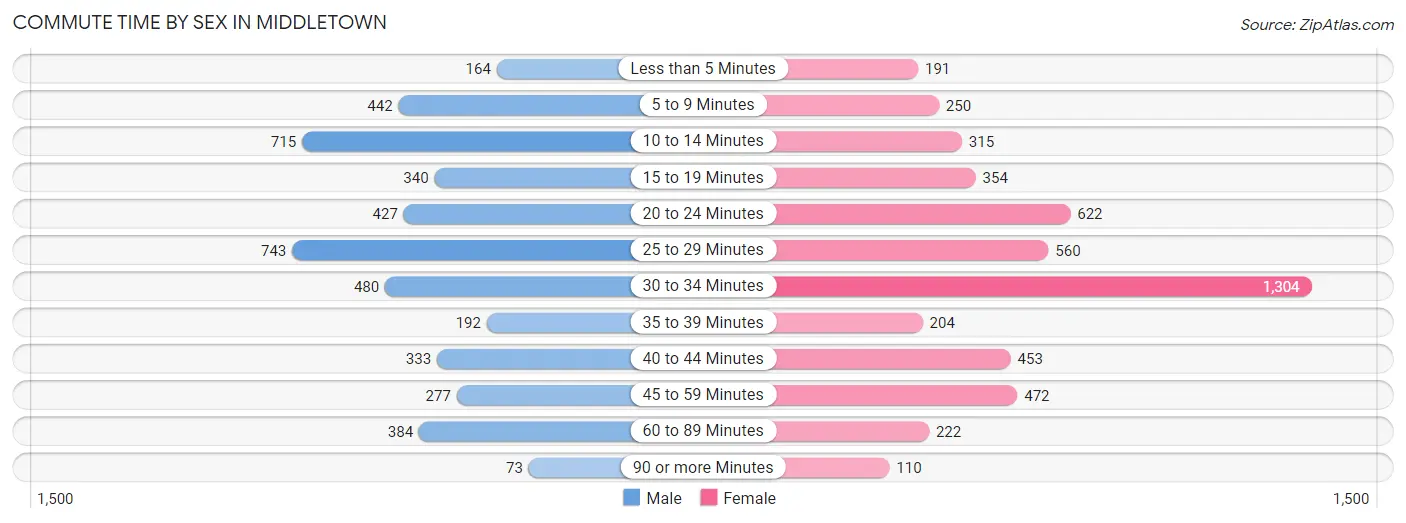
| Commute Time | Male | Female |
| Less than 5 Minutes | 164 (3.6%) | 191 (3.8%) |
| 5 to 9 Minutes | 442 (9.7%) | 250 (4.9%) |
| 10 to 14 Minutes | 715 (15.7%) | 315 (6.2%) |
| 15 to 19 Minutes | 340 (7.4%) | 354 (7.0%) |
| 20 to 24 Minutes | 427 (9.3%) | 622 (12.3%) |
| 25 to 29 Minutes | 743 (16.3%) | 560 (11.1%) |
| 30 to 34 Minutes | 480 (10.5%) | 1,304 (25.8%) |
| 35 to 39 Minutes | 192 (4.2%) | 204 (4.0%) |
| 40 to 44 Minutes | 333 (7.3%) | 453 (9.0%) |
| 45 to 59 Minutes | 277 (6.1%) | 472 (9.3%) |
| 60 to 89 Minutes | 384 (8.4%) | 222 (4.4%) |
| 90 or more Minutes | 73 (1.6%) | 110 (2.2%) |
Time of Departure to Work by Sex in Middletown
The most frequent times of departure to work in Middletown are 7:00 AM to 7:29 AM (589, 12.9%) for males and 7:00 AM to 7:29 AM (880, 17.4%) for females.
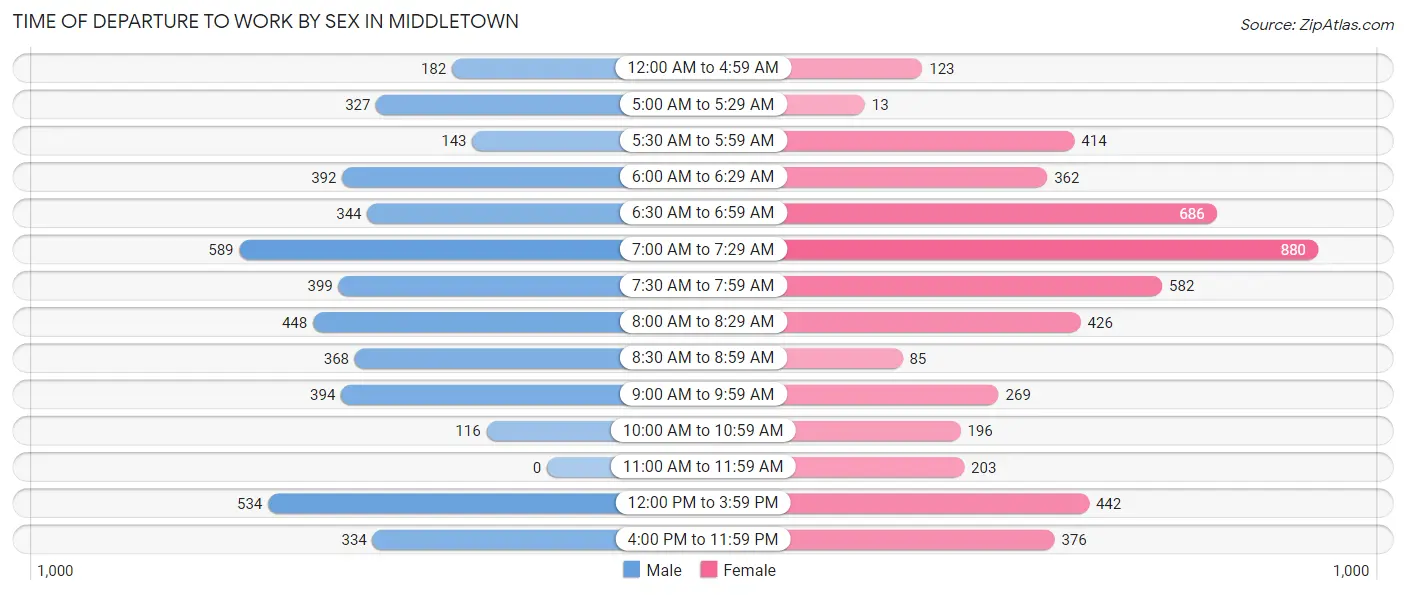
| Time of Departure | Male | Female |
| 12:00 AM to 4:59 AM | 182 (4.0%) | 123 (2.4%) |
| 5:00 AM to 5:29 AM | 327 (7.2%) | 13 (0.3%) |
| 5:30 AM to 5:59 AM | 143 (3.1%) | 414 (8.2%) |
| 6:00 AM to 6:29 AM | 392 (8.6%) | 362 (7.2%) |
| 6:30 AM to 6:59 AM | 344 (7.5%) | 686 (13.6%) |
| 7:00 AM to 7:29 AM | 589 (12.9%) | 880 (17.4%) |
| 7:30 AM to 7:59 AM | 399 (8.7%) | 582 (11.5%) |
| 8:00 AM to 8:29 AM | 448 (9.8%) | 426 (8.4%) |
| 8:30 AM to 8:59 AM | 368 (8.1%) | 85 (1.7%) |
| 9:00 AM to 9:59 AM | 394 (8.6%) | 269 (5.3%) |
| 10:00 AM to 10:59 AM | 116 (2.5%) | 196 (3.9%) |
| 11:00 AM to 11:59 AM | 0 (0.0%) | 203 (4.0%) |
| 12:00 PM to 3:59 PM | 534 (11.7%) | 442 (8.7%) |
| 4:00 PM to 11:59 PM | 334 (7.3%) | 376 (7.4%) |
| Total | 4,570 (100.0%) | 5,057 (100.0%) |
Housing Occupancy in Middletown
Occupancy by Ownership in Middletown
Of the total 8,444 dwellings in Middletown, owner-occupied units account for 6,186 (73.3%), while renter-occupied units make up 2,258 (26.7%).
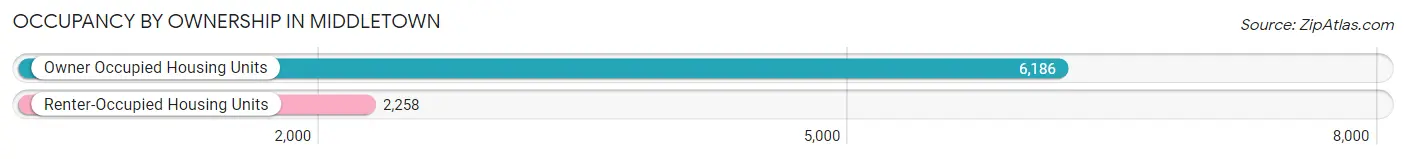
| Occupancy | # Housing Units | % Housing Units |
| Owner Occupied Housing Units | 6,186 | 73.3% |
| Renter-Occupied Housing Units | 2,258 | 26.7% |
| Total Occupied Housing Units | 8,444 | 100.0% |
Occupancy by Household Size in Middletown
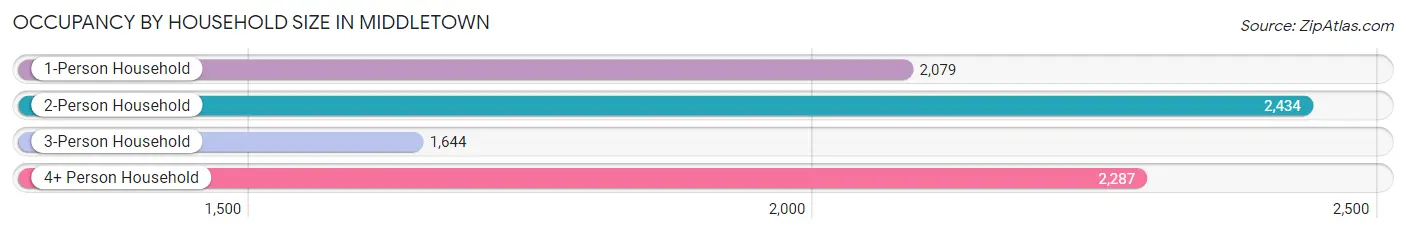
| Household Size | # Housing Units | % Housing Units |
| 1-Person Household | 2,079 | 24.6% |
| 2-Person Household | 2,434 | 28.8% |
| 3-Person Household | 1,644 | 19.5% |
| 4+ Person Household | 2,287 | 27.1% |
| Total Housing Units | 8,444 | 100.0% |
Occupancy by Ownership by Household Size in Middletown
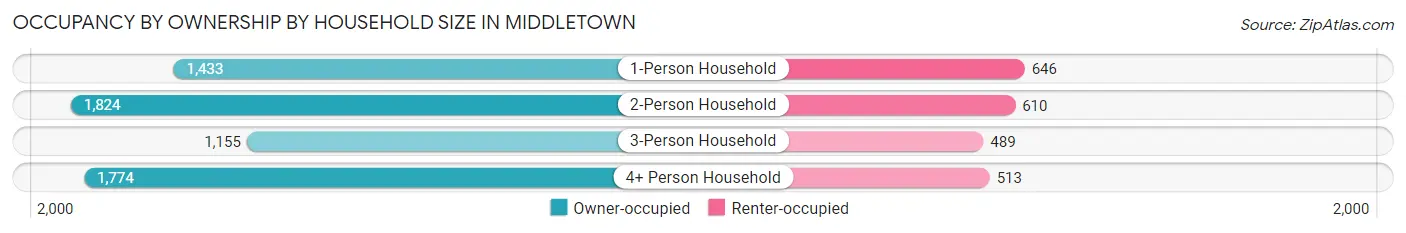
| Household Size | Owner-occupied | Renter-occupied |
| 1-Person Household | 1,433 (68.9%) | 646 (31.1%) |
| 2-Person Household | 1,824 (74.9%) | 610 (25.1%) |
| 3-Person Household | 1,155 (70.3%) | 489 (29.7%) |
| 4+ Person Household | 1,774 (77.6%) | 513 (22.4%) |
| Total Housing Units | 6,186 (73.3%) | 2,258 (26.7%) |
Occupancy by Educational Attainment in Middletown
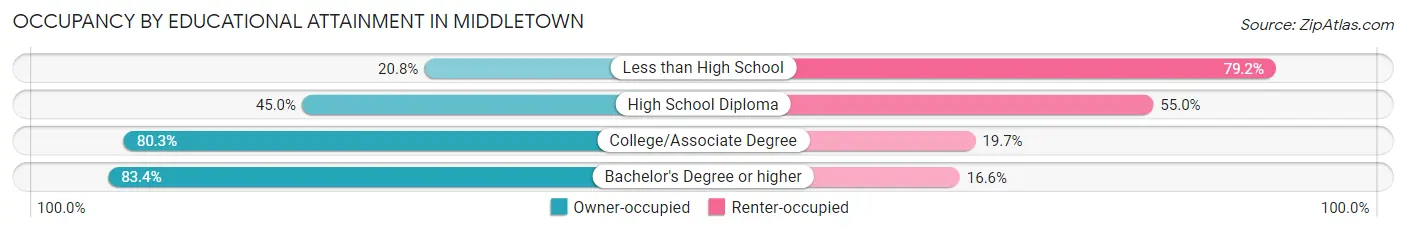
| Household Size | Owner-occupied | Renter-occupied |
| Less than High School | 53 (20.8%) | 202 (79.2%) |
| High School Diploma | 715 (45.0%) | 873 (55.0%) |
| College/Associate Degree | 2,286 (80.3%) | 560 (19.7%) |
| Bachelor's Degree or higher | 3,132 (83.4%) | 623 (16.6%) |
Occupancy by Age of Householder in Middletown
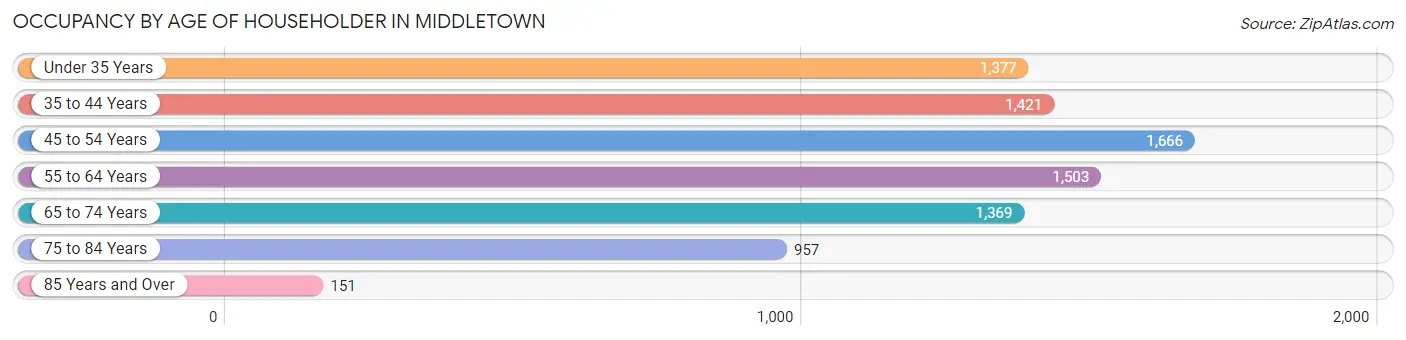
| Age Bracket | # Households | % Households |
| Under 35 Years | 1,377 | 16.3% |
| 35 to 44 Years | 1,421 | 16.8% |
| 45 to 54 Years | 1,666 | 19.7% |
| 55 to 64 Years | 1,503 | 17.8% |
| 65 to 74 Years | 1,369 | 16.2% |
| 75 to 84 Years | 957 | 11.3% |
| 85 Years and Over | 151 | 1.8% |
| Total | 8,444 | 100.0% |
Housing Finances in Middletown
Median Income by Occupancy in Middletown
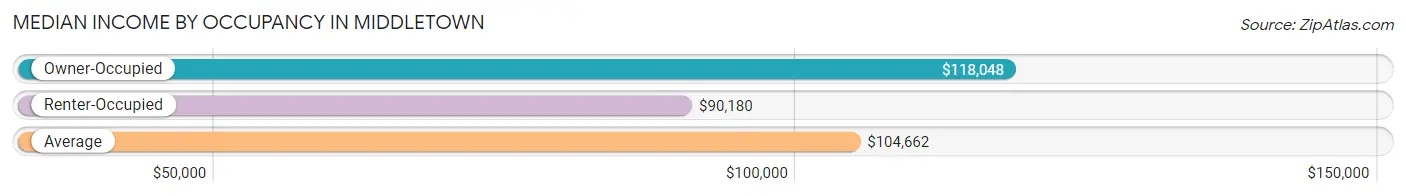
| Occupancy Type | # Households | Median Income |
| Owner-Occupied | 6,186 (73.3%) | $118,048 |
| Renter-Occupied | 2,258 (26.7%) | $90,180 |
| Average | 8,444 (100.0%) | $104,662 |
Occupancy by Householder Income Bracket in Middletown
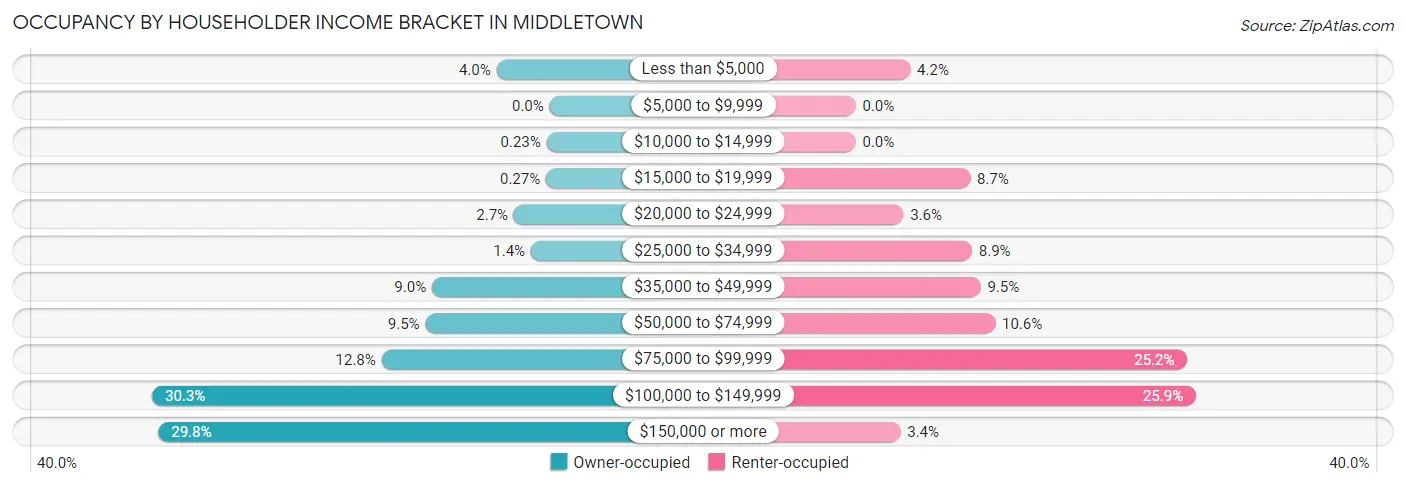
| Income Bracket | Owner-occupied | Renter-occupied |
| Less than $5,000 | 250 (4.0%) | 94 (4.2%) |
| $5,000 to $9,999 | 0 (0.0%) | 0 (0.0%) |
| $10,000 to $14,999 | 14 (0.2%) | 0 (0.0%) |
| $15,000 to $19,999 | 17 (0.3%) | 197 (8.7%) |
| $20,000 to $24,999 | 168 (2.7%) | 82 (3.6%) |
| $25,000 to $34,999 | 88 (1.4%) | 200 (8.9%) |
| $35,000 to $49,999 | 554 (9.0%) | 215 (9.5%) |
| $50,000 to $74,999 | 585 (9.5%) | 240 (10.6%) |
| $75,000 to $99,999 | 792 (12.8%) | 569 (25.2%) |
| $100,000 to $149,999 | 1,874 (30.3%) | 584 (25.9%) |
| $150,000 or more | 1,844 (29.8%) | 77 (3.4%) |
| Total | 6,186 (100.0%) | 2,258 (100.0%) |
Monthly Housing Cost Tiers in Middletown
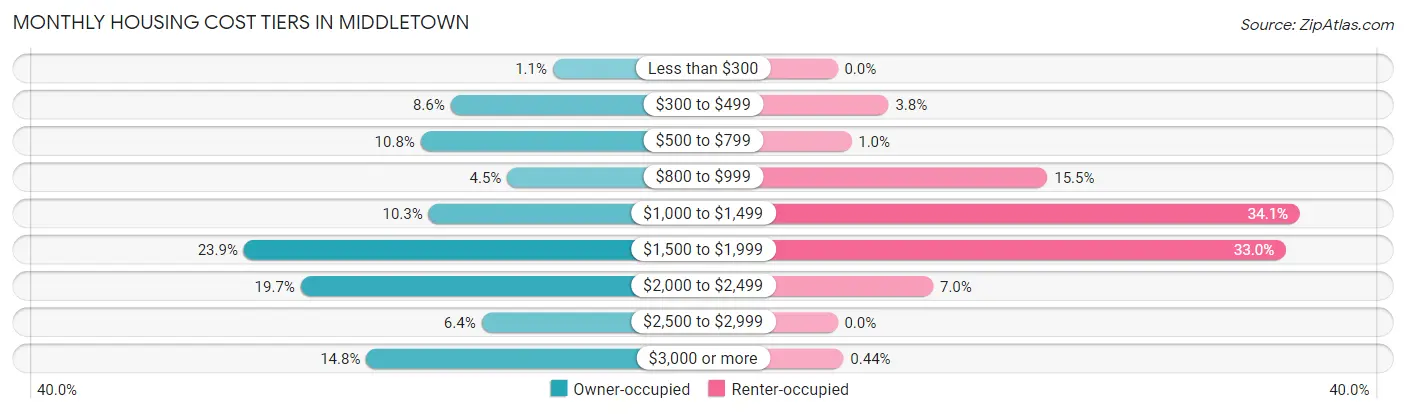
| Monthly Cost | Owner-occupied | Renter-occupied |
| Less than $300 | 68 (1.1%) | 0 (0.0%) |
| $300 to $499 | 534 (8.6%) | 85 (3.8%) |
| $500 to $799 | 670 (10.8%) | 23 (1.0%) |
| $800 to $999 | 276 (4.5%) | 349 (15.5%) |
| $1,000 to $1,499 | 634 (10.2%) | 769 (34.1%) |
| $1,500 to $1,999 | 1,476 (23.9%) | 746 (33.0%) |
| $2,000 to $2,499 | 1,217 (19.7%) | 159 (7.0%) |
| $2,500 to $2,999 | 393 (6.4%) | 0 (0.0%) |
| $3,000 or more | 918 (14.8%) | 10 (0.4%) |
| Total | 6,186 (100.0%) | 2,258 (100.0%) |
Physical Housing Characteristics in Middletown
Housing Structures in Middletown
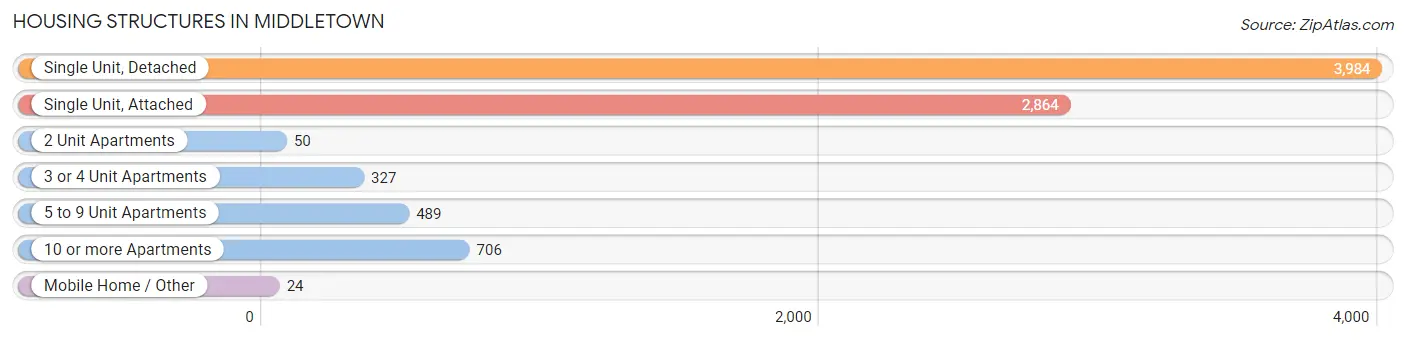
| Structure Type | # Housing Units | % Housing Units |
| Single Unit, Detached | 3,984 | 47.2% |
| Single Unit, Attached | 2,864 | 33.9% |
| 2 Unit Apartments | 50 | 0.6% |
| 3 or 4 Unit Apartments | 327 | 3.9% |
| 5 to 9 Unit Apartments | 489 | 5.8% |
| 10 or more Apartments | 706 | 8.4% |
| Mobile Home / Other | 24 | 0.3% |
| Total | 8,444 | 100.0% |
Housing Structures by Occupancy in Middletown
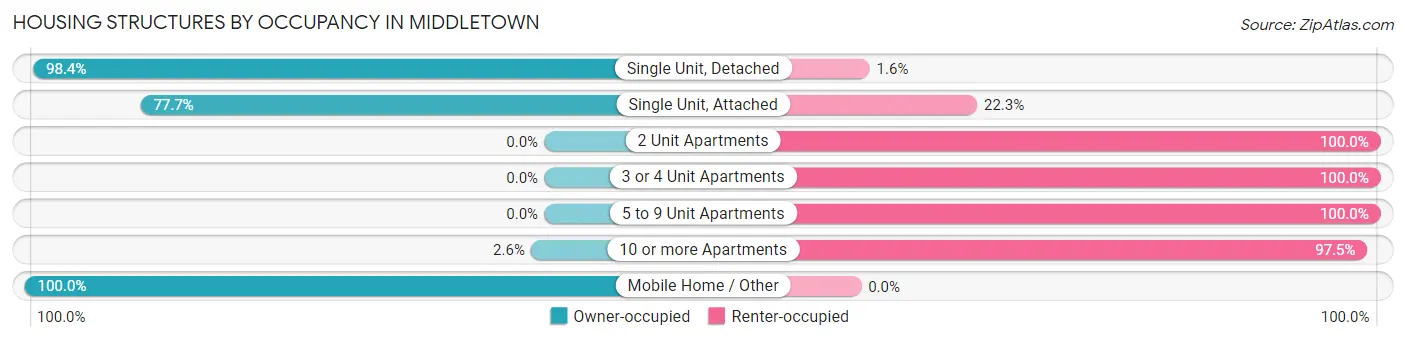
| Structure Type | Owner-occupied | Renter-occupied |
| Single Unit, Detached | 3,919 (98.4%) | 65 (1.6%) |
| Single Unit, Attached | 2,225 (77.7%) | 639 (22.3%) |
| 2 Unit Apartments | 0 (0.0%) | 50 (100.0%) |
| 3 or 4 Unit Apartments | 0 (0.0%) | 327 (100.0%) |
| 5 to 9 Unit Apartments | 0 (0.0%) | 489 (100.0%) |
| 10 or more Apartments | 18 (2.5%) | 688 (97.5%) |
| Mobile Home / Other | 24 (100.0%) | 0 (0.0%) |
| Total | 6,186 (73.3%) | 2,258 (26.7%) |
Housing Structures by Number of Rooms in Middletown
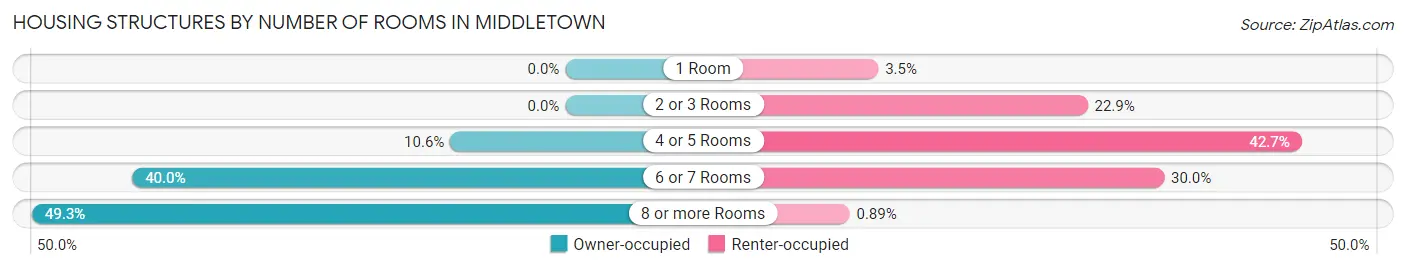
| Number of Rooms | Owner-occupied | Renter-occupied |
| 1 Room | 0 (0.0%) | 80 (3.5%) |
| 2 or 3 Rooms | 0 (0.0%) | 517 (22.9%) |
| 4 or 5 Rooms | 658 (10.6%) | 964 (42.7%) |
| 6 or 7 Rooms | 2,477 (40.0%) | 677 (30.0%) |
| 8 or more Rooms | 3,051 (49.3%) | 20 (0.9%) |
| Total | 6,186 (100.0%) | 2,258 (100.0%) |
Housing Structure by Heating Type in Middletown
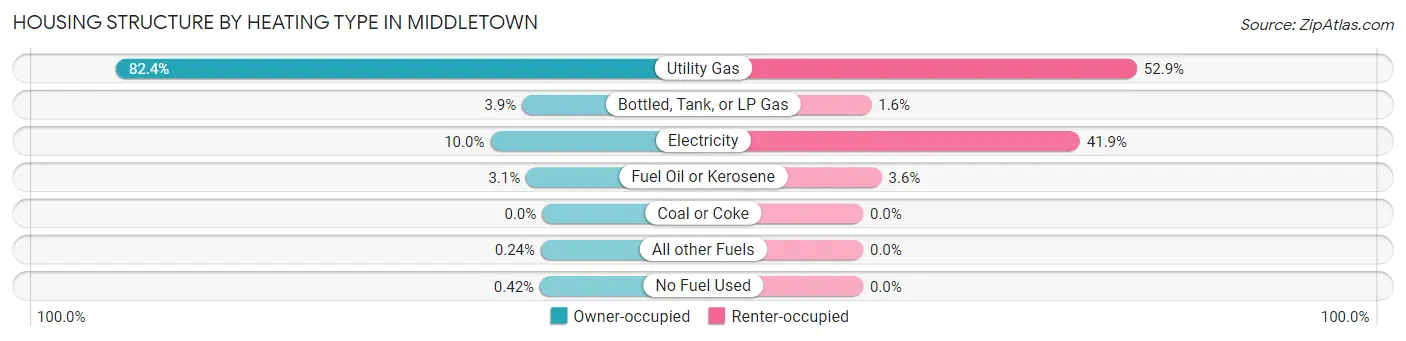
| Heating Type | Owner-occupied | Renter-occupied |
| Utility Gas | 5,094 (82.4%) | 1,195 (52.9%) |
| Bottled, Tank, or LP Gas | 239 (3.9%) | 36 (1.6%) |
| Electricity | 620 (10.0%) | 946 (41.9%) |
| Fuel Oil or Kerosene | 192 (3.1%) | 81 (3.6%) |
| Coal or Coke | 0 (0.0%) | 0 (0.0%) |
| All other Fuels | 15 (0.2%) | 0 (0.0%) |
| No Fuel Used | 26 (0.4%) | 0 (0.0%) |
| Total | 6,186 (100.0%) | 2,258 (100.0%) |
Household Vehicle Usage in Middletown
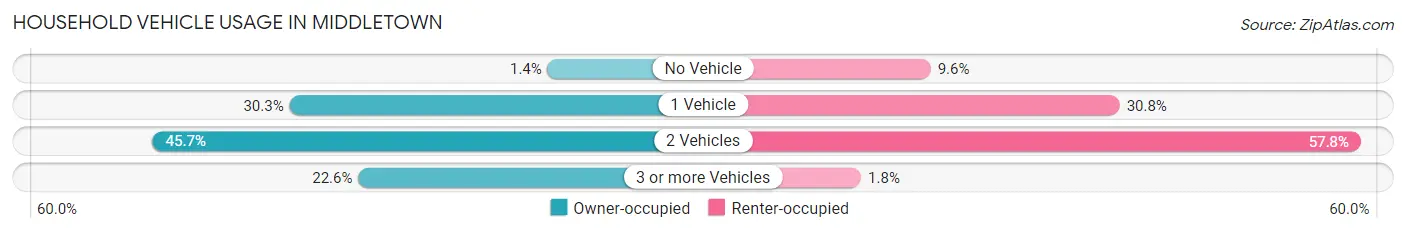
| Vehicles per Household | Owner-occupied | Renter-occupied |
| No Vehicle | 87 (1.4%) | 217 (9.6%) |
| 1 Vehicle | 1,876 (30.3%) | 695 (30.8%) |
| 2 Vehicles | 2,824 (45.7%) | 1,305 (57.8%) |
| 3 or more Vehicles | 1,399 (22.6%) | 41 (1.8%) |
| Total | 6,186 (100.0%) | 2,258 (100.0%) |
Real Estate & Mortgages in Middletown
Real Estate and Mortgage Overview in Middletown
| Characteristic | Without Mortgage | With Mortgage |
| Housing Units | 1,517 | 4,669 |
| Median Property Value | $353,100 | $369,200 |
| Median Household Income | $102,951 | $1,492 |
| Monthly Housing Costs | $548 | $918 |
| Real Estate Taxes | $2,187 | $243 |
Property Value by Mortgage Status in Middletown
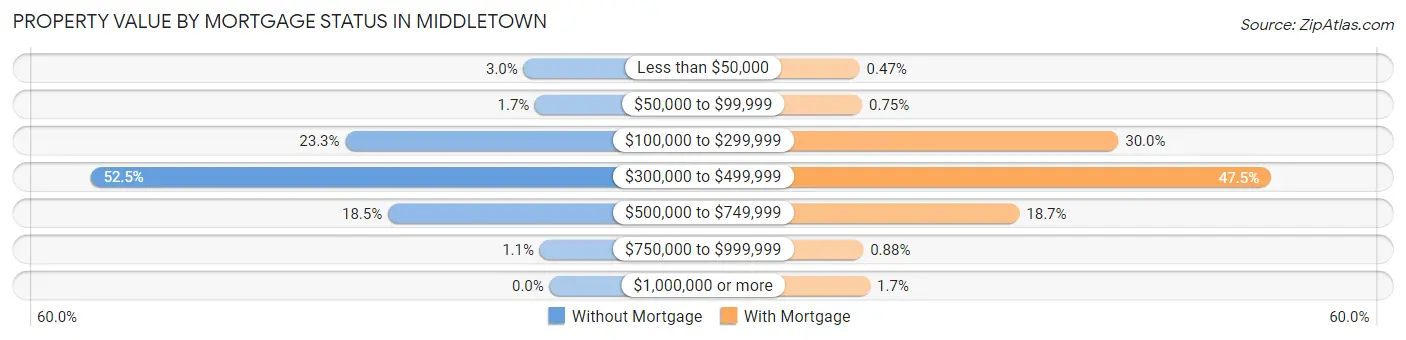
| Property Value | Without Mortgage | With Mortgage |
| Less than $50,000 | 45 (3.0%) | 22 (0.5%) |
| $50,000 to $99,999 | 25 (1.7%) | 35 (0.7%) |
| $100,000 to $299,999 | 354 (23.3%) | 1,402 (30.0%) |
| $300,000 to $499,999 | 796 (52.5%) | 2,217 (47.5%) |
| $500,000 to $749,999 | 280 (18.5%) | 874 (18.7%) |
| $750,000 to $999,999 | 17 (1.1%) | 41 (0.9%) |
| $1,000,000 or more | 0 (0.0%) | 78 (1.7%) |
| Total | 1,517 (100.0%) | 4,669 (100.0%) |
Household Income by Mortgage Status in Middletown
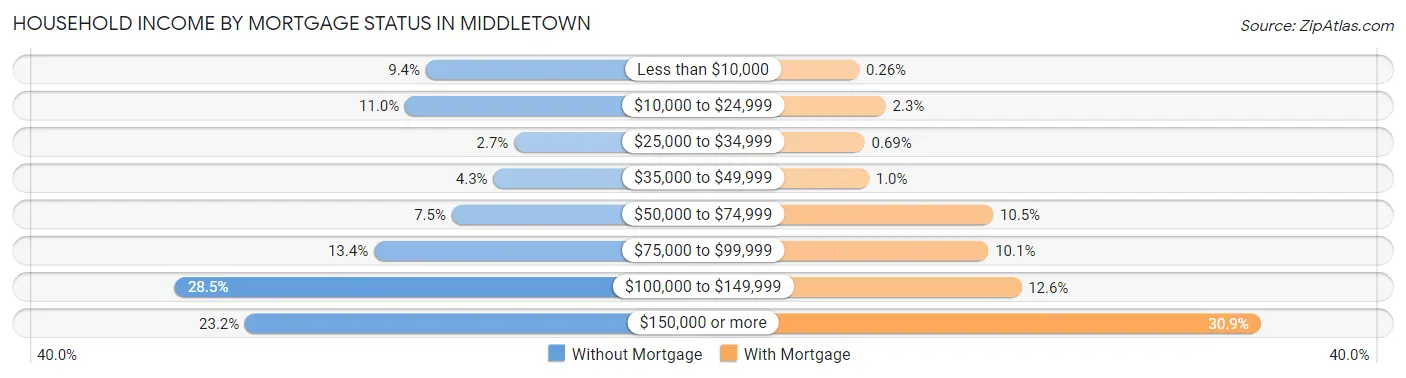
| Household Income | Without Mortgage | With Mortgage |
| Less than $10,000 | 143 (9.4%) | 12 (0.3%) |
| $10,000 to $24,999 | 167 (11.0%) | 107 (2.3%) |
| $25,000 to $34,999 | 41 (2.7%) | 32 (0.7%) |
| $35,000 to $49,999 | 65 (4.3%) | 47 (1.0%) |
| $50,000 to $74,999 | 113 (7.4%) | 489 (10.5%) |
| $75,000 to $99,999 | 203 (13.4%) | 472 (10.1%) |
| $100,000 to $149,999 | 433 (28.5%) | 589 (12.6%) |
| $150,000 or more | 352 (23.2%) | 1,441 (30.9%) |
| Total | 1,517 (100.0%) | 4,669 (100.0%) |
Property Value to Household Income Ratio in Middletown
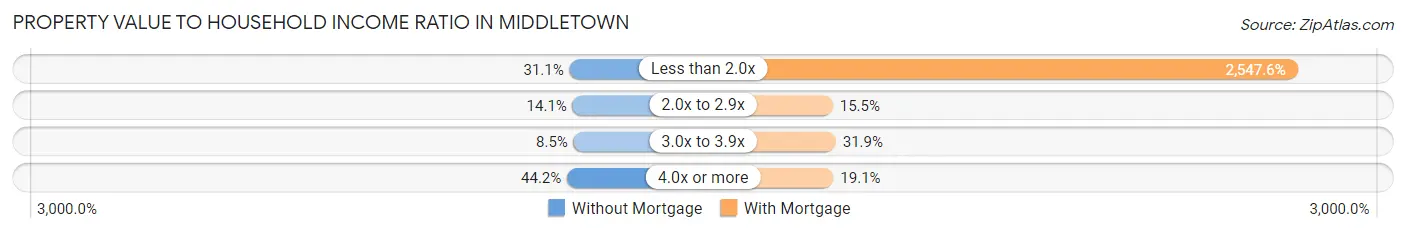
| Value-to-Income Ratio | Without Mortgage | With Mortgage |
| Less than 2.0x | 472 (31.1%) | 118,948 (2,547.6%) |
| 2.0x to 2.9x | 214 (14.1%) | 724 (15.5%) |
| 3.0x to 3.9x | 129 (8.5%) | 1,491 (31.9%) |
| 4.0x or more | 670 (44.2%) | 890 (19.1%) |
| Total | 1,517 (100.0%) | 4,669 (100.0%) |
Real Estate Taxes by Mortgage Status in Middletown
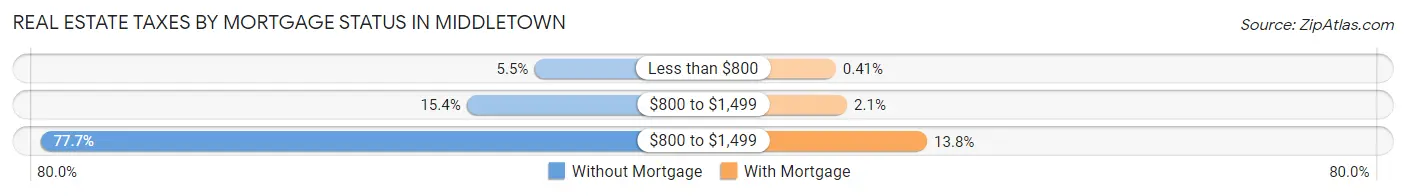
| Property Taxes | Without Mortgage | With Mortgage |
| Less than $800 | 84 (5.5%) | 19 (0.4%) |
| $800 to $1,499 | 234 (15.4%) | 96 (2.1%) |
| $800 to $1,499 | 1,178 (77.6%) | 642 (13.8%) |
| Total | 1,517 (100.0%) | 4,669 (100.0%) |
Health & Disability in Middletown
Health Insurance Coverage by Age in Middletown
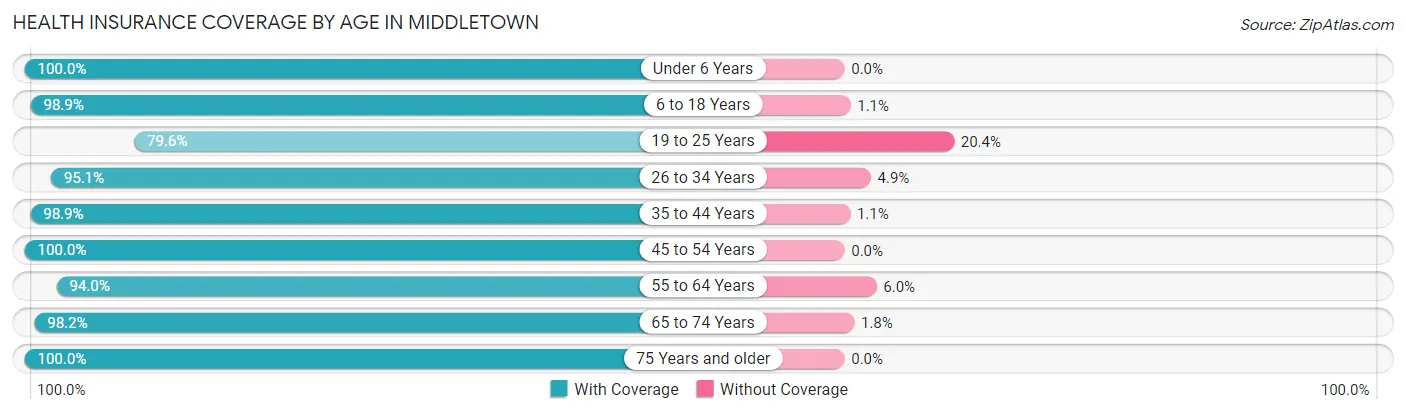
| Age Bracket | With Coverage | Without Coverage |
| Under 6 Years | 1,283 (100.0%) | 0 (0.0%) |
| 6 to 18 Years | 6,067 (98.9%) | 69 (1.1%) |
| 19 to 25 Years | 943 (79.6%) | 242 (20.4%) |
| 26 to 34 Years | 2,658 (95.1%) | 137 (4.9%) |
| 35 to 44 Years | 2,529 (98.9%) | 27 (1.1%) |
| 45 to 54 Years | 2,845 (100.0%) | 0 (0.0%) |
| 55 to 64 Years | 2,347 (94.0%) | 149 (6.0%) |
| 65 to 74 Years | 1,994 (98.2%) | 37 (1.8%) |
| 75 Years and older | 2,120 (100.0%) | 0 (0.0%) |
| Total | 22,786 (97.2%) | 661 (2.8%) |
Health Insurance Coverage by Citizenship Status in Middletown
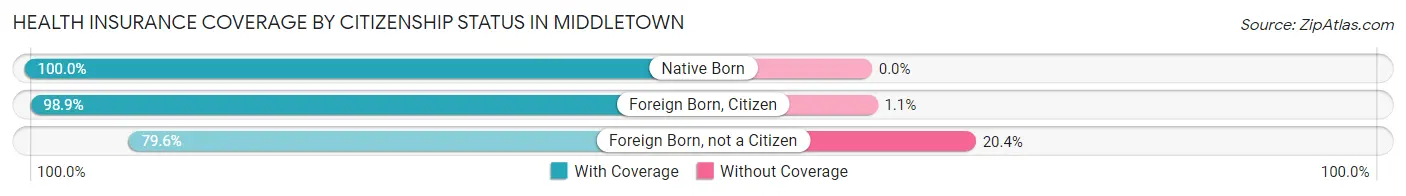
| Citizenship Status | With Coverage | Without Coverage |
| Native Born | 1,283 (100.0%) | 0 (0.0%) |
| Foreign Born, Citizen | 6,067 (98.9%) | 69 (1.1%) |
| Foreign Born, not a Citizen | 943 (79.6%) | 242 (20.4%) |
Health Insurance Coverage by Household Income in Middletown
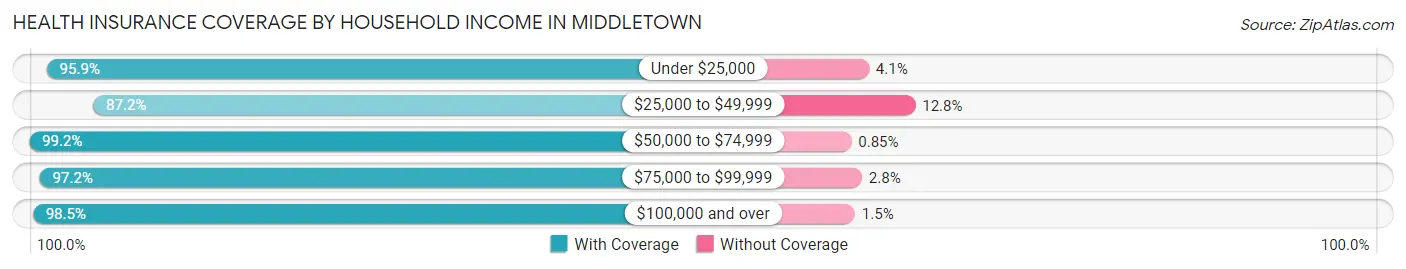
| Household Income | With Coverage | Without Coverage |
| Under $25,000 | 1,249 (95.9%) | 54 (4.1%) |
| $25,000 to $49,999 | 1,867 (87.2%) | 275 (12.8%) |
| $50,000 to $74,999 | 1,875 (99.2%) | 16 (0.9%) |
| $75,000 to $99,999 | 2,989 (97.2%) | 87 (2.8%) |
| $100,000 and over | 14,806 (98.5%) | 229 (1.5%) |
Public vs Private Health Insurance Coverage by Age in Middletown
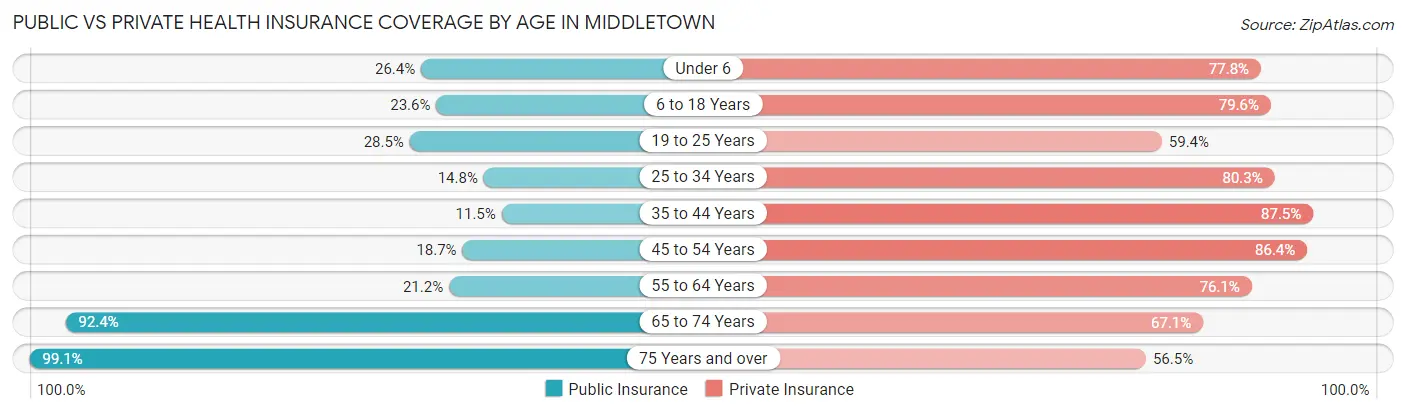
| Age Bracket | Public Insurance | Private Insurance |
| Under 6 | 339 (26.4%) | 998 (77.8%) |
| 6 to 18 Years | 1,447 (23.6%) | 4,887 (79.6%) |
| 19 to 25 Years | 338 (28.5%) | 704 (59.4%) |
| 25 to 34 Years | 413 (14.8%) | 2,245 (80.3%) |
| 35 to 44 Years | 293 (11.5%) | 2,236 (87.5%) |
| 45 to 54 Years | 533 (18.7%) | 2,457 (86.4%) |
| 55 to 64 Years | 530 (21.2%) | 1,899 (76.1%) |
| 65 to 74 Years | 1,877 (92.4%) | 1,362 (67.1%) |
| 75 Years and over | 2,101 (99.1%) | 1,197 (56.5%) |
| Total | 7,871 (33.6%) | 17,985 (76.7%) |
Disability Status by Sex by Age in Middletown
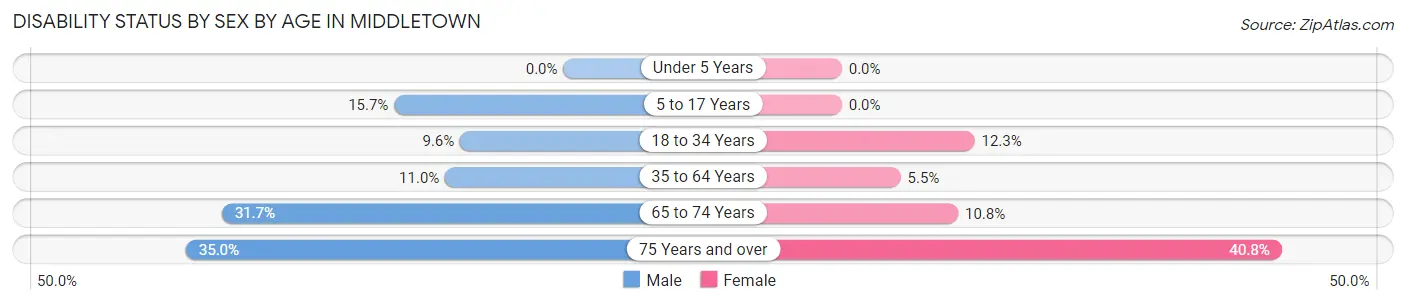
| Age Bracket | Male | Female |
| Under 5 Years | 0 (0.0%) | 0 (0.0%) |
| 5 to 17 Years | 394 (15.7%) | 0 (0.0%) |
| 18 to 34 Years | 212 (9.6%) | 300 (12.3%) |
| 35 to 64 Years | 394 (11.0%) | 235 (5.5%) |
| 65 to 74 Years | 200 (31.7%) | 151 (10.8%) |
| 75 Years and over | 323 (35.0%) | 489 (40.8%) |
Disability Class by Sex by Age in Middletown
Disability Class: Hearing Difficulty
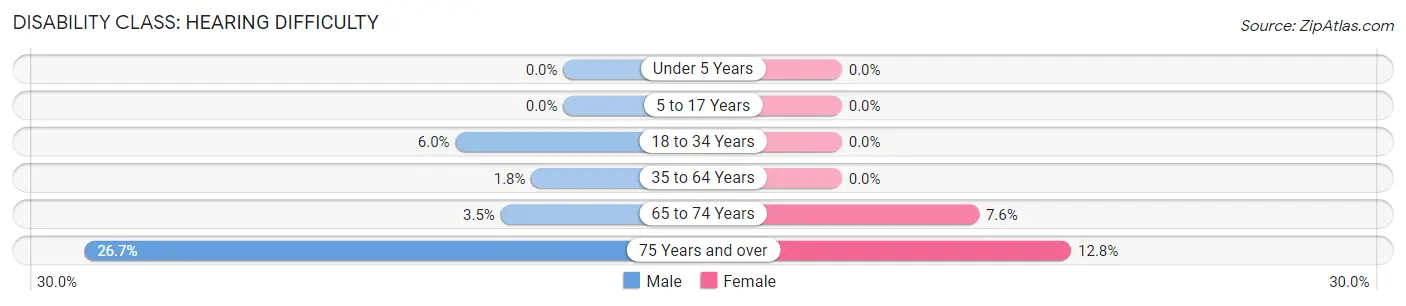
| Age Bracket | Male | Female |
| Under 5 Years | 0 (0.0%) | 0 (0.0%) |
| 5 to 17 Years | 0 (0.0%) | 0 (0.0%) |
| 18 to 34 Years | 133 (6.0%) | 0 (0.0%) |
| 35 to 64 Years | 64 (1.8%) | 0 (0.0%) |
| 65 to 74 Years | 22 (3.5%) | 107 (7.6%) |
| 75 Years and over | 246 (26.7%) | 153 (12.8%) |
Disability Class: Vision Difficulty
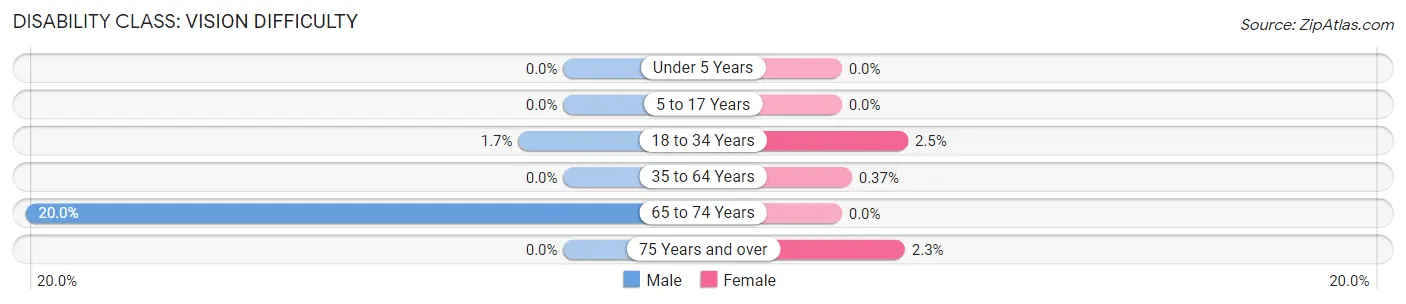
| Age Bracket | Male | Female |
| Under 5 Years | 0 (0.0%) | 0 (0.0%) |
| 5 to 17 Years | 0 (0.0%) | 0 (0.0%) |
| 18 to 34 Years | 37 (1.7%) | 60 (2.5%) |
| 35 to 64 Years | 0 (0.0%) | 16 (0.4%) |
| 65 to 74 Years | 126 (20.0%) | 0 (0.0%) |
| 75 Years and over | 0 (0.0%) | 28 (2.3%) |
Disability Class: Cognitive Difficulty
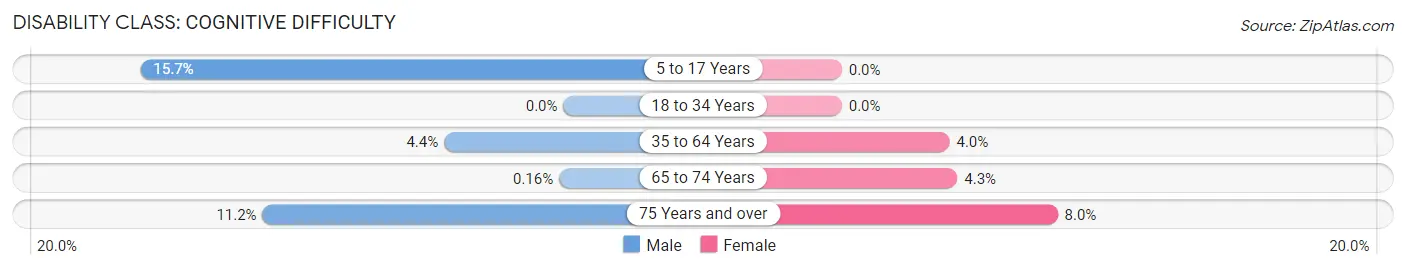
| Age Bracket | Male | Female |
| 5 to 17 Years | 394 (15.7%) | 0 (0.0%) |
| 18 to 34 Years | 0 (0.0%) | 0 (0.0%) |
| 35 to 64 Years | 159 (4.4%) | 172 (4.0%) |
| 65 to 74 Years | 1 (0.2%) | 60 (4.3%) |
| 75 Years and over | 103 (11.2%) | 96 (8.0%) |
Disability Class: Ambulatory Difficulty
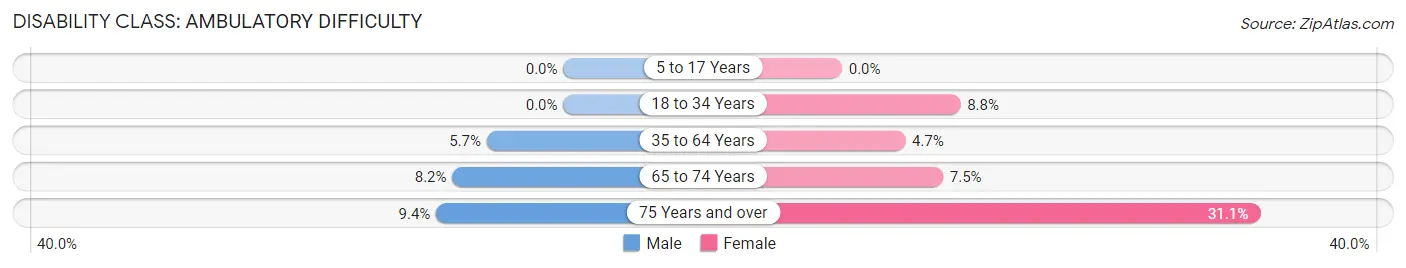
| Age Bracket | Male | Female |
| 5 to 17 Years | 0 (0.0%) | 0 (0.0%) |
| 18 to 34 Years | 0 (0.0%) | 214 (8.8%) |
| 35 to 64 Years | 204 (5.7%) | 202 (4.7%) |
| 65 to 74 Years | 52 (8.2%) | 105 (7.5%) |
| 75 Years and over | 87 (9.4%) | 372 (31.0%) |
Disability Class: Self-Care Difficulty
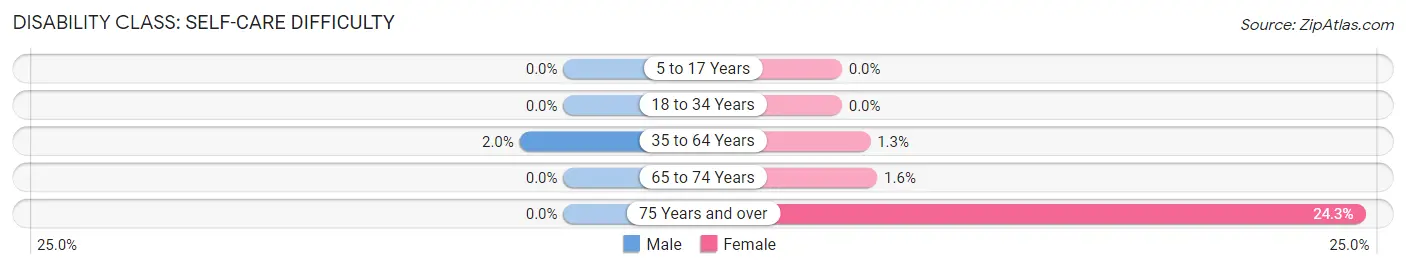
| Age Bracket | Male | Female |
| 5 to 17 Years | 0 (0.0%) | 0 (0.0%) |
| 18 to 34 Years | 0 (0.0%) | 0 (0.0%) |
| 35 to 64 Years | 73 (2.0%) | 57 (1.3%) |
| 65 to 74 Years | 0 (0.0%) | 23 (1.6%) |
| 75 Years and over | 0 (0.0%) | 291 (24.3%) |
Technology Access in Middletown
Computing Device Access in Middletown
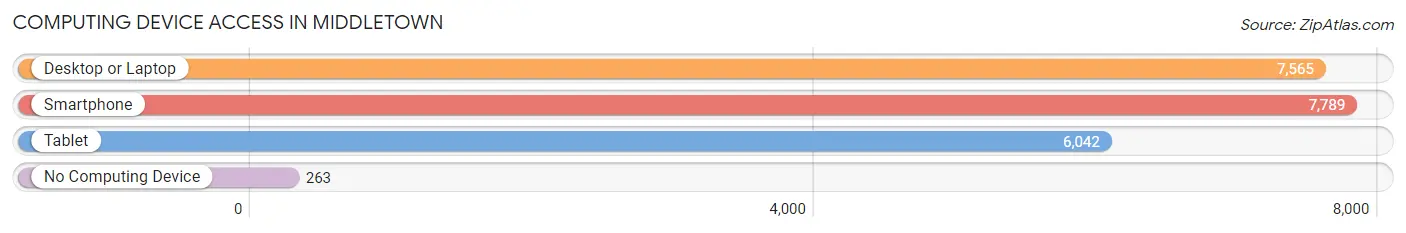
| Device Type | # Households | % Households |
| Desktop or Laptop | 7,565 | 89.6% |
| Smartphone | 7,789 | 92.2% |
| Tablet | 6,042 | 71.6% |
| No Computing Device | 263 | 3.1% |
| Total | 8,444 | 100.0% |
Internet Access in Middletown
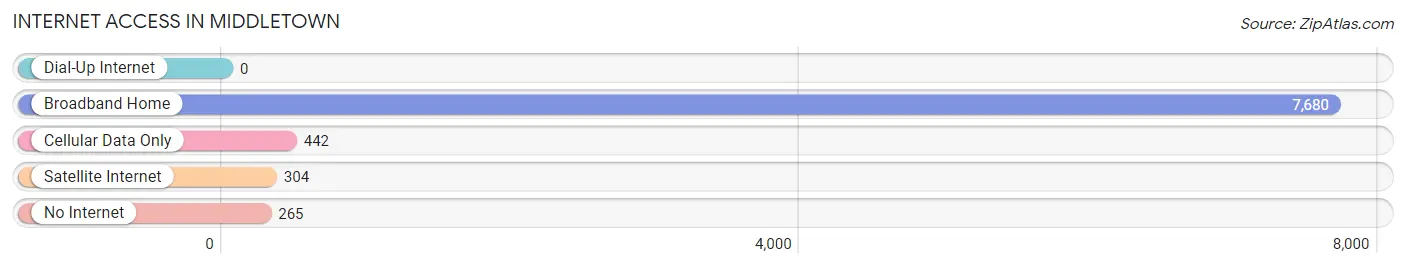
| Internet Type | # Households | % Households |
| Dial-Up Internet | 0 | 0.0% |
| Broadband Home | 7,680 | 90.9% |
| Cellular Data Only | 442 | 5.2% |
| Satellite Internet | 304 | 3.6% |
| No Internet | 265 | 3.1% |
| Total | 8,444 | 100.0% |
Middletown Summary
Middletown, Delaware is a small town located in New Castle County, Delaware. It is situated in the northern part of the state, about 25 miles south of Wilmington. The town has a population of approximately 20,000 people and is part of the greater Wilmington metropolitan area.
History
Middletown was founded in 1779 by a group of Quakers from Pennsylvania. The town was named after the middle of three fords on the Appoquinimink River, which was used by the Quakers to cross the river. The town was incorporated in 1851 and has since grown to become the largest town in New Castle County.
Geography
Middletown is located in the northern part of New Castle County, Delaware. It is situated on the Appoquinimink River, which flows through the town. The town is bordered by the towns of Odessa, Townsend, and Warwick. The town is located approximately 25 miles south of Wilmington and is part of the greater Wilmington metropolitan area.
The town has a total area of 8.3 square miles, of which 8.2 square miles is land and 0.1 square miles is water. The town is located in the Piedmont region of Delaware and is characterized by rolling hills and valleys. The town is located in the humid subtropical climate zone and experiences hot, humid summers and mild winters.
Economy
Middletown is a small town with a diverse economy. The town is home to several large employers, including the Christiana Care Health System, the University of Delaware, and the Middletown School District. The town is also home to several small businesses, including restaurants, retail stores, and professional services.
The town is also home to several industrial parks, which are home to a variety of businesses, including manufacturing, warehousing, and distribution. The town is also home to several agricultural operations, including dairy farms, poultry farms, and vegetable farms.
Demographics
As of the 2010 census, Middletown had a population of 20,322 people. The racial makeup of the town was 79.3% White, 11.2% African American, 0.4% Native American, 2.3% Asian, 0.1% Pacific Islander, 4.2% from other races, and 2.5% from two or more races. Hispanic or Latino of any race were 8.7% of the population.
The median income for a household in the town was $60,945, and the median income for a family was $71,945. The per capita income for the town was $27,945. About 5.2% of families and 7.2% of the population were below the poverty line, including 8.3% of those under age 18 and 6.2% of those age 65 or over.
Middletown is a small town with a diverse population and a strong economy. The town is home to several large employers and a variety of small businesses. The town is also home to several agricultural operations and industrial parks. The town has a population of approximately 20,000 people and is part of the greater Wilmington metropolitan area.
Common Questions
What is Per Capita Income in Middletown?
Per Capita income in Middletown is $48,426.
What is the Median Family Income in Middletown?
Median Family Income in Middletown is $117,049.
What is the Median Household income in Middletown?
Median Household Income in Middletown is $104,662.
What is Income or Wage Gap in Middletown?
Income or Wage Gap in Middletown is 35.1%.
Women in Middletown earn 64.9 cents for every dollar earned by a man.
What is Family Income Deficit in Middletown?
Family Income Deficit in Middletown is $16,863.
Families that are below poverty line in Middletown earn $16,863 less on average than the poverty threshold level.
What is Inequality or Gini Index in Middletown?
Inequality or Gini Index in Middletown is 0.42.
What is the Total Population of Middletown?
Total Population of Middletown is 23,573.
What is the Total Male Population of Middletown?
Total Male Population of Middletown is 10,465.
What is the Total Female Population of Middletown?
Total Female Population of Middletown is 13,108.
What is the Ratio of Males per 100 Females in Middletown?
There are 79.84 Males per 100 Females in Middletown.
What is the Ratio of Females per 100 Males in Middletown?
There are 125.26 Females per 100 Males in Middletown.
What is the Median Population Age in Middletown?
Median Population Age in Middletown is 37.3 Years.
What is the Average Family Size in Middletown
Average Family Size in Middletown is 3.3 People.
What is the Average Household Size in Middletown
Average Household Size in Middletown is 2.8 People.
How Large is the Labor Force in Middletown?
There are 11,934 People in the Labor Forcein in Middletown.
What is the Percentage of People in the Labor Force in Middletown?
66.5% of People are in the Labor Force in Middletown.
What is the Unemployment Rate in Middletown?
Unemployment Rate in Middletown is 7.2%.