Woodside East, DE Map & Demographics
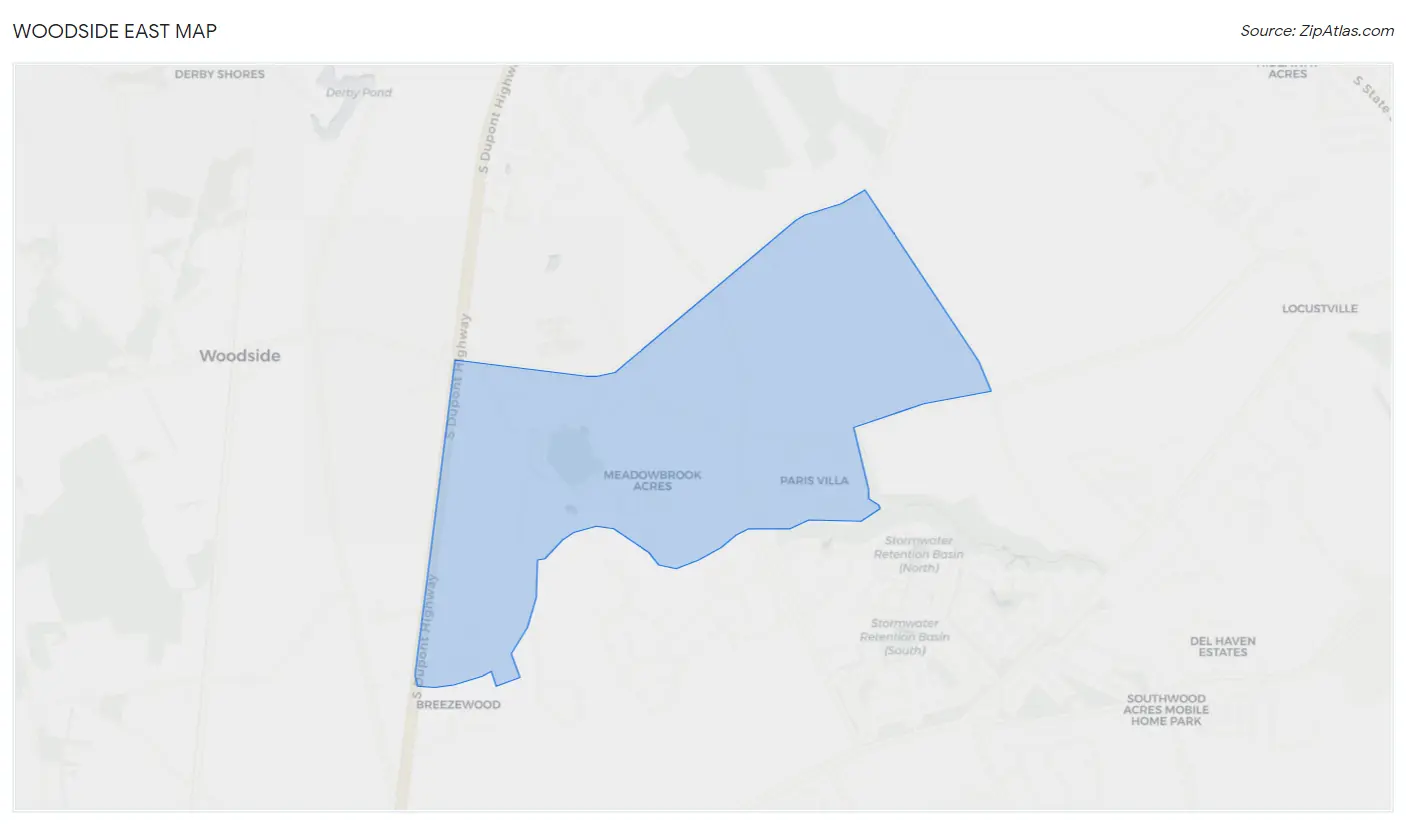
Woodside East Map
Woodside East Overview
$22,233
PER CAPITA INCOME
$56,791
AVG FAMILY INCOME
$53,517
AVG HOUSEHOLD INCOME
38.6%
WAGE / INCOME GAP [ % ]
61.4¢/ $1
WAGE / INCOME GAP [ $ ]
0.41
INEQUALITY / GINI INDEX
2,002
TOTAL POPULATION
771
MALE POPULATION
1,231
FEMALE POPULATION
62.63
MALES / 100 FEMALES
159.66
FEMALES / 100 MALES
35.8
MEDIAN AGE
3.1
AVG FAMILY SIZE
2.6
AVG HOUSEHOLD SIZE
825
LABOR FORCE [ PEOPLE ]
55.1%
PERCENT IN LABOR FORCE
22.3%
UNEMPLOYMENT RATE
Income in Woodside East
Income Overview in Woodside East
Per Capita Income in Woodside East is $22,233, while median incomes of families and households are $56,791 and $53,517 respectively.
| Characteristic | Number | Measure |
| Per Capita Income | 2,002 | $22,233 |
| Median Family Income | 515 | $56,791 |
| Mean Family Income | 515 | $71,568 |
| Median Household Income | 757 | $53,517 |
| Mean Household Income | 757 | $59,238 |
| Income Deficit | 515 | $0 |
| Wage / Income Gap (%) | 2,002 | 38.63% |
| Wage / Income Gap ($) | 2,002 | 61.37¢ per $1 |
| Gini / Inequality Index | 2,002 | 0.41 |
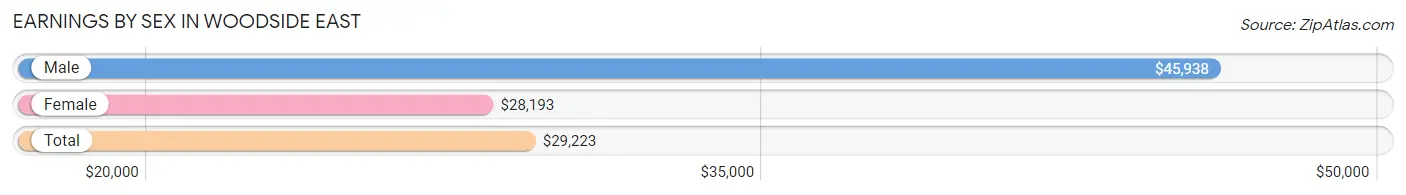
Earnings by Sex in Woodside East
Average Earnings in Woodside East are $29,223, $45,938 for men and $28,193 for women, a difference of 38.6%.
| Sex | Number | Average Earnings |
| Male | 265 (33.5%) | $45,938 |
| Female | 525 (66.5%) | $28,193 |
| Total | 790 (100.0%) | $29,223 |
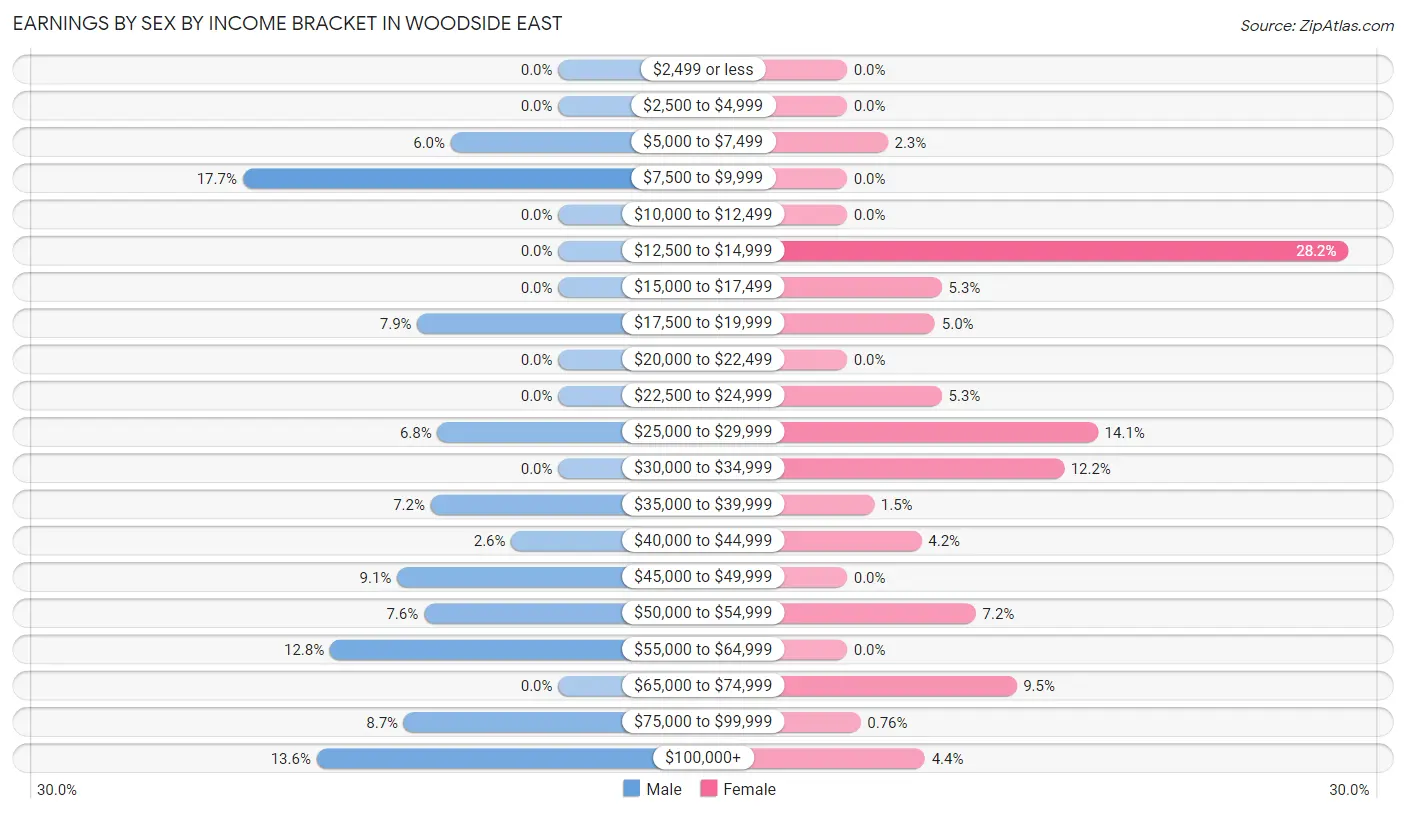
Earnings by Sex by Income Bracket in Woodside East
The most common earnings brackets in Woodside East are $7,500 to $9,999 for men (47 | 17.7%) and $12,500 to $14,999 for women (148 | 28.2%).
| Income | Male | Female |
| $2,499 or less | 0 (0.0%) | 0 (0.0%) |
| $2,500 to $4,999 | 0 (0.0%) | 0 (0.0%) |
| $5,000 to $7,499 | 16 (6.0%) | 12 (2.3%) |
| $7,500 to $9,999 | 47 (17.7%) | 0 (0.0%) |
| $10,000 to $12,499 | 0 (0.0%) | 0 (0.0%) |
| $12,500 to $14,999 | 0 (0.0%) | 148 (28.2%) |
| $15,000 to $17,499 | 0 (0.0%) | 28 (5.3%) |
| $17,500 to $19,999 | 21 (7.9%) | 26 (5.0%) |
| $20,000 to $22,499 | 0 (0.0%) | 0 (0.0%) |
| $22,500 to $24,999 | 0 (0.0%) | 28 (5.3%) |
| $25,000 to $29,999 | 18 (6.8%) | 74 (14.1%) |
| $30,000 to $34,999 | 0 (0.0%) | 64 (12.2%) |
| $35,000 to $39,999 | 19 (7.2%) | 8 (1.5%) |
| $40,000 to $44,999 | 7 (2.6%) | 22 (4.2%) |
| $45,000 to $49,999 | 24 (9.1%) | 0 (0.0%) |
| $50,000 to $54,999 | 20 (7.5%) | 38 (7.2%) |
| $55,000 to $64,999 | 34 (12.8%) | 0 (0.0%) |
| $65,000 to $74,999 | 0 (0.0%) | 50 (9.5%) |
| $75,000 to $99,999 | 23 (8.7%) | 4 (0.8%) |
| $100,000+ | 36 (13.6%) | 23 (4.4%) |
| Total | 265 (100.0%) | 525 (100.0%) |
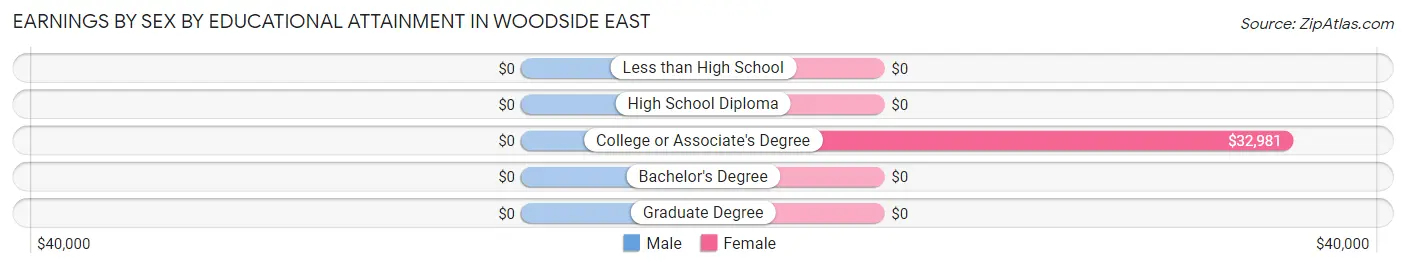
Earnings by Sex by Educational Attainment in Woodside East
| Educational Attainment | Male Income | Female Income |
| Less than High School | - | - |
| High School Diploma | - | - |
| College or Associate's Degree | - | - |
| Bachelor's Degree | - | - |
| Graduate Degree | - | - |
| Total | $49,479 | $28,007 |
Family Income in Woodside East
Family Income Brackets in Woodside East
According to the Woodside East family income data, there are 155 families falling into the $100,000 to $149,999 income range, which is the most common income bracket and makes up 30.1% of all families.
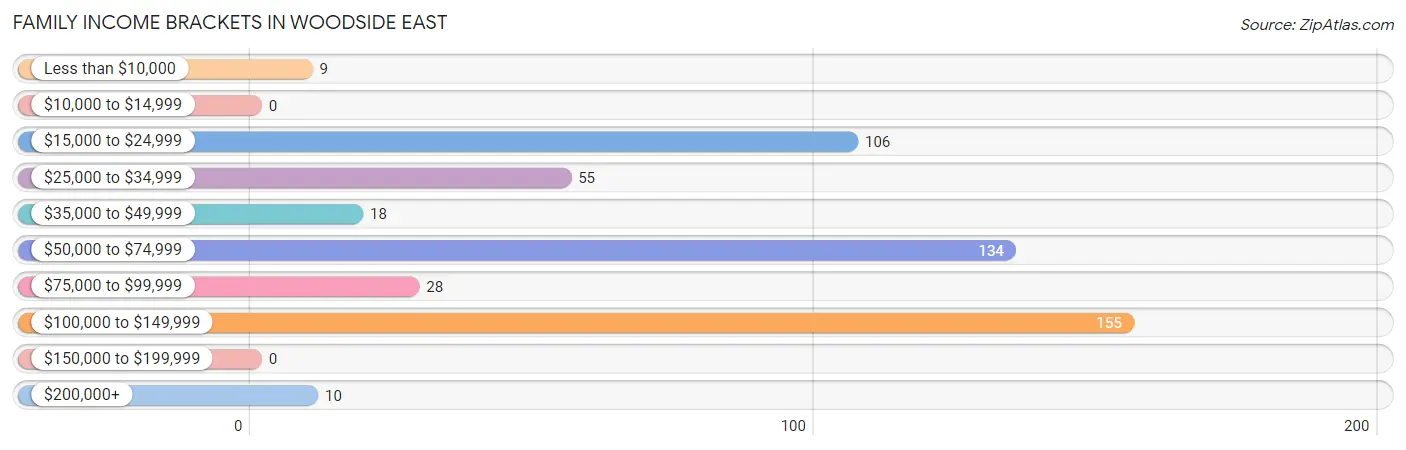
| Income Bracket | # Families | % Families |
| Less than $10,000 | 9 | 1.7% |
| $10,000 to $14,999 | 0 | 0.0% |
| $15,000 to $24,999 | 106 | 20.6% |
| $25,000 to $34,999 | 55 | 10.7% |
| $35,000 to $49,999 | 18 | 3.5% |
| $50,000 to $74,999 | 134 | 26.0% |
| $75,000 to $99,999 | 28 | 5.4% |
| $100,000 to $149,999 | 155 | 30.1% |
| $150,000 to $199,999 | 0 | 0.0% |
| $200,000+ | 10 | 1.9% |
Family Income by Famaliy Size in Woodside East
2-person families (163 | 31.7%) account for the highest median family income in Woodside East with $102,566 per family, while 2-person families (163 | 31.7%) have the highest median income of $51,283 per family member.

| Income Bracket | # Families | Median Income |
| 2-Person Families | 163 (31.7%) | $102,566 |
| 3-Person Families | 187 (36.3%) | $24,705 |
| 4-Person Families | 91 (17.7%) | $0 |
| 5-Person Families | 46 (8.9%) | $0 |
| 6-Person Families | 28 (5.4%) | $0 |
| 7+ Person Families | 0 (0.0%) | $0 |
| Total | 515 (100.0%) | $56,791 |
Family Income by Number of Earners in Woodside East
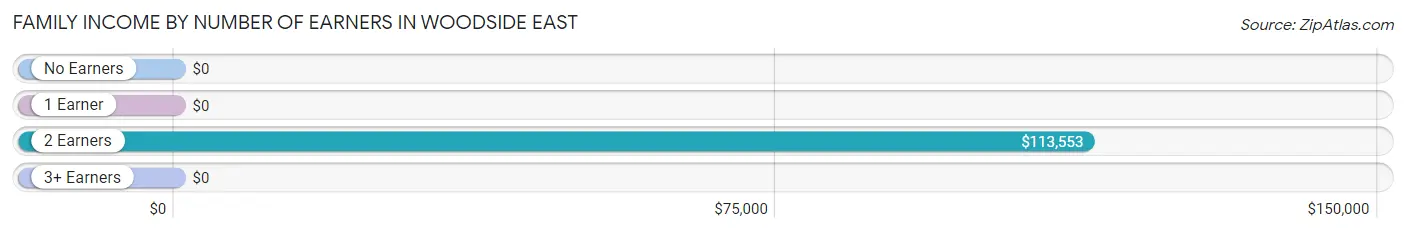
| Number of Earners | # Families | Median Income |
| No Earners | 17 (3.3%) | $0 |
| 1 Earner | 306 (59.4%) | $0 |
| 2 Earners | 164 (31.8%) | $113,553 |
| 3+ Earners | 28 (5.4%) | $0 |
| Total | 515 (100.0%) | $56,791 |
Household Income in Woodside East
Household Income Brackets in Woodside East
With 172 households falling in the category, the $50,000 to $74,999 income range is the most frequent in Woodside East, accounting for 22.7% of all households.
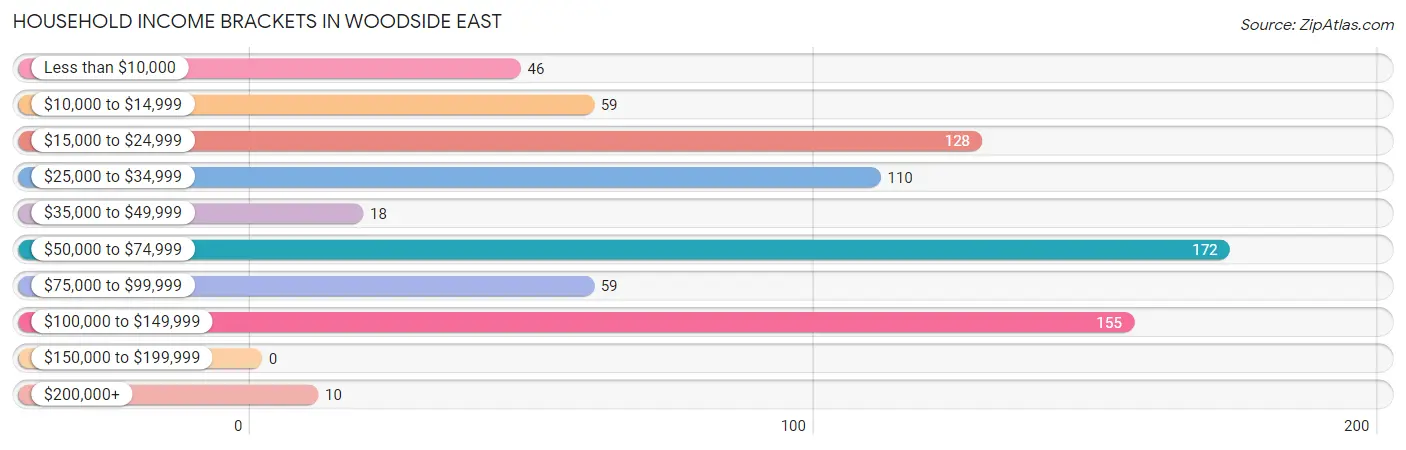
| Income Bracket | # Households | % Households |
| Less than $10,000 | 46 | 6.1% |
| $10,000 to $14,999 | 59 | 7.8% |
| $15,000 to $24,999 | 128 | 16.9% |
| $25,000 to $34,999 | 110 | 14.5% |
| $35,000 to $49,999 | 18 | 2.4% |
| $50,000 to $74,999 | 172 | 22.7% |
| $75,000 to $99,999 | 59 | 7.8% |
| $100,000 to $149,999 | 155 | 20.5% |
| $150,000 to $199,999 | 0 | 0.0% |
| $200,000+ | 10 | 1.3% |
Household Income by Householder Age in Woodside East
The median household income in Woodside East is $53,517, with the highest median household income of $56,619 found in the 45 to 64 years age bracket for the primary householder. A total of 289 households (38.2%) fall into this category.
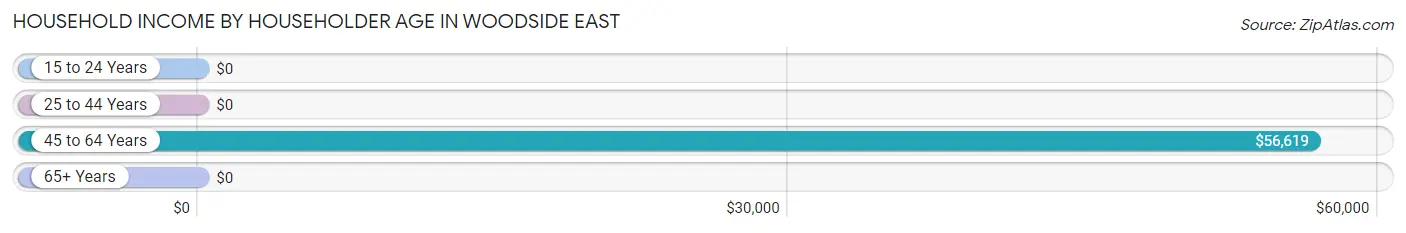
| Income Bracket | # Households | Median Income |
| 15 to 24 Years | 0 (0.0%) | $0 |
| 25 to 44 Years | 303 (40.0%) | $0 |
| 45 to 64 Years | 289 (38.2%) | $56,619 |
| 65+ Years | 165 (21.8%) | $0 |
| Total | 757 (100.0%) | $53,517 |
Poverty in Woodside East
Income Below Poverty by Sex and Age in Woodside East
With 23.7% poverty level for males and 9.3% for females among the residents of Woodside East, 55 to 64 year old males and 45 to 54 year old females are the most vulnerable to poverty, with 88 males (56.8%) and 59 females (41.5%) in their respective age groups living below the poverty level.
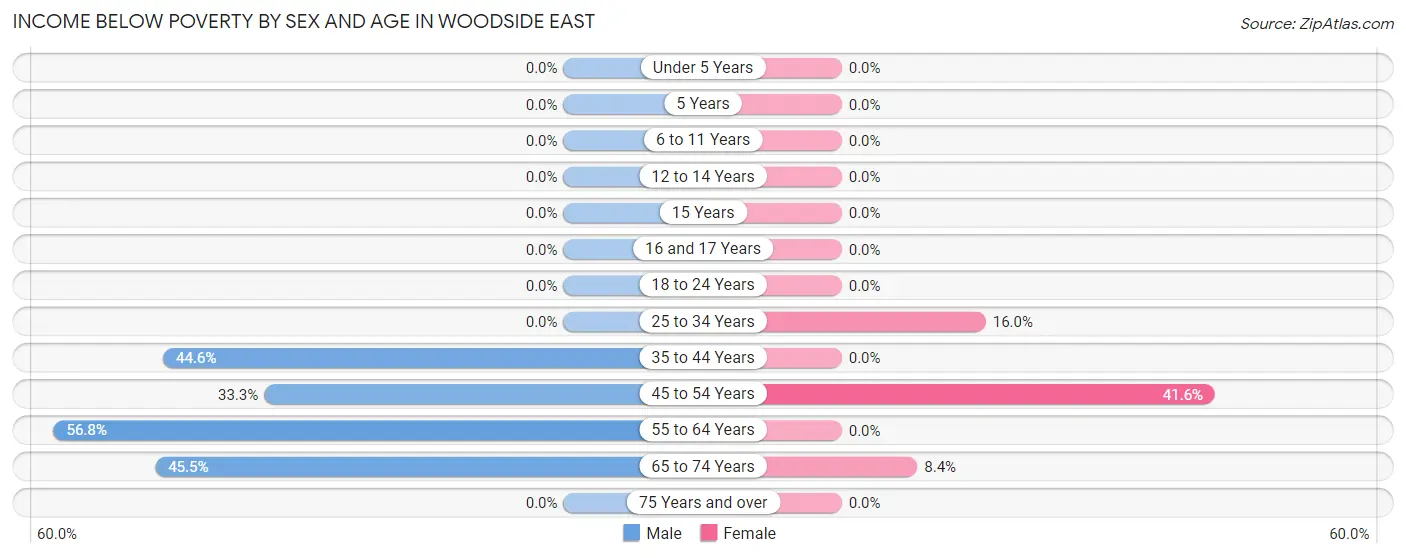
| Age Bracket | Male | Female |
| Under 5 Years | 0 (0.0%) | 0 (0.0%) |
| 5 Years | 0 (0.0%) | 0 (0.0%) |
| 6 to 11 Years | 0 (0.0%) | 0 (0.0%) |
| 12 to 14 Years | 0 (0.0%) | 0 (0.0%) |
| 15 Years | 0 (0.0%) | 0 (0.0%) |
| 16 and 17 Years | 0 (0.0%) | 0 (0.0%) |
| 18 to 24 Years | 0 (0.0%) | 0 (0.0%) |
| 25 to 34 Years | 0 (0.0%) | 47 (16.0%) |
| 35 to 44 Years | 37 (44.6%) | 0 (0.0%) |
| 45 to 54 Years | 48 (33.3%) | 59 (41.5%) |
| 55 to 64 Years | 88 (56.8%) | 0 (0.0%) |
| 65 to 74 Years | 10 (45.5%) | 9 (8.4%) |
| 75 Years and over | 0 (0.0%) | 0 (0.0%) |
| Total | 183 (23.7%) | 115 (9.3%) |
Income Above Poverty by Sex and Age in Woodside East
According to the poverty statistics in Woodside East, males aged under 5 years and females aged under 5 years are the age groups that are most secure financially, with 100.0% of males and 100.0% of females in these age groups living above the poverty line.
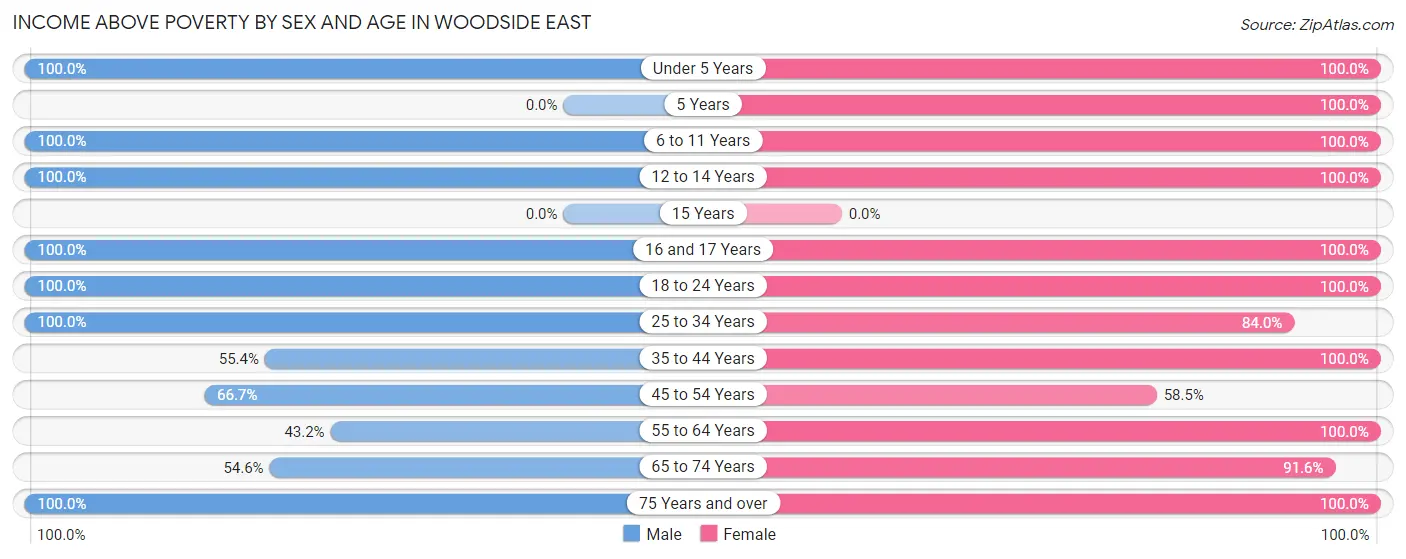
| Age Bracket | Male | Female |
| Under 5 Years | 45 (100.0%) | 128 (100.0%) |
| 5 Years | 0 (0.0%) | 43 (100.0%) |
| 6 to 11 Years | 73 (100.0%) | 12 (100.0%) |
| 12 to 14 Years | 138 (100.0%) | 65 (100.0%) |
| 15 Years | 0 (0.0%) | 0 (0.0%) |
| 16 and 17 Years | 18 (100.0%) | 33 (100.0%) |
| 18 to 24 Years | 16 (100.0%) | 35 (100.0%) |
| 25 to 34 Years | 29 (100.0%) | 246 (84.0%) |
| 35 to 44 Years | 46 (55.4%) | 200 (100.0%) |
| 45 to 54 Years | 96 (66.7%) | 83 (58.5%) |
| 55 to 64 Years | 67 (43.2%) | 108 (100.0%) |
| 65 to 74 Years | 12 (54.5%) | 98 (91.6%) |
| 75 Years and over | 48 (100.0%) | 65 (100.0%) |
| Total | 588 (76.3%) | 1,116 (90.7%) |
Income Below Poverty Among Married-Couple Families in Woodside East
The poverty statistics for married-couple families in Woodside East show that 5.2% or 9 of the total 172 families live below the poverty line. Families with no children have the highest poverty rate of 9.7%, comprising of 9 families. On the other hand, families with 1 or 2 children have the lowest poverty rate of 0.0%, which includes 0 families.
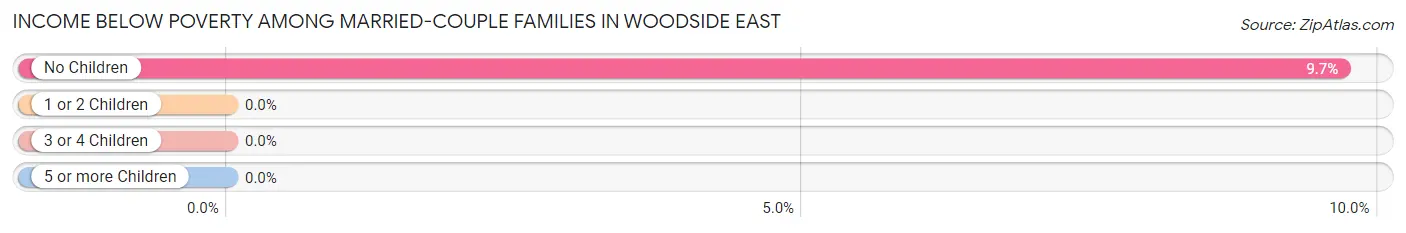
| Children | Above Poverty | Below Poverty |
| No Children | 84 (90.3%) | 9 (9.7%) |
| 1 or 2 Children | 43 (100.0%) | 0 (0.0%) |
| 3 or 4 Children | 36 (100.0%) | 0 (0.0%) |
| 5 or more Children | 0 (0.0%) | 0 (0.0%) |
| Total | 163 (94.8%) | 9 (5.2%) |
Income Below Poverty Among Single-Parent Households in Woodside East
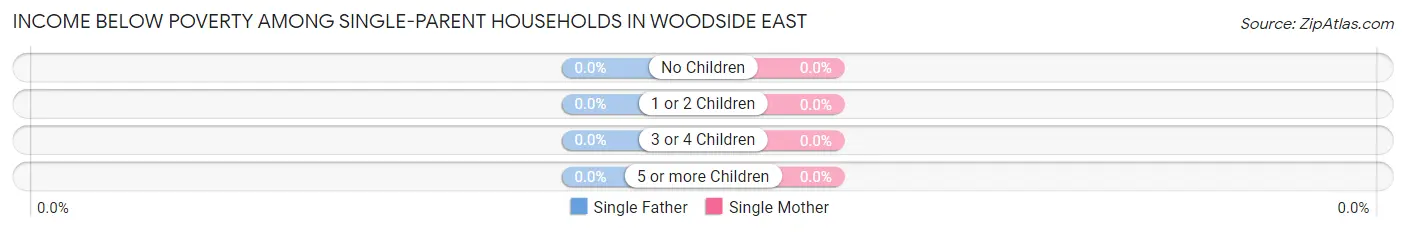
| Children | Single Father | Single Mother |
| No Children | 0 (0.0%) | 0 (0.0%) |
| 1 or 2 Children | 0 (0.0%) | 0 (0.0%) |
| 3 or 4 Children | 0 (0.0%) | 0 (0.0%) |
| 5 or more Children | 0 (0.0%) | 0 (0.0%) |
| Total | 0 (0.0%) | 0 (0.0%) |
Income Below Poverty Among Married-Couple vs Single-Parent Households in Woodside East
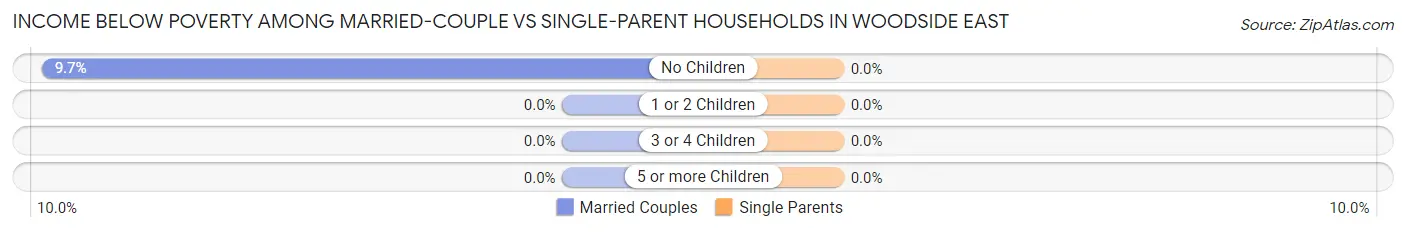
| Children | Married-Couple Families | Single-Parent Households |
| No Children | 9 (9.7%) | 0 (0.0%) |
| 1 or 2 Children | 0 (0.0%) | 0 (0.0%) |
| 3 or 4 Children | 0 (0.0%) | 0 (0.0%) |
| 5 or more Children | 0 (0.0%) | 0 (0.0%) |
| Total | 9 (5.2%) | 0 (0.0%) |
Race in Woodside East
The most populous races in Woodside East are White / Caucasian (961 | 48.0%), Two or more Races (563 | 28.1%), and Black / African American (433 | 21.6%).
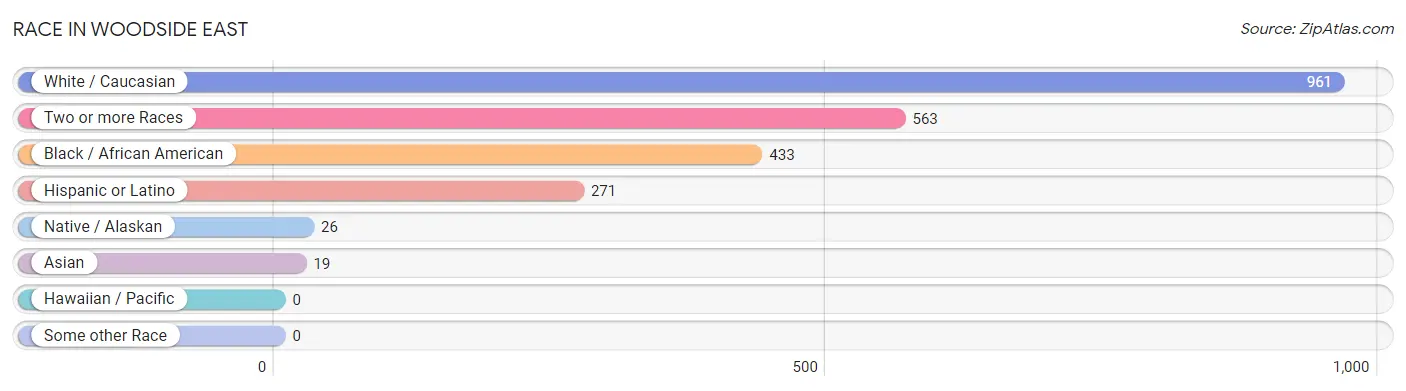
| Race | # Population | % Population |
| Asian | 19 | 0.9% |
| Black / African American | 433 | 21.6% |
| Hawaiian / Pacific | 0 | 0.0% |
| Hispanic or Latino | 271 | 13.5% |
| Native / Alaskan | 26 | 1.3% |
| White / Caucasian | 961 | 48.0% |
| Two or more Races | 563 | 28.1% |
| Some other Race | 0 | 0.0% |
| Total | 2,002 | 100.0% |
Ancestry in Woodside East
The most populous ancestries reported in Woodside East are Italian (334 | 16.7%), Irish (288 | 14.4%), German (230 | 11.5%), English (224 | 11.2%), and Puerto Rican (222 | 11.1%), together accounting for 64.8% of all Woodside East residents.
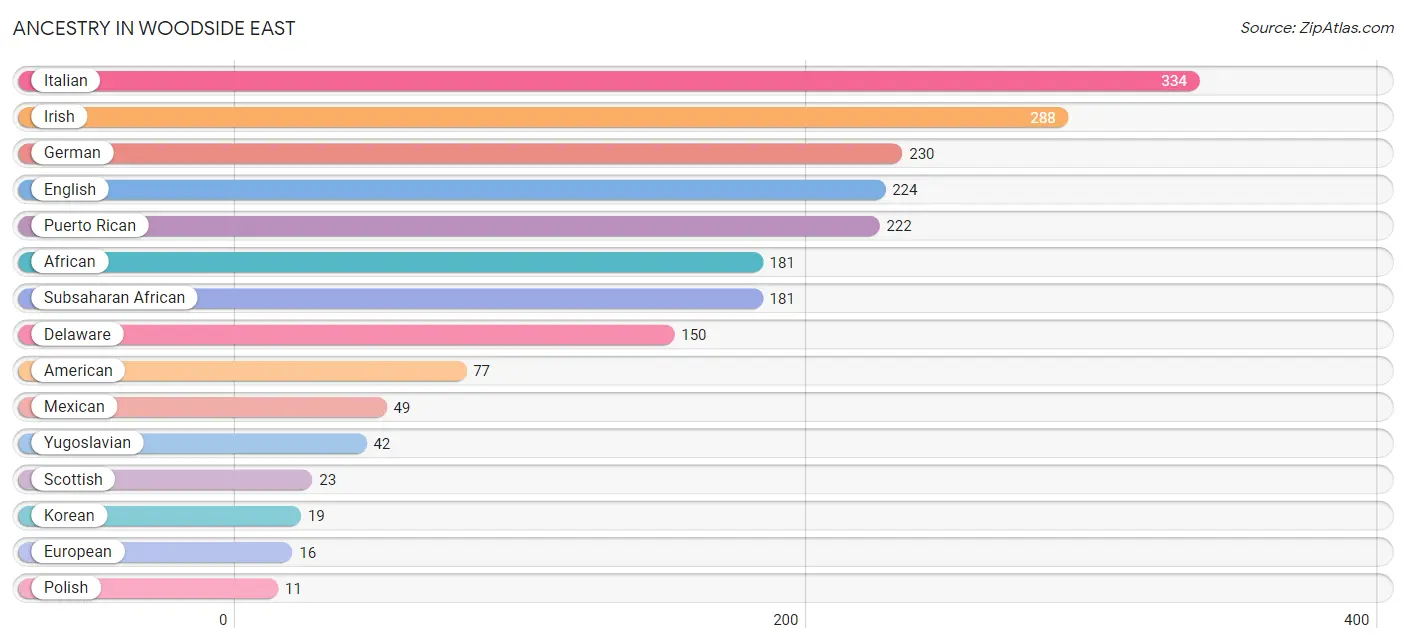
| Ancestry | # Population | % Population |
| African | 181 | 9.0% |
| American | 77 | 3.8% |
| Delaware | 150 | 7.5% |
| English | 224 | 11.2% |
| European | 16 | 0.8% |
| German | 230 | 11.5% |
| Irish | 288 | 14.4% |
| Italian | 334 | 16.7% |
| Korean | 19 | 0.9% |
| Mexican | 49 | 2.5% |
| Polish | 11 | 0.5% |
| Puerto Rican | 222 | 11.1% |
| Scotch-Irish | 10 | 0.5% |
| Scottish | 23 | 1.1% |
| Subsaharan African | 181 | 9.0% |
| Yugoslavian | 42 | 2.1% | View All 16 Rows |
Immigrants in Woodside East
The most numerous immigrant groups reported in Woodside East came from Europe (10 | 0.5%), Northern Europe (10 | 0.5%), and Scotland (10 | 0.5%), together accounting for 1.5% of all Woodside East residents.
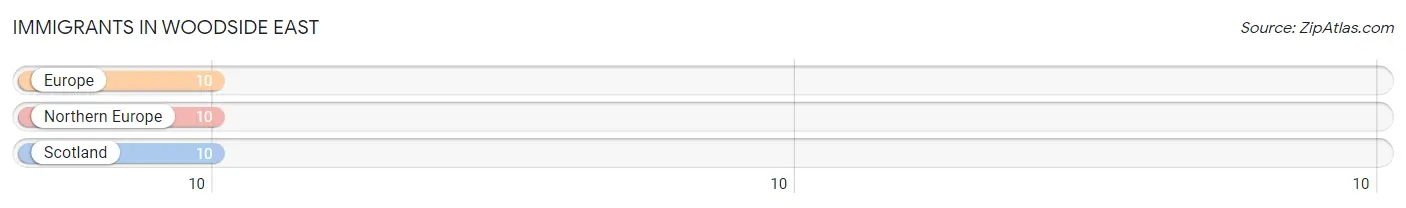
| Immigration Origin | # Population | % Population |
| Europe | 10 | 0.5% |
| Northern Europe | 10 | 0.5% |
| Scotland | 10 | 0.5% | View All 3 Rows |
Sex and Age in Woodside East
Sex and Age in Woodside East
The most populous age groups in Woodside East are 10 to 14 Years (174 | 22.6%) for men and 30 to 34 Years (285 | 23.2%) for women.
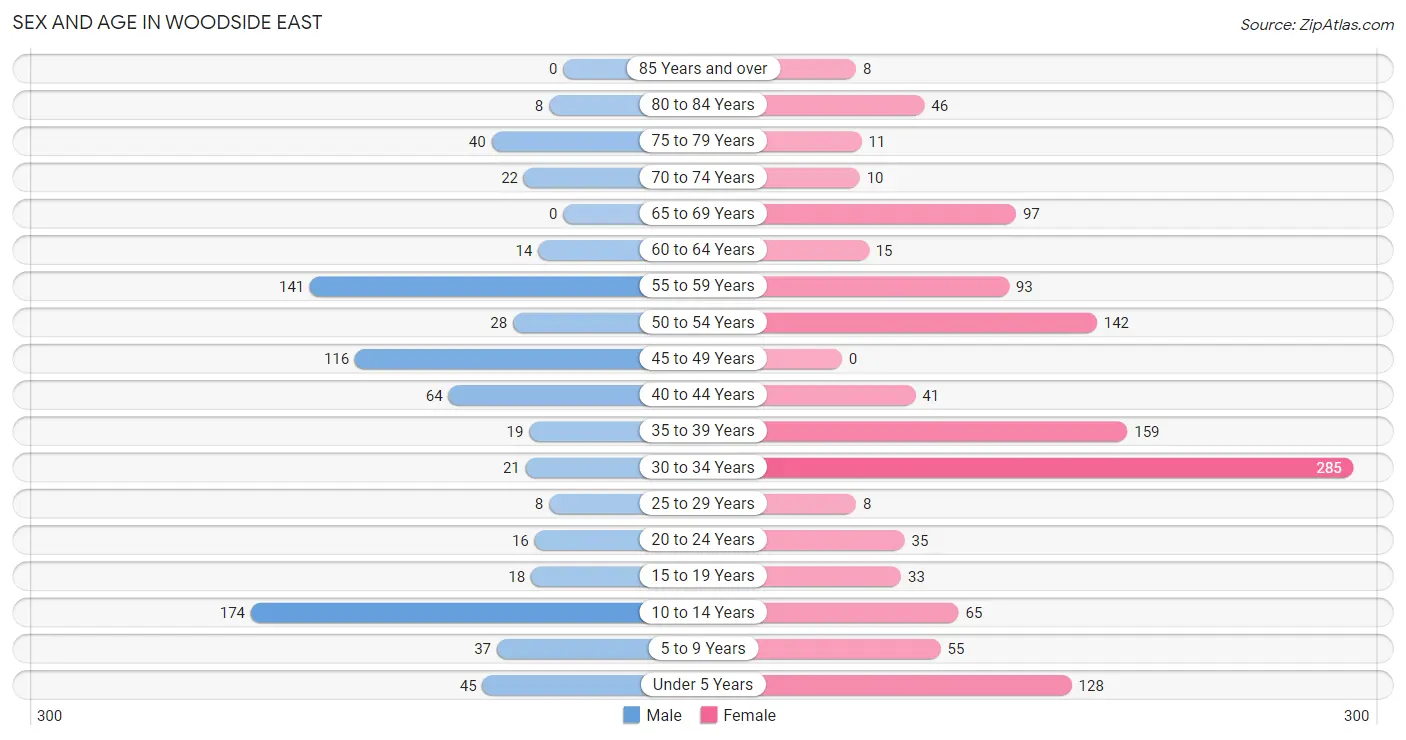
| Age Bracket | Male | Female |
| Under 5 Years | 45 (5.8%) | 128 (10.4%) |
| 5 to 9 Years | 37 (4.8%) | 55 (4.5%) |
| 10 to 14 Years | 174 (22.6%) | 65 (5.3%) |
| 15 to 19 Years | 18 (2.3%) | 33 (2.7%) |
| 20 to 24 Years | 16 (2.1%) | 35 (2.8%) |
| 25 to 29 Years | 8 (1.0%) | 8 (0.6%) |
| 30 to 34 Years | 21 (2.7%) | 285 (23.2%) |
| 35 to 39 Years | 19 (2.5%) | 159 (12.9%) |
| 40 to 44 Years | 64 (8.3%) | 41 (3.3%) |
| 45 to 49 Years | 116 (15.0%) | 0 (0.0%) |
| 50 to 54 Years | 28 (3.6%) | 142 (11.5%) |
| 55 to 59 Years | 141 (18.3%) | 93 (7.5%) |
| 60 to 64 Years | 14 (1.8%) | 15 (1.2%) |
| 65 to 69 Years | 0 (0.0%) | 97 (7.9%) |
| 70 to 74 Years | 22 (2.9%) | 10 (0.8%) |
| 75 to 79 Years | 40 (5.2%) | 11 (0.9%) |
| 80 to 84 Years | 8 (1.0%) | 46 (3.7%) |
| 85 Years and over | 0 (0.0%) | 8 (0.6%) |
| Total | 771 (100.0%) | 1,231 (100.0%) |
Families and Households in Woodside East
Median Family Size in Woodside East
The median family size in Woodside East is 3.06 persons per family, with single male/father families (3 | 0.6%) accounting for the largest median family size of 3.33 persons per family. On the other hand, single female/mother families (340 | 66.0%) represent the smallest median family size with 3.02 persons per family.
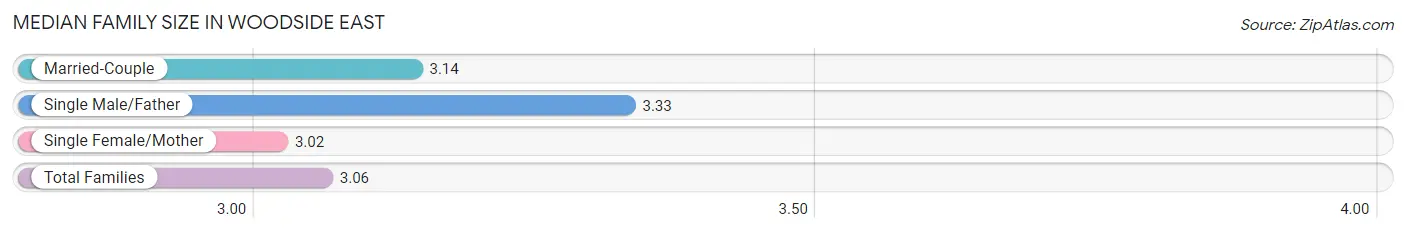
| Family Type | # Families | Family Size |
| Married-Couple | 172 (33.4%) | 3.14 |
| Single Male/Father | 3 (0.6%) | 3.33 |
| Single Female/Mother | 340 (66.0%) | 3.02 |
| Total Families | 515 (100.0%) | 3.06 |
Median Household Size in Woodside East
The median household size in Woodside East is 2.64 persons per household, with single male/father households (3 | 0.4%) accounting for the largest median household size of 3.33 persons per household. non-family households (242 | 32.0%) represent the smallest median household size with 1.40 persons per household.
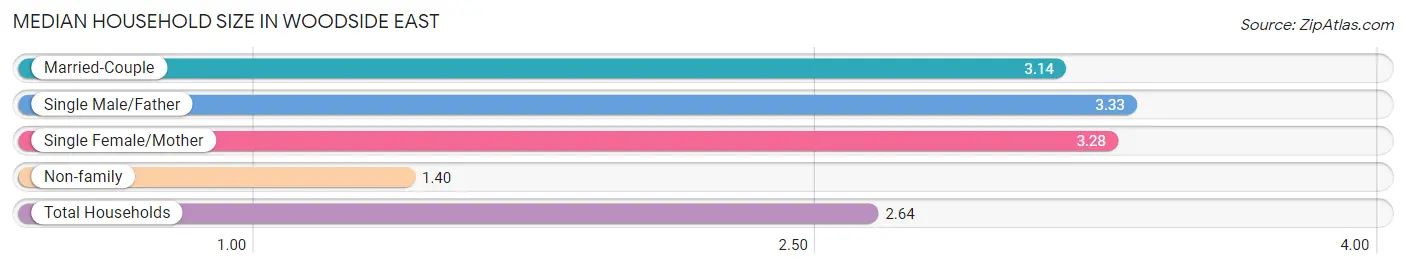
| Household Type | # Households | Household Size |
| Married-Couple | 172 (22.7%) | 3.14 |
| Single Male/Father | 3 (0.4%) | 3.33 |
| Single Female/Mother | 340 (44.9%) | 3.28 |
| Non-family | 242 (32.0%) | 1.40 |
| Total Households | 757 (100.0%) | 2.64 |
Household Size by Marriage Status in Woodside East
Out of a total of 757 households in Woodside East, 515 (68.0%) are family households, while 242 (32.0%) are nonfamily households. The most numerous type of family households are 4-person households, comprising 197, and the most common type of nonfamily households are 1-person households, comprising 197.
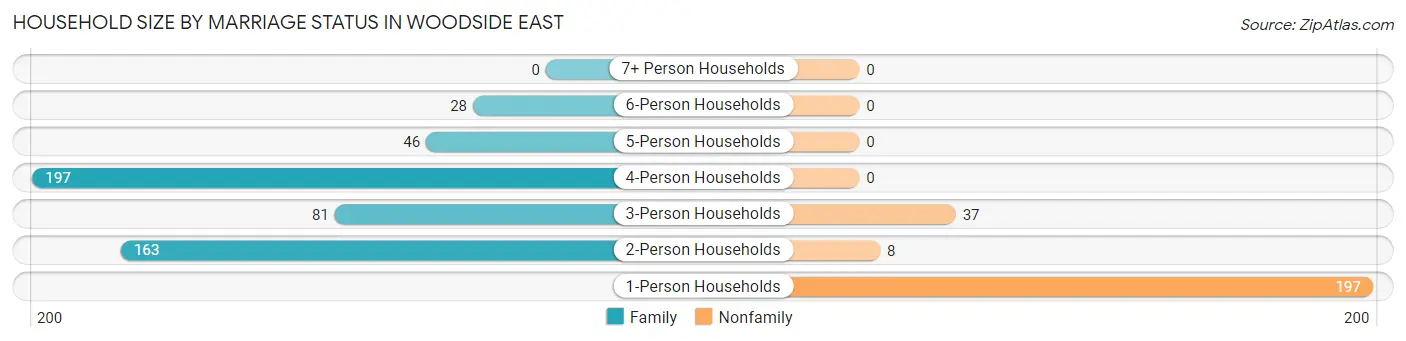
| Household Size | Family Households | Nonfamily Households |
| 1-Person Households | - | 197 (26.0%) |
| 2-Person Households | 163 (21.5%) | 8 (1.1%) |
| 3-Person Households | 81 (10.7%) | 37 (4.9%) |
| 4-Person Households | 197 (26.0%) | 0 (0.0%) |
| 5-Person Households | 46 (6.1%) | 0 (0.0%) |
| 6-Person Households | 28 (3.7%) | 0 (0.0%) |
| 7+ Person Households | 0 (0.0%) | 0 (0.0%) |
| Total | 515 (68.0%) | 242 (32.0%) |
Female Fertility in Woodside East
Fertility by Age in Woodside East
Average fertility rate in Woodside East is 100.0 births per 1,000 women. Women in the age bracket of 35 to 50 years have the highest fertility rate with 140.0 births per 1,000 women. Women in the age bracket of 20 to 34 years acount for 50.0% of all women with births.
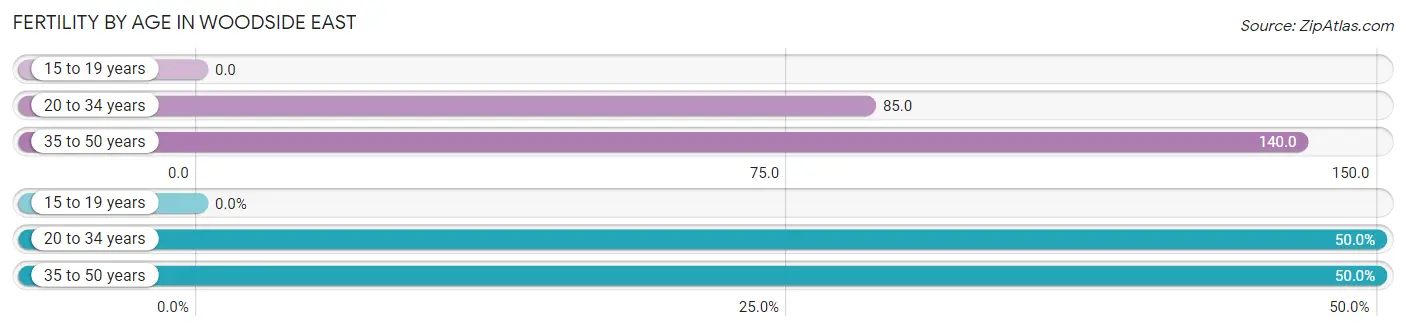
| Age Bracket | Women with Births | Births / 1,000 Women |
| 15 to 19 years | 0 (0.0%) | 0.0 |
| 20 to 34 years | 28 (50.0%) | 85.0 |
| 35 to 50 years | 28 (50.0%) | 140.0 |
| Total | 56 (100.0%) | 100.0 |
Fertility by Age by Marriage Status in Woodside East
50.0% of women with births (56) in Woodside East are married. The highest percentage of unmarried women with births falls into 20 to 34 years age bracket with 100.0% of them unmarried at the time of birth, while the lowest percentage of unmarried women with births belong to 35 to 50 years age bracket with 0.0% of them unmarried.
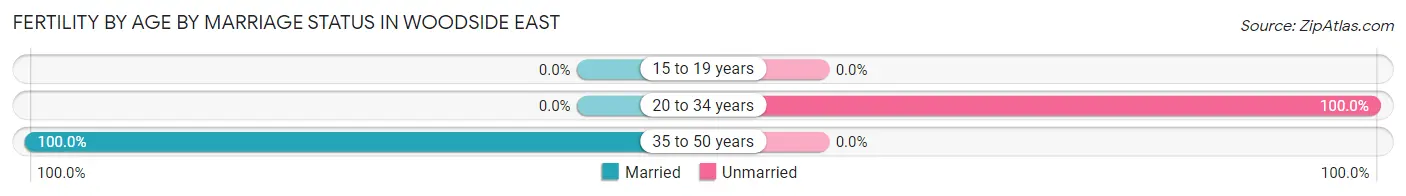
| Age Bracket | Married | Unmarried |
| 15 to 19 years | 0 (0.0%) | 0 (0.0%) |
| 20 to 34 years | 0 (0.0%) | 28 (100.0%) |
| 35 to 50 years | 28 (100.0%) | 0 (0.0%) |
| Total | 28 (50.0%) | 28 (50.0%) |
Fertility by Education in Woodside East
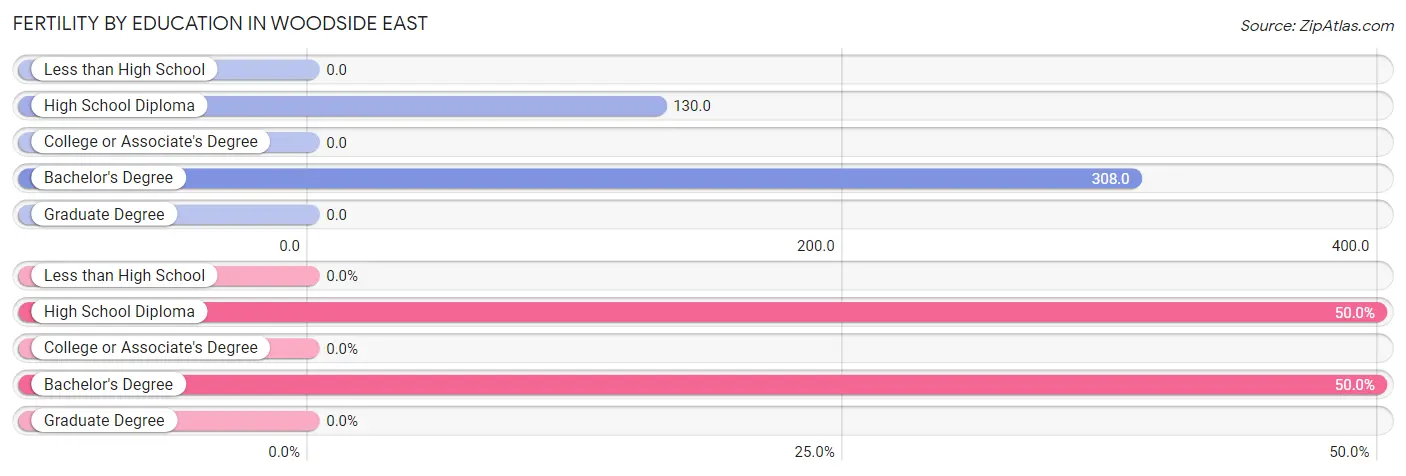
| Educational Attainment | Women with Births | Births / 1,000 Women |
| Less than High School | 0 (0.0%) | 0.0 |
| High School Diploma | 28 (50.0%) | 130.0 |
| College or Associate's Degree | 0 (0.0%) | 0.0 |
| Bachelor's Degree | 28 (50.0%) | 308.0 |
| Graduate Degree | 0 (0.0%) | 0.0 |
| Total | 56 (100.0%) | 100.0 |
Fertility by Education by Marriage Status in Woodside East
50.0% of women with births in Woodside East are unmarried. Women with the educational attainment of high school diploma are most likely to be married with 100.0% of them married at childbirth, while women with the educational attainment of bachelor's degree are least likely to be married with 100.0% of them unmarried at childbirth.
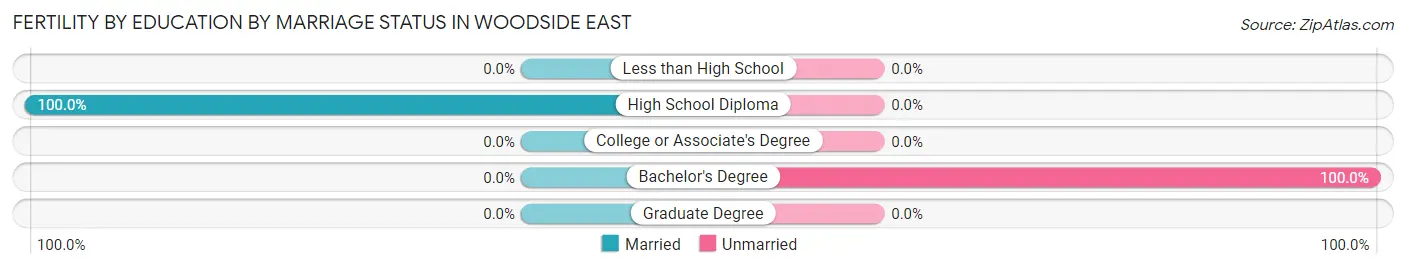
| Educational Attainment | Married | Unmarried |
| Less than High School | 0 (0.0%) | 0 (0.0%) |
| High School Diploma | 28 (100.0%) | 0 (0.0%) |
| College or Associate's Degree | 0 (0.0%) | 0 (0.0%) |
| Bachelor's Degree | 0 (0.0%) | 28 (100.0%) |
| Graduate Degree | 0 (0.0%) | 0 (0.0%) |
| Total | 28 (50.0%) | 28 (50.0%) |
Employment Characteristics in Woodside East
Employment by Class of Employer in Woodside East
Among the 614 employed individuals in Woodside East, private company employees (352 | 57.3%), not-for-profit organizations (89 | 14.5%), and self-employed (incorporated) (81 | 13.2%) make up the most common classes of employment.
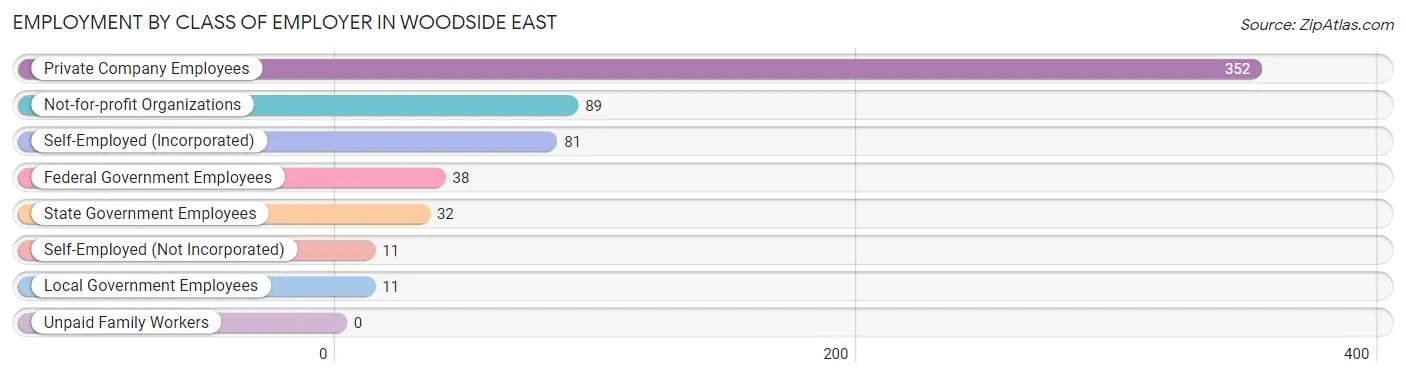
| Employer Class | # Employees | % Employees |
| Private Company Employees | 352 | 57.3% |
| Self-Employed (Incorporated) | 81 | 13.2% |
| Self-Employed (Not Incorporated) | 11 | 1.8% |
| Not-for-profit Organizations | 89 | 14.5% |
| Local Government Employees | 11 | 1.8% |
| State Government Employees | 32 | 5.2% |
| Federal Government Employees | 38 | 6.2% |
| Unpaid Family Workers | 0 | 0.0% |
| Total | 614 | 100.0% |
Employment Status by Age in Woodside East
According to the labor force statistics for Woodside East, out of the total population over 16 years of age (1,498), 55.1% or 825 individuals are in the labor force, with 22.3% or 184 of them unemployed. The age group with the highest labor force participation rate is 20 to 24 years, with 100.0% or 51 individuals in the labor force. Within the labor force, the 30 to 34 years age range has the highest percentage of unemployed individuals, with 47.7% or 106 of them being unemployed.
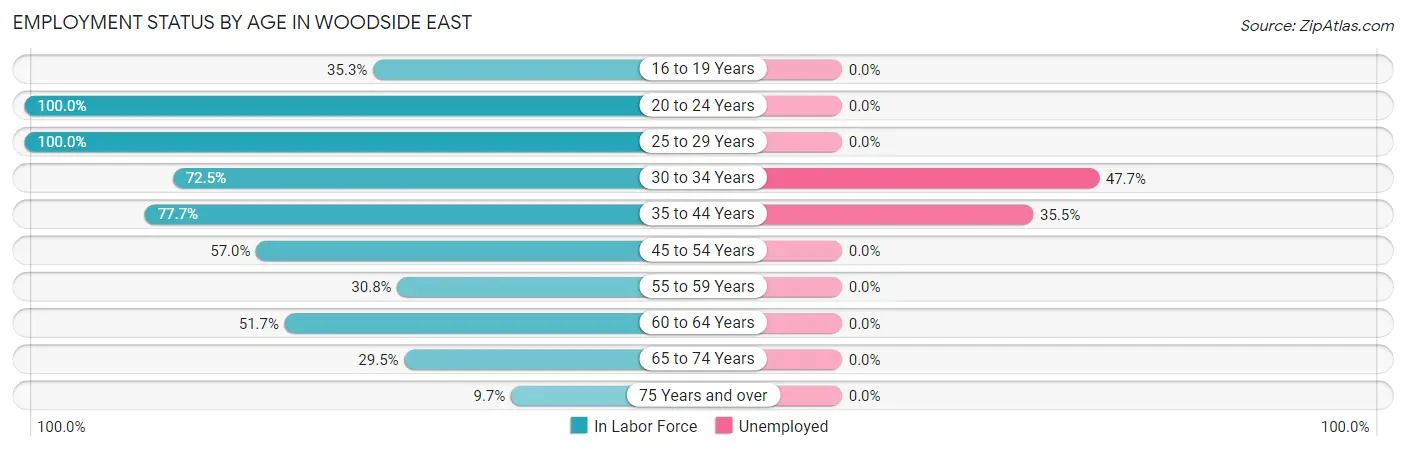
| Age Bracket | In Labor Force | Unemployed |
| 16 to 19 Years | 18 (35.3%) | 0 (0.0%) |
| 20 to 24 Years | 51 (100.0%) | 0 (0.0%) |
| 25 to 29 Years | 16 (100.0%) | 0 (0.0%) |
| 30 to 34 Years | 222 (72.5%) | 106 (47.7%) |
| 35 to 44 Years | 220 (77.7%) | 78 (35.5%) |
| 45 to 54 Years | 163 (57.0%) | 0 (0.0%) |
| 55 to 59 Years | 72 (30.8%) | 0 (0.0%) |
| 60 to 64 Years | 15 (51.7%) | 0 (0.0%) |
| 65 to 74 Years | 38 (29.5%) | 0 (0.0%) |
| 75 Years and over | 11 (9.7%) | 0 (0.0%) |
| Total | 825 (55.1%) | 184 (22.3%) |
Employment Status by Educational Attainment in Woodside East
According to labor force statistics for Woodside East, 61.4% of individuals (709) out of the total population between 25 and 64 years of age (1,154) are in the labor force, with 26.0% or 184 of them being unemployed. The group with the highest labor force participation rate are those with the educational attainment of bachelor's degree or higher, with 94.6% or 175 individuals in the labor force. Within the labor force, individuals with high school diploma education have the highest percentage of unemployment, with 66.4% or 142 of them being unemployed.
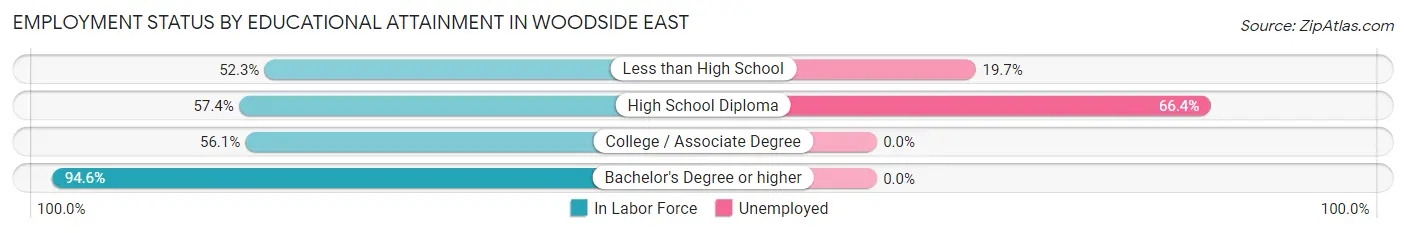
| Educational Attainment | In Labor Force | Unemployed |
| Less than High School | 213 (52.3%) | 80 (19.7%) |
| High School Diploma | 214 (57.4%) | 248 (66.4%) |
| College / Associate Degree | 106 (56.1%) | 0 (0.0%) |
| Bachelor's Degree or higher | 175 (94.6%) | 0 (0.0%) |
| Total | 709 (61.4%) | 300 (26.0%) |
Employment Occupations by Sex in Woodside East
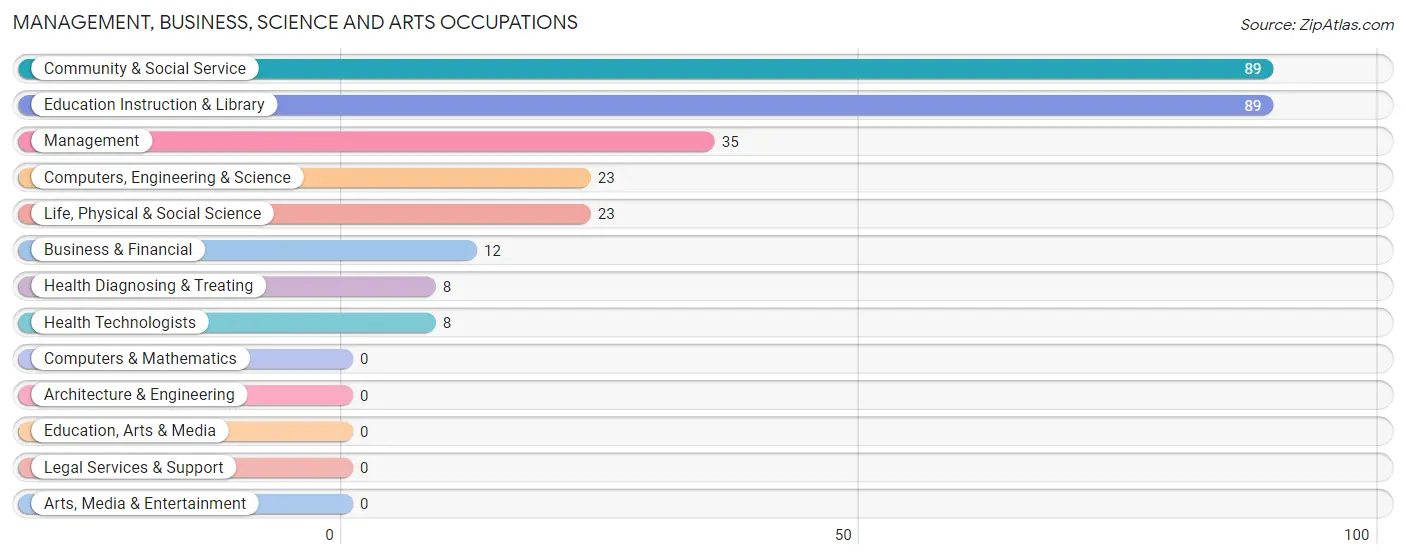
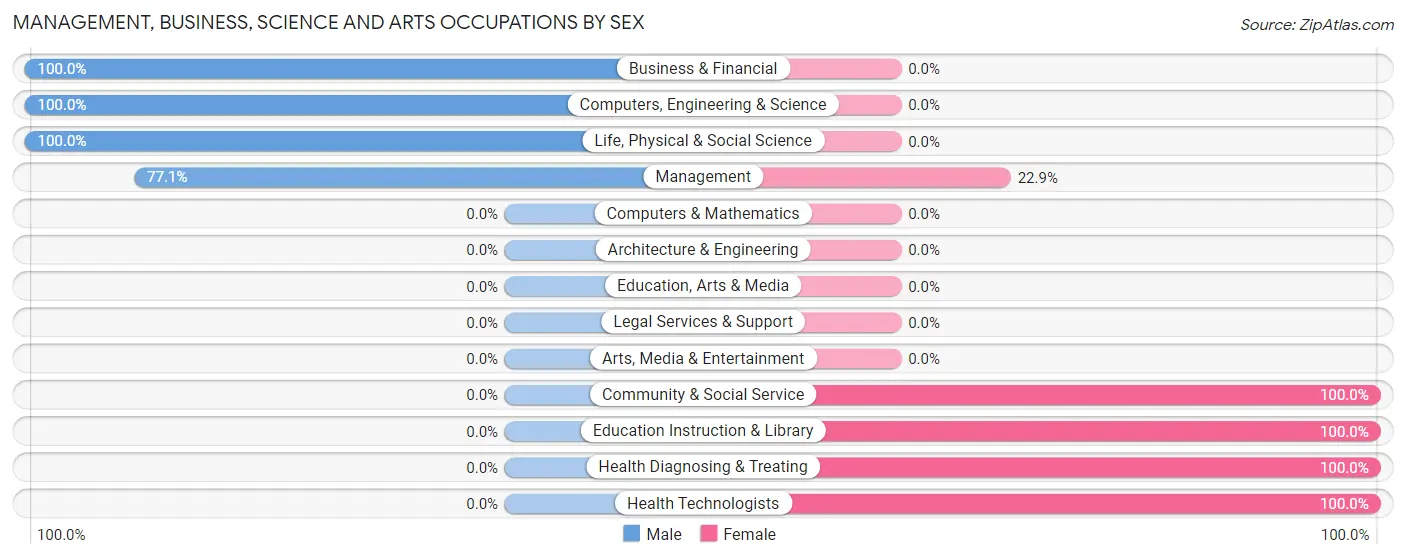
Management, Business, Science and Arts Occupations
The most common Management, Business, Science and Arts occupations in Woodside East are Community & Social Service (89 | 13.9%), Education Instruction & Library (89 | 13.9%), Management (35 | 5.4%), Computers, Engineering & Science (23 | 3.6%), and Life, Physical & Social Science (23 | 3.6%).
Management, Business, Science and Arts Occupations by Sex
Within the Management, Business, Science and Arts occupations in Woodside East, the most male-oriented occupations are Business & Financial (100.0%), Computers, Engineering & Science (100.0%), and Life, Physical & Social Science (100.0%), while the most female-oriented occupations are Community & Social Service (100.0%), Education Instruction & Library (100.0%), and Health Diagnosing & Treating (100.0%).
| Occupation | Male | Female |
| Management | 27 (77.1%) | 8 (22.9%) |
| Business & Financial | 12 (100.0%) | 0 (0.0%) |
| Computers, Engineering & Science | 23 (100.0%) | 0 (0.0%) |
| Computers & Mathematics | 0 (0.0%) | 0 (0.0%) |
| Architecture & Engineering | 0 (0.0%) | 0 (0.0%) |
| Life, Physical & Social Science | 23 (100.0%) | 0 (0.0%) |
| Community & Social Service | 0 (0.0%) | 89 (100.0%) |
| Education, Arts & Media | 0 (0.0%) | 0 (0.0%) |
| Legal Services & Support | 0 (0.0%) | 0 (0.0%) |
| Education Instruction & Library | 0 (0.0%) | 89 (100.0%) |
| Arts, Media & Entertainment | 0 (0.0%) | 0 (0.0%) |
| Health Diagnosing & Treating | 0 (0.0%) | 8 (100.0%) |
| Health Technologists | 0 (0.0%) | 8 (100.0%) |
| Total (Category) | 62 (37.1%) | 105 (62.9%) |
| Total (Overall) | 265 (41.3%) | 377 (58.7%) |
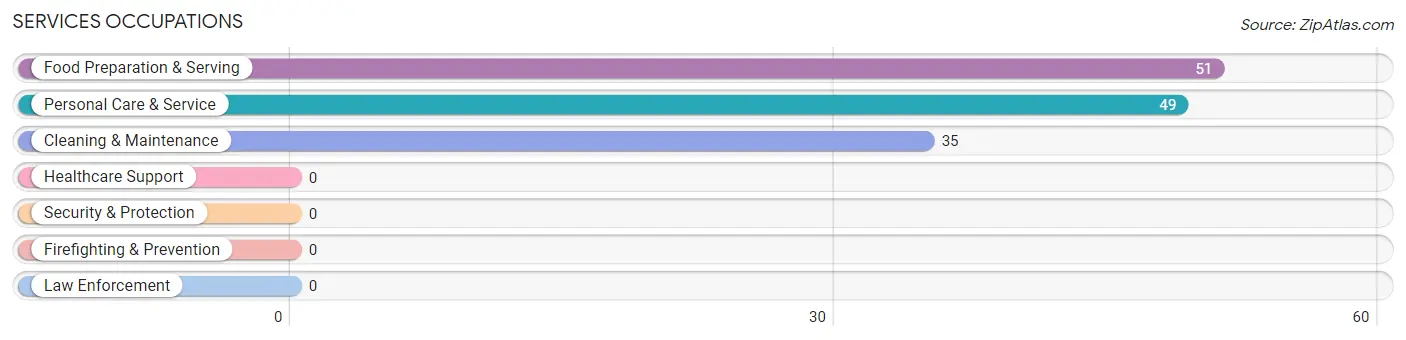
Services Occupations
The most common Services occupations in Woodside East are Food Preparation & Serving (51 | 7.9%), Personal Care & Service (49 | 7.6%), and Cleaning & Maintenance (35 | 5.4%).
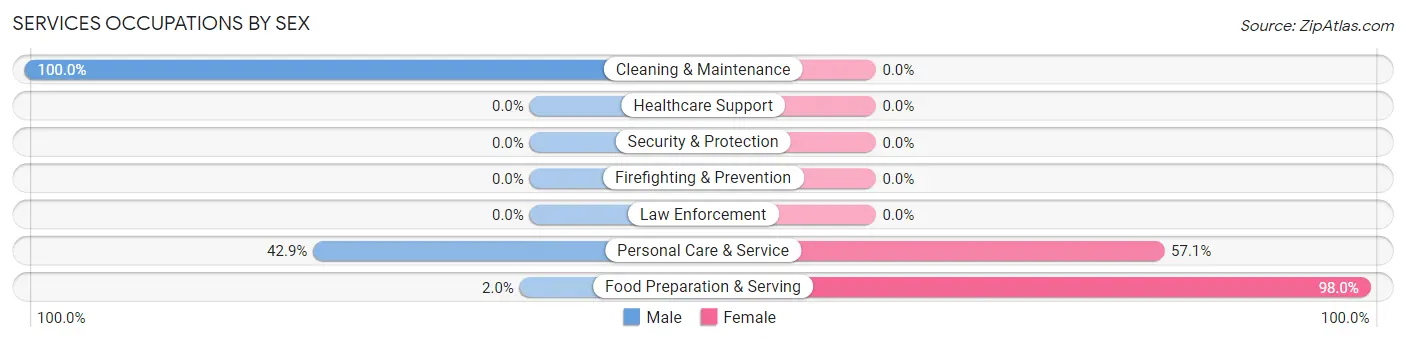
Services Occupations by Sex
Within the Services occupations in Woodside East, the most male-oriented occupations are Cleaning & Maintenance (100.0%), Personal Care & Service (42.9%), and Food Preparation & Serving (2.0%), while the most female-oriented occupations are Food Preparation & Serving (98.0%), and Personal Care & Service (57.1%).
| Occupation | Male | Female |
| Healthcare Support | 0 (0.0%) | 0 (0.0%) |
| Security & Protection | 0 (0.0%) | 0 (0.0%) |
| Firefighting & Prevention | 0 (0.0%) | 0 (0.0%) |
| Law Enforcement | 0 (0.0%) | 0 (0.0%) |
| Food Preparation & Serving | 1 (2.0%) | 50 (98.0%) |
| Cleaning & Maintenance | 35 (100.0%) | 0 (0.0%) |
| Personal Care & Service | 21 (42.9%) | 28 (57.1%) |
| Total (Category) | 57 (42.2%) | 78 (57.8%) |
| Total (Overall) | 265 (41.3%) | 377 (58.7%) |
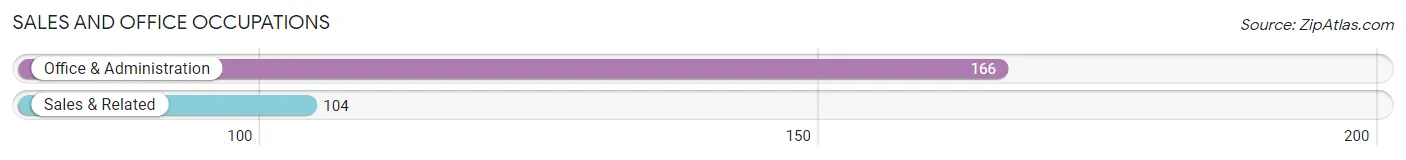
Sales and Office Occupations
The most common Sales and Office occupations in Woodside East are Office & Administration (166 | 25.9%), and Sales & Related (104 | 16.2%).
Sales and Office Occupations by Sex
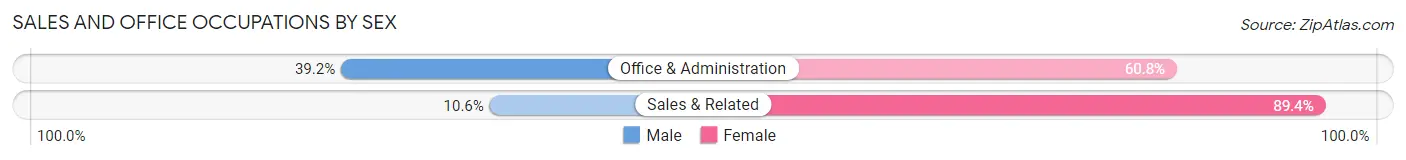
| Occupation | Male | Female |
| Sales & Related | 11 (10.6%) | 93 (89.4%) |
| Office & Administration | 65 (39.2%) | 101 (60.8%) |
| Total (Category) | 76 (28.1%) | 194 (71.9%) |
| Total (Overall) | 265 (41.3%) | 377 (58.7%) |
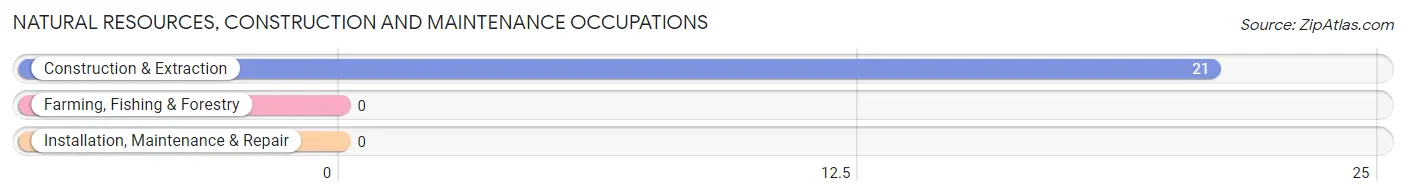
Natural Resources, Construction and Maintenance Occupations
The most common Natural Resources, Construction and Maintenance occupations in Woodside East are , and Construction & Extraction (21 | 3.3%).
Natural Resources, Construction and Maintenance Occupations by Sex
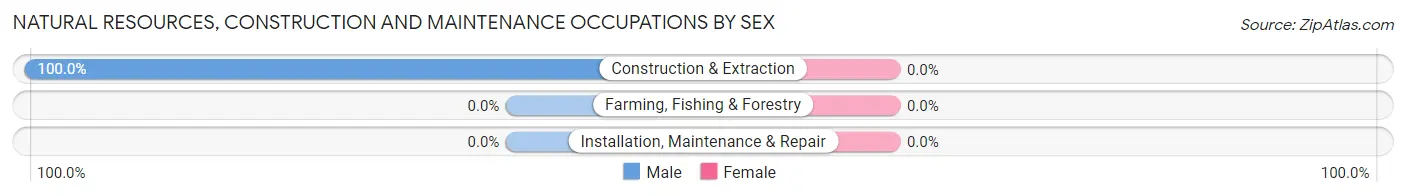
| Occupation | Male | Female |
| Farming, Fishing & Forestry | 0 (0.0%) | 0 (0.0%) |
| Construction & Extraction | 21 (100.0%) | 0 (0.0%) |
| Installation, Maintenance & Repair | 0 (0.0%) | 0 (0.0%) |
| Total (Category) | 21 (100.0%) | 0 (0.0%) |
| Total (Overall) | 265 (41.3%) | 377 (58.7%) |
Production, Transportation and Moving Occupations
The most common Production, Transportation and Moving occupations in Woodside East are , and Production (49 | 7.6%).
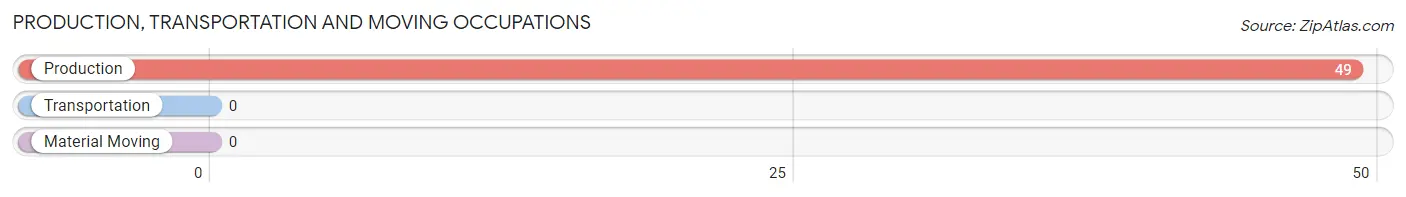
Production, Transportation and Moving Occupations by Sex
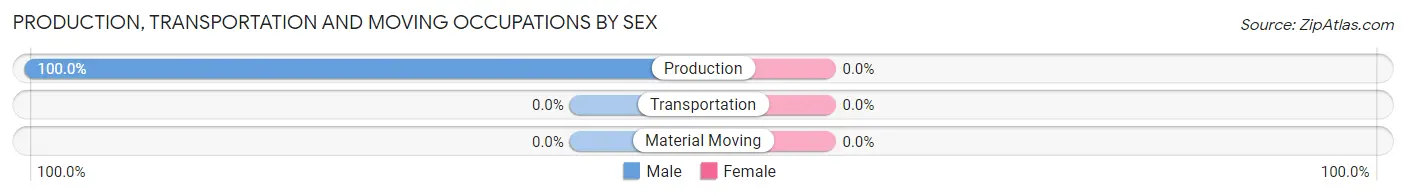
| Occupation | Male | Female |
| Production | 49 (100.0%) | 0 (0.0%) |
| Transportation | 0 (0.0%) | 0 (0.0%) |
| Material Moving | 0 (0.0%) | 0 (0.0%) |
| Total (Category) | 49 (100.0%) | 0 (0.0%) |
| Total (Overall) | 265 (41.3%) | 377 (58.7%) |
Employment Industries by Sex in Woodside East
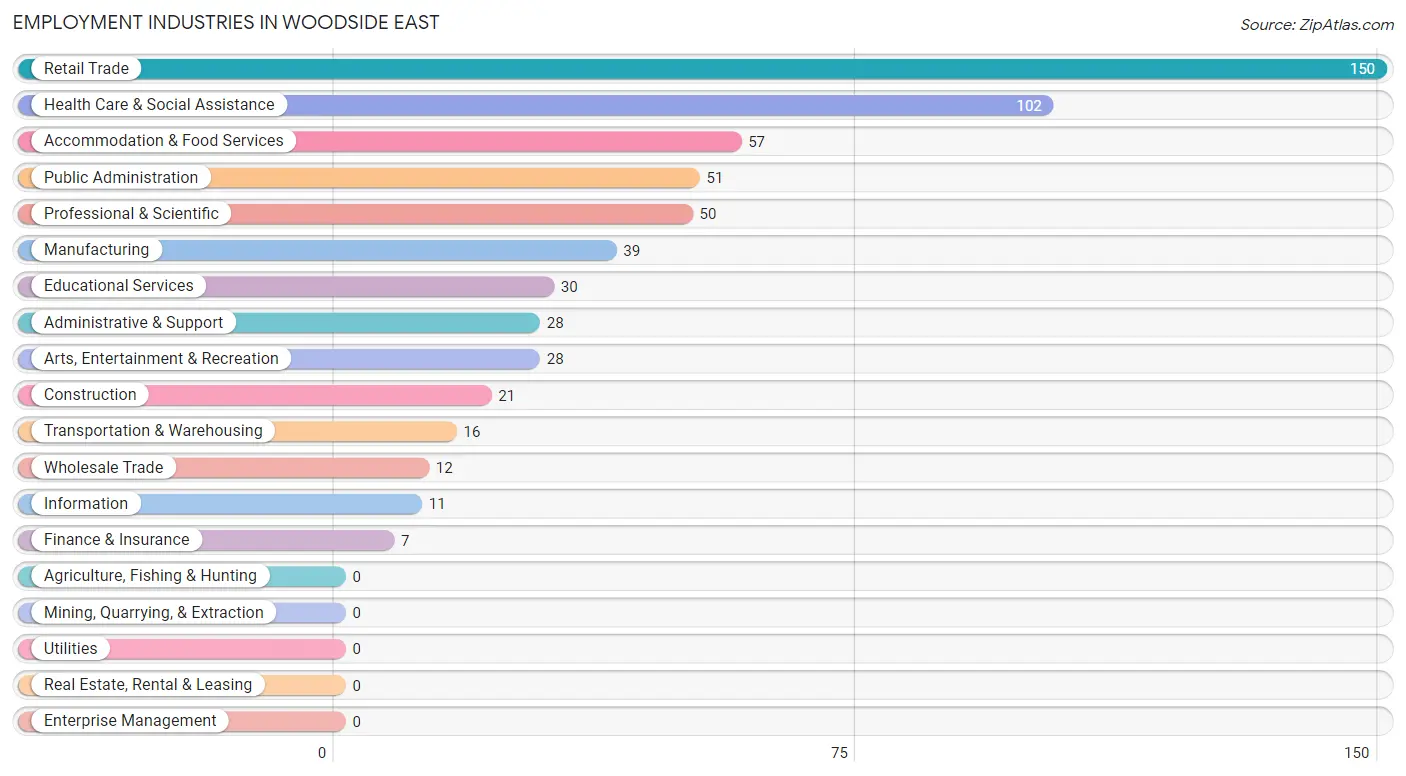
Employment Industries in Woodside East
The major employment industries in Woodside East include Retail Trade (150 | 23.4%), Health Care & Social Assistance (102 | 15.9%), Accommodation & Food Services (57 | 8.9%), Public Administration (51 | 7.9%), and Professional & Scientific (50 | 7.8%).
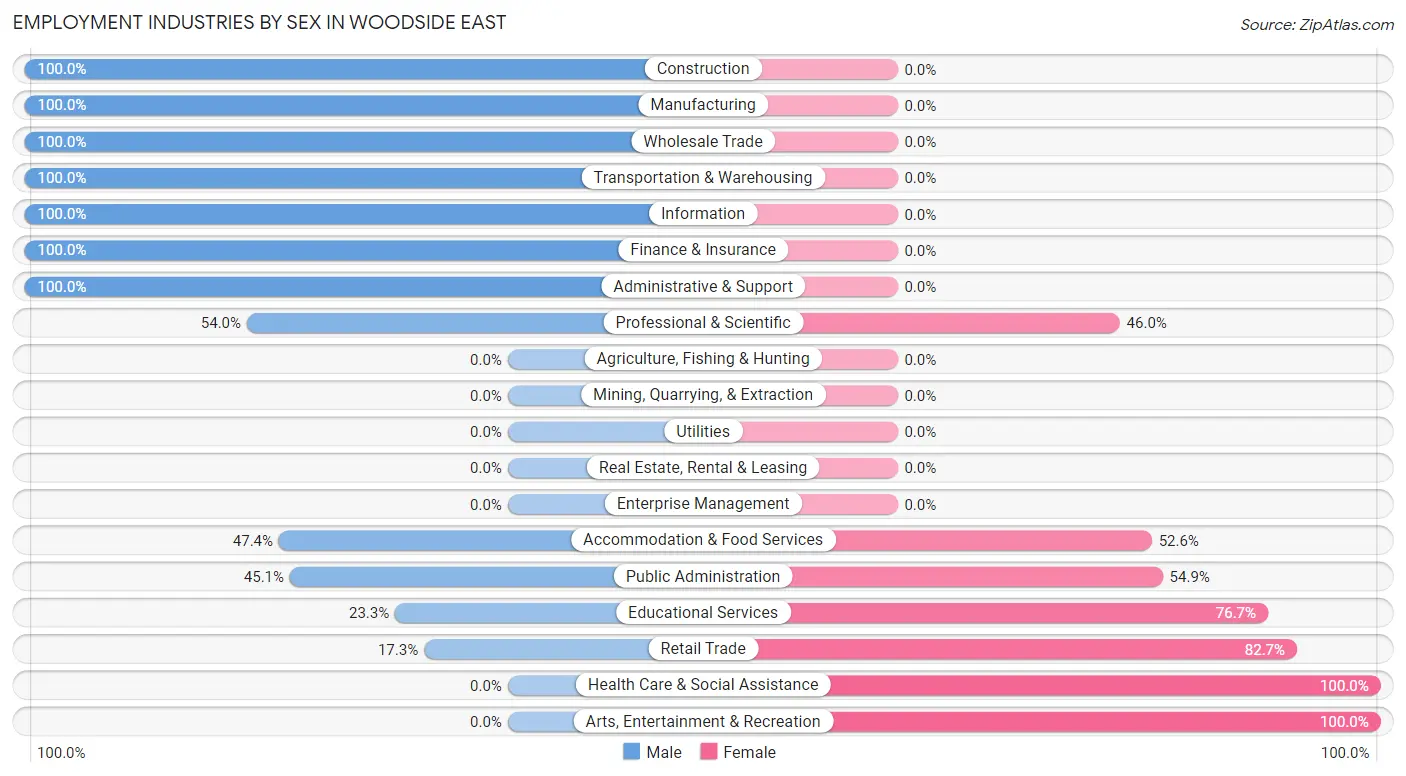
Employment Industries by Sex in Woodside East
The Woodside East industries that see more men than women are Construction (100.0%), Manufacturing (100.0%), and Wholesale Trade (100.0%), whereas the industries that tend to have a higher number of women are Health Care & Social Assistance (100.0%), Arts, Entertainment & Recreation (100.0%), and Retail Trade (82.7%).
| Industry | Male | Female |
| Agriculture, Fishing & Hunting | 0 (0.0%) | 0 (0.0%) |
| Mining, Quarrying, & Extraction | 0 (0.0%) | 0 (0.0%) |
| Construction | 21 (100.0%) | 0 (0.0%) |
| Manufacturing | 39 (100.0%) | 0 (0.0%) |
| Wholesale Trade | 12 (100.0%) | 0 (0.0%) |
| Retail Trade | 26 (17.3%) | 124 (82.7%) |
| Transportation & Warehousing | 16 (100.0%) | 0 (0.0%) |
| Utilities | 0 (0.0%) | 0 (0.0%) |
| Information | 11 (100.0%) | 0 (0.0%) |
| Finance & Insurance | 7 (100.0%) | 0 (0.0%) |
| Real Estate, Rental & Leasing | 0 (0.0%) | 0 (0.0%) |
| Professional & Scientific | 27 (54.0%) | 23 (46.0%) |
| Enterprise Management | 0 (0.0%) | 0 (0.0%) |
| Administrative & Support | 28 (100.0%) | 0 (0.0%) |
| Educational Services | 7 (23.3%) | 23 (76.7%) |
| Health Care & Social Assistance | 0 (0.0%) | 102 (100.0%) |
| Arts, Entertainment & Recreation | 0 (0.0%) | 28 (100.0%) |
| Accommodation & Food Services | 27 (47.4%) | 30 (52.6%) |
| Public Administration | 23 (45.1%) | 28 (54.9%) |
| Total | 265 (41.3%) | 377 (58.7%) |
Education in Woodside East
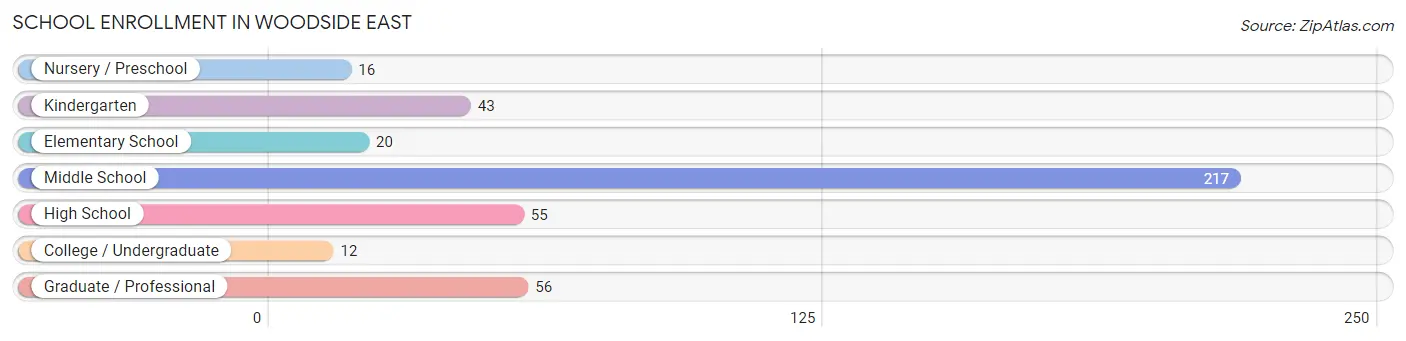
School Enrollment in Woodside East
The most common levels of schooling among the 419 students in Woodside East are middle school (217 | 51.8%), graduate / professional (56 | 13.4%), and high school (55 | 13.1%).
| School Level | # Students | % Students |
| Nursery / Preschool | 16 | 3.8% |
| Kindergarten | 43 | 10.3% |
| Elementary School | 20 | 4.8% |
| Middle School | 217 | 51.8% |
| High School | 55 | 13.1% |
| College / Undergraduate | 12 | 2.9% |
| Graduate / Professional | 56 | 13.4% |
| Total | 419 | 100.0% |
School Enrollment by Age by Funding Source in Woodside East
Out of a total of 419 students who are enrolled in schools in Woodside East, 30 (7.2%) attend a private institution, while the remaining 389 (92.8%) are enrolled in public schools. The age group of 5 to 9 year old has the highest likelihood of being enrolled in private schools, with 30 (47.6% in the age bracket) enrolled. Conversely, the age group of 3 to 4 year olds has the lowest likelihood of being enrolled in a private school, with 16 (100.0% in the age bracket) attending a public institution.
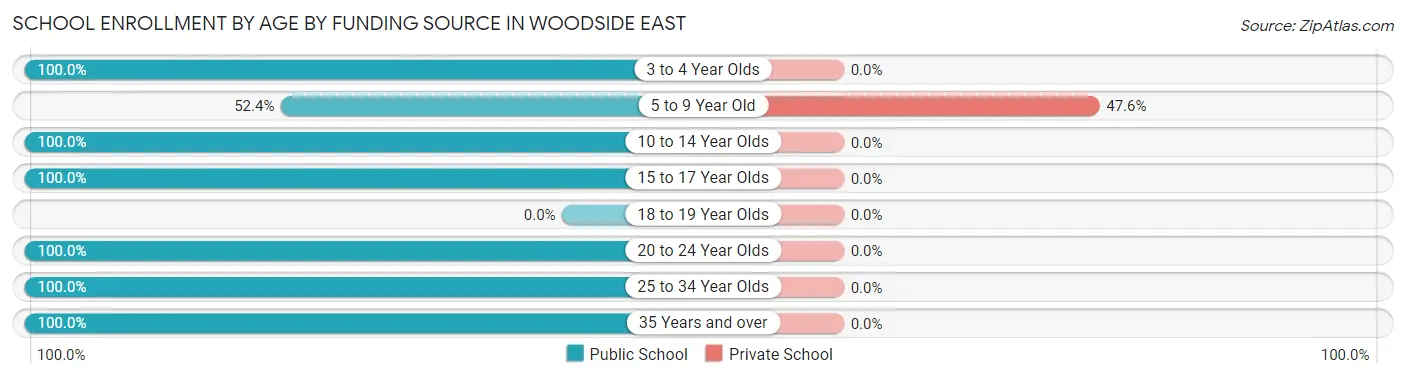
| Age Bracket | Public School | Private School |
| 3 to 4 Year Olds | 16 (100.0%) | 0 (0.0%) |
| 5 to 9 Year Old | 33 (52.4%) | 30 (47.6%) |
| 10 to 14 Year Olds | 239 (100.0%) | 0 (0.0%) |
| 15 to 17 Year Olds | 33 (100.0%) | 0 (0.0%) |
| 18 to 19 Year Olds | 0 (0.0%) | 0 (0.0%) |
| 20 to 24 Year Olds | 12 (100.0%) | 0 (0.0%) |
| 25 to 34 Year Olds | 29 (100.0%) | 0 (0.0%) |
| 35 Years and over | 27 (100.0%) | 0 (0.0%) |
| Total | 389 (92.8%) | 30 (7.2%) |
Educational Attainment by Field of Study in Woodside East
Arts & humanities (59 | 30.6%), psychology (28 | 14.5%), engineering (27 | 14.0%), business (27 | 14.0%), and literature & languages (21 | 10.9%) are the most common fields of study among 193 individuals in Woodside East who have obtained a bachelor's degree or higher.
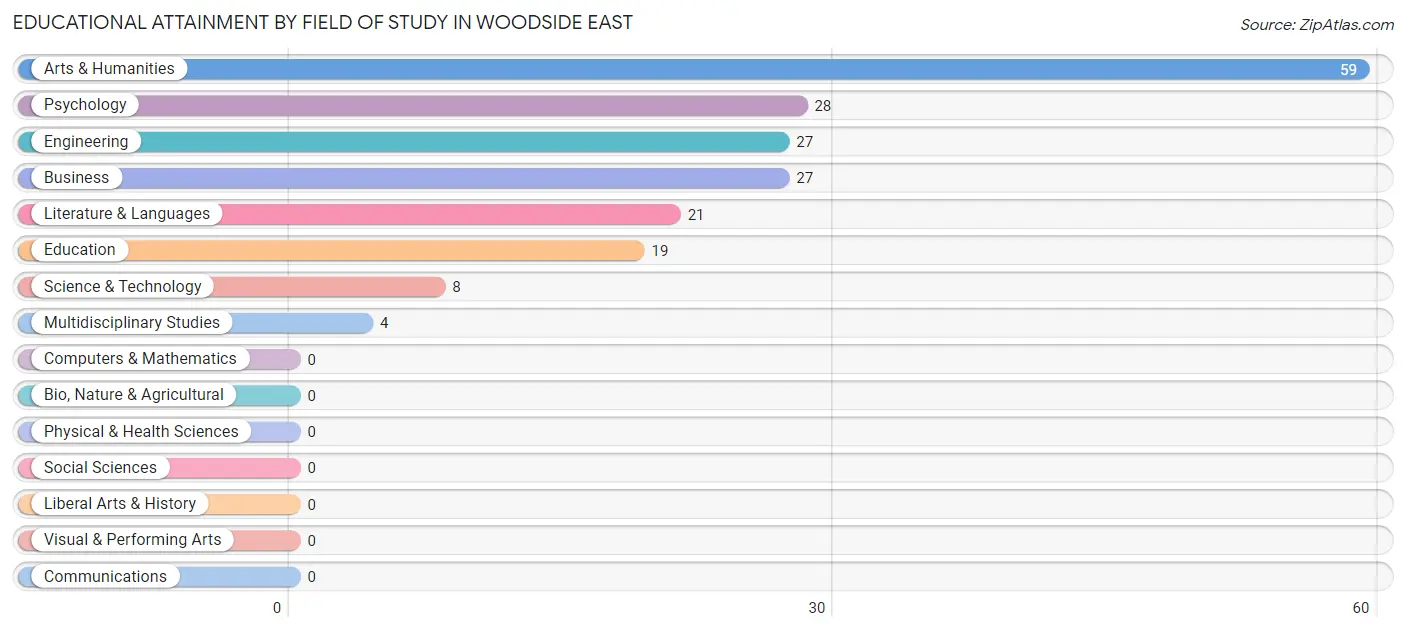
| Field of Study | # Graduates | % Graduates |
| Computers & Mathematics | 0 | 0.0% |
| Bio, Nature & Agricultural | 0 | 0.0% |
| Physical & Health Sciences | 0 | 0.0% |
| Psychology | 28 | 14.5% |
| Social Sciences | 0 | 0.0% |
| Engineering | 27 | 14.0% |
| Multidisciplinary Studies | 4 | 2.1% |
| Science & Technology | 8 | 4.2% |
| Business | 27 | 14.0% |
| Education | 19 | 9.8% |
| Literature & Languages | 21 | 10.9% |
| Liberal Arts & History | 0 | 0.0% |
| Visual & Performing Arts | 0 | 0.0% |
| Communications | 0 | 0.0% |
| Arts & Humanities | 59 | 30.6% |
| Total | 193 | 100.0% |
Transportation & Commute in Woodside East
Vehicle Availability by Sex in Woodside East
The most prevalent vehicle ownership categories in Woodside East are males with 2 vehicles (145, accounting for 54.7%) and females with 2 vehicles (151, making up 41.5%).
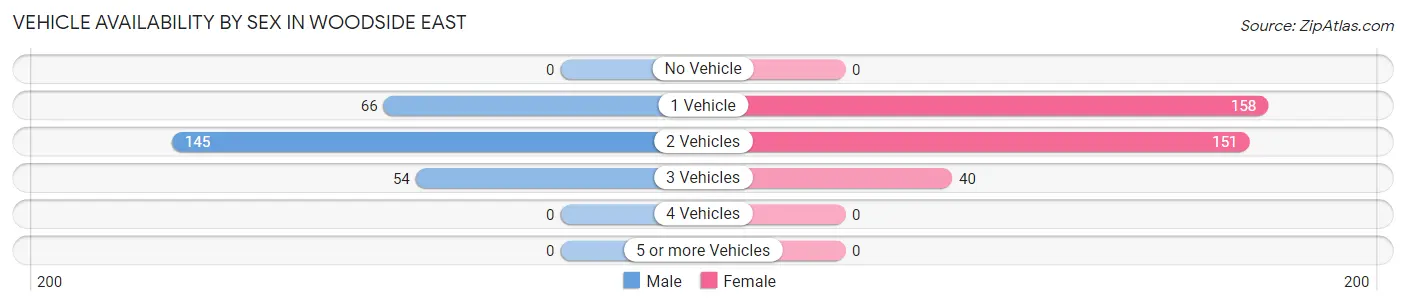
| Vehicles Available | Male | Female |
| No Vehicle | 0 (0.0%) | 0 (0.0%) |
| 1 Vehicle | 66 (24.9%) | 158 (45.3%) |
| 2 Vehicles | 145 (54.7%) | 151 (43.3%) |
| 3 Vehicles | 54 (20.4%) | 40 (11.5%) |
| 4 Vehicles | 0 (0.0%) | 0 (0.0%) |
| 5 or more Vehicles | 0 (0.0%) | 0 (0.0%) |
| Total | 265 (100.0%) | 349 (100.0%) |
Commute Time in Woodside East
The most frequently occuring commute durations in Woodside East are 15 to 19 minutes (178 commuters, 31.4%), 10 to 14 minutes (163 commuters, 28.7%), and 20 to 24 minutes (85 commuters, 15.0%).
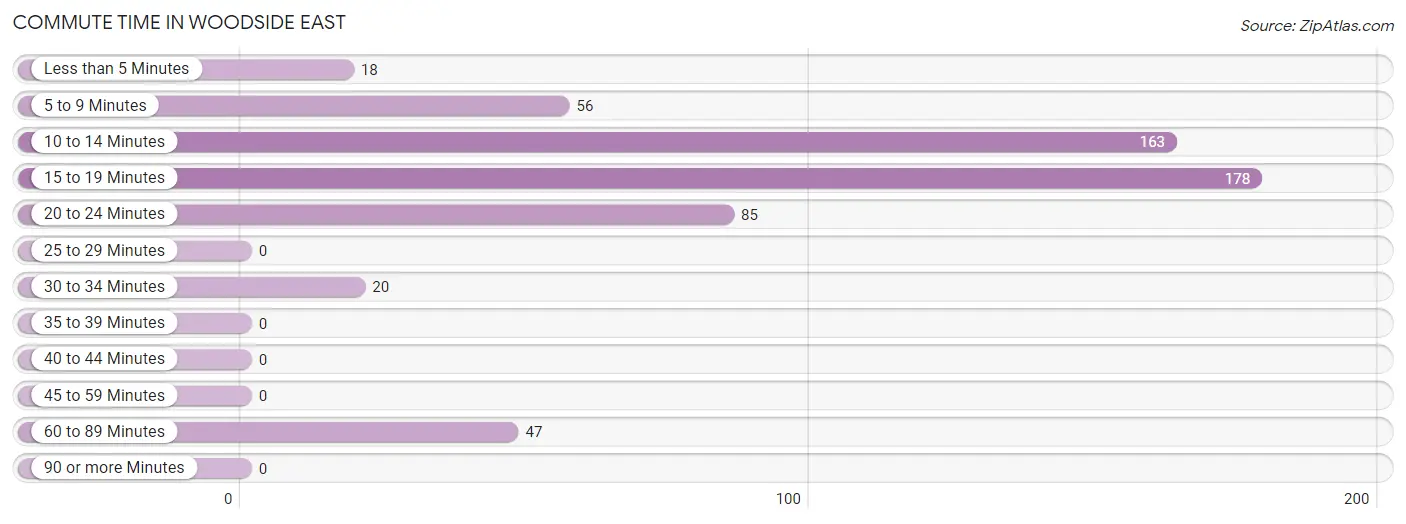
| Commute Time | # Commuters | % Commuters |
| Less than 5 Minutes | 18 | 3.2% |
| 5 to 9 Minutes | 56 | 9.9% |
| 10 to 14 Minutes | 163 | 28.7% |
| 15 to 19 Minutes | 178 | 31.4% |
| 20 to 24 Minutes | 85 | 15.0% |
| 25 to 29 Minutes | 0 | 0.0% |
| 30 to 34 Minutes | 20 | 3.5% |
| 35 to 39 Minutes | 0 | 0.0% |
| 40 to 44 Minutes | 0 | 0.0% |
| 45 to 59 Minutes | 0 | 0.0% |
| 60 to 89 Minutes | 47 | 8.3% |
| 90 or more Minutes | 0 | 0.0% |
Commute Time by Sex in Woodside East
The most common commute times in Woodside East are 15 to 19 minutes (71 commuters, 31.4%) for males and 10 to 14 minutes (136 commuters, 39.9%) for females.
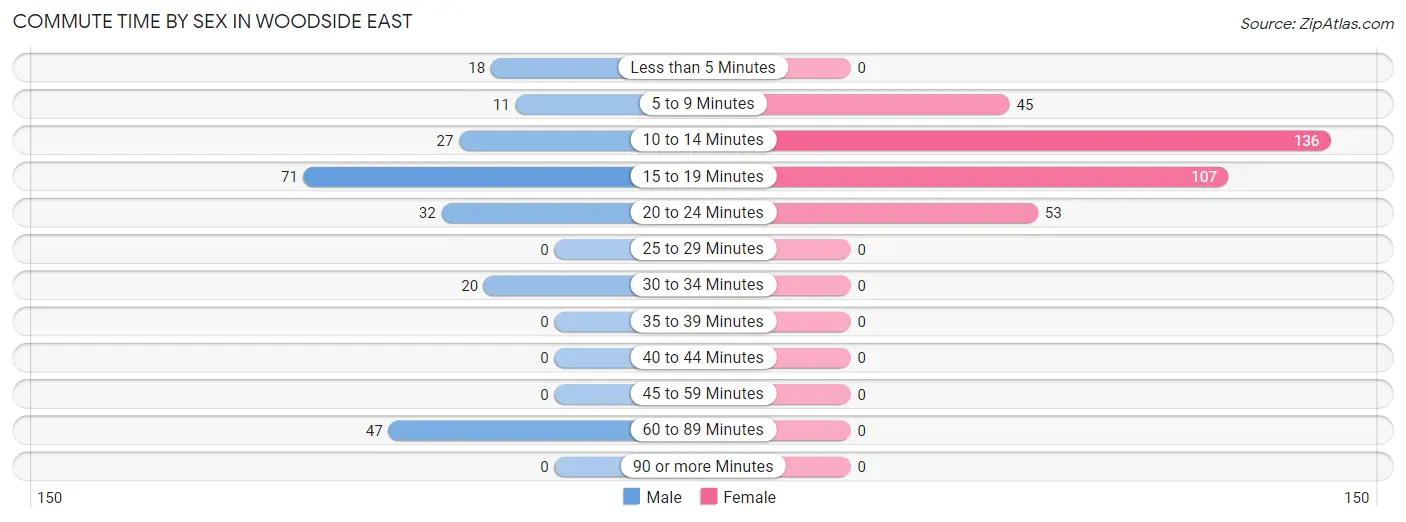
| Commute Time | Male | Female |
| Less than 5 Minutes | 18 (8.0%) | 0 (0.0%) |
| 5 to 9 Minutes | 11 (4.9%) | 45 (13.2%) |
| 10 to 14 Minutes | 27 (11.9%) | 136 (39.9%) |
| 15 to 19 Minutes | 71 (31.4%) | 107 (31.4%) |
| 20 to 24 Minutes | 32 (14.2%) | 53 (15.5%) |
| 25 to 29 Minutes | 0 (0.0%) | 0 (0.0%) |
| 30 to 34 Minutes | 20 (8.8%) | 0 (0.0%) |
| 35 to 39 Minutes | 0 (0.0%) | 0 (0.0%) |
| 40 to 44 Minutes | 0 (0.0%) | 0 (0.0%) |
| 45 to 59 Minutes | 0 (0.0%) | 0 (0.0%) |
| 60 to 89 Minutes | 47 (20.8%) | 0 (0.0%) |
| 90 or more Minutes | 0 (0.0%) | 0 (0.0%) |
Time of Departure to Work by Sex in Woodside East
The most frequent times of departure to work in Woodside East are 7:30 AM to 7:59 AM (47, 20.8%) for males and 8:00 AM to 8:29 AM (82, 24.0%) for females.
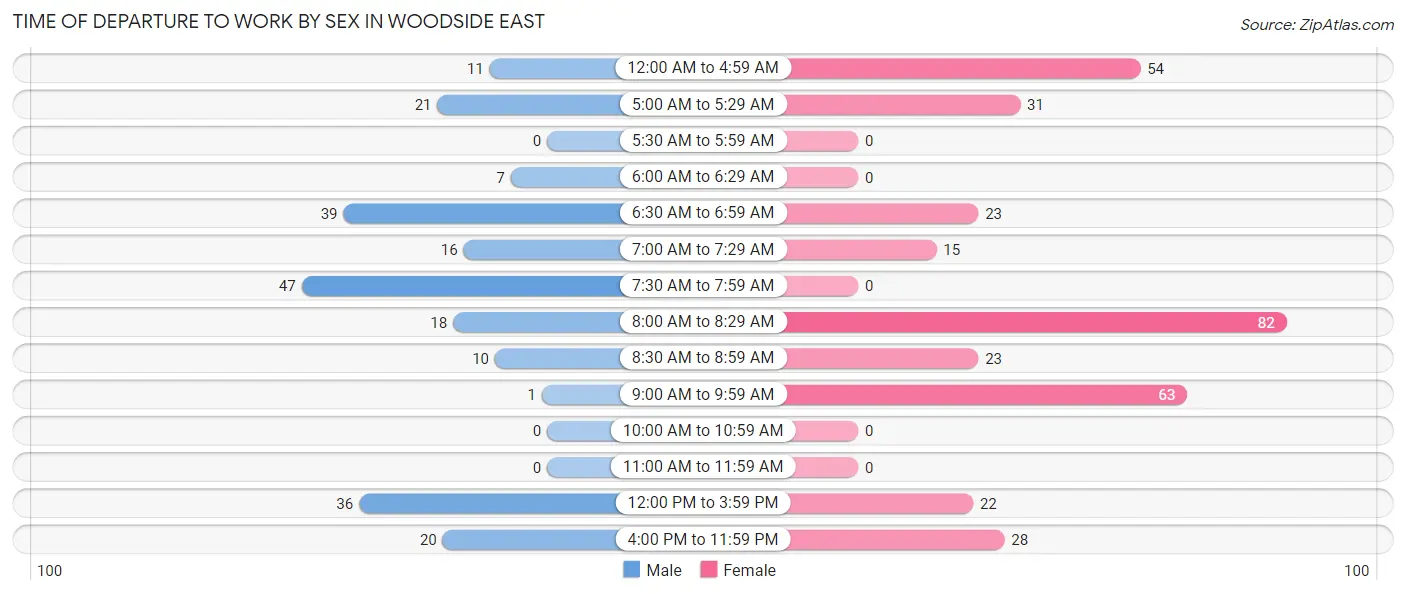
| Time of Departure | Male | Female |
| 12:00 AM to 4:59 AM | 11 (4.9%) | 54 (15.8%) |
| 5:00 AM to 5:29 AM | 21 (9.3%) | 31 (9.1%) |
| 5:30 AM to 5:59 AM | 0 (0.0%) | 0 (0.0%) |
| 6:00 AM to 6:29 AM | 7 (3.1%) | 0 (0.0%) |
| 6:30 AM to 6:59 AM | 39 (17.3%) | 23 (6.7%) |
| 7:00 AM to 7:29 AM | 16 (7.1%) | 15 (4.4%) |
| 7:30 AM to 7:59 AM | 47 (20.8%) | 0 (0.0%) |
| 8:00 AM to 8:29 AM | 18 (8.0%) | 82 (24.0%) |
| 8:30 AM to 8:59 AM | 10 (4.4%) | 23 (6.7%) |
| 9:00 AM to 9:59 AM | 1 (0.4%) | 63 (18.5%) |
| 10:00 AM to 10:59 AM | 0 (0.0%) | 0 (0.0%) |
| 11:00 AM to 11:59 AM | 0 (0.0%) | 0 (0.0%) |
| 12:00 PM to 3:59 PM | 36 (15.9%) | 22 (6.5%) |
| 4:00 PM to 11:59 PM | 20 (8.8%) | 28 (8.2%) |
| Total | 226 (100.0%) | 341 (100.0%) |
Housing Occupancy in Woodside East
Occupancy by Ownership in Woodside East
Of the total 757 dwellings in Woodside East, owner-occupied units account for 506 (66.8%), while renter-occupied units make up 251 (33.2%).
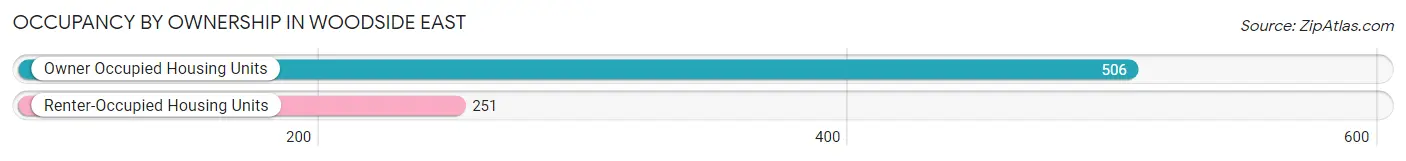
| Occupancy | # Housing Units | % Housing Units |
| Owner Occupied Housing Units | 506 | 66.8% |
| Renter-Occupied Housing Units | 251 | 33.2% |
| Total Occupied Housing Units | 757 | 100.0% |
Occupancy by Household Size in Woodside East
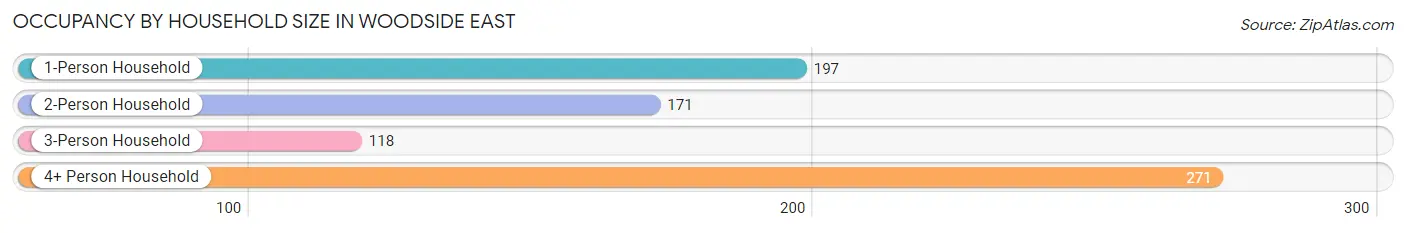
| Household Size | # Housing Units | % Housing Units |
| 1-Person Household | 197 | 26.0% |
| 2-Person Household | 171 | 22.6% |
| 3-Person Household | 118 | 15.6% |
| 4+ Person Household | 271 | 35.8% |
| Total Housing Units | 757 | 100.0% |
Occupancy by Ownership by Household Size in Woodside East
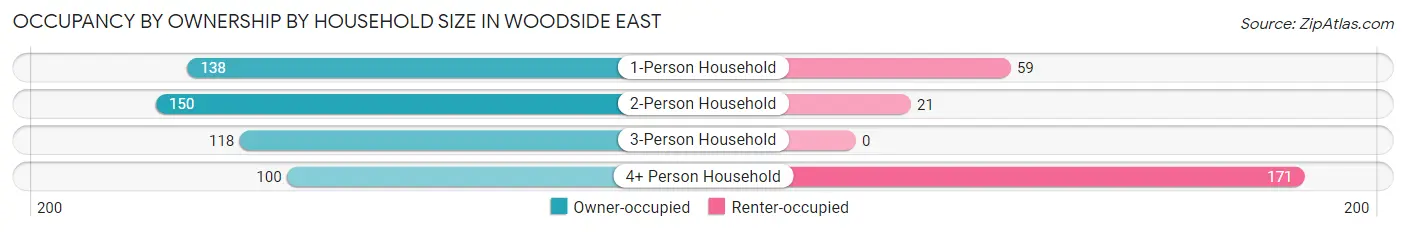
| Household Size | Owner-occupied | Renter-occupied |
| 1-Person Household | 138 (70.1%) | 59 (29.9%) |
| 2-Person Household | 150 (87.7%) | 21 (12.3%) |
| 3-Person Household | 118 (100.0%) | 0 (0.0%) |
| 4+ Person Household | 100 (36.9%) | 171 (63.1%) |
| Total Housing Units | 506 (66.8%) | 251 (33.2%) |
Occupancy by Educational Attainment in Woodside East
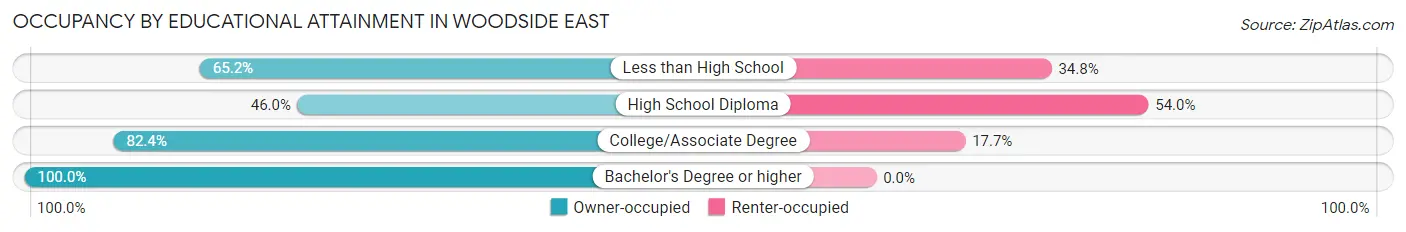
| Household Size | Owner-occupied | Renter-occupied |
| Less than High School | 152 (65.2%) | 81 (34.8%) |
| High School Diploma | 122 (46.0%) | 143 (54.0%) |
| College/Associate Degree | 126 (82.4%) | 27 (17.6%) |
| Bachelor's Degree or higher | 106 (100.0%) | 0 (0.0%) |
Occupancy by Age of Householder in Woodside East
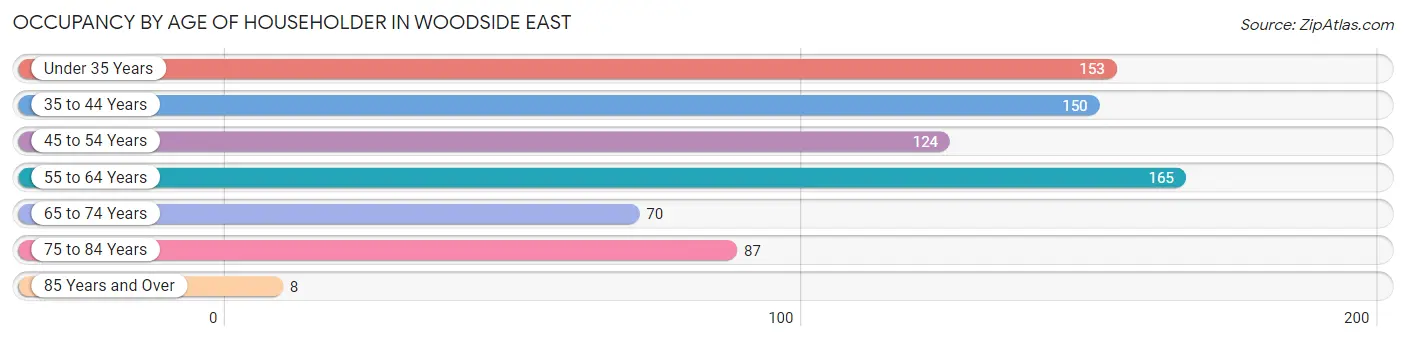
| Age Bracket | # Households | % Households |
| Under 35 Years | 153 | 20.2% |
| 35 to 44 Years | 150 | 19.8% |
| 45 to 54 Years | 124 | 16.4% |
| 55 to 64 Years | 165 | 21.8% |
| 65 to 74 Years | 70 | 9.2% |
| 75 to 84 Years | 87 | 11.5% |
| 85 Years and Over | 8 | 1.1% |
| Total | 757 | 100.0% |
Housing Finances in Woodside East
Median Income by Occupancy in Woodside East
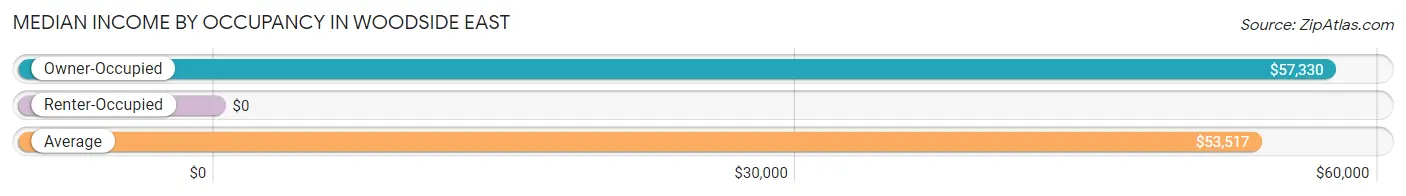
| Occupancy Type | # Households | Median Income |
| Owner-Occupied | 506 (66.8%) | $57,330 |
| Renter-Occupied | 251 (33.2%) | $0 |
| Average | 757 (100.0%) | $53,517 |
Occupancy by Householder Income Bracket in Woodside East
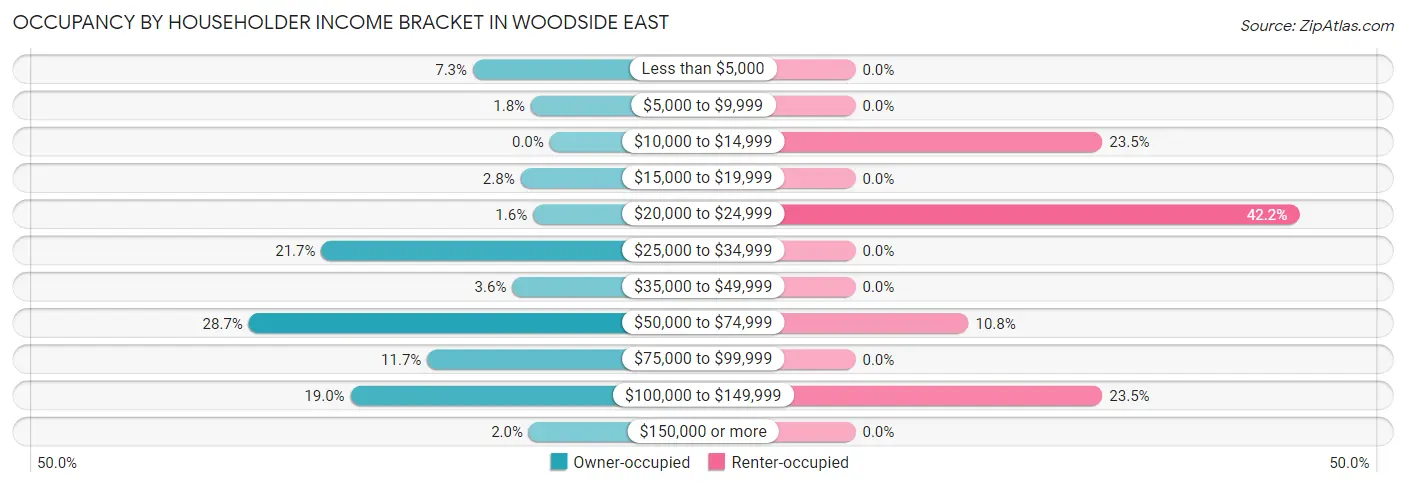
| Income Bracket | Owner-occupied | Renter-occupied |
| Less than $5,000 | 37 (7.3%) | 0 (0.0%) |
| $5,000 to $9,999 | 9 (1.8%) | 0 (0.0%) |
| $10,000 to $14,999 | 0 (0.0%) | 59 (23.5%) |
| $15,000 to $19,999 | 14 (2.8%) | 0 (0.0%) |
| $20,000 to $24,999 | 8 (1.6%) | 106 (42.2%) |
| $25,000 to $34,999 | 110 (21.7%) | 0 (0.0%) |
| $35,000 to $49,999 | 18 (3.6%) | 0 (0.0%) |
| $50,000 to $74,999 | 145 (28.7%) | 27 (10.8%) |
| $75,000 to $99,999 | 59 (11.7%) | 0 (0.0%) |
| $100,000 to $149,999 | 96 (19.0%) | 59 (23.5%) |
| $150,000 or more | 10 (2.0%) | 0 (0.0%) |
| Total | 506 (100.0%) | 251 (100.0%) |
Monthly Housing Cost Tiers in Woodside East
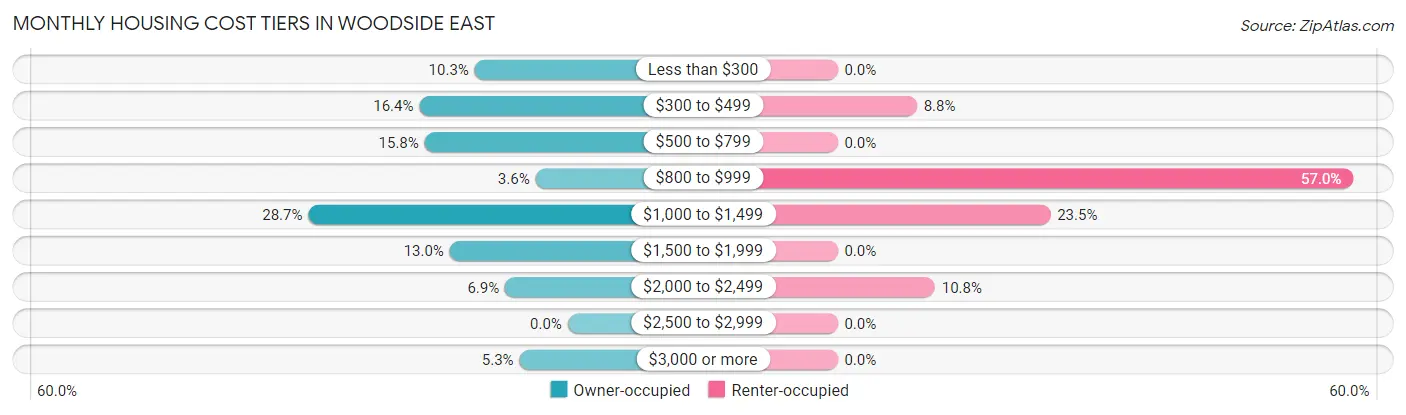
| Monthly Cost | Owner-occupied | Renter-occupied |
| Less than $300 | 52 (10.3%) | 0 (0.0%) |
| $300 to $499 | 83 (16.4%) | 22 (8.8%) |
| $500 to $799 | 80 (15.8%) | 0 (0.0%) |
| $800 to $999 | 18 (3.6%) | 143 (57.0%) |
| $1,000 to $1,499 | 145 (28.7%) | 59 (23.5%) |
| $1,500 to $1,999 | 66 (13.0%) | 0 (0.0%) |
| $2,000 to $2,499 | 35 (6.9%) | 27 (10.8%) |
| $2,500 to $2,999 | 0 (0.0%) | 0 (0.0%) |
| $3,000 or more | 27 (5.3%) | 0 (0.0%) |
| Total | 506 (100.0%) | 251 (100.0%) |
Physical Housing Characteristics in Woodside East
Housing Structures in Woodside East
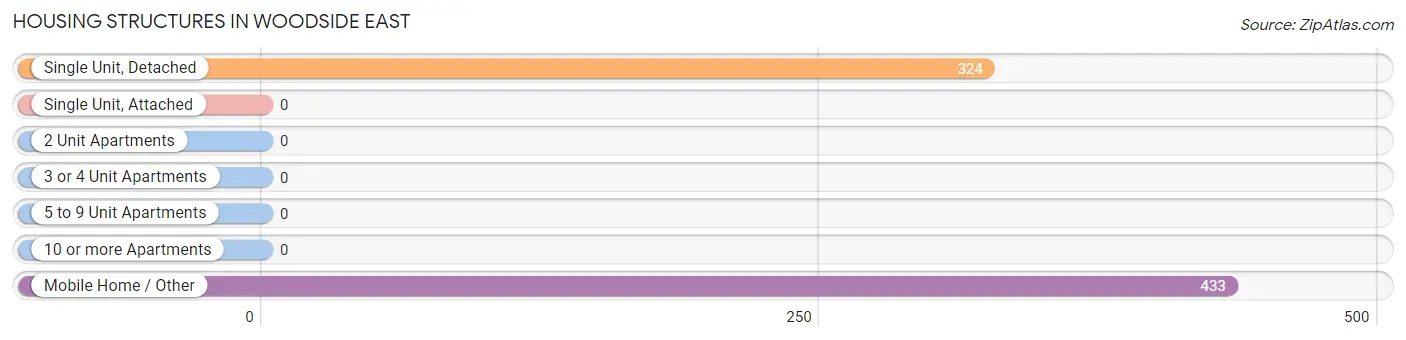
| Structure Type | # Housing Units | % Housing Units |
| Single Unit, Detached | 324 | 42.8% |
| Single Unit, Attached | 0 | 0.0% |
| 2 Unit Apartments | 0 | 0.0% |
| 3 or 4 Unit Apartments | 0 | 0.0% |
| 5 to 9 Unit Apartments | 0 | 0.0% |
| 10 or more Apartments | 0 | 0.0% |
| Mobile Home / Other | 433 | 57.2% |
| Total | 757 | 100.0% |
Housing Structures by Occupancy in Woodside East
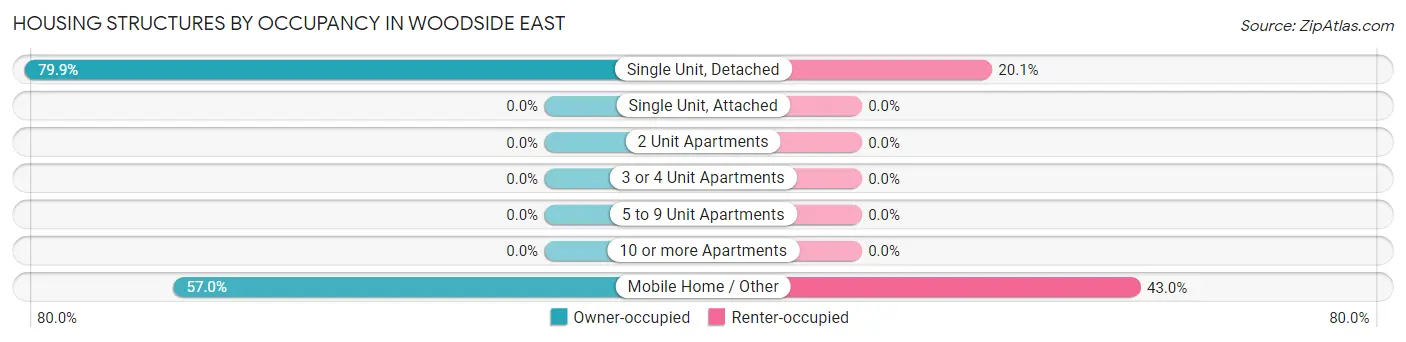
| Structure Type | Owner-occupied | Renter-occupied |
| Single Unit, Detached | 259 (79.9%) | 65 (20.1%) |
| Single Unit, Attached | 0 (0.0%) | 0 (0.0%) |
| 2 Unit Apartments | 0 (0.0%) | 0 (0.0%) |
| 3 or 4 Unit Apartments | 0 (0.0%) | 0 (0.0%) |
| 5 to 9 Unit Apartments | 0 (0.0%) | 0 (0.0%) |
| 10 or more Apartments | 0 (0.0%) | 0 (0.0%) |
| Mobile Home / Other | 247 (57.0%) | 186 (43.0%) |
| Total | 506 (66.8%) | 251 (33.2%) |
Housing Structures by Number of Rooms in Woodside East
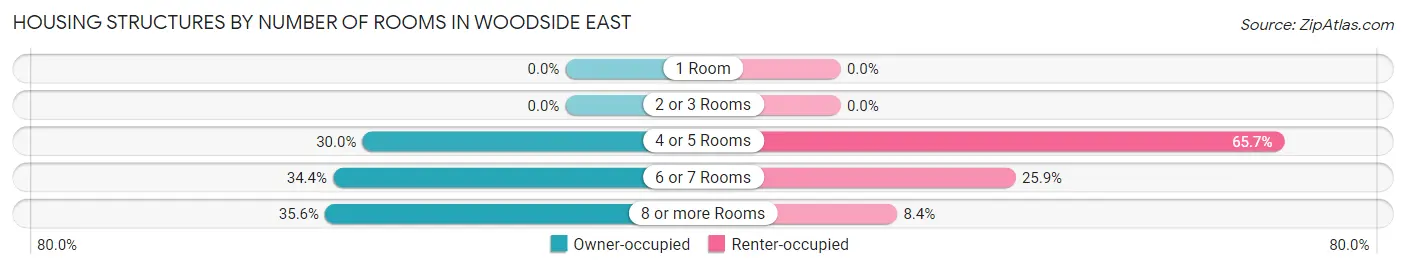
| Number of Rooms | Owner-occupied | Renter-occupied |
| 1 Room | 0 (0.0%) | 0 (0.0%) |
| 2 or 3 Rooms | 0 (0.0%) | 0 (0.0%) |
| 4 or 5 Rooms | 152 (30.0%) | 165 (65.7%) |
| 6 or 7 Rooms | 174 (34.4%) | 65 (25.9%) |
| 8 or more Rooms | 180 (35.6%) | 21 (8.4%) |
| Total | 506 (100.0%) | 251 (100.0%) |
Housing Structure by Heating Type in Woodside East
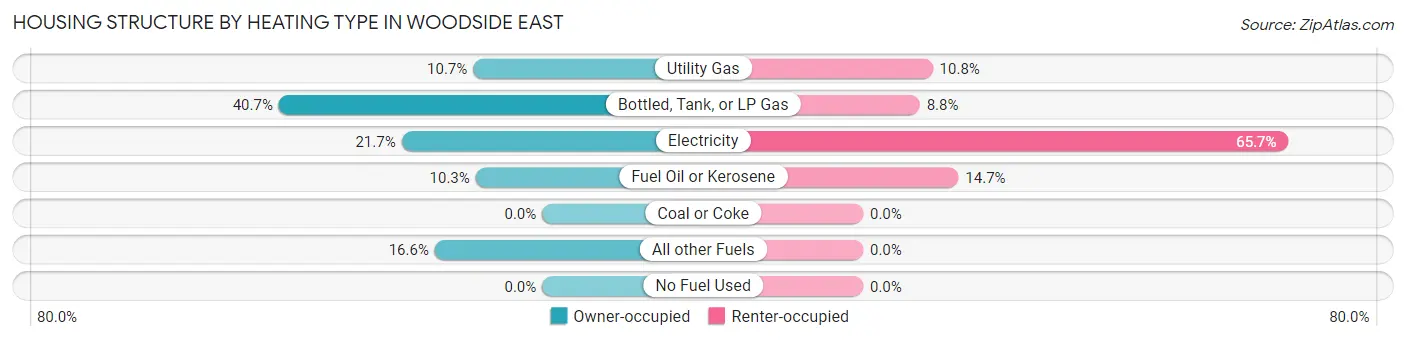
| Heating Type | Owner-occupied | Renter-occupied |
| Utility Gas | 54 (10.7%) | 27 (10.8%) |
| Bottled, Tank, or LP Gas | 206 (40.7%) | 22 (8.8%) |
| Electricity | 110 (21.7%) | 165 (65.7%) |
| Fuel Oil or Kerosene | 52 (10.3%) | 37 (14.7%) |
| Coal or Coke | 0 (0.0%) | 0 (0.0%) |
| All other Fuels | 84 (16.6%) | 0 (0.0%) |
| No Fuel Used | 0 (0.0%) | 0 (0.0%) |
| Total | 506 (100.0%) | 251 (100.0%) |
Household Vehicle Usage in Woodside East
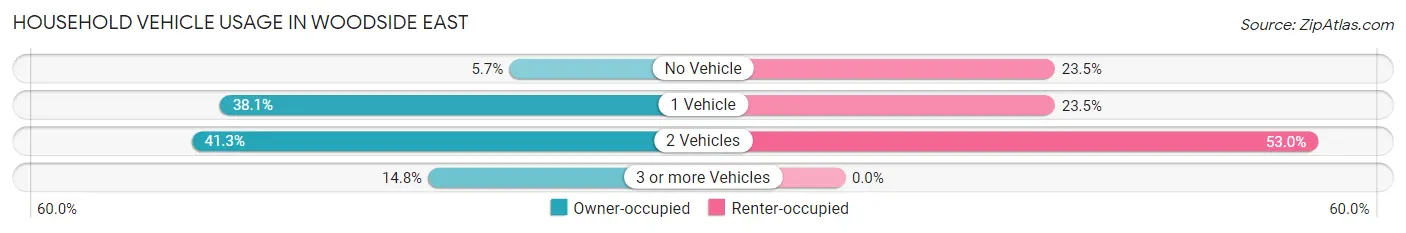
| Vehicles per Household | Owner-occupied | Renter-occupied |
| No Vehicle | 29 (5.7%) | 59 (23.5%) |
| 1 Vehicle | 193 (38.1%) | 59 (23.5%) |
| 2 Vehicles | 209 (41.3%) | 133 (53.0%) |
| 3 or more Vehicles | 75 (14.8%) | 0 (0.0%) |
| Total | 506 (100.0%) | 251 (100.0%) |
Real Estate & Mortgages in Woodside East
Real Estate and Mortgage Overview in Woodside East
| Characteristic | Without Mortgage | With Mortgage |
| Housing Units | 293 | 213 |
| Median Property Value | - | - |
| Median Household Income | $31,587 | $10 |
| Monthly Housing Costs | $633 | $27 |
| Real Estate Taxes | $274 | $11 |
Property Value by Mortgage Status in Woodside East
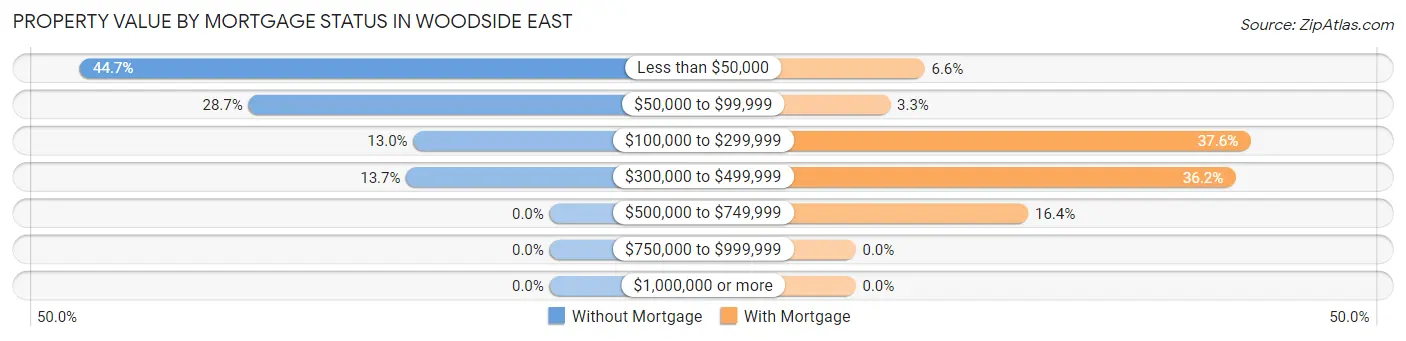
| Property Value | Without Mortgage | With Mortgage |
| Less than $50,000 | 131 (44.7%) | 14 (6.6%) |
| $50,000 to $99,999 | 84 (28.7%) | 7 (3.3%) |
| $100,000 to $299,999 | 38 (13.0%) | 80 (37.6%) |
| $300,000 to $499,999 | 40 (13.7%) | 77 (36.1%) |
| $500,000 to $749,999 | 0 (0.0%) | 35 (16.4%) |
| $750,000 to $999,999 | 0 (0.0%) | 0 (0.0%) |
| $1,000,000 or more | 0 (0.0%) | 0 (0.0%) |
| Total | 293 (100.0%) | 213 (100.0%) |
Household Income by Mortgage Status in Woodside East
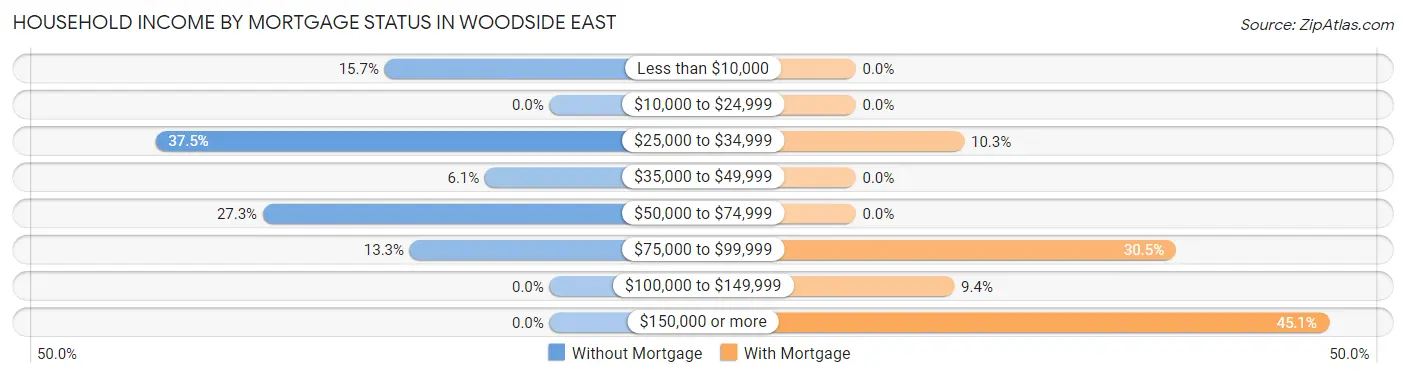
| Household Income | Without Mortgage | With Mortgage |
| Less than $10,000 | 46 (15.7%) | 0 (0.0%) |
| $10,000 to $24,999 | 0 (0.0%) | 0 (0.0%) |
| $25,000 to $34,999 | 110 (37.5%) | 22 (10.3%) |
| $35,000 to $49,999 | 18 (6.1%) | 0 (0.0%) |
| $50,000 to $74,999 | 80 (27.3%) | 0 (0.0%) |
| $75,000 to $99,999 | 39 (13.3%) | 65 (30.5%) |
| $100,000 to $149,999 | 0 (0.0%) | 20 (9.4%) |
| $150,000 or more | 0 (0.0%) | 96 (45.1%) |
| Total | 293 (100.0%) | 213 (100.0%) |
Property Value to Household Income Ratio in Woodside East
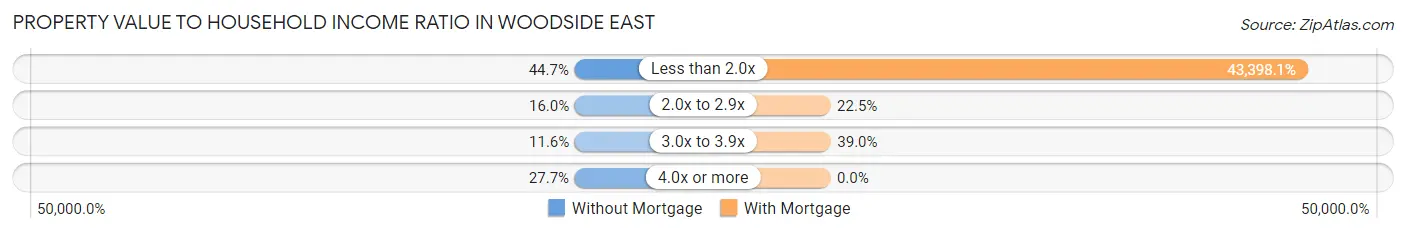
| Value-to-Income Ratio | Without Mortgage | With Mortgage |
| Less than 2.0x | 131 (44.7%) | 92,438 (43,398.1%) |
| 2.0x to 2.9x | 47 (16.0%) | 48 (22.5%) |
| 3.0x to 3.9x | 34 (11.6%) | 83 (39.0%) |
| 4.0x or more | 81 (27.7%) | 0 (0.0%) |
| Total | 293 (100.0%) | 213 (100.0%) |
Real Estate Taxes by Mortgage Status in Woodside East
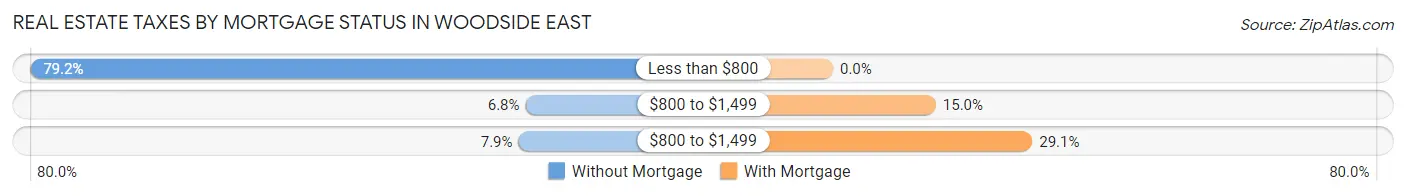
| Property Taxes | Without Mortgage | With Mortgage |
| Less than $800 | 232 (79.2%) | 0 (0.0%) |
| $800 to $1,499 | 20 (6.8%) | 32 (15.0%) |
| $800 to $1,499 | 23 (7.9%) | 62 (29.1%) |
| Total | 293 (100.0%) | 213 (100.0%) |
Health & Disability in Woodside East
Health Insurance Coverage by Age in Woodside East
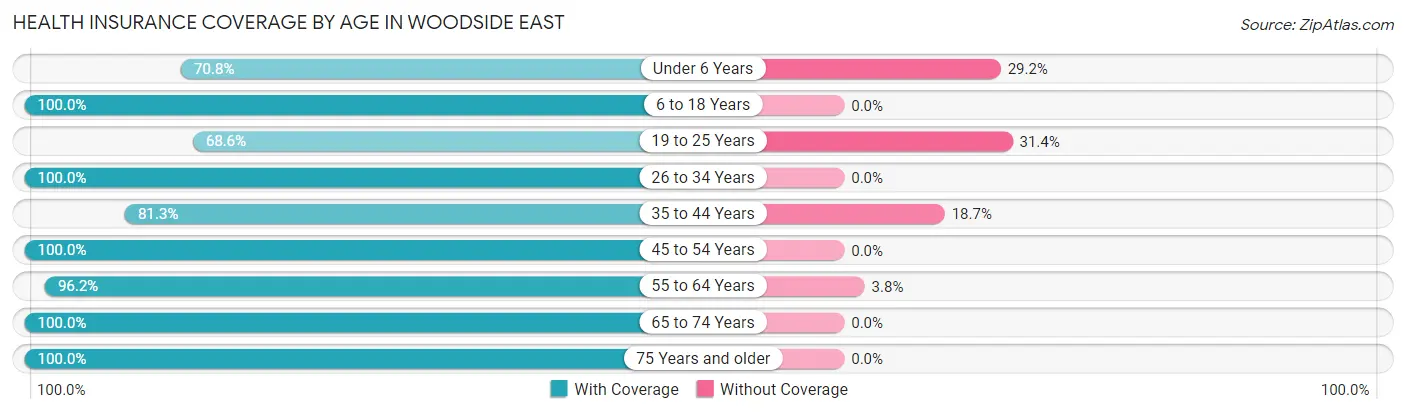
| Age Bracket | With Coverage | Without Coverage |
| Under 6 Years | 153 (70.8%) | 63 (29.2%) |
| 6 to 18 Years | 339 (100.0%) | 0 (0.0%) |
| 19 to 25 Years | 35 (68.6%) | 16 (31.4%) |
| 26 to 34 Years | 322 (100.0%) | 0 (0.0%) |
| 35 to 44 Years | 230 (81.3%) | 53 (18.7%) |
| 45 to 54 Years | 286 (100.0%) | 0 (0.0%) |
| 55 to 64 Years | 253 (96.2%) | 10 (3.8%) |
| 65 to 74 Years | 129 (100.0%) | 0 (0.0%) |
| 75 Years and older | 113 (100.0%) | 0 (0.0%) |
| Total | 1,860 (92.9%) | 142 (7.1%) |
Health Insurance Coverage by Citizenship Status in Woodside East
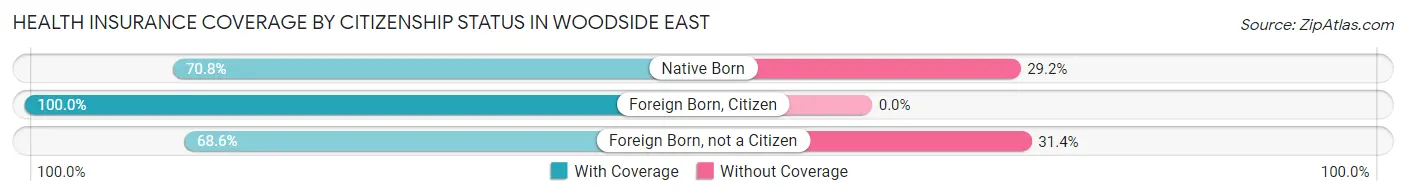
| Citizenship Status | With Coverage | Without Coverage |
| Native Born | 153 (70.8%) | 63 (29.2%) |
| Foreign Born, Citizen | 339 (100.0%) | 0 (0.0%) |
| Foreign Born, not a Citizen | 35 (68.6%) | 16 (31.4%) |
Health Insurance Coverage by Household Income in Woodside East
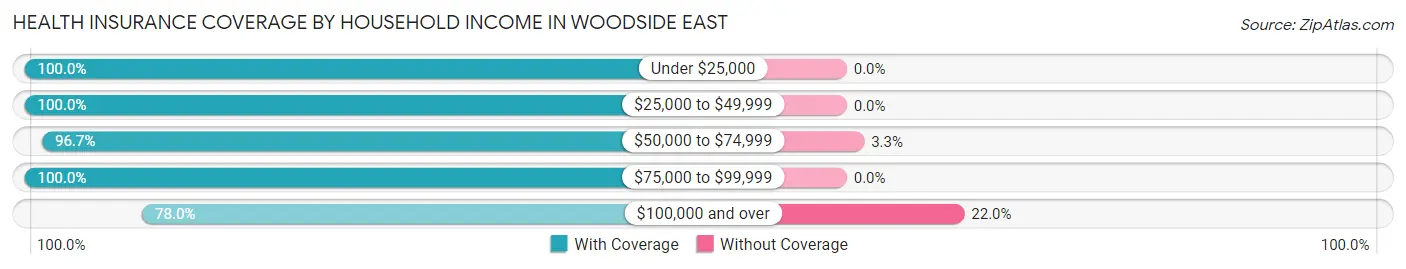
| Household Income | With Coverage | Without Coverage |
| Under $25,000 | 604 (100.0%) | 0 (0.0%) |
| $25,000 to $49,999 | 247 (100.0%) | 0 (0.0%) |
| $50,000 to $74,999 | 474 (96.7%) | 16 (3.3%) |
| $75,000 to $99,999 | 89 (100.0%) | 0 (0.0%) |
| $100,000 and over | 446 (78.0%) | 126 (22.0%) |
Public vs Private Health Insurance Coverage by Age in Woodside East
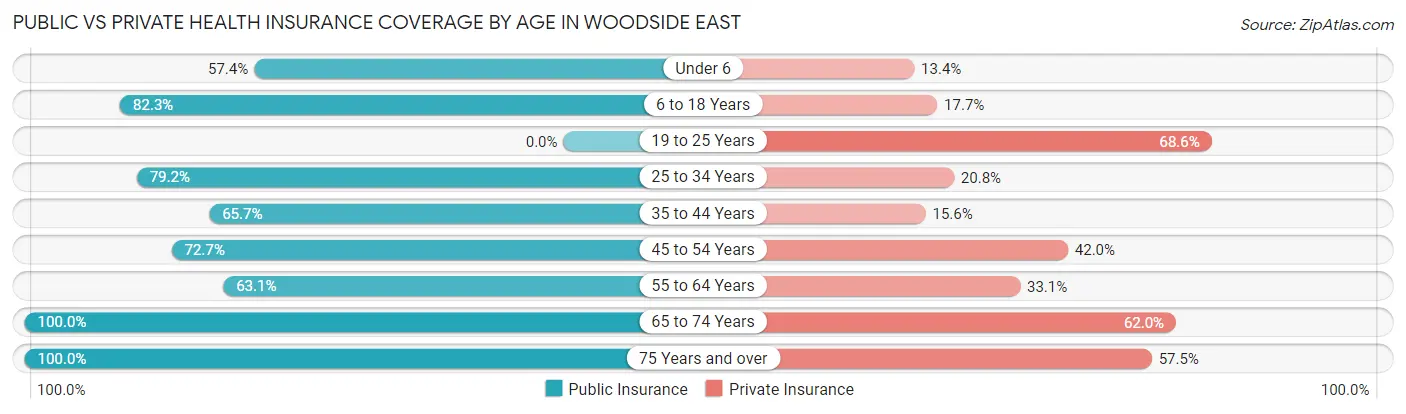
| Age Bracket | Public Insurance | Private Insurance |
| Under 6 | 124 (57.4%) | 29 (13.4%) |
| 6 to 18 Years | 279 (82.3%) | 60 (17.7%) |
| 19 to 25 Years | 0 (0.0%) | 35 (68.6%) |
| 25 to 34 Years | 255 (79.2%) | 67 (20.8%) |
| 35 to 44 Years | 186 (65.7%) | 44 (15.5%) |
| 45 to 54 Years | 208 (72.7%) | 120 (42.0%) |
| 55 to 64 Years | 166 (63.1%) | 87 (33.1%) |
| 65 to 74 Years | 129 (100.0%) | 80 (62.0%) |
| 75 Years and over | 113 (100.0%) | 65 (57.5%) |
| Total | 1,460 (72.9%) | 587 (29.3%) |
Disability Status by Sex by Age in Woodside East
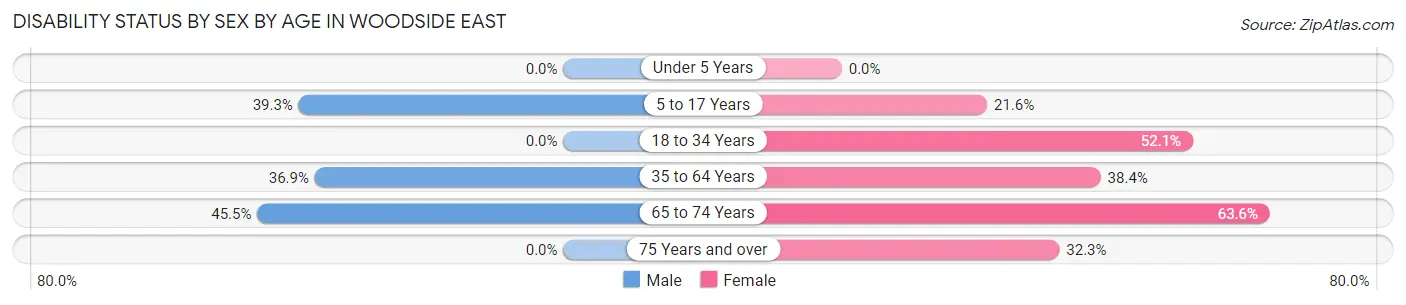
| Age Bracket | Male | Female |
| Under 5 Years | 0 (0.0%) | 0 (0.0%) |
| 5 to 17 Years | 90 (39.3%) | 33 (21.6%) |
| 18 to 34 Years | 0 (0.0%) | 171 (52.1%) |
| 35 to 64 Years | 141 (36.9%) | 173 (38.4%) |
| 65 to 74 Years | 10 (45.5%) | 68 (63.5%) |
| 75 Years and over | 0 (0.0%) | 21 (32.3%) |
Disability Class by Sex by Age in Woodside East
Disability Class: Hearing Difficulty
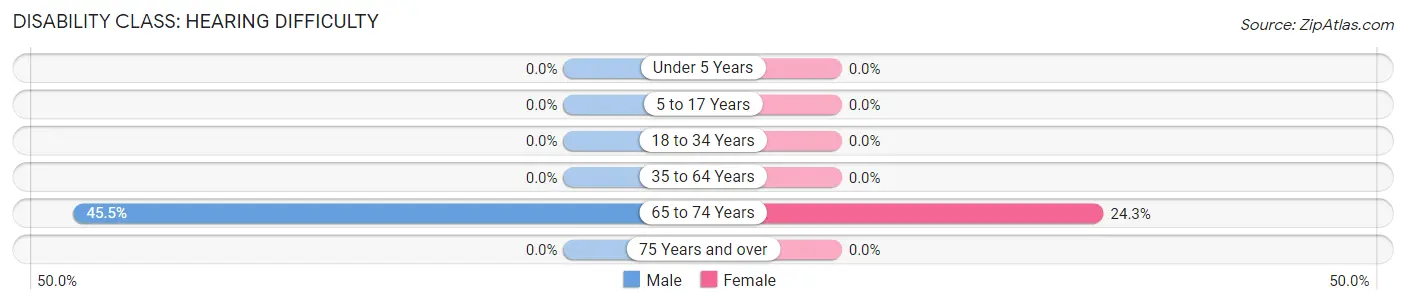
| Age Bracket | Male | Female |
| Under 5 Years | 0 (0.0%) | 0 (0.0%) |
| 5 to 17 Years | 0 (0.0%) | 0 (0.0%) |
| 18 to 34 Years | 0 (0.0%) | 0 (0.0%) |
| 35 to 64 Years | 0 (0.0%) | 0 (0.0%) |
| 65 to 74 Years | 10 (45.5%) | 26 (24.3%) |
| 75 Years and over | 0 (0.0%) | 0 (0.0%) |
Disability Class: Vision Difficulty
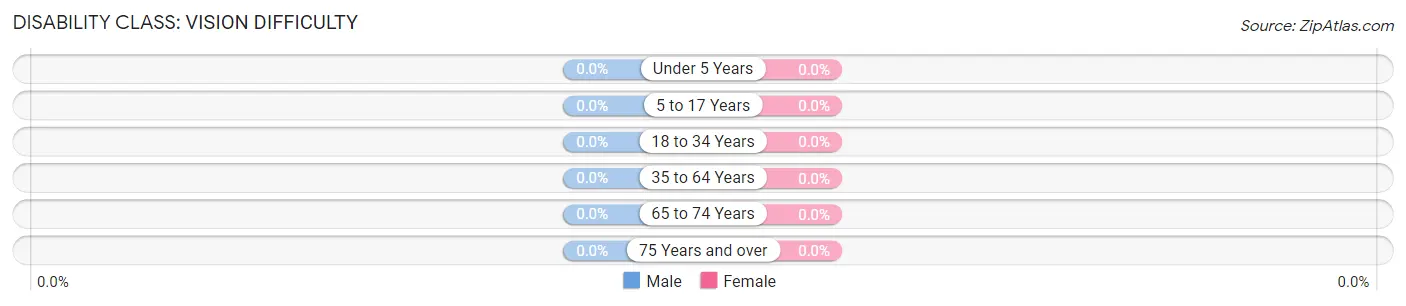
| Age Bracket | Male | Female |
| Under 5 Years | 0 (0.0%) | 0 (0.0%) |
| 5 to 17 Years | 0 (0.0%) | 0 (0.0%) |
| 18 to 34 Years | 0 (0.0%) | 0 (0.0%) |
| 35 to 64 Years | 0 (0.0%) | 0 (0.0%) |
| 65 to 74 Years | 0 (0.0%) | 0 (0.0%) |
| 75 Years and over | 0 (0.0%) | 0 (0.0%) |
Disability Class: Cognitive Difficulty
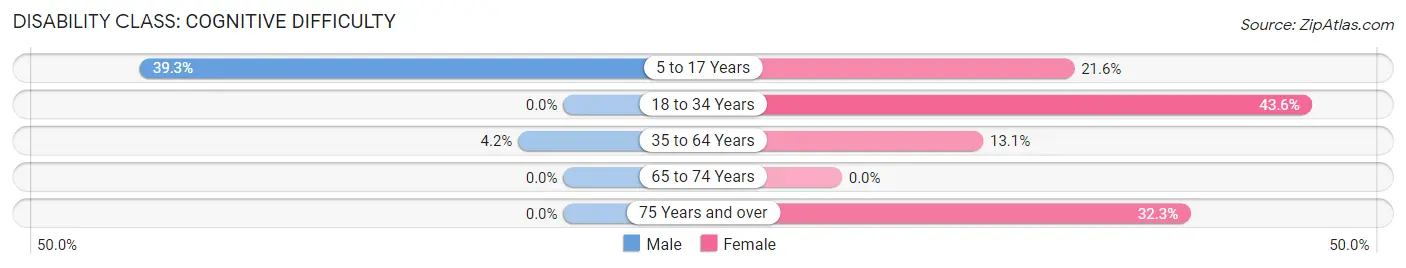
| Age Bracket | Male | Female |
| 5 to 17 Years | 90 (39.3%) | 33 (21.6%) |
| 18 to 34 Years | 0 (0.0%) | 143 (43.6%) |
| 35 to 64 Years | 16 (4.2%) | 59 (13.1%) |
| 65 to 74 Years | 0 (0.0%) | 0 (0.0%) |
| 75 Years and over | 0 (0.0%) | 21 (32.3%) |
Disability Class: Ambulatory Difficulty
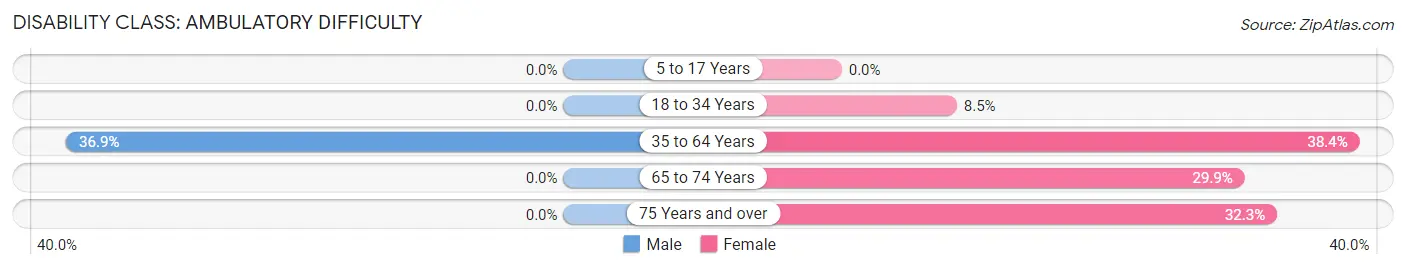
| Age Bracket | Male | Female |
| 5 to 17 Years | 0 (0.0%) | 0 (0.0%) |
| 18 to 34 Years | 0 (0.0%) | 28 (8.5%) |
| 35 to 64 Years | 141 (36.9%) | 173 (38.4%) |
| 65 to 74 Years | 0 (0.0%) | 32 (29.9%) |
| 75 Years and over | 0 (0.0%) | 21 (32.3%) |
Disability Class: Self-Care Difficulty
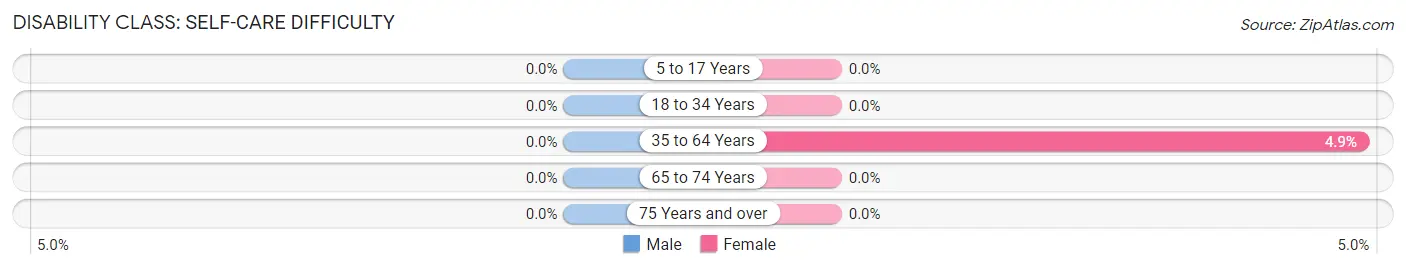
| Age Bracket | Male | Female |
| 5 to 17 Years | 0 (0.0%) | 0 (0.0%) |
| 18 to 34 Years | 0 (0.0%) | 0 (0.0%) |
| 35 to 64 Years | 0 (0.0%) | 22 (4.9%) |
| 65 to 74 Years | 0 (0.0%) | 0 (0.0%) |
| 75 Years and over | 0 (0.0%) | 0 (0.0%) |
Technology Access in Woodside East
Computing Device Access in Woodside East
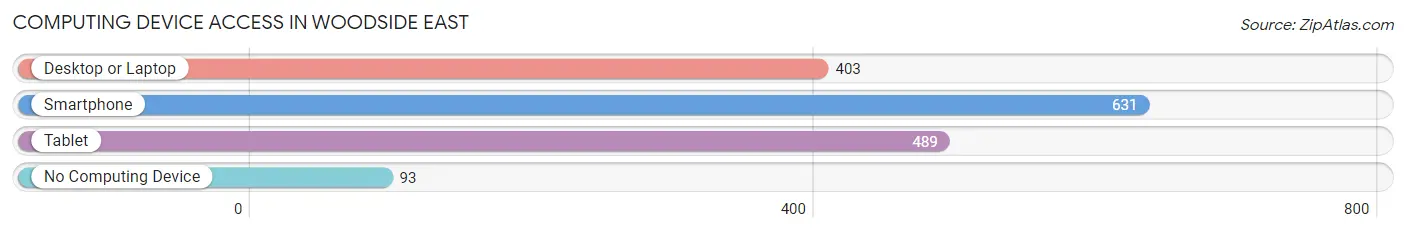
| Device Type | # Households | % Households |
| Desktop or Laptop | 403 | 53.2% |
| Smartphone | 631 | 83.4% |
| Tablet | 489 | 64.6% |
| No Computing Device | 93 | 12.3% |
| Total | 757 | 100.0% |
Internet Access in Woodside East
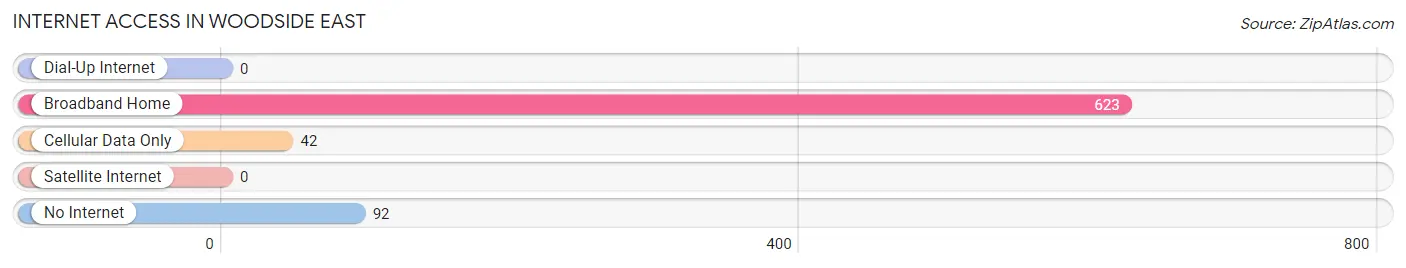
| Internet Type | # Households | % Households |
| Dial-Up Internet | 0 | 0.0% |
| Broadband Home | 623 | 82.3% |
| Cellular Data Only | 42 | 5.6% |
| Satellite Internet | 0 | 0.0% |
| No Internet | 92 | 12.1% |
| Total | 757 | 100.0% |
Woodside East Summary
Woodside East is a small unincorporated community located in Kent County, Delaware. It is situated in the northern part of the state, just south of the Maryland border. The community is bordered by the towns of Dover, Camden, and Smyrna. Woodside East is a rural area with a population of approximately 1,000 people.
Geography
Woodside East is located in the northern part of Kent County, Delaware. It is situated between the towns of Dover, Camden, and Smyrna. The community is bordered by the Chesapeake and Delaware Canal to the north, the St. Jones River to the east, and the Delaware Bay to the south. The area is mostly flat, with some rolling hills in the northern part of the community. The climate is temperate, with hot summers and cold winters.
Demographics
As of the 2010 census, the population of Woodside East was 1,000 people. The racial makeup of the community was 94.2% White, 2.2% African American, 0.7% Native American, 0.7% Asian, 0.3% from other races, and 1.9% from two or more races. Hispanic or Latino of any race were 1.3% of the population.
Economy
Woodside East is a rural community with a primarily agricultural economy. The area is home to several farms, which produce a variety of crops, including corn, soybeans, wheat, and hay. The community also has a few small businesses, including a gas station, a convenience store, and a few restaurants.
History
Woodside East was first settled in the late 1700s by a group of Quakers from Pennsylvania. The community was originally known as “Woodside”, and was part of Kent County. In the early 1800s, the area was divided into two parts, with the eastern portion becoming known as “Woodside East”. The community remained a rural farming area until the mid-1900s, when the population began to grow. In the late 1900s, the area experienced a population boom, as many people moved to the area from nearby cities. Today, Woodside East is a small, rural community with a population of approximately 1,000 people.
Common Questions
What is Per Capita Income in Woodside East?
Per Capita income in Woodside East is $22,233.
What is the Median Family Income in Woodside East?
Median Family Income in Woodside East is $56,791.
What is the Median Household income in Woodside East?
Median Household Income in Woodside East is $53,517.
What is Income or Wage Gap in Woodside East?
Income or Wage Gap in Woodside East is 38.6%.
Women in Woodside East earn 61.4 cents for every dollar earned by a man.
What is Inequality or Gini Index in Woodside East?
Inequality or Gini Index in Woodside East is 0.41.
What is the Total Population of Woodside East?
Total Population of Woodside East is 2,002.
What is the Total Male Population of Woodside East?
Total Male Population of Woodside East is 771.
What is the Total Female Population of Woodside East?
Total Female Population of Woodside East is 1,231.
What is the Ratio of Males per 100 Females in Woodside East?
There are 62.63 Males per 100 Females in Woodside East.
What is the Ratio of Females per 100 Males in Woodside East?
There are 159.66 Females per 100 Males in Woodside East.
What is the Median Population Age in Woodside East?
Median Population Age in Woodside East is 35.8 Years.
What is the Average Family Size in Woodside East
Average Family Size in Woodside East is 3.1 People.
What is the Average Household Size in Woodside East
Average Household Size in Woodside East is 2.6 People.
How Large is the Labor Force in Woodside East?
There are 825 People in the Labor Forcein in Woodside East.
What is the Percentage of People in the Labor Force in Woodside East?
55.1% of People are in the Labor Force in Woodside East.
What is the Unemployment Rate in Woodside East?
Unemployment Rate in Woodside East is 22.3%.