Ocean View, DE Map & Demographics
Ocean View Map
Ocean View Overview
$46,215
PER CAPITA INCOME
$89,736
AVG FAMILY INCOME
$88,004
AVG HOUSEHOLD INCOME
43.8%
WAGE / INCOME GAP [ % ]
56.2¢/ $1
WAGE / INCOME GAP [ $ ]
$14,564
FAMILY INCOME DEFICIT
0.42
INEQUALITY / GINI INDEX
2,660
TOTAL POPULATION
1,139
MALE POPULATION
1,521
FEMALE POPULATION
74.88
MALES / 100 FEMALES
133.54
FEMALES / 100 MALES
63.8
MEDIAN AGE
2.3
AVG FAMILY SIZE
2.1
AVG HOUSEHOLD SIZE
923
LABOR FORCE [ PEOPLE ]
38.2%
PERCENT IN LABOR FORCE
1.5%
UNEMPLOYMENT RATE
Ocean View Zip Codes
Ocean View Area Codes
Income in Ocean View
Income Overview in Ocean View
Per Capita Income in Ocean View is $46,215, while median incomes of families and households are $89,736 and $88,004 respectively.
| Characteristic | Number | Measure |
| Per Capita Income | 2,660 | $46,215 |
| Median Family Income | 939 | $89,736 |
| Mean Family Income | 939 | $102,966 |
| Median Household Income | 1,277 | $88,004 |
| Mean Household Income | 1,277 | $98,530 |
| Income Deficit | 939 | $14,564 |
| Wage / Income Gap (%) | 2,660 | 43.81% |
| Wage / Income Gap ($) | 2,660 | 56.19¢ per $1 |
| Gini / Inequality Index | 2,660 | 0.42 |
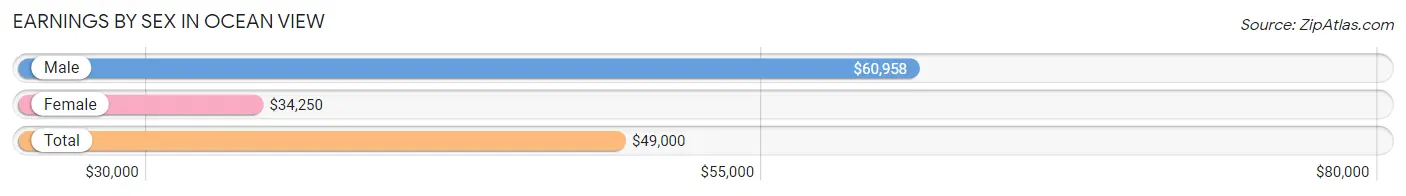
Earnings by Sex in Ocean View
Average Earnings in Ocean View are $49,000, $60,958 for men and $34,250 for women, a difference of 43.8%.
| Sex | Number | Average Earnings |
| Male | 495 (46.5%) | $60,958 |
| Female | 569 (53.5%) | $34,250 |
| Total | 1,064 (100.0%) | $49,000 |
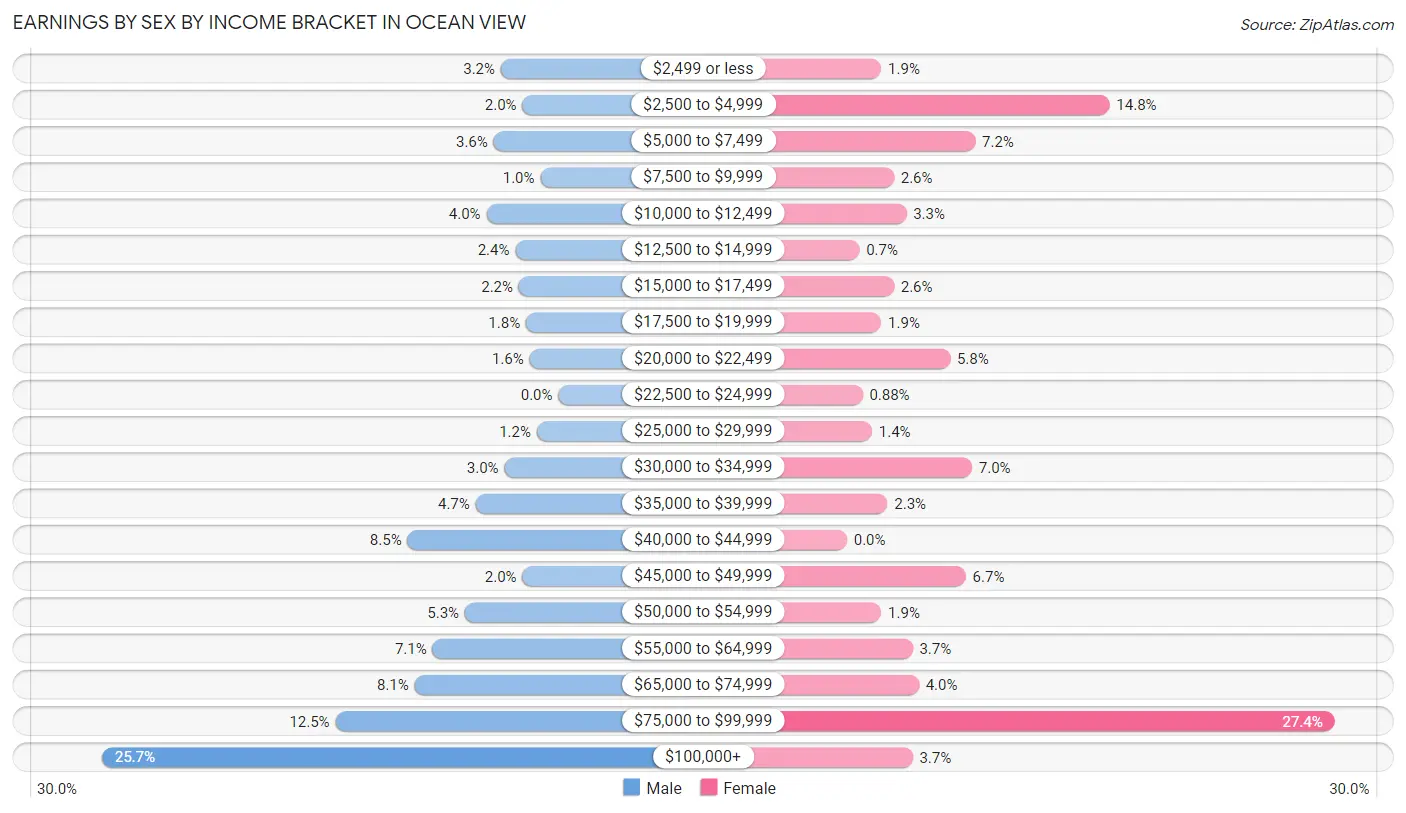
Earnings by Sex by Income Bracket in Ocean View
The most common earnings brackets in Ocean View are $100,000+ for men (127 | 25.7%) and $75,000 to $99,999 for women (156 | 27.4%).
| Income | Male | Female |
| $2,499 or less | 16 (3.2%) | 11 (1.9%) |
| $2,500 to $4,999 | 10 (2.0%) | 84 (14.8%) |
| $5,000 to $7,499 | 18 (3.6%) | 41 (7.2%) |
| $7,500 to $9,999 | 5 (1.0%) | 15 (2.6%) |
| $10,000 to $12,499 | 20 (4.0%) | 19 (3.3%) |
| $12,500 to $14,999 | 12 (2.4%) | 4 (0.7%) |
| $15,000 to $17,499 | 11 (2.2%) | 15 (2.6%) |
| $17,500 to $19,999 | 9 (1.8%) | 11 (1.9%) |
| $20,000 to $22,499 | 8 (1.6%) | 33 (5.8%) |
| $22,500 to $24,999 | 0 (0.0%) | 5 (0.9%) |
| $25,000 to $29,999 | 6 (1.2%) | 8 (1.4%) |
| $30,000 to $34,999 | 15 (3.0%) | 40 (7.0%) |
| $35,000 to $39,999 | 23 (4.6%) | 13 (2.3%) |
| $40,000 to $44,999 | 42 (8.5%) | 0 (0.0%) |
| $45,000 to $49,999 | 10 (2.0%) | 38 (6.7%) |
| $50,000 to $54,999 | 26 (5.2%) | 11 (1.9%) |
| $55,000 to $64,999 | 35 (7.1%) | 21 (3.7%) |
| $65,000 to $74,999 | 40 (8.1%) | 23 (4.0%) |
| $75,000 to $99,999 | 62 (12.5%) | 156 (27.4%) |
| $100,000+ | 127 (25.7%) | 21 (3.7%) |
| Total | 495 (100.0%) | 569 (100.0%) |
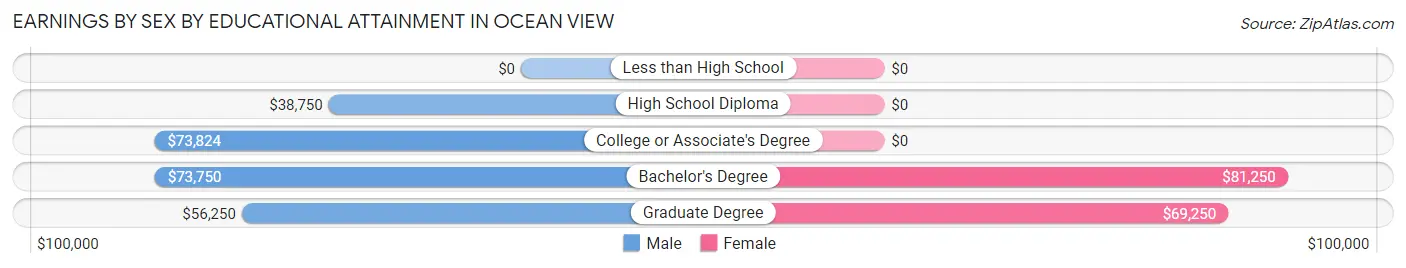
Earnings by Sex by Educational Attainment in Ocean View
Average earnings in Ocean View are $61,958 for men and $37,115 for women, a difference of 40.1%. Men with an educational attainment of college or associate's degree enjoy the highest average annual earnings of $73,824, while those with high school diploma education earn the least with $38,750. Women with an educational attainment of bachelor's degree earn the most with the average annual earnings of $81,250, while those with graduate degree education have the smallest earnings of $69,250.
| Educational Attainment | Male Income | Female Income |
| Less than High School | - | - |
| High School Diploma | $38,750 | $0 |
| College or Associate's Degree | $73,824 | $0 |
| Bachelor's Degree | $73,750 | $81,250 |
| Graduate Degree | $56,250 | $69,250 |
| Total | $61,958 | $37,115 |
Family Income in Ocean View
Family Income Brackets in Ocean View
According to the Ocean View family income data, there are 228 families falling into the $75,000 to $99,999 income range, which is the most common income bracket and makes up 24.3% of all families. Conversely, the $10,000 to $14,999 income bracket is the least frequent group with only 4 families (0.4%) belonging to this category.
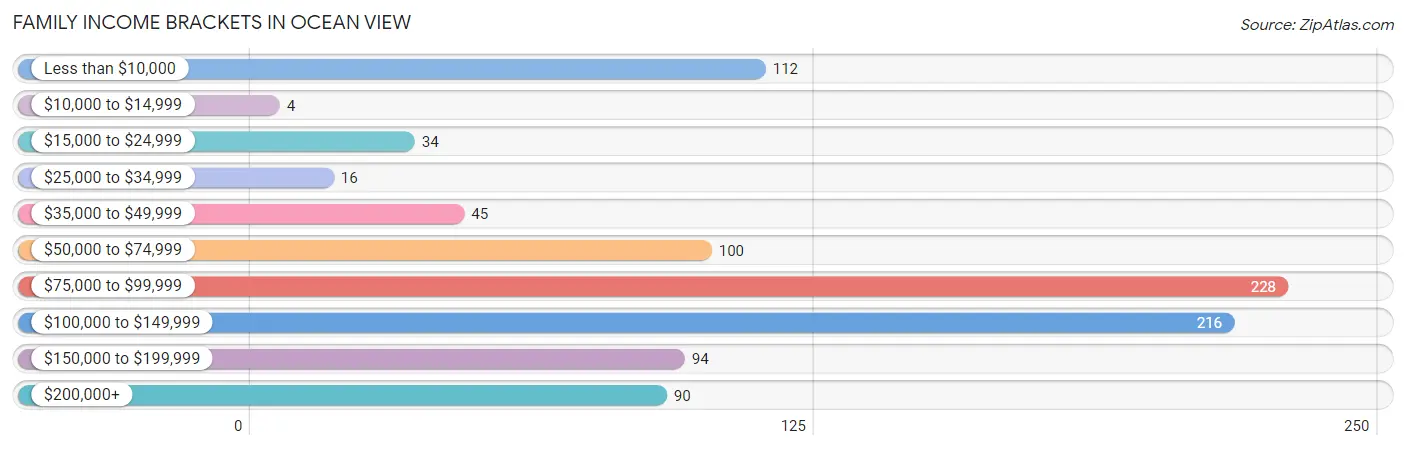
| Income Bracket | # Families | % Families |
| Less than $10,000 | 112 | 11.9% |
| $10,000 to $14,999 | 4 | 0.4% |
| $15,000 to $24,999 | 34 | 3.6% |
| $25,000 to $34,999 | 16 | 1.7% |
| $35,000 to $49,999 | 45 | 4.8% |
| $50,000 to $74,999 | 100 | 10.6% |
| $75,000 to $99,999 | 228 | 24.3% |
| $100,000 to $149,999 | 216 | 23.0% |
| $150,000 to $199,999 | 94 | 10.0% |
| $200,000+ | 90 | 9.6% |
Family Income by Famaliy Size in Ocean View
4-person families (100 | 10.6%) account for the highest median family income in Ocean View with $144,643 per family, while 3-person families (90 | 9.6%) have the highest median income of $44,667 per family member.
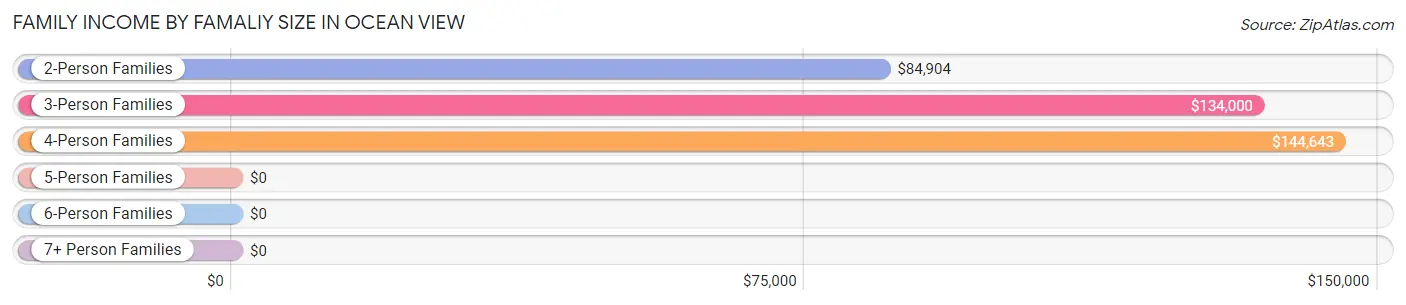
| Income Bracket | # Families | Median Income |
| 2-Person Families | 749 (79.8%) | $84,904 |
| 3-Person Families | 90 (9.6%) | $134,000 |
| 4-Person Families | 100 (10.6%) | $144,643 |
| 5-Person Families | 0 (0.0%) | $0 |
| 6-Person Families | 0 (0.0%) | $0 |
| 7+ Person Families | 0 (0.0%) | $0 |
| Total | 939 (100.0%) | $89,736 |
Family Income by Number of Earners in Ocean View
The median family income in Ocean View is $89,736, with families comprising 3+ earners (26) having the highest median family income of $157,750, while families with no earners (421) have the lowest median family income of $66,615, accounting for 2.8% and 44.8% of families, respectively.
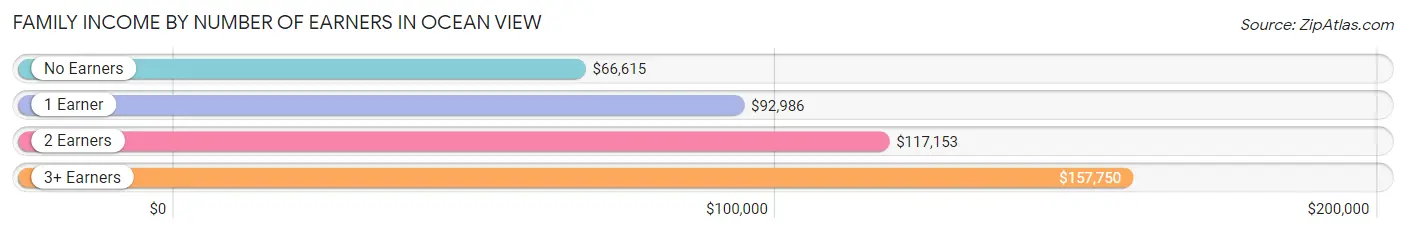
| Number of Earners | # Families | Median Income |
| No Earners | 421 (44.8%) | $66,615 |
| 1 Earner | 253 (26.9%) | $92,986 |
| 2 Earners | 239 (25.5%) | $117,153 |
| 3+ Earners | 26 (2.8%) | $157,750 |
| Total | 939 (100.0%) | $89,736 |
Household Income in Ocean View
Household Income Brackets in Ocean View
With 313 households falling in the category, the $75,000 to $99,999 income range is the most frequent in Ocean View, accounting for 24.5% of all households. In contrast, only 17 households (1.3%) fall into the $10,000 to $14,999 income bracket, making it the least populous group.
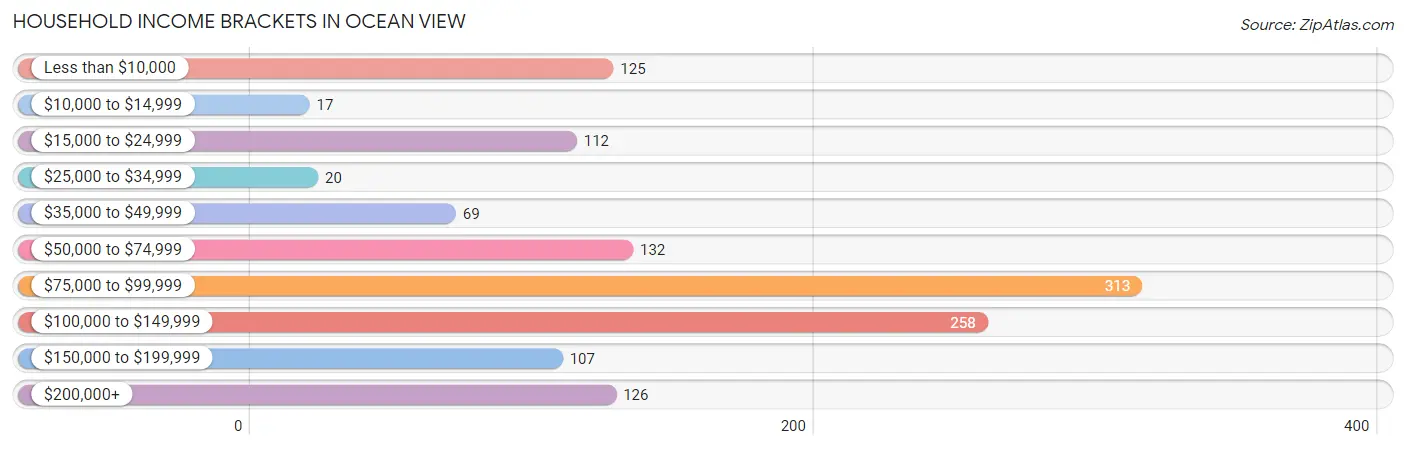
| Income Bracket | # Households | % Households |
| Less than $10,000 | 125 | 9.8% |
| $10,000 to $14,999 | 17 | 1.3% |
| $15,000 to $24,999 | 112 | 8.8% |
| $25,000 to $34,999 | 20 | 1.6% |
| $35,000 to $49,999 | 69 | 5.4% |
| $50,000 to $74,999 | 132 | 10.3% |
| $75,000 to $99,999 | 313 | 24.5% |
| $100,000 to $149,999 | 258 | 20.2% |
| $150,000 to $199,999 | 107 | 8.4% |
| $200,000+ | 126 | 9.9% |
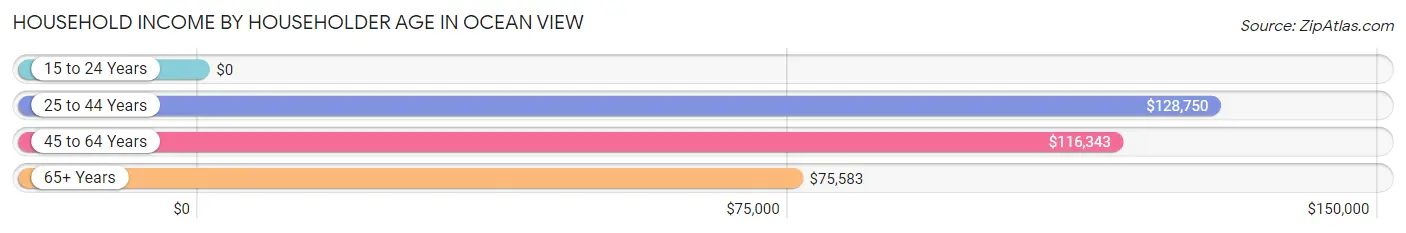
Household Income by Householder Age in Ocean View
The median household income in Ocean View is $88,004, with the highest median household income of $128,750 found in the 25 to 44 years age bracket for the primary householder. A total of 87 households (6.8%) fall into this category.
| Income Bracket | # Households | Median Income |
| 15 to 24 Years | 0 (0.0%) | $0 |
| 25 to 44 Years | 87 (6.8%) | $128,750 |
| 45 to 64 Years | 385 (30.1%) | $116,343 |
| 65+ Years | 805 (63.0%) | $75,583 |
| Total | 1,277 (100.0%) | $88,004 |
Poverty in Ocean View
Income Below Poverty by Sex and Age in Ocean View
With 11.1% poverty level for males and 10.9% for females among the residents of Ocean View, 75 year old and over males and 75 year old and over females are the most vulnerable to poverty, with 108 males (37.6%) and 119 females (28.9%) in their respective age groups living below the poverty level.
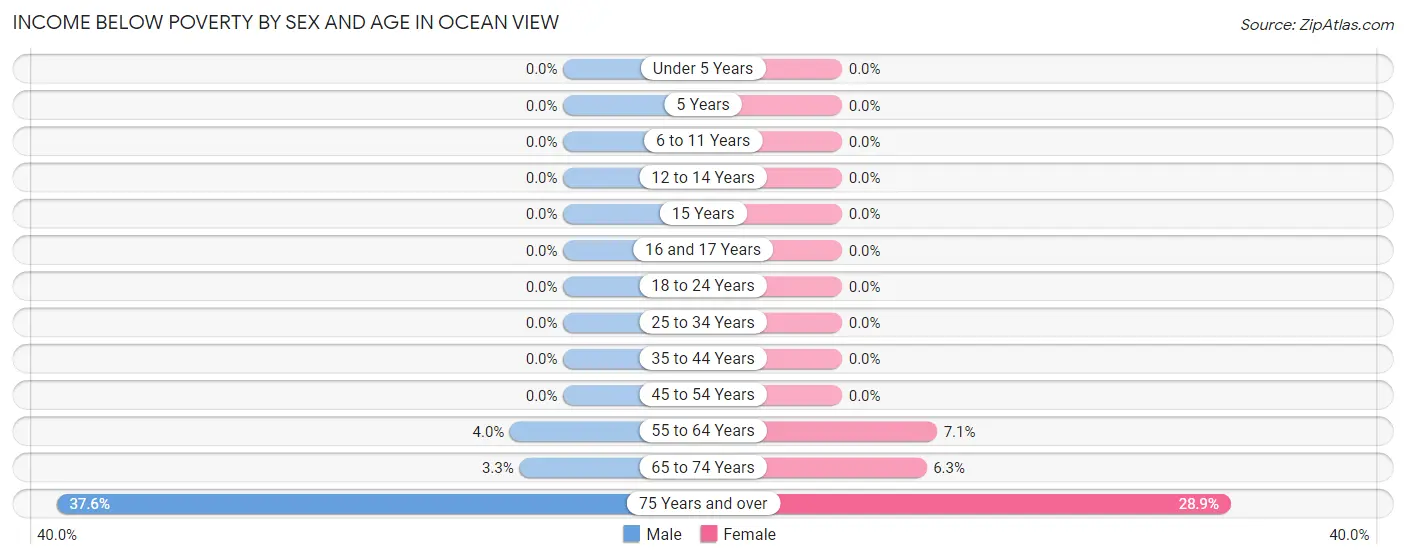
| Age Bracket | Male | Female |
| Under 5 Years | 0 (0.0%) | 0 (0.0%) |
| 5 Years | 0 (0.0%) | 0 (0.0%) |
| 6 to 11 Years | 0 (0.0%) | 0 (0.0%) |
| 12 to 14 Years | 0 (0.0%) | 0 (0.0%) |
| 15 Years | 0 (0.0%) | 0 (0.0%) |
| 16 and 17 Years | 0 (0.0%) | 0 (0.0%) |
| 18 to 24 Years | 0 (0.0%) | 0 (0.0%) |
| 25 to 34 Years | 0 (0.0%) | 0 (0.0%) |
| 35 to 44 Years | 0 (0.0%) | 0 (0.0%) |
| 45 to 54 Years | 0 (0.0%) | 0 (0.0%) |
| 55 to 64 Years | 9 (4.0%) | 28 (7.0%) |
| 65 to 74 Years | 9 (3.3%) | 18 (6.3%) |
| 75 Years and over | 108 (37.6%) | 119 (28.9%) |
| Total | 126 (11.1%) | 165 (10.9%) |
Income Above Poverty by Sex and Age in Ocean View
According to the poverty statistics in Ocean View, males aged under 5 years and females aged under 5 years are the age groups that are most secure financially, with 100.0% of males and 100.0% of females in these age groups living above the poverty line.
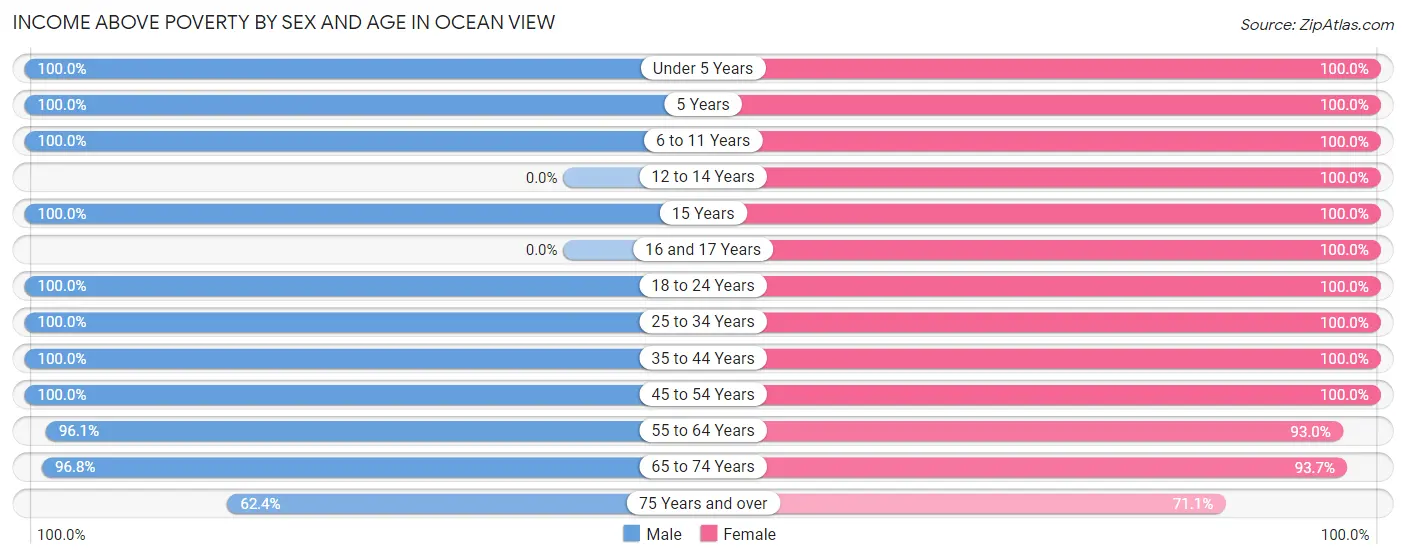
| Age Bracket | Male | Female |
| Under 5 Years | 12 (100.0%) | 15 (100.0%) |
| 5 Years | 14 (100.0%) | 8 (100.0%) |
| 6 to 11 Years | 85 (100.0%) | 62 (100.0%) |
| 12 to 14 Years | 0 (0.0%) | 10 (100.0%) |
| 15 Years | 16 (100.0%) | 8 (100.0%) |
| 16 and 17 Years | 0 (0.0%) | 8 (100.0%) |
| 18 to 24 Years | 35 (100.0%) | 33 (100.0%) |
| 25 to 34 Years | 101 (100.0%) | 134 (100.0%) |
| 35 to 44 Years | 28 (100.0%) | 65 (100.0%) |
| 45 to 54 Years | 49 (100.0%) | 74 (100.0%) |
| 55 to 64 Years | 219 (96.1%) | 369 (92.9%) |
| 65 to 74 Years | 268 (96.8%) | 269 (93.7%) |
| 75 Years and over | 179 (62.4%) | 293 (71.1%) |
| Total | 1,006 (88.9%) | 1,348 (89.1%) |
Income Below Poverty Among Married-Couple Families in Ocean View
The poverty statistics for married-couple families in Ocean View show that 14.4% or 121 of the total 842 families live below the poverty line. Families with no children have the highest poverty rate of 16.0%, comprising of 121 families. On the other hand, families with 1 or 2 children have the lowest poverty rate of 0.0%, which includes 0 families.
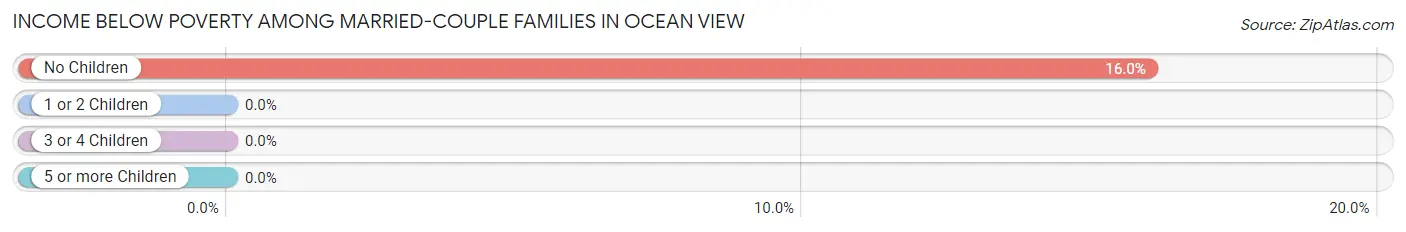
| Children | Above Poverty | Below Poverty |
| No Children | 635 (84.0%) | 121 (16.0%) |
| 1 or 2 Children | 86 (100.0%) | 0 (0.0%) |
| 3 or 4 Children | 0 (0.0%) | 0 (0.0%) |
| 5 or more Children | 0 (0.0%) | 0 (0.0%) |
| Total | 721 (85.6%) | 121 (14.4%) |
Income Below Poverty Among Single-Parent Households in Ocean View
| Children | Single Father | Single Mother |
| No Children | 0 (0.0%) | 0 (0.0%) |
| 1 or 2 Children | 0 (0.0%) | 0 (0.0%) |
| 3 or 4 Children | 0 (0.0%) | 0 (0.0%) |
| 5 or more Children | 0 (0.0%) | 0 (0.0%) |
| Total | 0 (0.0%) | 0 (0.0%) |
Income Below Poverty Among Married-Couple vs Single-Parent Households in Ocean View
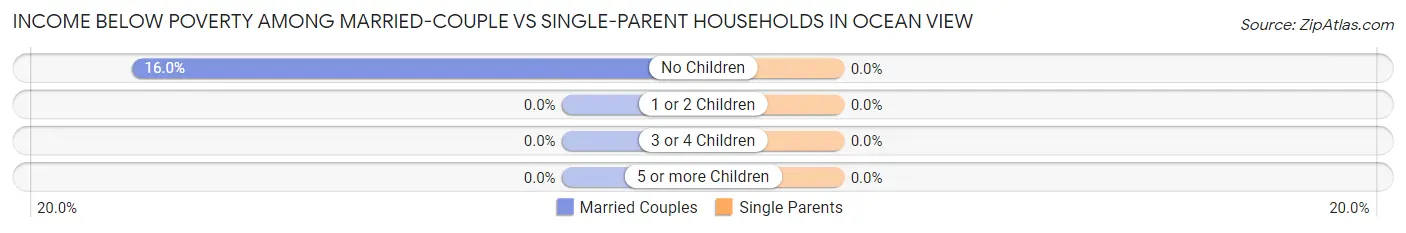
| Children | Married-Couple Families | Single-Parent Households |
| No Children | 121 (16.0%) | 0 (0.0%) |
| 1 or 2 Children | 0 (0.0%) | 0 (0.0%) |
| 3 or 4 Children | 0 (0.0%) | 0 (0.0%) |
| 5 or more Children | 0 (0.0%) | 0 (0.0%) |
| Total | 121 (14.4%) | 0 (0.0%) |
Race in Ocean View
The most populous races in Ocean View are White / Caucasian (2,449 | 92.1%), Two or more Races (97 | 3.6%), and Hispanic or Latino (85 | 3.2%).
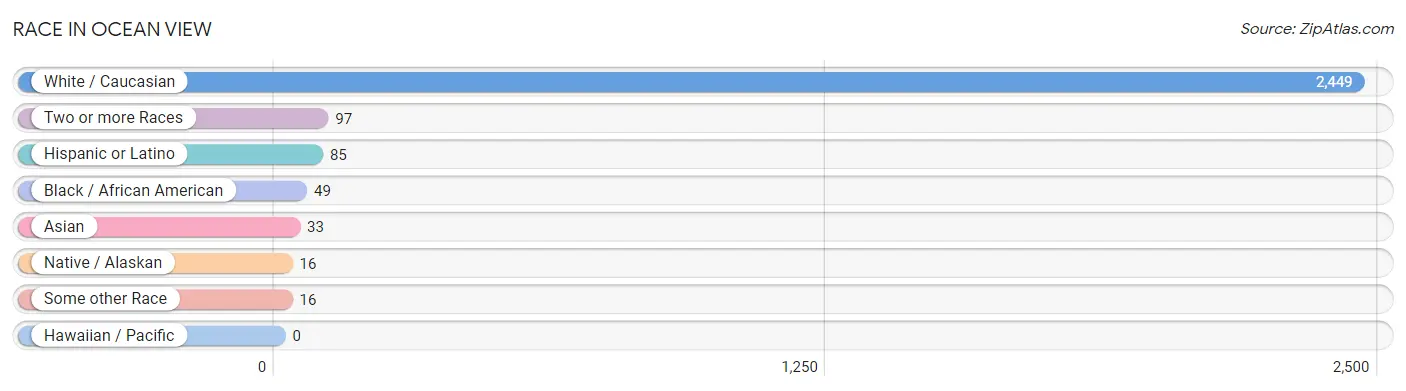
| Race | # Population | % Population |
| Asian | 33 | 1.2% |
| Black / African American | 49 | 1.8% |
| Hawaiian / Pacific | 0 | 0.0% |
| Hispanic or Latino | 85 | 3.2% |
| Native / Alaskan | 16 | 0.6% |
| White / Caucasian | 2,449 | 92.1% |
| Two or more Races | 97 | 3.6% |
| Some other Race | 16 | 0.6% |
| Total | 2,660 | 100.0% |
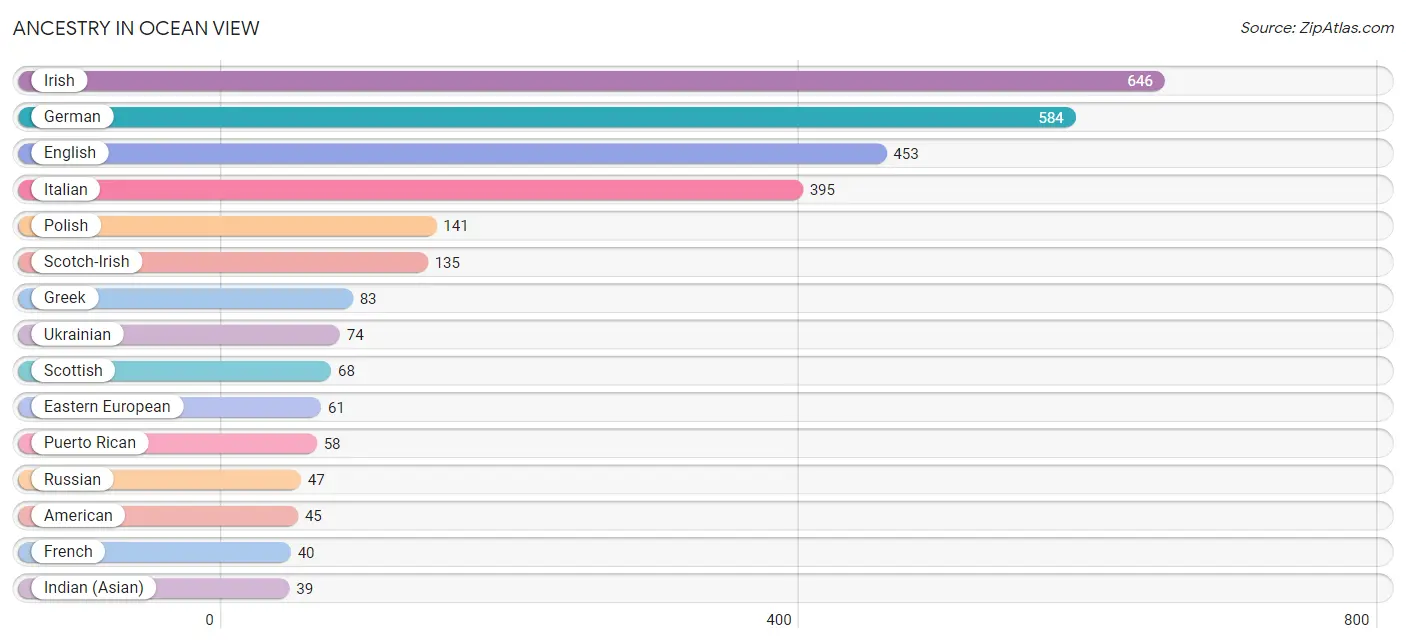
Ancestry in Ocean View
The most populous ancestries reported in Ocean View are Irish (646 | 24.3%), German (584 | 22.0%), English (453 | 17.0%), Italian (395 | 14.8%), and Polish (141 | 5.3%), together accounting for 83.4% of all Ocean View residents.
| Ancestry | # Population | % Population |
| American | 45 | 1.7% |
| Arab | 7 | 0.3% |
| Armenian | 3 | 0.1% |
| Austrian | 4 | 0.2% |
| Blackfeet | 3 | 0.1% |
| British | 8 | 0.3% |
| Burmese | 8 | 0.3% |
| Celtic | 4 | 0.2% |
| Cherokee | 5 | 0.2% |
| Croatian | 9 | 0.3% |
| Cuban | 7 | 0.3% |
| Czech | 9 | 0.3% |
| Danish | 4 | 0.2% |
| Dutch | 37 | 1.4% |
| Eastern European | 61 | 2.3% |
| English | 453 | 17.0% |
| European | 13 | 0.5% |
| Finnish | 10 | 0.4% |
| French | 40 | 1.5% |
| French Canadian | 8 | 0.3% |
| German | 584 | 22.0% |
| Greek | 83 | 3.1% |
| Hungarian | 7 | 0.3% |
| Indian (Asian) | 39 | 1.5% |
| Indonesian | 1 | 0.0% |
| Irish | 646 | 24.3% |
| Italian | 395 | 14.8% |
| Lebanese | 7 | 0.3% |
| Lithuanian | 21 | 0.8% |
| Mexican | 20 | 0.7% |
| Norwegian | 35 | 1.3% |
| Polish | 141 | 5.3% |
| Portuguese | 25 | 0.9% |
| Puerto Rican | 58 | 2.2% |
| Russian | 47 | 1.8% |
| Scandinavian | 7 | 0.3% |
| Scotch-Irish | 135 | 5.1% |
| Scottish | 68 | 2.6% |
| Slavic | 6 | 0.2% |
| Slovak | 24 | 0.9% |
| Sri Lankan | 20 | 0.7% |
| Swedish | 8 | 0.3% |
| Ukrainian | 74 | 2.8% |
| Welsh | 38 | 1.4% | View All 44 Rows |
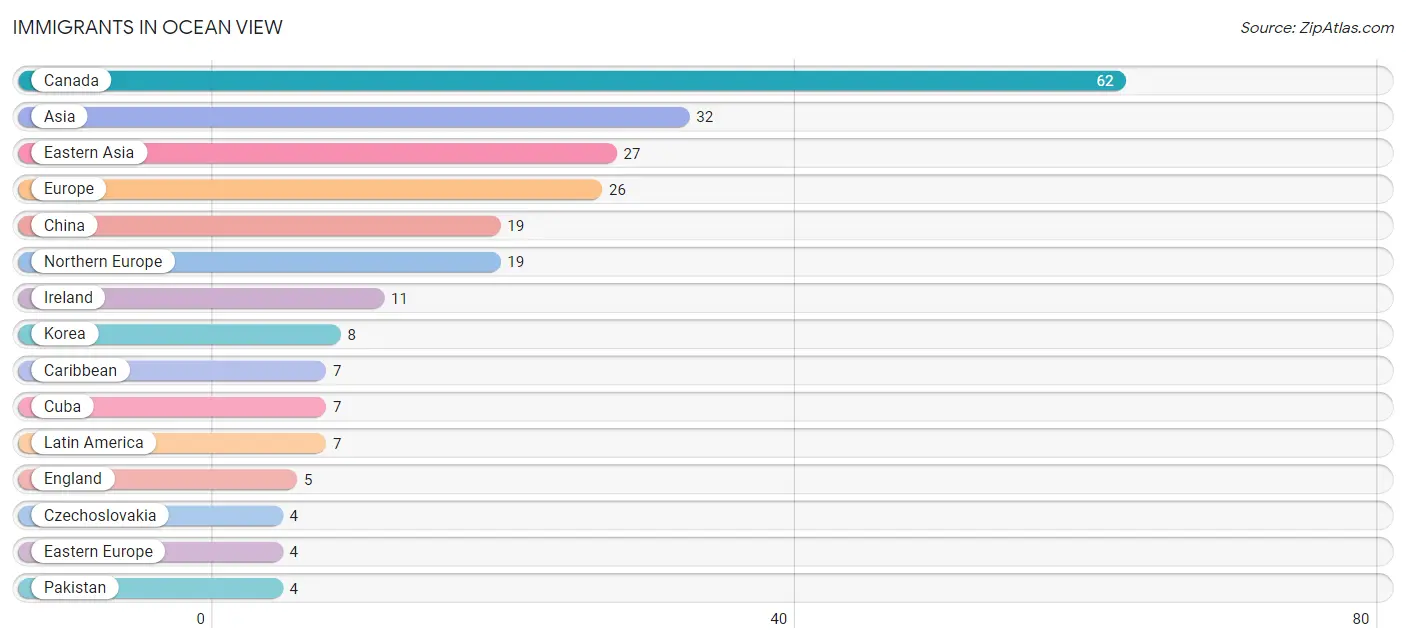
Immigrants in Ocean View
The most numerous immigrant groups reported in Ocean View came from Canada (62 | 2.3%), Asia (32 | 1.2%), Eastern Asia (27 | 1.0%), Europe (26 | 1.0%), and China (19 | 0.7%), together accounting for 6.2% of all Ocean View residents.
| Immigration Origin | # Population | % Population |
| Asia | 32 | 1.2% |
| Canada | 62 | 2.3% |
| Caribbean | 7 | 0.3% |
| China | 19 | 0.7% |
| Cuba | 7 | 0.3% |
| Czechoslovakia | 4 | 0.2% |
| Eastern Asia | 27 | 1.0% |
| Eastern Europe | 4 | 0.2% |
| England | 5 | 0.2% |
| Europe | 26 | 1.0% |
| Ireland | 11 | 0.4% |
| Italy | 3 | 0.1% |
| Korea | 8 | 0.3% |
| Latin America | 7 | 0.3% |
| Northern Europe | 19 | 0.7% |
| Pakistan | 4 | 0.2% |
| South Central Asia | 4 | 0.2% |
| South Eastern Asia | 1 | 0.0% |
| Southern Europe | 3 | 0.1% | View All 19 Rows |
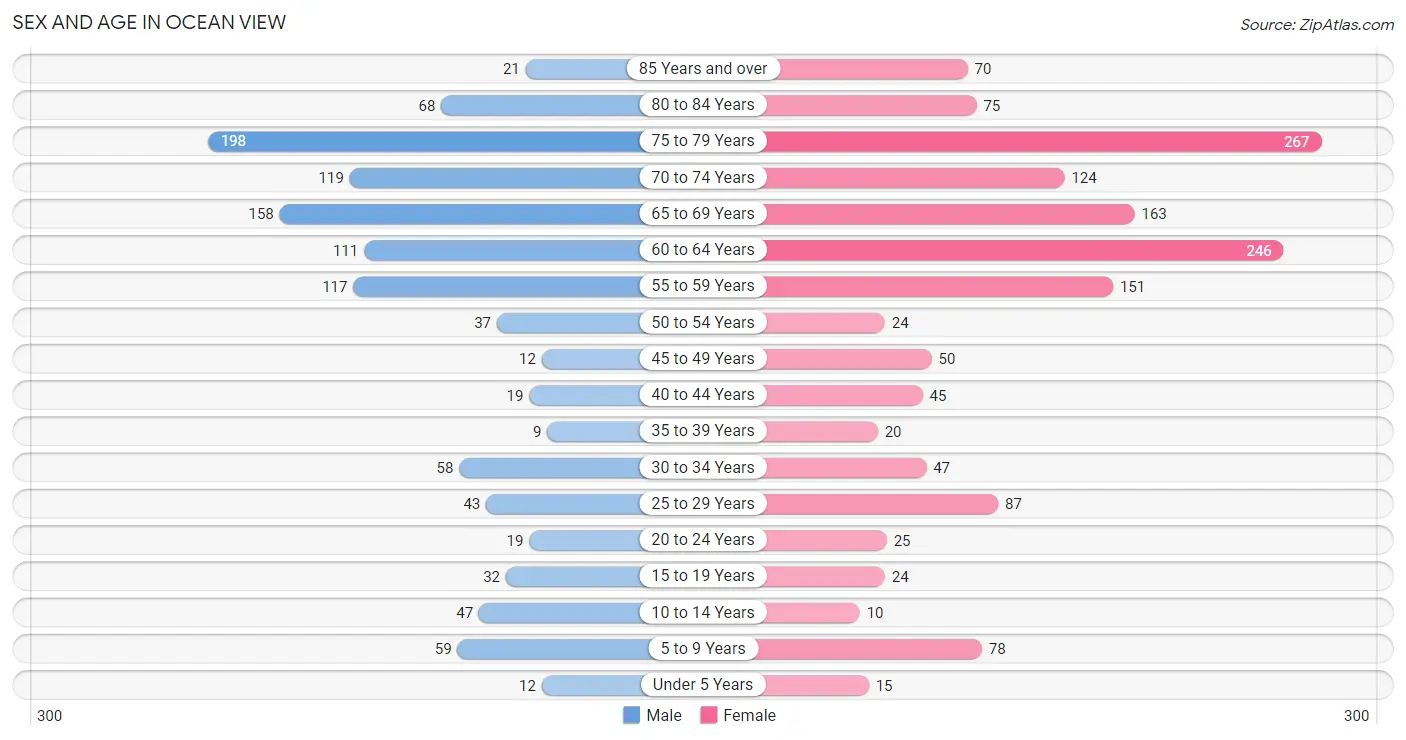
Sex and Age in Ocean View
Sex and Age in Ocean View
The most populous age groups in Ocean View are 75 to 79 Years (198 | 17.4%) for men and 75 to 79 Years (267 | 17.5%) for women.
| Age Bracket | Male | Female |
| Under 5 Years | 12 (1.1%) | 15 (1.0%) |
| 5 to 9 Years | 59 (5.2%) | 78 (5.1%) |
| 10 to 14 Years | 47 (4.1%) | 10 (0.7%) |
| 15 to 19 Years | 32 (2.8%) | 24 (1.6%) |
| 20 to 24 Years | 19 (1.7%) | 25 (1.6%) |
| 25 to 29 Years | 43 (3.8%) | 87 (5.7%) |
| 30 to 34 Years | 58 (5.1%) | 47 (3.1%) |
| 35 to 39 Years | 9 (0.8%) | 20 (1.3%) |
| 40 to 44 Years | 19 (1.7%) | 45 (3.0%) |
| 45 to 49 Years | 12 (1.1%) | 50 (3.3%) |
| 50 to 54 Years | 37 (3.3%) | 24 (1.6%) |
| 55 to 59 Years | 117 (10.3%) | 151 (9.9%) |
| 60 to 64 Years | 111 (9.8%) | 246 (16.2%) |
| 65 to 69 Years | 158 (13.9%) | 163 (10.7%) |
| 70 to 74 Years | 119 (10.4%) | 124 (8.2%) |
| 75 to 79 Years | 198 (17.4%) | 267 (17.5%) |
| 80 to 84 Years | 68 (6.0%) | 75 (4.9%) |
| 85 Years and over | 21 (1.8%) | 70 (4.6%) |
| Total | 1,139 (100.0%) | 1,521 (100.0%) |
Families and Households in Ocean View
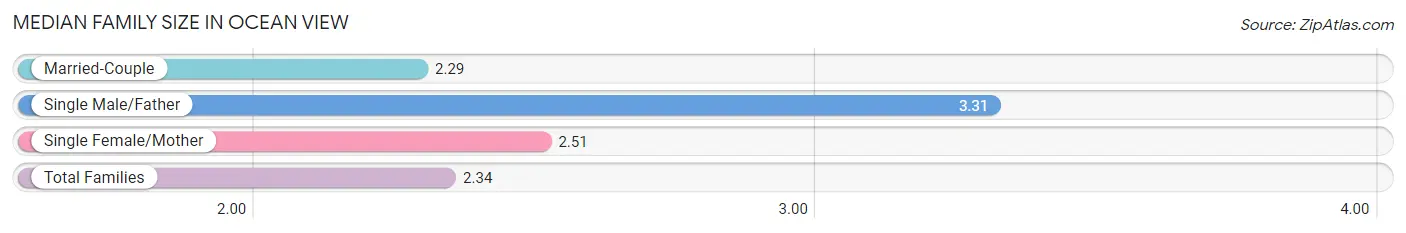
Median Family Size in Ocean View
The median family size in Ocean View is 2.34 persons per family, with single male/father families (29 | 3.1%) accounting for the largest median family size of 3.31 persons per family. On the other hand, married-couple families (842 | 89.7%) represent the smallest median family size with 2.29 persons per family.
| Family Type | # Families | Family Size |
| Married-Couple | 842 (89.7%) | 2.29 |
| Single Male/Father | 29 (3.1%) | 3.31 |
| Single Female/Mother | 68 (7.2%) | 2.51 |
| Total Families | 939 (100.0%) | 2.34 |
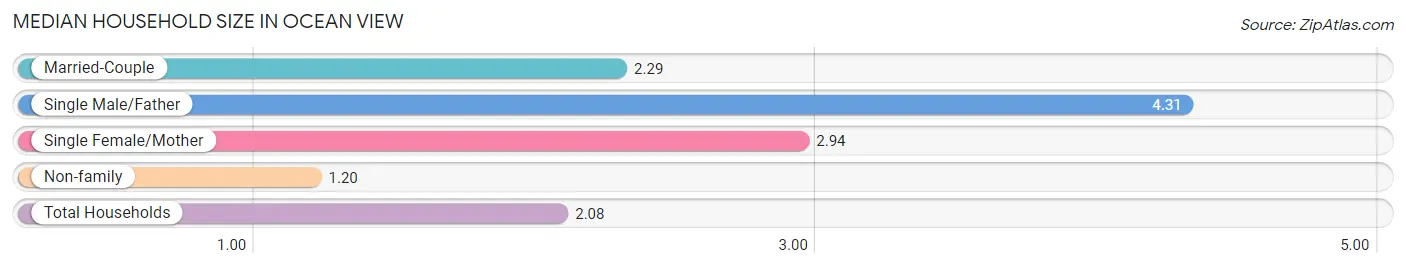
Median Household Size in Ocean View
The median household size in Ocean View is 2.08 persons per household, with single male/father households (29 | 2.3%) accounting for the largest median household size of 4.31 persons per household. non-family households (338 | 26.5%) represent the smallest median household size with 1.20 persons per household.
| Household Type | # Households | Household Size |
| Married-Couple | 842 (65.9%) | 2.29 |
| Single Male/Father | 29 (2.3%) | 4.31 |
| Single Female/Mother | 68 (5.3%) | 2.94 |
| Non-family | 338 (26.5%) | 1.20 |
| Total Households | 1,277 (100.0%) | 2.08 |
Household Size by Marriage Status in Ocean View
Out of a total of 1,277 households in Ocean View, 939 (73.5%) are family households, while 338 (26.5%) are nonfamily households. The most numerous type of family households are 2-person households, comprising 736, and the most common type of nonfamily households are 1-person households, comprising 267.
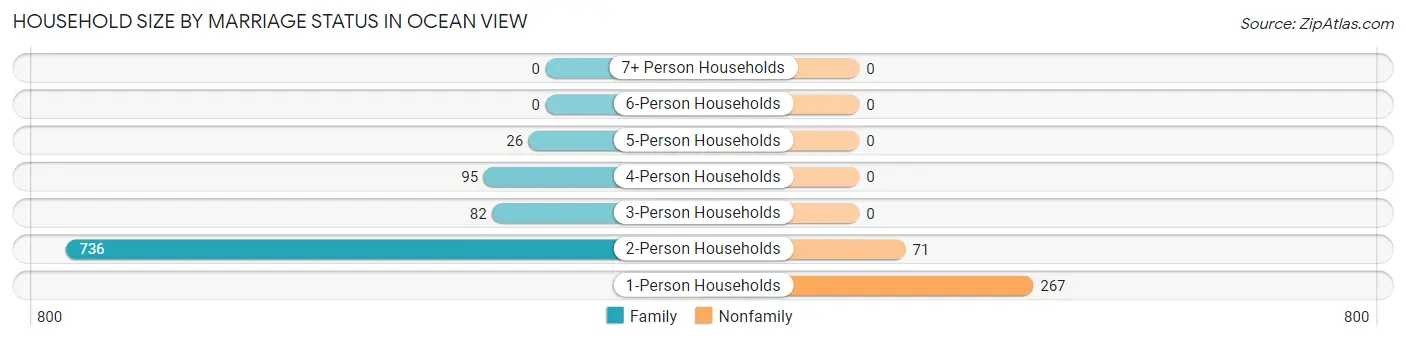
| Household Size | Family Households | Nonfamily Households |
| 1-Person Households | - | 267 (20.9%) |
| 2-Person Households | 736 (57.6%) | 71 (5.6%) |
| 3-Person Households | 82 (6.4%) | 0 (0.0%) |
| 4-Person Households | 95 (7.4%) | 0 (0.0%) |
| 5-Person Households | 26 (2.0%) | 0 (0.0%) |
| 6-Person Households | 0 (0.0%) | 0 (0.0%) |
| 7+ Person Households | 0 (0.0%) | 0 (0.0%) |
| Total | 939 (73.5%) | 338 (26.5%) |
Female Fertility in Ocean View
Fertility by Age in Ocean View
Average fertility rate in Ocean View is 245.0 births per 1,000 women. Women in the age bracket of 20 to 34 years have the highest fertility rate with 421.0 births per 1,000 women. Women in the age bracket of 20 to 34 years acount for 90.5% of all women with births.
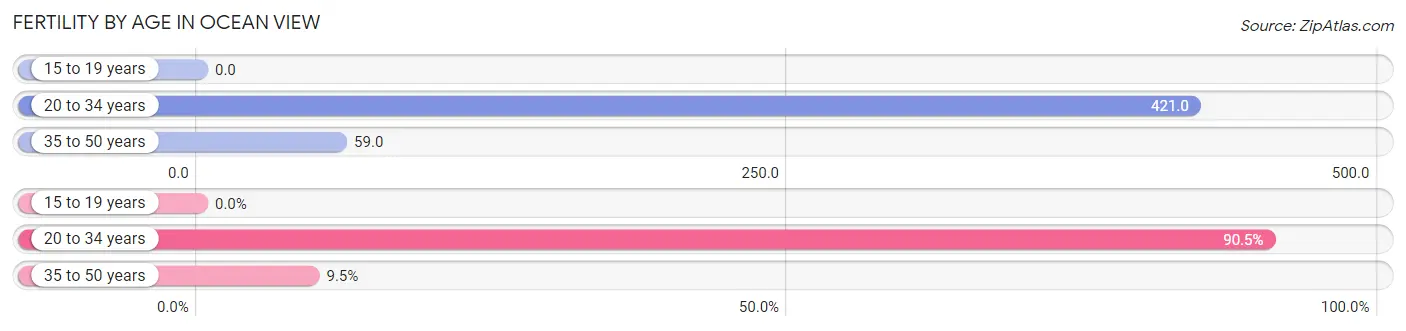
| Age Bracket | Women with Births | Births / 1,000 Women |
| 15 to 19 years | 0 (0.0%) | 0.0 |
| 20 to 34 years | 67 (90.5%) | 421.0 |
| 35 to 50 years | 7 (9.5%) | 59.0 |
| Total | 74 (100.0%) | 245.0 |
Fertility by Age by Marriage Status in Ocean View
9.5% of women with births (74) in Ocean View are married. The highest percentage of unmarried women with births falls into 20 to 34 years age bracket with 100.0% of them unmarried at the time of birth, while the lowest percentage of unmarried women with births belong to 35 to 50 years age bracket with 0.0% of them unmarried.
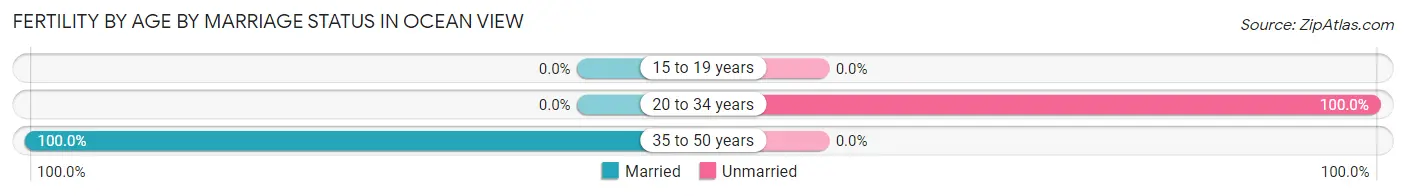
| Age Bracket | Married | Unmarried |
| 15 to 19 years | 0 (0.0%) | 0 (0.0%) |
| 20 to 34 years | 0 (0.0%) | 67 (100.0%) |
| 35 to 50 years | 7 (100.0%) | 0 (0.0%) |
| Total | 7 (9.5%) | 67 (90.5%) |
Fertility by Education in Ocean View
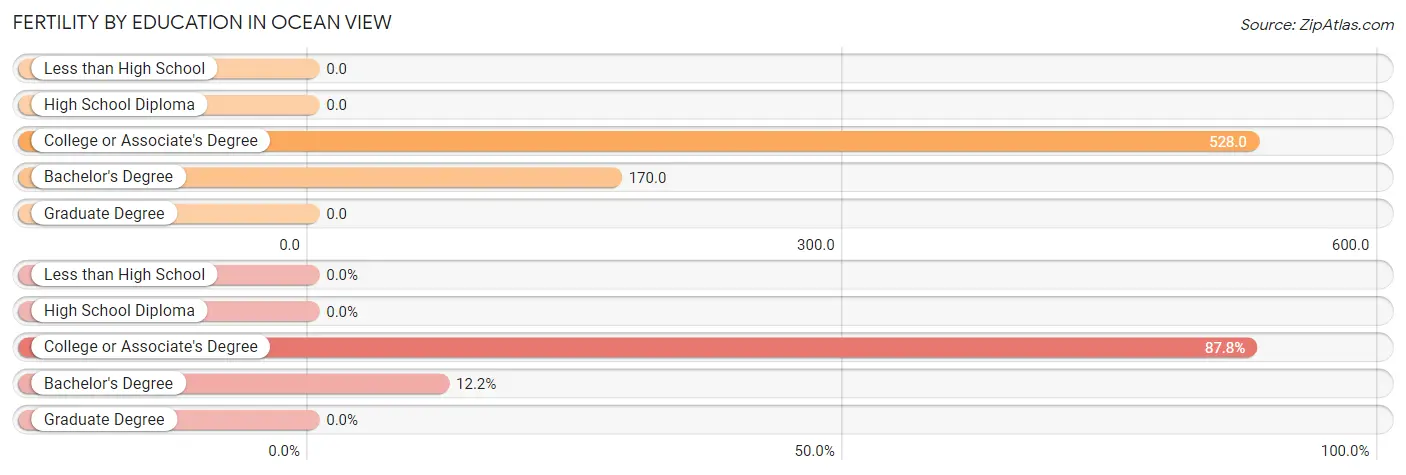
| Educational Attainment | Women with Births | Births / 1,000 Women |
| Less than High School | 0 (0.0%) | 0.0 |
| High School Diploma | 0 (0.0%) | 0.0 |
| College or Associate's Degree | 65 (87.8%) | 528.0 |
| Bachelor's Degree | 9 (12.2%) | 170.0 |
| Graduate Degree | 0 (0.0%) | 0.0 |
| Total | 74 (100.0%) | 245.0 |
Fertility by Education by Marriage Status in Ocean View
90.5% of women with births in Ocean View are unmarried. Women with the educational attainment of college or associate's degree are most likely to be married with 10.8% of them married at childbirth, while women with the educational attainment of bachelor's degree are least likely to be married with 100.0% of them unmarried at childbirth.
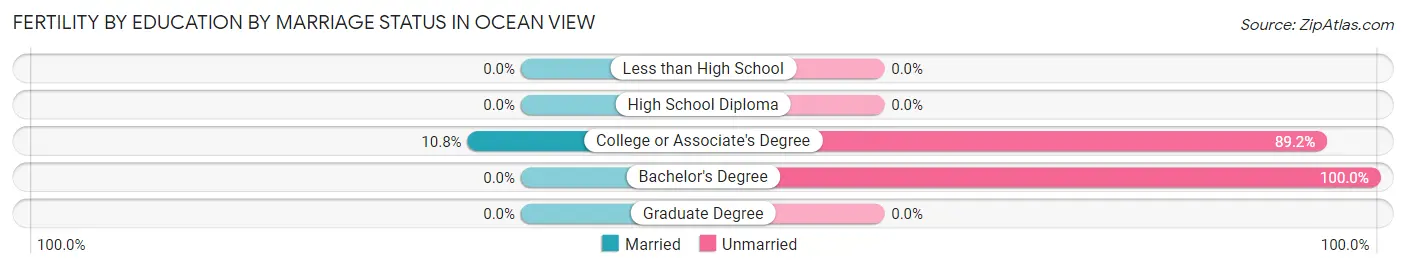
| Educational Attainment | Married | Unmarried |
| Less than High School | 0 (0.0%) | 0 (0.0%) |
| High School Diploma | 0 (0.0%) | 0 (0.0%) |
| College or Associate's Degree | 7 (10.8%) | 58 (89.2%) |
| Bachelor's Degree | 0 (0.0%) | 9 (100.0%) |
| Graduate Degree | 0 (0.0%) | 0 (0.0%) |
| Total | 7 (9.5%) | 67 (90.5%) |
Employment Characteristics in Ocean View
Employment by Class of Employer in Ocean View
Among the 888 employed individuals in Ocean View, private company employees (545 | 61.4%), local government employees (89 | 10.0%), and not-for-profit organizations (86 | 9.7%) make up the most common classes of employment.
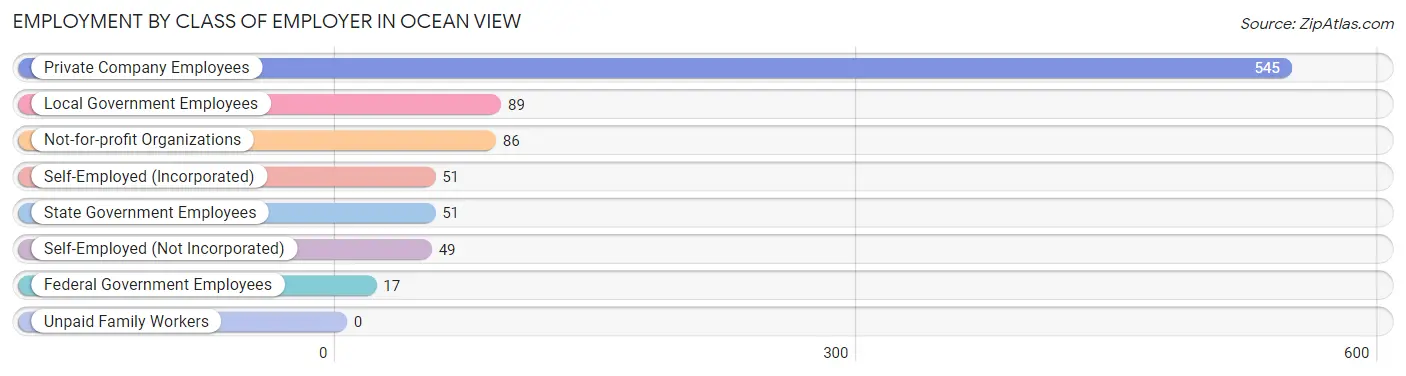
| Employer Class | # Employees | % Employees |
| Private Company Employees | 545 | 61.4% |
| Self-Employed (Incorporated) | 51 | 5.7% |
| Self-Employed (Not Incorporated) | 49 | 5.5% |
| Not-for-profit Organizations | 86 | 9.7% |
| Local Government Employees | 89 | 10.0% |
| State Government Employees | 51 | 5.7% |
| Federal Government Employees | 17 | 1.9% |
| Unpaid Family Workers | 0 | 0.0% |
| Total | 888 | 100.0% |
Employment Status by Age in Ocean View
According to the labor force statistics for Ocean View, out of the total population over 16 years of age (2,415), 38.2% or 923 individuals are in the labor force, with 1.5% or 14 of them unemployed. The age group with the highest labor force participation rate is 30 to 34 years, with 100.0% or 105 individuals in the labor force. Within the labor force, the 75 years and over age range has the highest percentage of unemployed individuals, with 7.8% or 4 of them being unemployed.
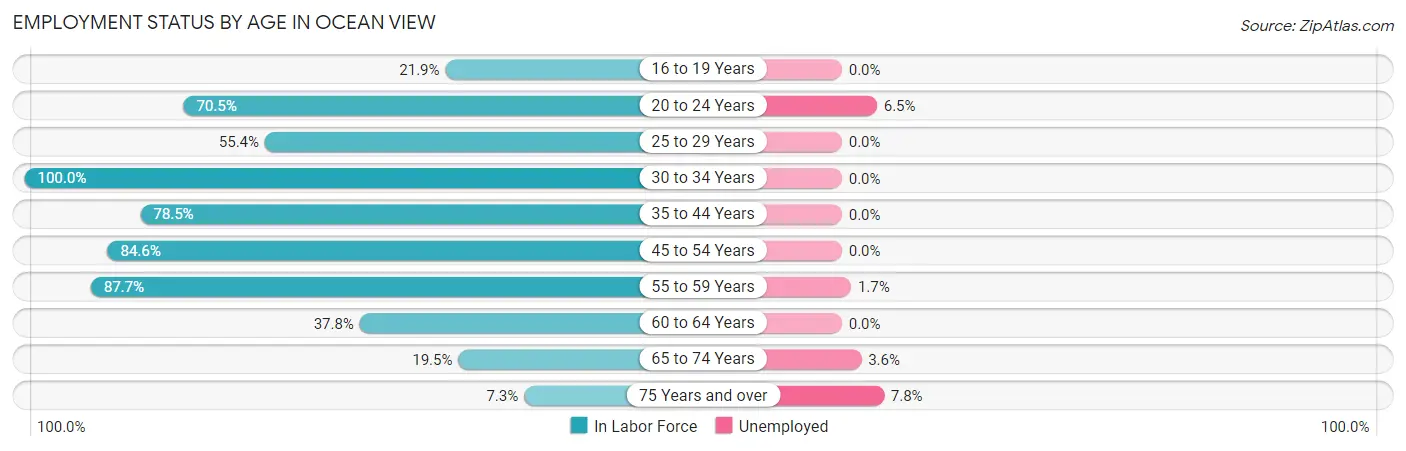
| Age Bracket | In Labor Force | Unemployed |
| 16 to 19 Years | 7 (21.9%) | 0 (0.0%) |
| 20 to 24 Years | 31 (70.5%) | 2 (6.5%) |
| 25 to 29 Years | 72 (55.4%) | 0 (0.0%) |
| 30 to 34 Years | 105 (100.0%) | 0 (0.0%) |
| 35 to 44 Years | 73 (78.5%) | 0 (0.0%) |
| 45 to 54 Years | 104 (84.6%) | 0 (0.0%) |
| 55 to 59 Years | 235 (87.7%) | 4 (1.7%) |
| 60 to 64 Years | 135 (37.8%) | 0 (0.0%) |
| 65 to 74 Years | 110 (19.5%) | 4 (3.6%) |
| 75 Years and over | 51 (7.3%) | 4 (7.8%) |
| Total | 923 (38.2%) | 14 (1.5%) |
Employment Status by Educational Attainment in Ocean View
According to labor force statistics for Ocean View, 67.3% of individuals (724) out of the total population between 25 and 64 years of age (1,076) are in the labor force, with 0.6% or 4 of them being unemployed. The group with the highest labor force participation rate are those with the educational attainment of bachelor's degree or higher, with 76.6% or 366 individuals in the labor force. Within the labor force, individuals with bachelor's degree or higher education have the highest percentage of unemployment, with 1.1% or 4 of them being unemployed.
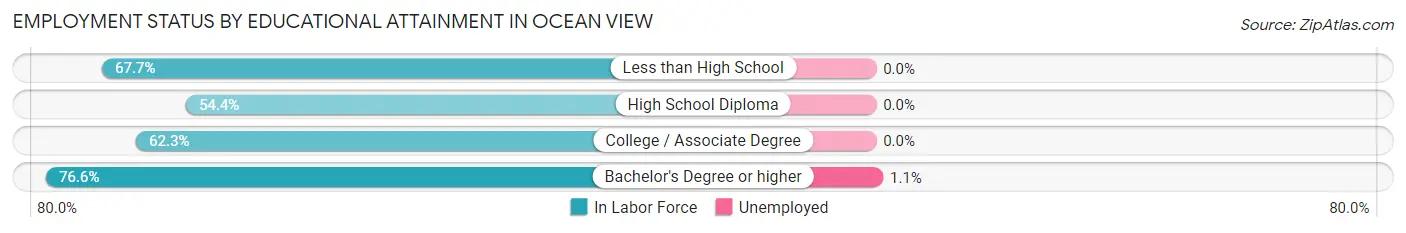
| Educational Attainment | In Labor Force | Unemployed |
| Less than High School | 21 (67.7%) | 0 (0.0%) |
| High School Diploma | 112 (54.4%) | 0 (0.0%) |
| College / Associate Degree | 225 (62.3%) | 0 (0.0%) |
| Bachelor's Degree or higher | 366 (76.6%) | 5 (1.1%) |
| Total | 724 (67.3%) | 6 (0.6%) |
Employment Occupations by Sex in Ocean View
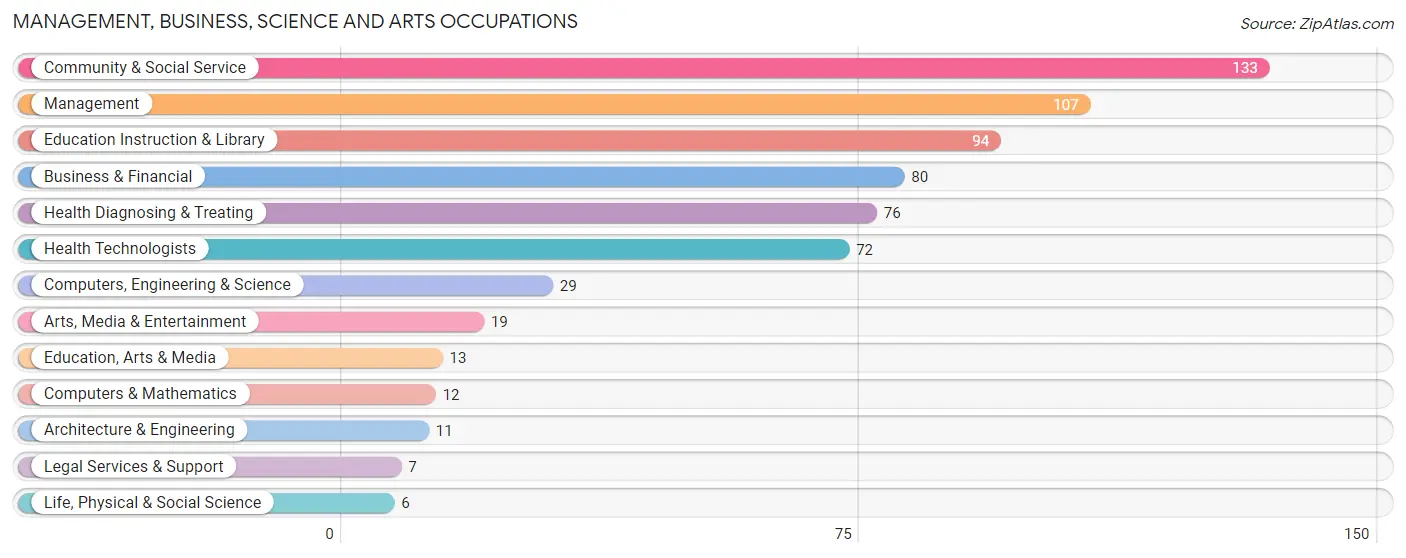
Management, Business, Science and Arts Occupations
The most common Management, Business, Science and Arts occupations in Ocean View are Community & Social Service (133 | 14.6%), Management (107 | 11.8%), Education Instruction & Library (94 | 10.3%), Business & Financial (80 | 8.8%), and Health Diagnosing & Treating (76 | 8.4%).
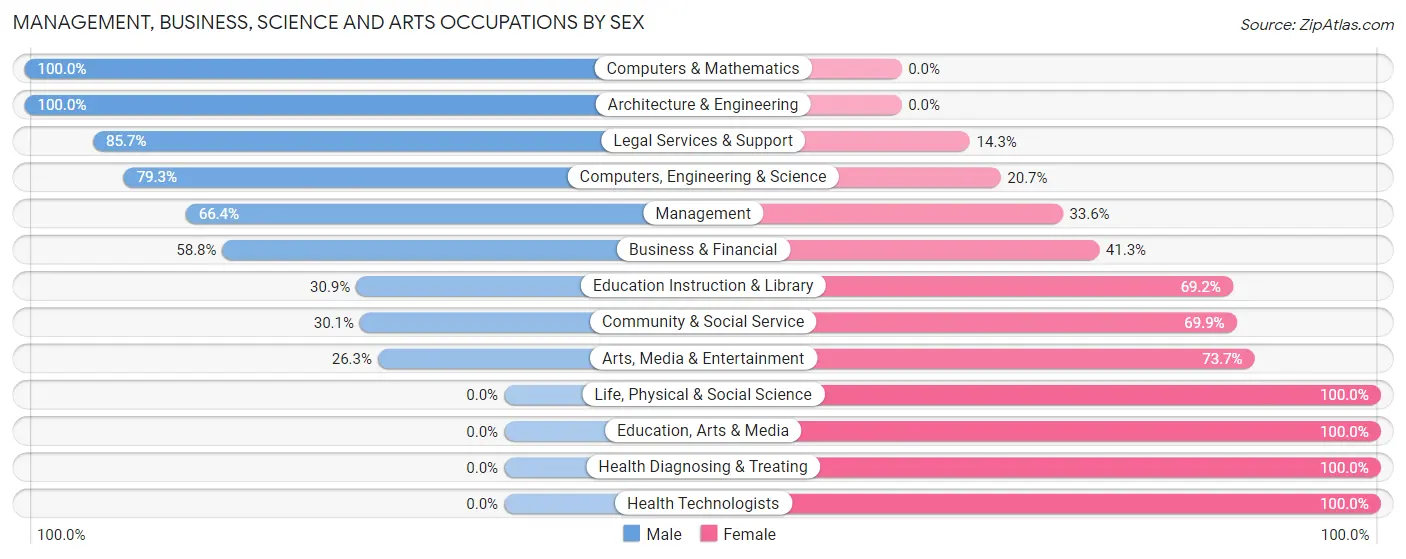
Management, Business, Science and Arts Occupations by Sex
Within the Management, Business, Science and Arts occupations in Ocean View, the most male-oriented occupations are Computers & Mathematics (100.0%), Architecture & Engineering (100.0%), and Legal Services & Support (85.7%), while the most female-oriented occupations are Life, Physical & Social Science (100.0%), Education, Arts & Media (100.0%), and Health Diagnosing & Treating (100.0%).
| Occupation | Male | Female |
| Management | 71 (66.4%) | 36 (33.6%) |
| Business & Financial | 47 (58.8%) | 33 (41.2%) |
| Computers, Engineering & Science | 23 (79.3%) | 6 (20.7%) |
| Computers & Mathematics | 12 (100.0%) | 0 (0.0%) |
| Architecture & Engineering | 11 (100.0%) | 0 (0.0%) |
| Life, Physical & Social Science | 0 (0.0%) | 6 (100.0%) |
| Community & Social Service | 40 (30.1%) | 93 (69.9%) |
| Education, Arts & Media | 0 (0.0%) | 13 (100.0%) |
| Legal Services & Support | 6 (85.7%) | 1 (14.3%) |
| Education Instruction & Library | 29 (30.8%) | 65 (69.2%) |
| Arts, Media & Entertainment | 5 (26.3%) | 14 (73.7%) |
| Health Diagnosing & Treating | 0 (0.0%) | 76 (100.0%) |
| Health Technologists | 0 (0.0%) | 72 (100.0%) |
| Total (Category) | 181 (42.6%) | 244 (57.4%) |
| Total (Overall) | 427 (47.0%) | 482 (53.0%) |
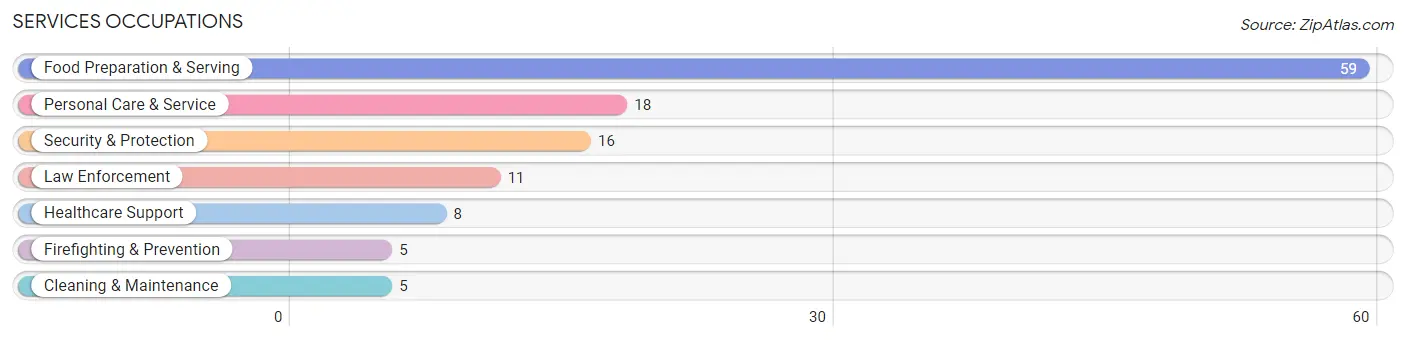
Services Occupations
The most common Services occupations in Ocean View are Food Preparation & Serving (59 | 6.5%), Personal Care & Service (18 | 2.0%), Security & Protection (16 | 1.8%), Law Enforcement (11 | 1.2%), and Healthcare Support (8 | 0.9%).
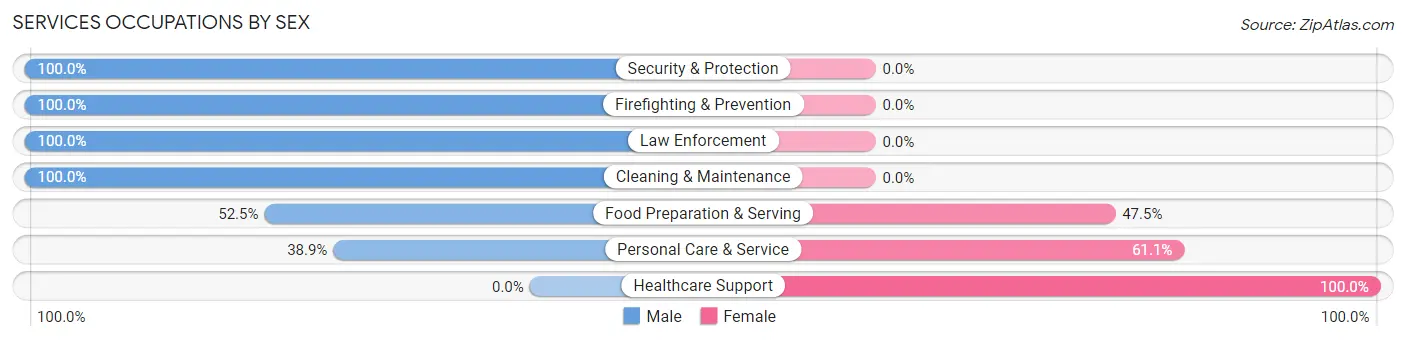
Services Occupations by Sex
Within the Services occupations in Ocean View, the most male-oriented occupations are Security & Protection (100.0%), Firefighting & Prevention (100.0%), and Law Enforcement (100.0%), while the most female-oriented occupations are Healthcare Support (100.0%), Personal Care & Service (61.1%), and Food Preparation & Serving (47.5%).
| Occupation | Male | Female |
| Healthcare Support | 0 (0.0%) | 8 (100.0%) |
| Security & Protection | 16 (100.0%) | 0 (0.0%) |
| Firefighting & Prevention | 5 (100.0%) | 0 (0.0%) |
| Law Enforcement | 11 (100.0%) | 0 (0.0%) |
| Food Preparation & Serving | 31 (52.5%) | 28 (47.5%) |
| Cleaning & Maintenance | 5 (100.0%) | 0 (0.0%) |
| Personal Care & Service | 7 (38.9%) | 11 (61.1%) |
| Total (Category) | 59 (55.7%) | 47 (44.3%) |
| Total (Overall) | 427 (47.0%) | 482 (53.0%) |
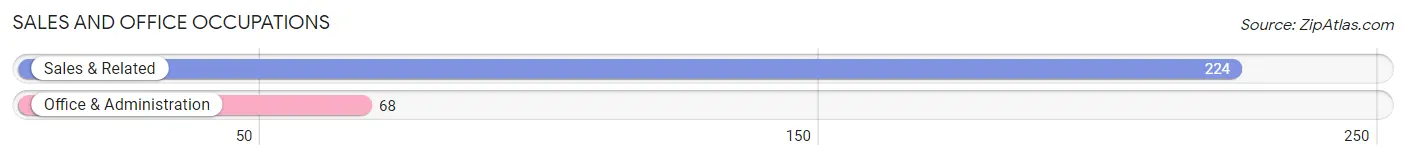
Sales and Office Occupations
The most common Sales and Office occupations in Ocean View are Sales & Related (224 | 24.6%), and Office & Administration (68 | 7.5%).
Sales and Office Occupations by Sex
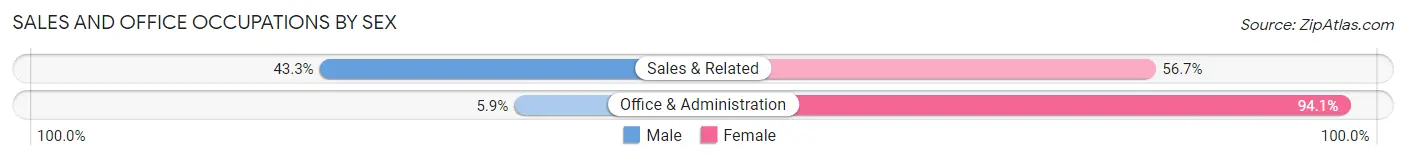
| Occupation | Male | Female |
| Sales & Related | 97 (43.3%) | 127 (56.7%) |
| Office & Administration | 4 (5.9%) | 64 (94.1%) |
| Total (Category) | 101 (34.6%) | 191 (65.4%) |
| Total (Overall) | 427 (47.0%) | 482 (53.0%) |
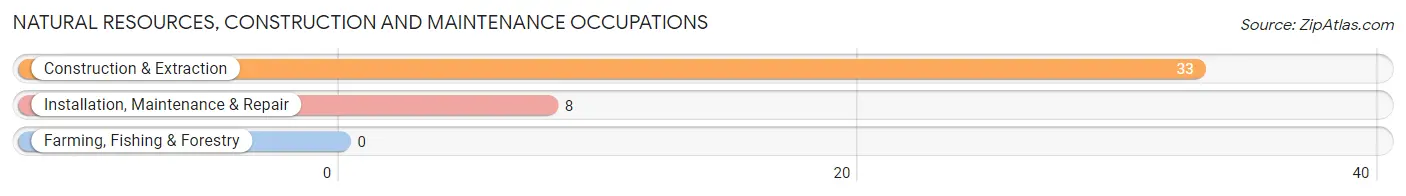
Natural Resources, Construction and Maintenance Occupations
The most common Natural Resources, Construction and Maintenance occupations in Ocean View are Construction & Extraction (33 | 3.6%), and Installation, Maintenance & Repair (8 | 0.9%).
Natural Resources, Construction and Maintenance Occupations by Sex
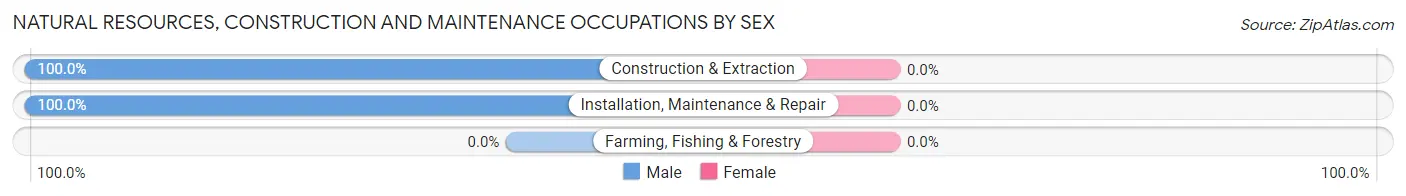
| Occupation | Male | Female |
| Farming, Fishing & Forestry | 0 (0.0%) | 0 (0.0%) |
| Construction & Extraction | 33 (100.0%) | 0 (0.0%) |
| Installation, Maintenance & Repair | 8 (100.0%) | 0 (0.0%) |
| Total (Category) | 41 (100.0%) | 0 (0.0%) |
| Total (Overall) | 427 (47.0%) | 482 (53.0%) |
Production, Transportation and Moving Occupations
The most common Production, Transportation and Moving occupations in Ocean View are Transportation (32 | 3.5%), Material Moving (8 | 0.9%), and Production (5 | 0.5%).
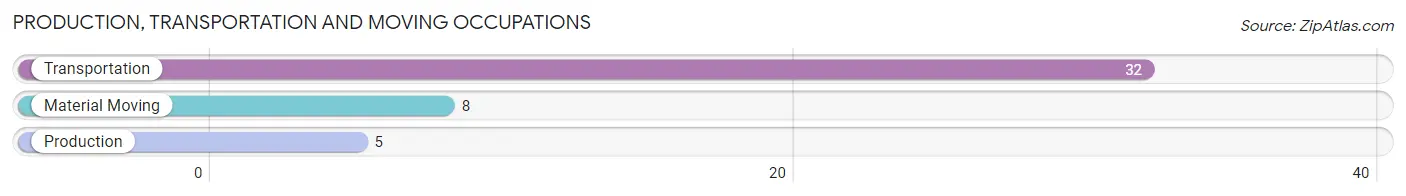
Production, Transportation and Moving Occupations by Sex
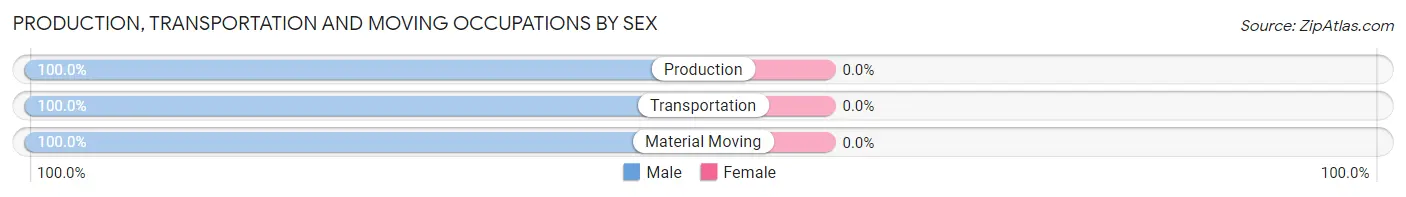
| Occupation | Male | Female |
| Production | 5 (100.0%) | 0 (0.0%) |
| Transportation | 32 (100.0%) | 0 (0.0%) |
| Material Moving | 8 (100.0%) | 0 (0.0%) |
| Total (Category) | 45 (100.0%) | 0 (0.0%) |
| Total (Overall) | 427 (47.0%) | 482 (53.0%) |
Employment Industries by Sex in Ocean View
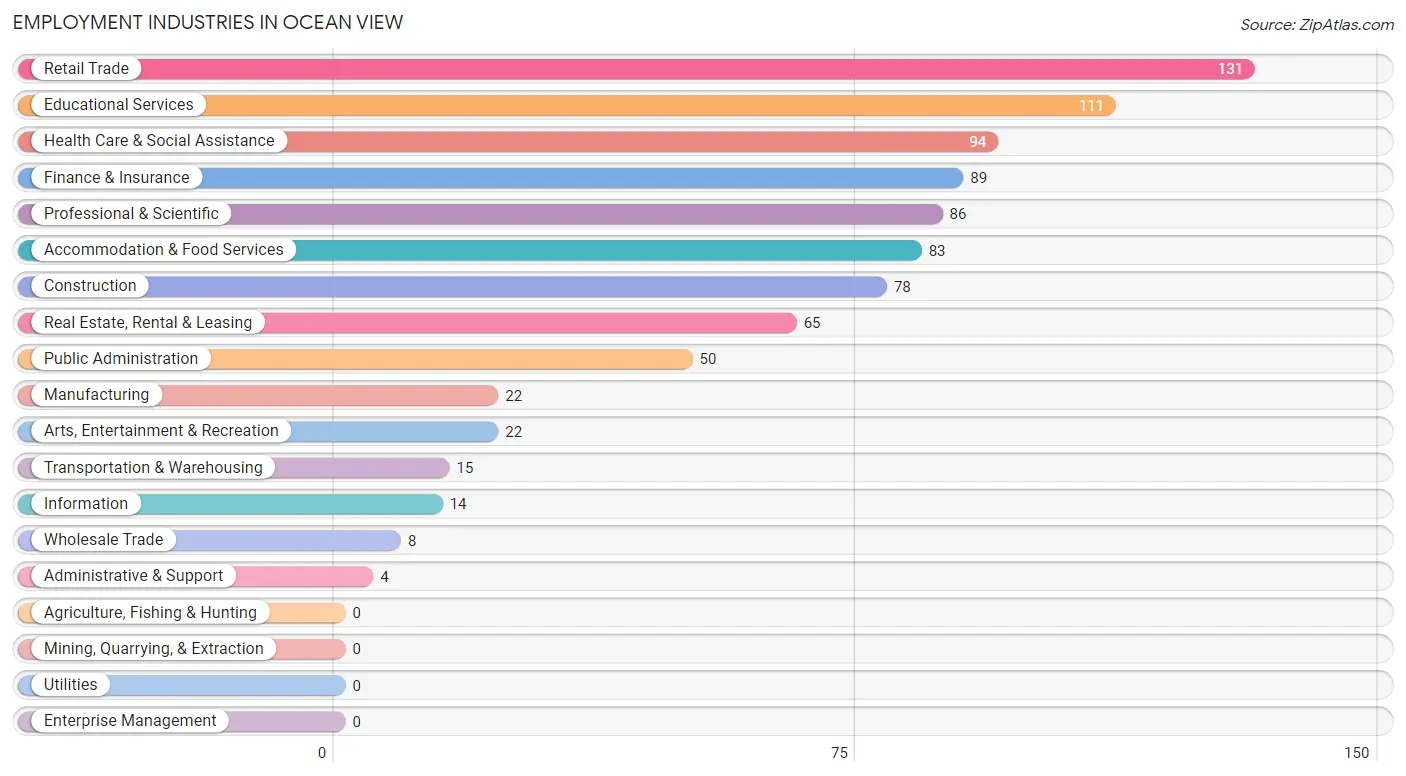
Employment Industries in Ocean View
The major employment industries in Ocean View include Retail Trade (131 | 14.4%), Educational Services (111 | 12.2%), Health Care & Social Assistance (94 | 10.3%), Finance & Insurance (89 | 9.8%), and Professional & Scientific (86 | 9.5%).
Employment Industries by Sex in Ocean View
The Ocean View industries that see more men than women are Construction (100.0%), Transportation & Warehousing (100.0%), and Arts, Entertainment & Recreation (100.0%), whereas the industries that tend to have a higher number of women are Wholesale Trade (100.0%), Information (100.0%), and Administrative & Support (100.0%).
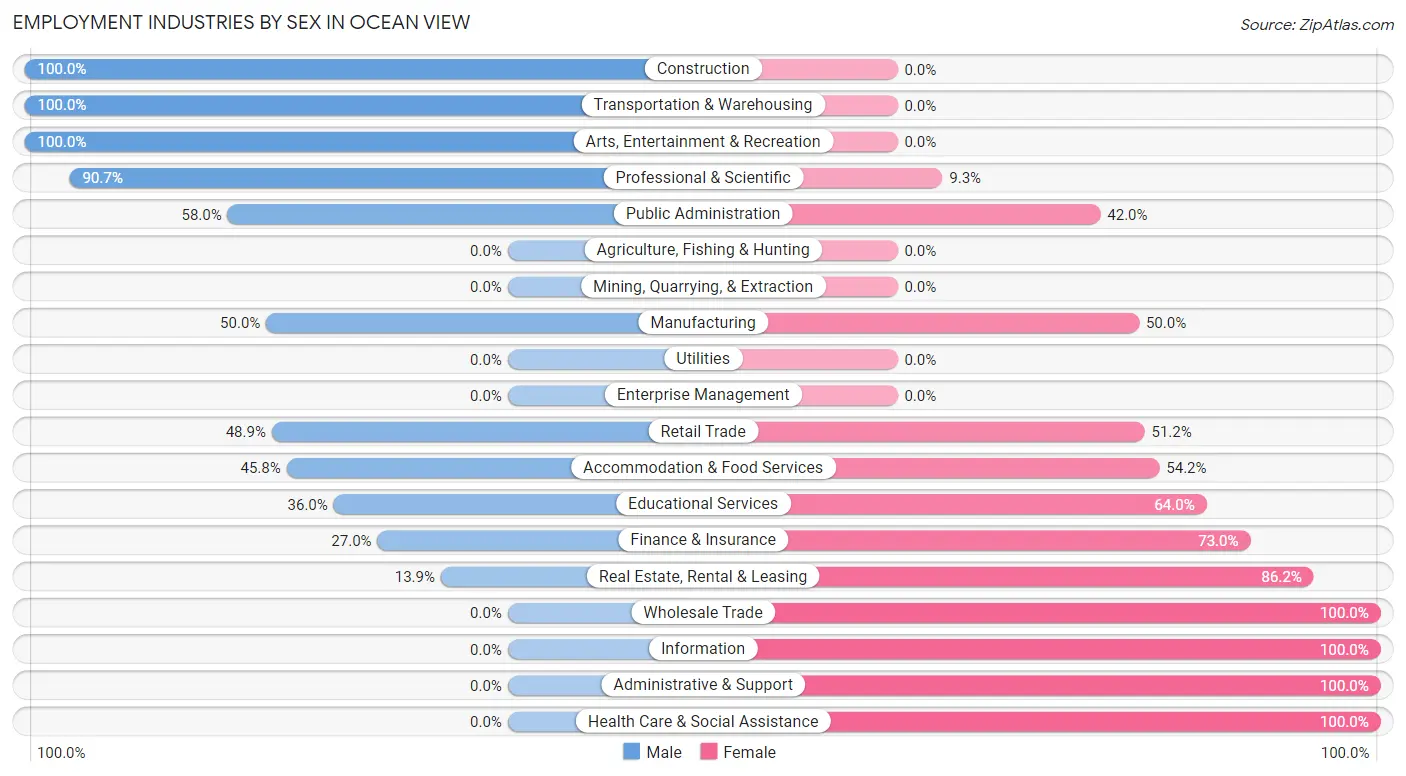
| Industry | Male | Female |
| Agriculture, Fishing & Hunting | 0 (0.0%) | 0 (0.0%) |
| Mining, Quarrying, & Extraction | 0 (0.0%) | 0 (0.0%) |
| Construction | 78 (100.0%) | 0 (0.0%) |
| Manufacturing | 11 (50.0%) | 11 (50.0%) |
| Wholesale Trade | 0 (0.0%) | 8 (100.0%) |
| Retail Trade | 64 (48.8%) | 67 (51.1%) |
| Transportation & Warehousing | 15 (100.0%) | 0 (0.0%) |
| Utilities | 0 (0.0%) | 0 (0.0%) |
| Information | 0 (0.0%) | 14 (100.0%) |
| Finance & Insurance | 24 (27.0%) | 65 (73.0%) |
| Real Estate, Rental & Leasing | 9 (13.9%) | 56 (86.2%) |
| Professional & Scientific | 78 (90.7%) | 8 (9.3%) |
| Enterprise Management | 0 (0.0%) | 0 (0.0%) |
| Administrative & Support | 0 (0.0%) | 4 (100.0%) |
| Educational Services | 40 (36.0%) | 71 (64.0%) |
| Health Care & Social Assistance | 0 (0.0%) | 94 (100.0%) |
| Arts, Entertainment & Recreation | 22 (100.0%) | 0 (0.0%) |
| Accommodation & Food Services | 38 (45.8%) | 45 (54.2%) |
| Public Administration | 29 (58.0%) | 21 (42.0%) |
| Total | 427 (47.0%) | 482 (53.0%) |
Education in Ocean View
School Enrollment in Ocean View
The most common levels of schooling among the 284 students in Ocean View are elementary school (115 | 40.5%), middle school (57 | 20.1%), and high school (41 | 14.4%).
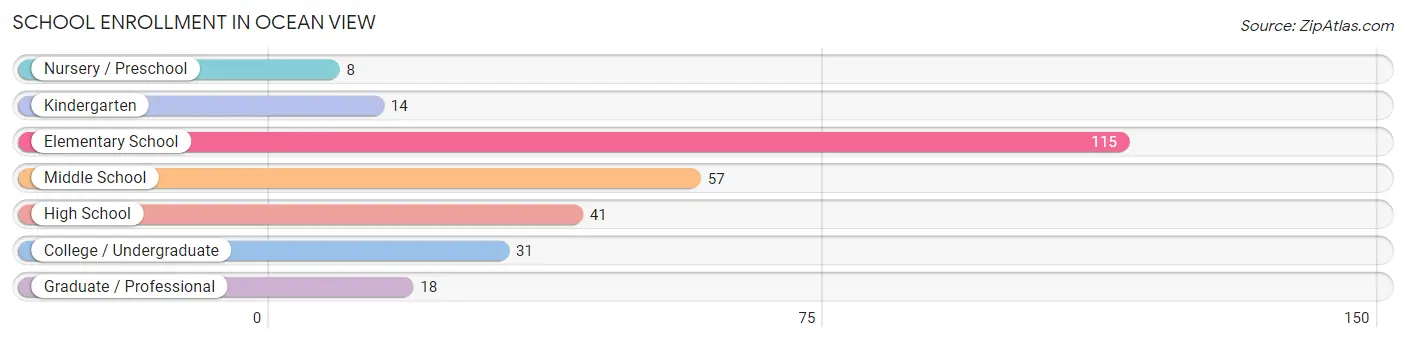
| School Level | # Students | % Students |
| Nursery / Preschool | 8 | 2.8% |
| Kindergarten | 14 | 4.9% |
| Elementary School | 115 | 40.5% |
| Middle School | 57 | 20.1% |
| High School | 41 | 14.4% |
| College / Undergraduate | 31 | 10.9% |
| Graduate / Professional | 18 | 6.3% |
| Total | 284 | 100.0% |
School Enrollment by Age by Funding Source in Ocean View
Out of a total of 284 students who are enrolled in schools in Ocean View, 53 (18.7%) attend a private institution, while the remaining 231 (81.3%) are enrolled in public schools. The age group of 25 to 34 year olds has the highest likelihood of being enrolled in private schools, with 8 (100.0% in the age bracket) enrolled. Conversely, the age group of 15 to 17 year olds has the lowest likelihood of being enrolled in a private school, with 32 (100.0% in the age bracket) attending a public institution.
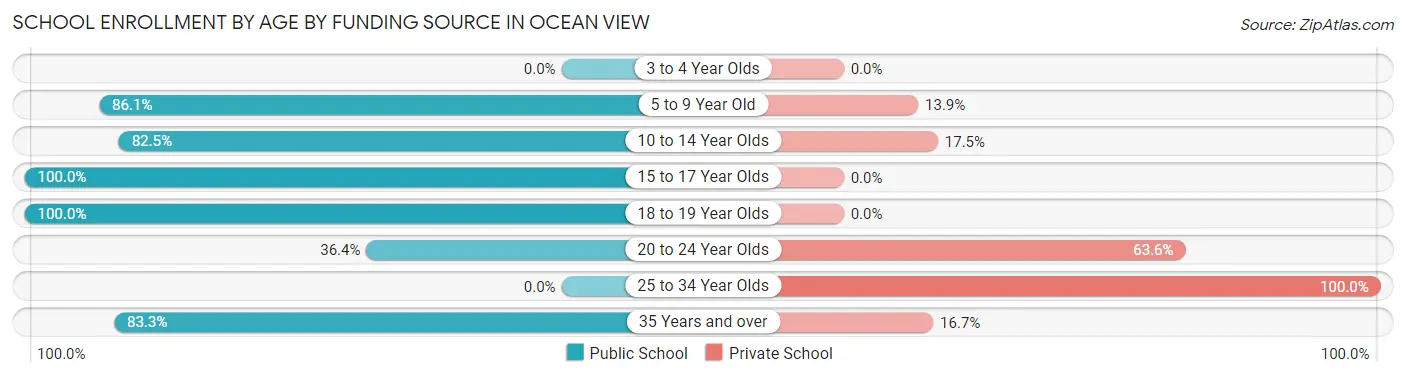
| Age Bracket | Public School | Private School |
| 3 to 4 Year Olds | 0 (0.0%) | 0 (0.0%) |
| 5 to 9 Year Old | 118 (86.1%) | 19 (13.9%) |
| 10 to 14 Year Olds | 47 (82.5%) | 10 (17.5%) |
| 15 to 17 Year Olds | 32 (100.0%) | 0 (0.0%) |
| 18 to 19 Year Olds | 16 (100.0%) | 0 (0.0%) |
| 20 to 24 Year Olds | 8 (36.4%) | 14 (63.6%) |
| 25 to 34 Year Olds | 0 (0.0%) | 8 (100.0%) |
| 35 Years and over | 10 (83.3%) | 2 (16.7%) |
| Total | 231 (81.3%) | 53 (18.7%) |
Educational Attainment by Field of Study in Ocean View
Business (225 | 19.4%), education (218 | 18.7%), social sciences (170 | 14.6%), science & technology (131 | 11.3%), and psychology (114 | 9.8%) are the most common fields of study among 1,163 individuals in Ocean View who have obtained a bachelor's degree or higher.
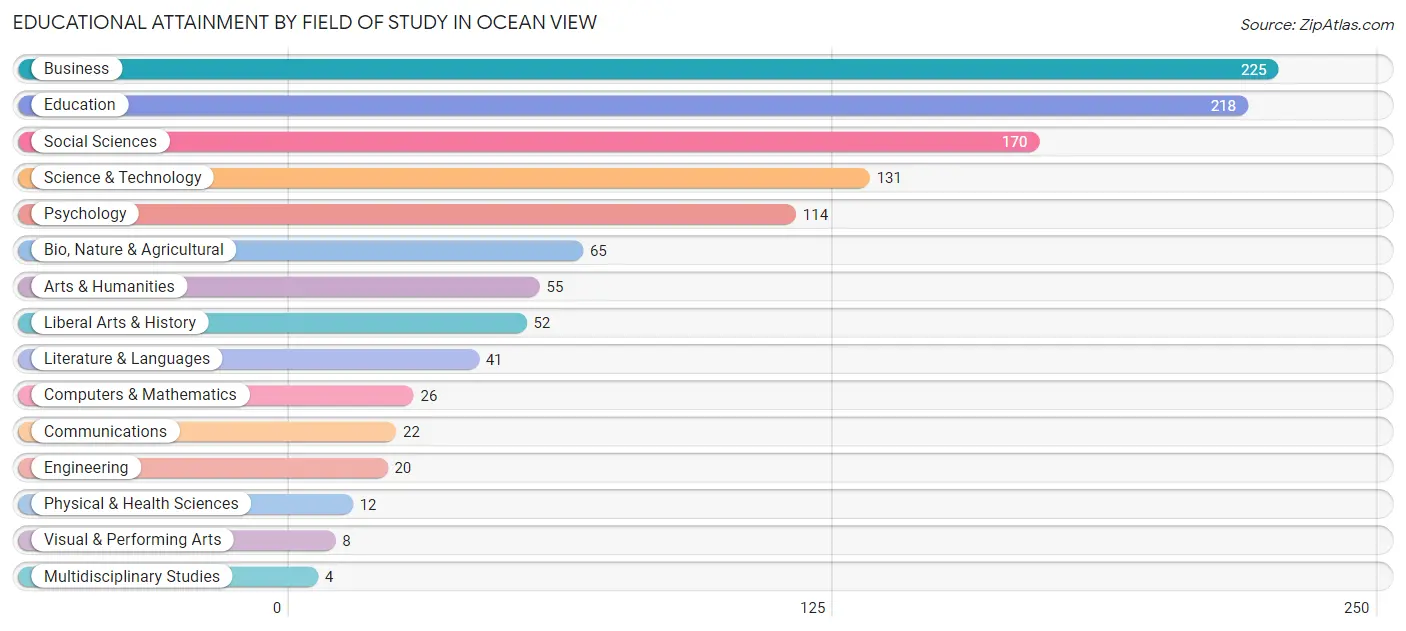
| Field of Study | # Graduates | % Graduates |
| Computers & Mathematics | 26 | 2.2% |
| Bio, Nature & Agricultural | 65 | 5.6% |
| Physical & Health Sciences | 12 | 1.0% |
| Psychology | 114 | 9.8% |
| Social Sciences | 170 | 14.6% |
| Engineering | 20 | 1.7% |
| Multidisciplinary Studies | 4 | 0.3% |
| Science & Technology | 131 | 11.3% |
| Business | 225 | 19.4% |
| Education | 218 | 18.7% |
| Literature & Languages | 41 | 3.5% |
| Liberal Arts & History | 52 | 4.5% |
| Visual & Performing Arts | 8 | 0.7% |
| Communications | 22 | 1.9% |
| Arts & Humanities | 55 | 4.7% |
| Total | 1,163 | 100.0% |
Transportation & Commute in Ocean View
Vehicle Availability by Sex in Ocean View
The most prevalent vehicle ownership categories in Ocean View are males with 2 vehicles (291, accounting for 68.8%) and females with 2 vehicles (332, making up 62.6%).
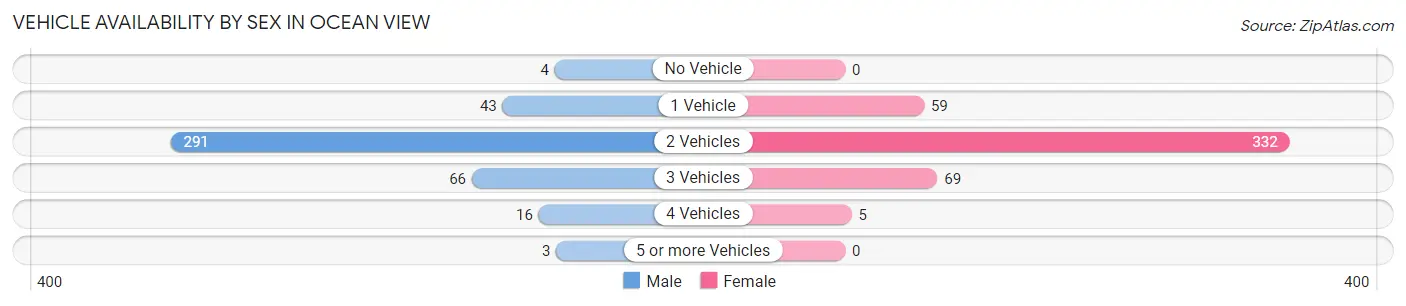
| Vehicles Available | Male | Female |
| No Vehicle | 4 (0.9%) | 0 (0.0%) |
| 1 Vehicle | 43 (10.2%) | 59 (12.7%) |
| 2 Vehicles | 291 (68.8%) | 332 (71.4%) |
| 3 Vehicles | 66 (15.6%) | 69 (14.8%) |
| 4 Vehicles | 16 (3.8%) | 5 (1.1%) |
| 5 or more Vehicles | 3 (0.7%) | 0 (0.0%) |
| Total | 423 (100.0%) | 465 (100.0%) |
Commute Time in Ocean View
The most frequently occuring commute durations in Ocean View are 5 to 9 minutes (130 commuters, 16.5%), 10 to 14 minutes (119 commuters, 15.1%), and 45 to 59 minutes (103 commuters, 13.1%).
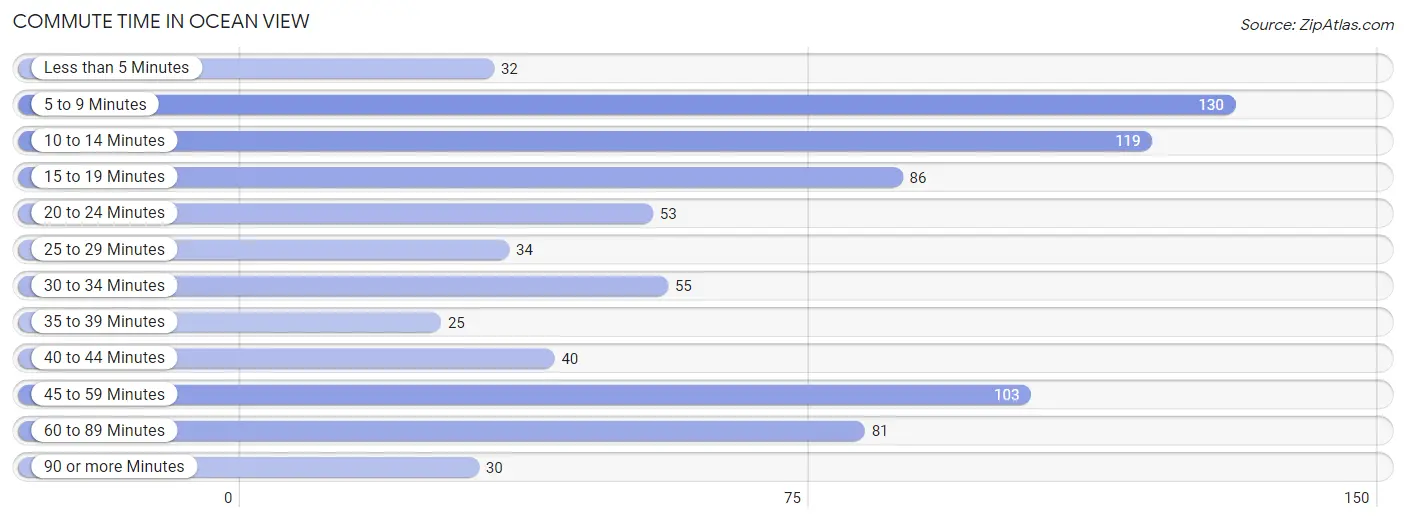
| Commute Time | # Commuters | % Commuters |
| Less than 5 Minutes | 32 | 4.1% |
| 5 to 9 Minutes | 130 | 16.5% |
| 10 to 14 Minutes | 119 | 15.1% |
| 15 to 19 Minutes | 86 | 10.9% |
| 20 to 24 Minutes | 53 | 6.7% |
| 25 to 29 Minutes | 34 | 4.3% |
| 30 to 34 Minutes | 55 | 7.0% |
| 35 to 39 Minutes | 25 | 3.2% |
| 40 to 44 Minutes | 40 | 5.1% |
| 45 to 59 Minutes | 103 | 13.1% |
| 60 to 89 Minutes | 81 | 10.3% |
| 90 or more Minutes | 30 | 3.8% |
Commute Time by Sex in Ocean View
The most common commute times in Ocean View are 45 to 59 minutes (69 commuters, 17.5%) for males and 10 to 14 minutes (74 commuters, 18.8%) for females.
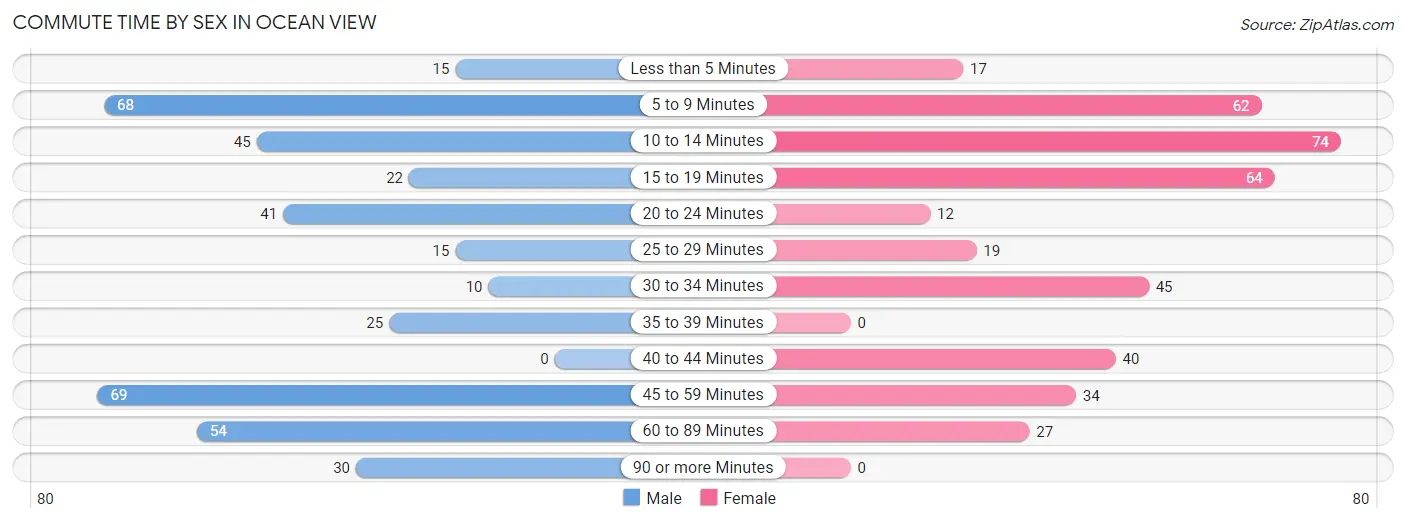
| Commute Time | Male | Female |
| Less than 5 Minutes | 15 (3.8%) | 17 (4.3%) |
| 5 to 9 Minutes | 68 (17.3%) | 62 (15.7%) |
| 10 to 14 Minutes | 45 (11.4%) | 74 (18.8%) |
| 15 to 19 Minutes | 22 (5.6%) | 64 (16.2%) |
| 20 to 24 Minutes | 41 (10.4%) | 12 (3.0%) |
| 25 to 29 Minutes | 15 (3.8%) | 19 (4.8%) |
| 30 to 34 Minutes | 10 (2.5%) | 45 (11.4%) |
| 35 to 39 Minutes | 25 (6.4%) | 0 (0.0%) |
| 40 to 44 Minutes | 0 (0.0%) | 40 (10.2%) |
| 45 to 59 Minutes | 69 (17.5%) | 34 (8.6%) |
| 60 to 89 Minutes | 54 (13.7%) | 27 (6.9%) |
| 90 or more Minutes | 30 (7.6%) | 0 (0.0%) |
Time of Departure to Work by Sex in Ocean View
The most frequent times of departure to work in Ocean View are 7:00 AM to 7:29 AM (130, 33.0%) for males and 6:30 AM to 6:59 AM (75, 19.0%) for females.
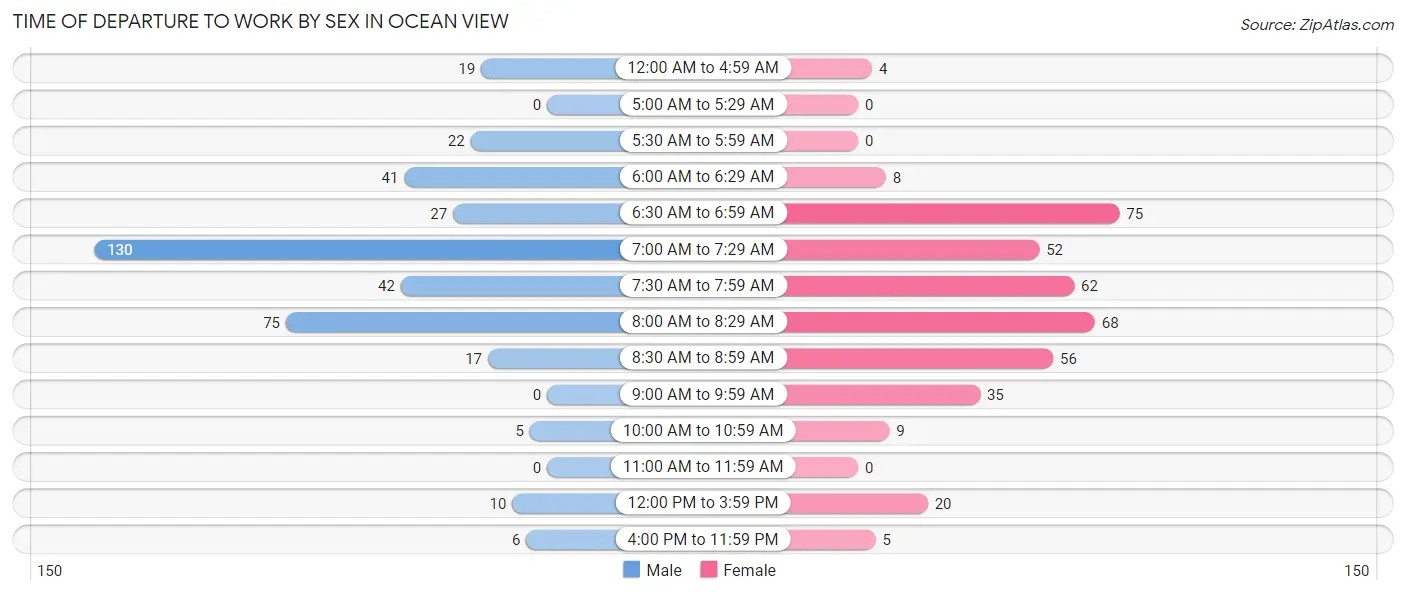
| Time of Departure | Male | Female |
| 12:00 AM to 4:59 AM | 19 (4.8%) | 4 (1.0%) |
| 5:00 AM to 5:29 AM | 0 (0.0%) | 0 (0.0%) |
| 5:30 AM to 5:59 AM | 22 (5.6%) | 0 (0.0%) |
| 6:00 AM to 6:29 AM | 41 (10.4%) | 8 (2.0%) |
| 6:30 AM to 6:59 AM | 27 (6.9%) | 75 (19.0%) |
| 7:00 AM to 7:29 AM | 130 (33.0%) | 52 (13.2%) |
| 7:30 AM to 7:59 AM | 42 (10.7%) | 62 (15.7%) |
| 8:00 AM to 8:29 AM | 75 (19.0%) | 68 (17.3%) |
| 8:30 AM to 8:59 AM | 17 (4.3%) | 56 (14.2%) |
| 9:00 AM to 9:59 AM | 0 (0.0%) | 35 (8.9%) |
| 10:00 AM to 10:59 AM | 5 (1.3%) | 9 (2.3%) |
| 11:00 AM to 11:59 AM | 0 (0.0%) | 0 (0.0%) |
| 12:00 PM to 3:59 PM | 10 (2.5%) | 20 (5.1%) |
| 4:00 PM to 11:59 PM | 6 (1.5%) | 5 (1.3%) |
| Total | 394 (100.0%) | 394 (100.0%) |
Housing Occupancy in Ocean View
Occupancy by Ownership in Ocean View
Of the total 1,277 dwellings in Ocean View, owner-occupied units account for 1,201 (94.1%), while renter-occupied units make up 76 (5.9%).
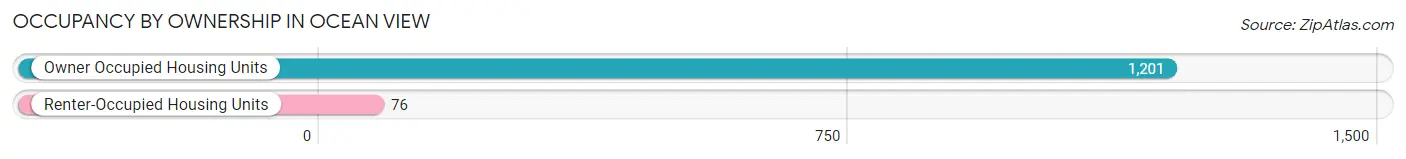
| Occupancy | # Housing Units | % Housing Units |
| Owner Occupied Housing Units | 1,201 | 94.1% |
| Renter-Occupied Housing Units | 76 | 5.9% |
| Total Occupied Housing Units | 1,277 | 100.0% |
Occupancy by Household Size in Ocean View
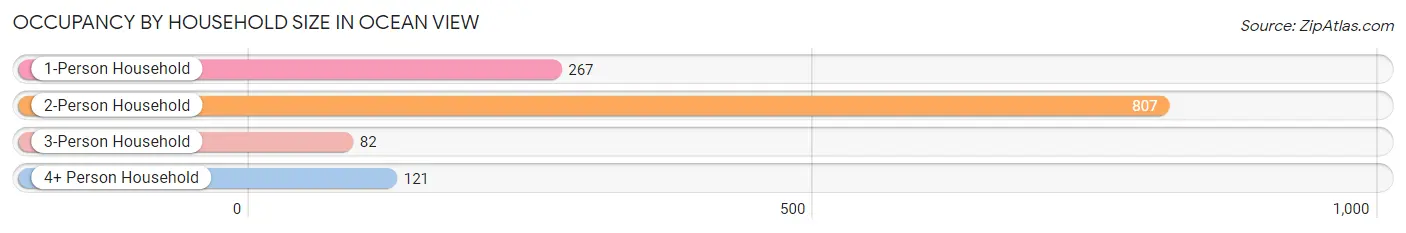
| Household Size | # Housing Units | % Housing Units |
| 1-Person Household | 267 | 20.9% |
| 2-Person Household | 807 | 63.2% |
| 3-Person Household | 82 | 6.4% |
| 4+ Person Household | 121 | 9.5% |
| Total Housing Units | 1,277 | 100.0% |
Occupancy by Ownership by Household Size in Ocean View
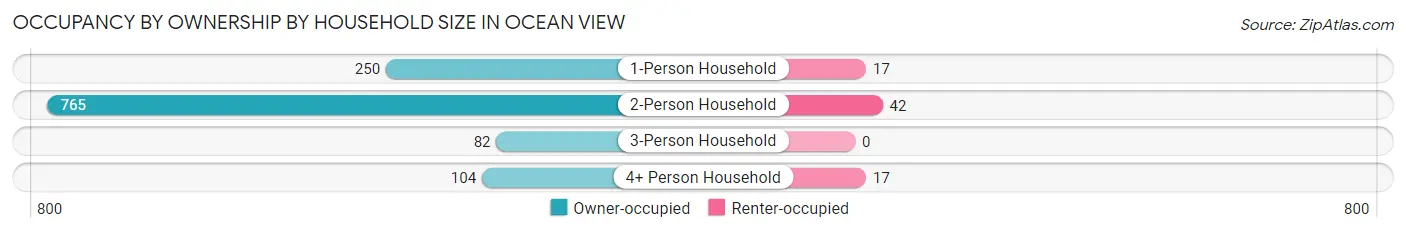
| Household Size | Owner-occupied | Renter-occupied |
| 1-Person Household | 250 (93.6%) | 17 (6.4%) |
| 2-Person Household | 765 (94.8%) | 42 (5.2%) |
| 3-Person Household | 82 (100.0%) | 0 (0.0%) |
| 4+ Person Household | 104 (86.0%) | 17 (14.1%) |
| Total Housing Units | 1,201 (94.1%) | 76 (5.9%) |
Occupancy by Educational Attainment in Ocean View
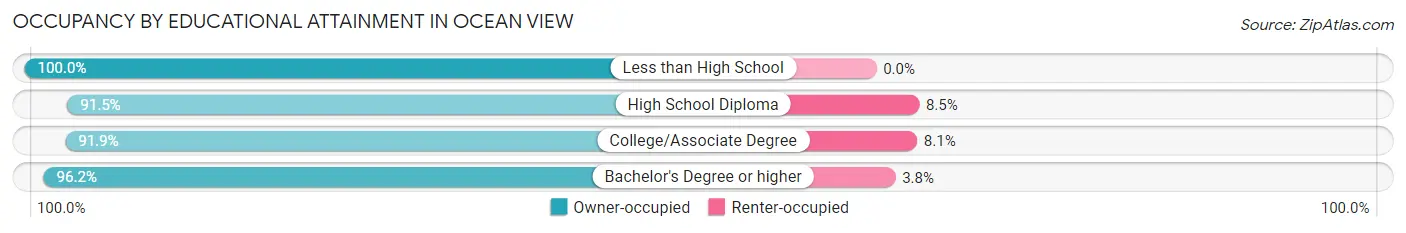
| Household Size | Owner-occupied | Renter-occupied |
| Less than High School | 9 (100.0%) | 0 (0.0%) |
| High School Diploma | 194 (91.5%) | 18 (8.5%) |
| College/Associate Degree | 387 (91.9%) | 34 (8.1%) |
| Bachelor's Degree or higher | 611 (96.2%) | 24 (3.8%) |
Occupancy by Age of Householder in Ocean View
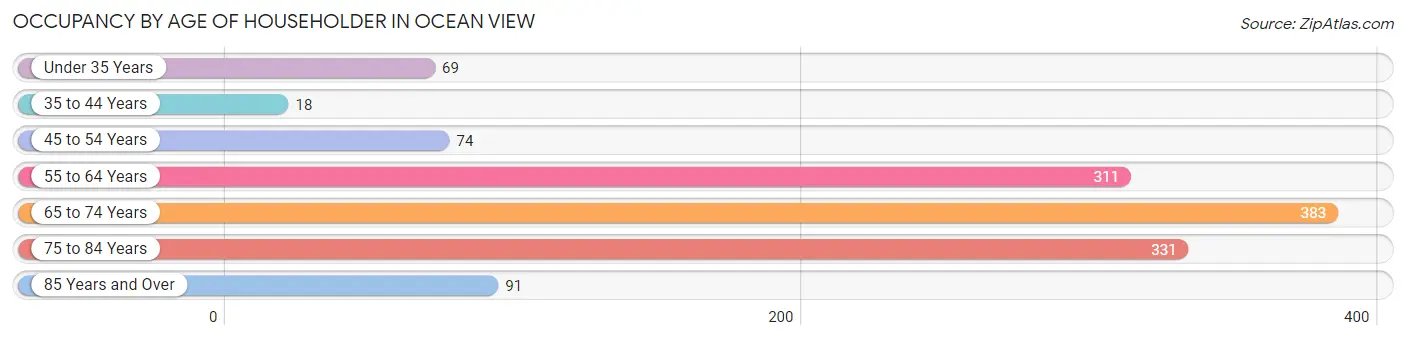
| Age Bracket | # Households | % Households |
| Under 35 Years | 69 | 5.4% |
| 35 to 44 Years | 18 | 1.4% |
| 45 to 54 Years | 74 | 5.8% |
| 55 to 64 Years | 311 | 24.3% |
| 65 to 74 Years | 383 | 30.0% |
| 75 to 84 Years | 331 | 25.9% |
| 85 Years and Over | 91 | 7.1% |
| Total | 1,277 | 100.0% |
Housing Finances in Ocean View
Median Income by Occupancy in Ocean View
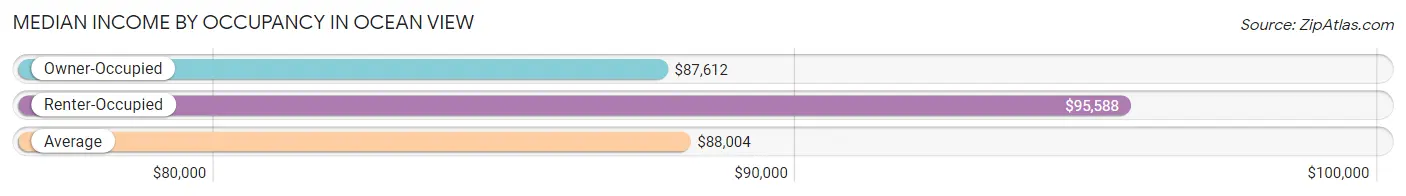
| Occupancy Type | # Households | Median Income |
| Owner-Occupied | 1,201 (94.1%) | $87,612 |
| Renter-Occupied | 76 (5.9%) | $95,588 |
| Average | 1,277 (100.0%) | $88,004 |
Occupancy by Householder Income Bracket in Ocean View
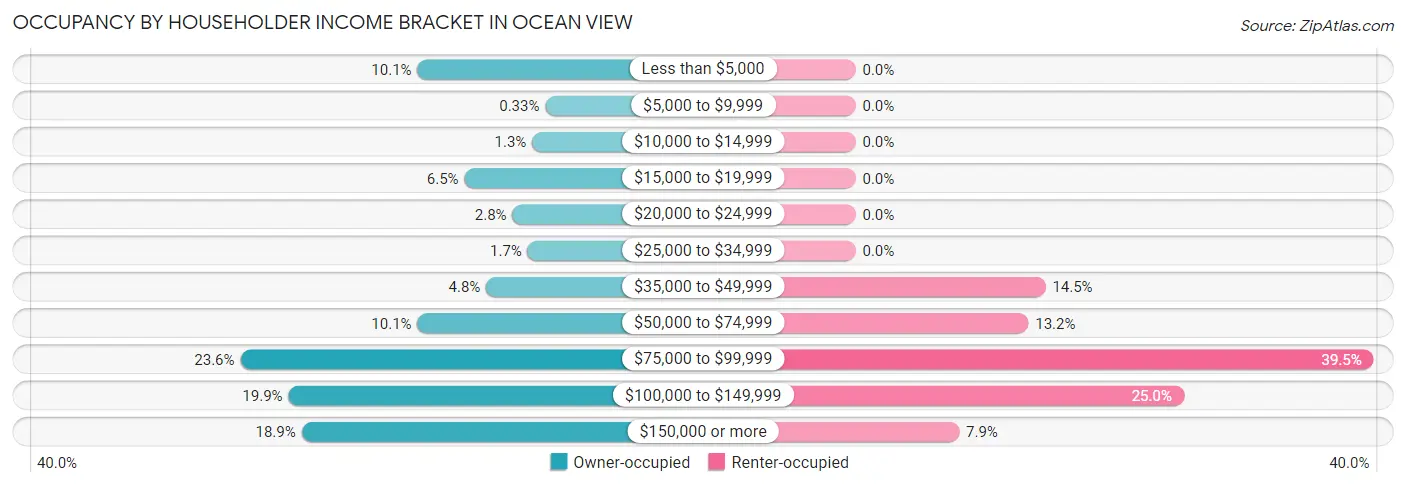
| Income Bracket | Owner-occupied | Renter-occupied |
| Less than $5,000 | 121 (10.1%) | 0 (0.0%) |
| $5,000 to $9,999 | 4 (0.3%) | 0 (0.0%) |
| $10,000 to $14,999 | 16 (1.3%) | 0 (0.0%) |
| $15,000 to $19,999 | 78 (6.5%) | 0 (0.0%) |
| $20,000 to $24,999 | 34 (2.8%) | 0 (0.0%) |
| $25,000 to $34,999 | 20 (1.7%) | 0 (0.0%) |
| $35,000 to $49,999 | 58 (4.8%) | 11 (14.5%) |
| $50,000 to $74,999 | 121 (10.1%) | 10 (13.2%) |
| $75,000 to $99,999 | 283 (23.6%) | 30 (39.5%) |
| $100,000 to $149,999 | 239 (19.9%) | 19 (25.0%) |
| $150,000 or more | 227 (18.9%) | 6 (7.9%) |
| Total | 1,201 (100.0%) | 76 (100.0%) |
Monthly Housing Cost Tiers in Ocean View
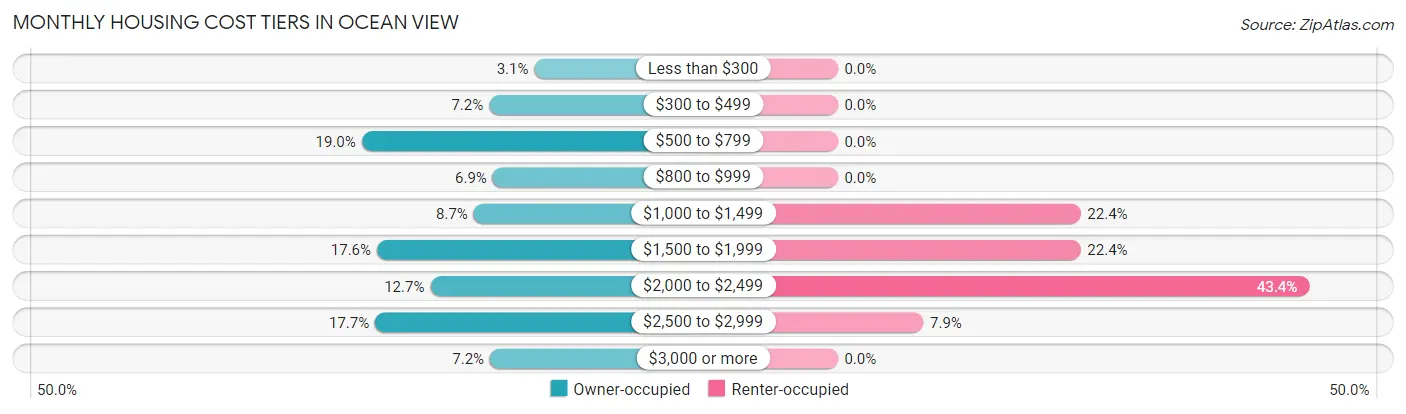
| Monthly Cost | Owner-occupied | Renter-occupied |
| Less than $300 | 37 (3.1%) | 0 (0.0%) |
| $300 to $499 | 87 (7.2%) | 0 (0.0%) |
| $500 to $799 | 228 (19.0%) | 0 (0.0%) |
| $800 to $999 | 83 (6.9%) | 0 (0.0%) |
| $1,000 to $1,499 | 104 (8.7%) | 17 (22.4%) |
| $1,500 to $1,999 | 211 (17.6%) | 17 (22.4%) |
| $2,000 to $2,499 | 152 (12.7%) | 33 (43.4%) |
| $2,500 to $2,999 | 213 (17.7%) | 6 (7.9%) |
| $3,000 or more | 86 (7.2%) | 0 (0.0%) |
| Total | 1,201 (100.0%) | 76 (100.0%) |
Physical Housing Characteristics in Ocean View
Housing Structures in Ocean View
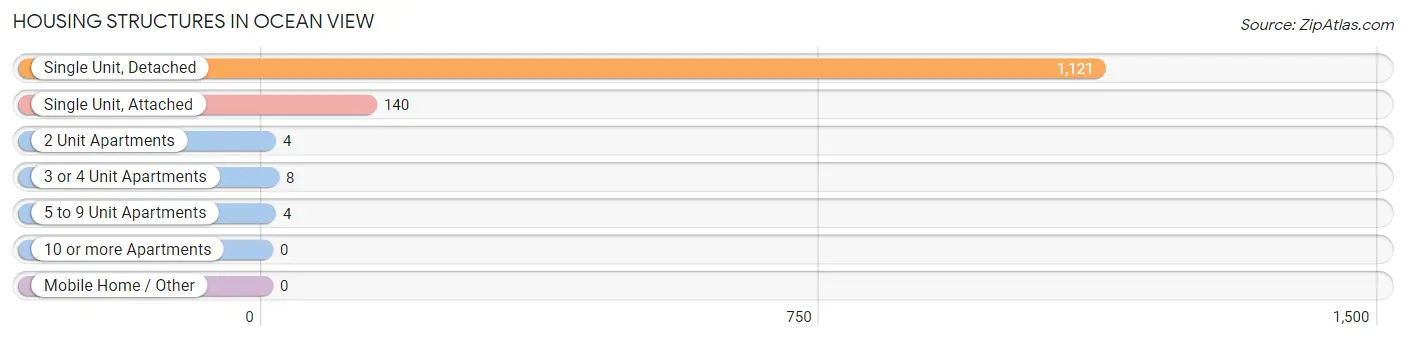
| Structure Type | # Housing Units | % Housing Units |
| Single Unit, Detached | 1,121 | 87.8% |
| Single Unit, Attached | 140 | 11.0% |
| 2 Unit Apartments | 4 | 0.3% |
| 3 or 4 Unit Apartments | 8 | 0.6% |
| 5 to 9 Unit Apartments | 4 | 0.3% |
| 10 or more Apartments | 0 | 0.0% |
| Mobile Home / Other | 0 | 0.0% |
| Total | 1,277 | 100.0% |
Housing Structures by Occupancy in Ocean View
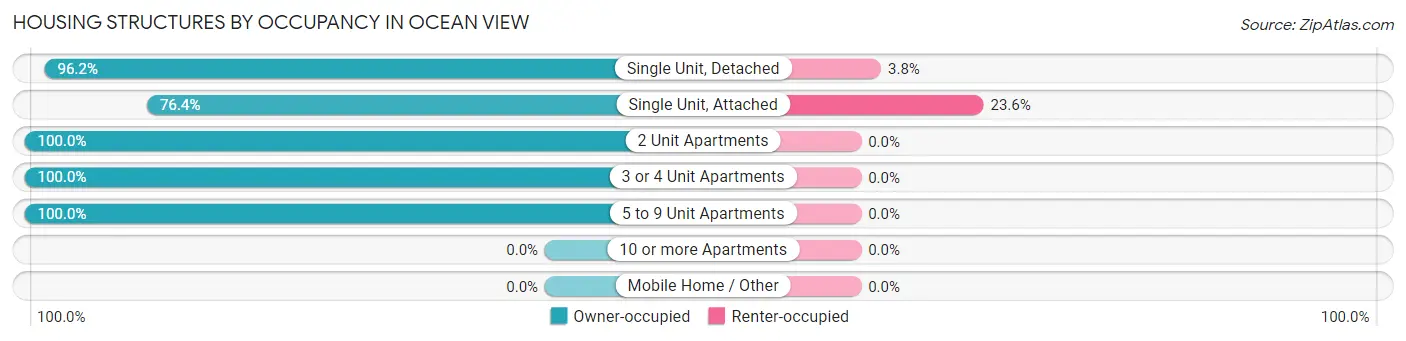
| Structure Type | Owner-occupied | Renter-occupied |
| Single Unit, Detached | 1,078 (96.2%) | 43 (3.8%) |
| Single Unit, Attached | 107 (76.4%) | 33 (23.6%) |
| 2 Unit Apartments | 4 (100.0%) | 0 (0.0%) |
| 3 or 4 Unit Apartments | 8 (100.0%) | 0 (0.0%) |
| 5 to 9 Unit Apartments | 4 (100.0%) | 0 (0.0%) |
| 10 or more Apartments | 0 (0.0%) | 0 (0.0%) |
| Mobile Home / Other | 0 (0.0%) | 0 (0.0%) |
| Total | 1,201 (94.1%) | 76 (5.9%) |
Housing Structures by Number of Rooms in Ocean View
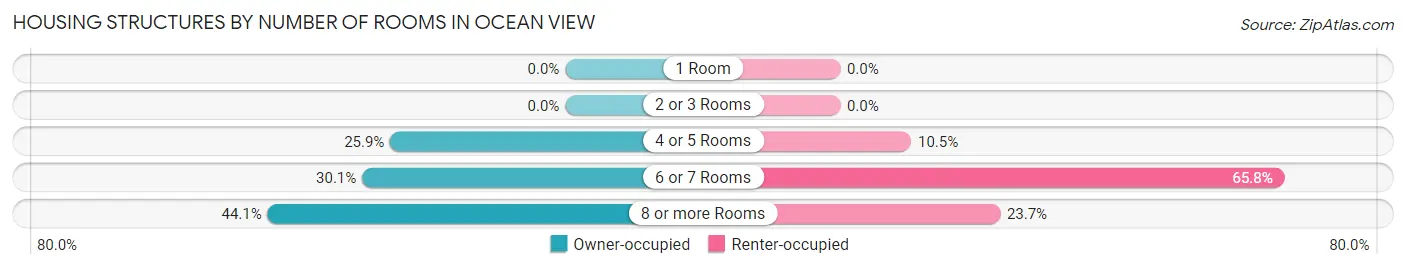
| Number of Rooms | Owner-occupied | Renter-occupied |
| 1 Room | 0 (0.0%) | 0 (0.0%) |
| 2 or 3 Rooms | 0 (0.0%) | 0 (0.0%) |
| 4 or 5 Rooms | 311 (25.9%) | 8 (10.5%) |
| 6 or 7 Rooms | 361 (30.1%) | 50 (65.8%) |
| 8 or more Rooms | 529 (44.1%) | 18 (23.7%) |
| Total | 1,201 (100.0%) | 76 (100.0%) |
Housing Structure by Heating Type in Ocean View
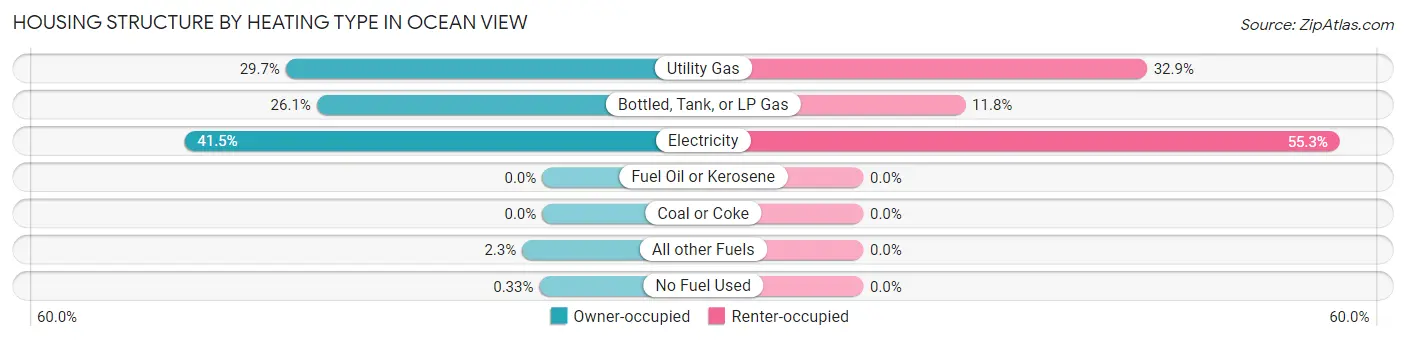
| Heating Type | Owner-occupied | Renter-occupied |
| Utility Gas | 357 (29.7%) | 25 (32.9%) |
| Bottled, Tank, or LP Gas | 314 (26.1%) | 9 (11.8%) |
| Electricity | 498 (41.5%) | 42 (55.3%) |
| Fuel Oil or Kerosene | 0 (0.0%) | 0 (0.0%) |
| Coal or Coke | 0 (0.0%) | 0 (0.0%) |
| All other Fuels | 28 (2.3%) | 0 (0.0%) |
| No Fuel Used | 4 (0.3%) | 0 (0.0%) |
| Total | 1,201 (100.0%) | 76 (100.0%) |
Household Vehicle Usage in Ocean View
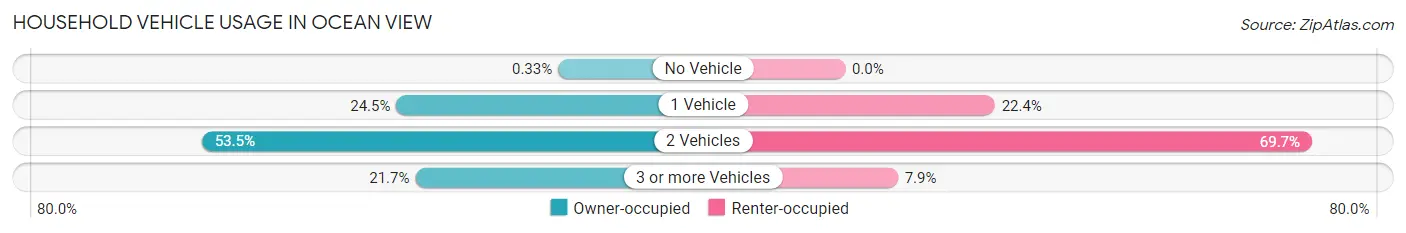
| Vehicles per Household | Owner-occupied | Renter-occupied |
| No Vehicle | 4 (0.3%) | 0 (0.0%) |
| 1 Vehicle | 294 (24.5%) | 17 (22.4%) |
| 2 Vehicles | 643 (53.5%) | 53 (69.7%) |
| 3 or more Vehicles | 260 (21.6%) | 6 (7.9%) |
| Total | 1,201 (100.0%) | 76 (100.0%) |
Real Estate & Mortgages in Ocean View
Real Estate and Mortgage Overview in Ocean View
| Characteristic | Without Mortgage | With Mortgage |
| Housing Units | 423 | 778 |
| Median Property Value | $431,600 | $440,800 |
| Median Household Income | $66,938 | $189 |
| Monthly Housing Costs | $638 | $86 |
| Real Estate Taxes | $1,759 | $11 |
Property Value by Mortgage Status in Ocean View
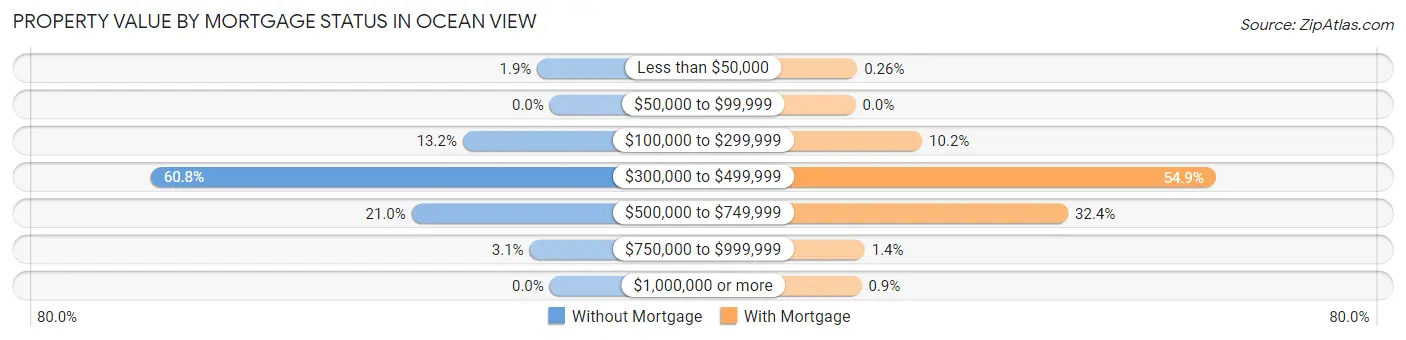
| Property Value | Without Mortgage | With Mortgage |
| Less than $50,000 | 8 (1.9%) | 2 (0.3%) |
| $50,000 to $99,999 | 0 (0.0%) | 0 (0.0%) |
| $100,000 to $299,999 | 56 (13.2%) | 79 (10.2%) |
| $300,000 to $499,999 | 257 (60.8%) | 427 (54.9%) |
| $500,000 to $749,999 | 89 (21.0%) | 252 (32.4%) |
| $750,000 to $999,999 | 13 (3.1%) | 11 (1.4%) |
| $1,000,000 or more | 0 (0.0%) | 7 (0.9%) |
| Total | 423 (100.0%) | 778 (100.0%) |
Household Income by Mortgage Status in Ocean View
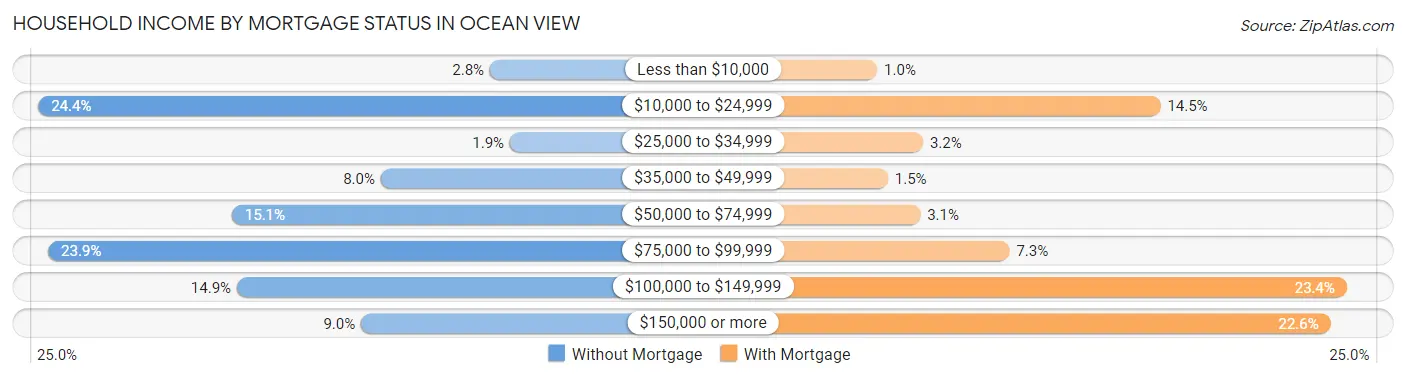
| Household Income | Without Mortgage | With Mortgage |
| Less than $10,000 | 12 (2.8%) | 8 (1.0%) |
| $10,000 to $24,999 | 103 (24.3%) | 113 (14.5%) |
| $25,000 to $34,999 | 8 (1.9%) | 25 (3.2%) |
| $35,000 to $49,999 | 34 (8.0%) | 12 (1.5%) |
| $50,000 to $74,999 | 64 (15.1%) | 24 (3.1%) |
| $75,000 to $99,999 | 101 (23.9%) | 57 (7.3%) |
| $100,000 to $149,999 | 63 (14.9%) | 182 (23.4%) |
| $150,000 or more | 38 (9.0%) | 176 (22.6%) |
| Total | 423 (100.0%) | 778 (100.0%) |
Property Value to Household Income Ratio in Ocean View
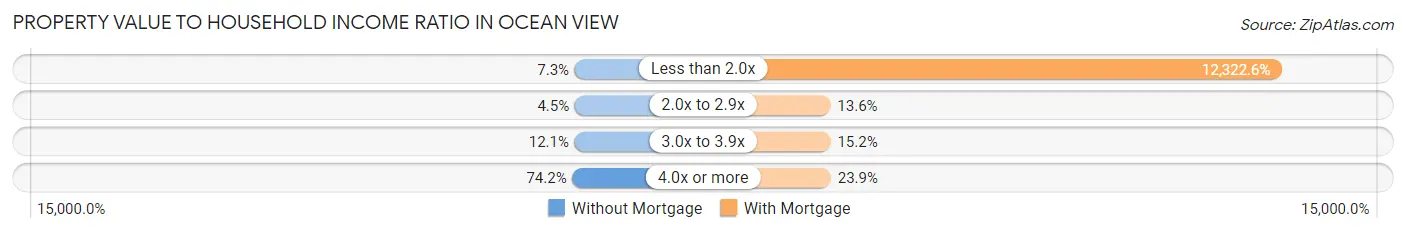
| Value-to-Income Ratio | Without Mortgage | With Mortgage |
| Less than 2.0x | 31 (7.3%) | 95,870 (12,322.6%) |
| 2.0x to 2.9x | 19 (4.5%) | 106 (13.6%) |
| 3.0x to 3.9x | 51 (12.1%) | 118 (15.2%) |
| 4.0x or more | 314 (74.2%) | 186 (23.9%) |
| Total | 423 (100.0%) | 778 (100.0%) |
Real Estate Taxes by Mortgage Status in Ocean View
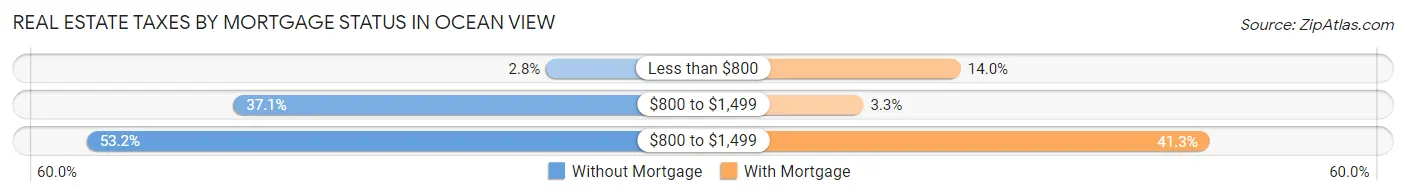
| Property Taxes | Without Mortgage | With Mortgage |
| Less than $800 | 12 (2.8%) | 109 (14.0%) |
| $800 to $1,499 | 157 (37.1%) | 26 (3.3%) |
| $800 to $1,499 | 225 (53.2%) | 321 (41.3%) |
| Total | 423 (100.0%) | 778 (100.0%) |
Health & Disability in Ocean View
Health Insurance Coverage by Age in Ocean View
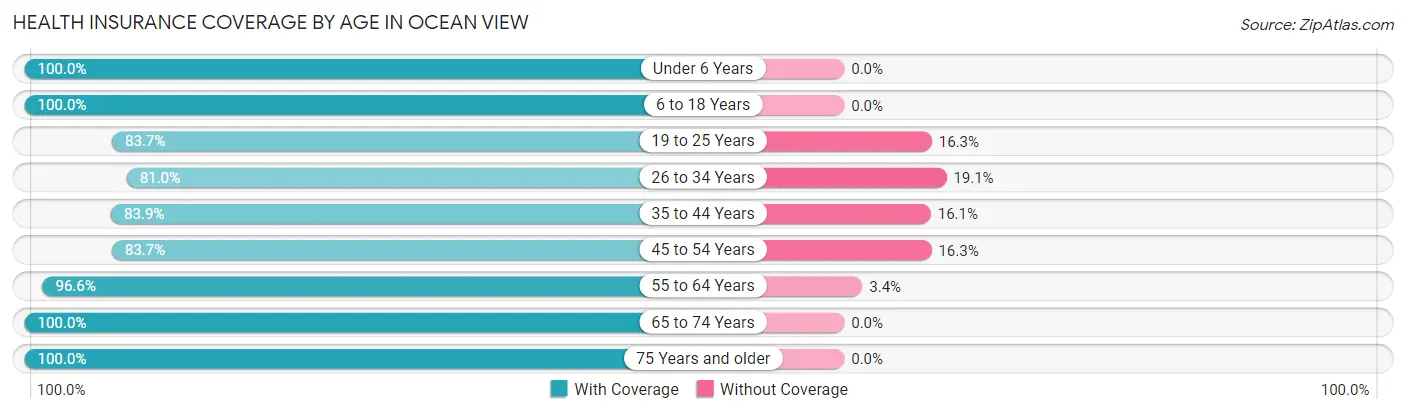
| Age Bracket | With Coverage | Without Coverage |
| Under 6 Years | 49 (100.0%) | 0 (0.0%) |
| 6 to 18 Years | 213 (100.0%) | 0 (0.0%) |
| 19 to 25 Years | 123 (83.7%) | 24 (16.3%) |
| 26 to 34 Years | 119 (80.9%) | 28 (19.1%) |
| 35 to 44 Years | 78 (83.9%) | 15 (16.1%) |
| 45 to 54 Years | 103 (83.7%) | 20 (16.3%) |
| 55 to 64 Years | 604 (96.6%) | 21 (3.4%) |
| 65 to 74 Years | 564 (100.0%) | 0 (0.0%) |
| 75 Years and older | 699 (100.0%) | 0 (0.0%) |
| Total | 2,552 (95.9%) | 108 (4.1%) |
Health Insurance Coverage by Citizenship Status in Ocean View
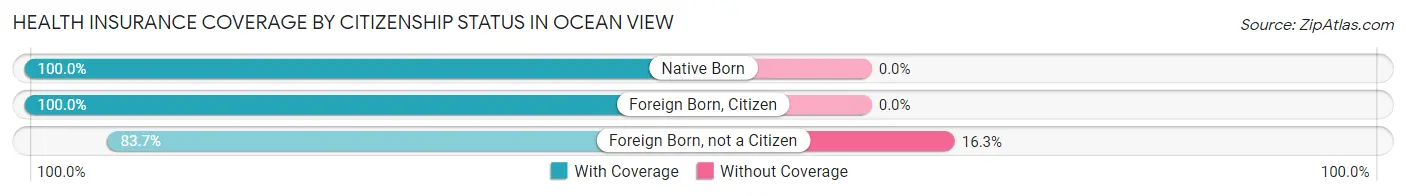
| Citizenship Status | With Coverage | Without Coverage |
| Native Born | 49 (100.0%) | 0 (0.0%) |
| Foreign Born, Citizen | 213 (100.0%) | 0 (0.0%) |
| Foreign Born, not a Citizen | 123 (83.7%) | 24 (16.3%) |
Health Insurance Coverage by Household Income in Ocean View
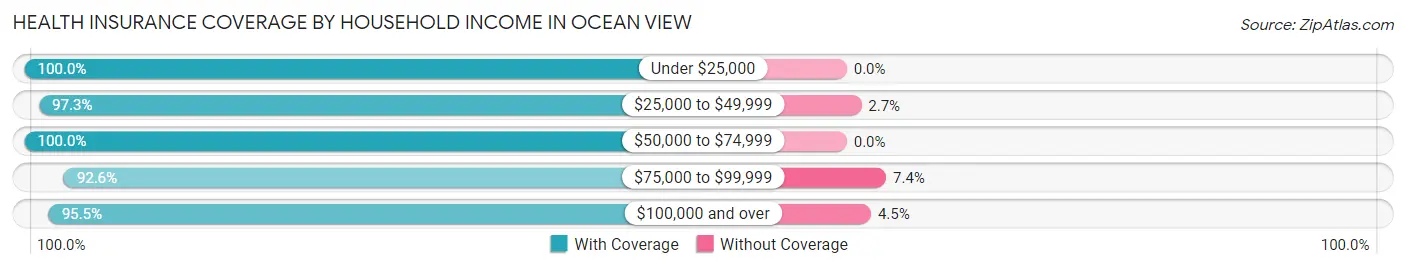
| Household Income | With Coverage | Without Coverage |
| Under $25,000 | 404 (100.0%) | 0 (0.0%) |
| $25,000 to $49,999 | 143 (97.3%) | 4 (2.7%) |
| $50,000 to $74,999 | 211 (100.0%) | 0 (0.0%) |
| $75,000 to $99,999 | 592 (92.6%) | 47 (7.4%) |
| $100,000 and over | 1,202 (95.5%) | 57 (4.5%) |
Public vs Private Health Insurance Coverage by Age in Ocean View
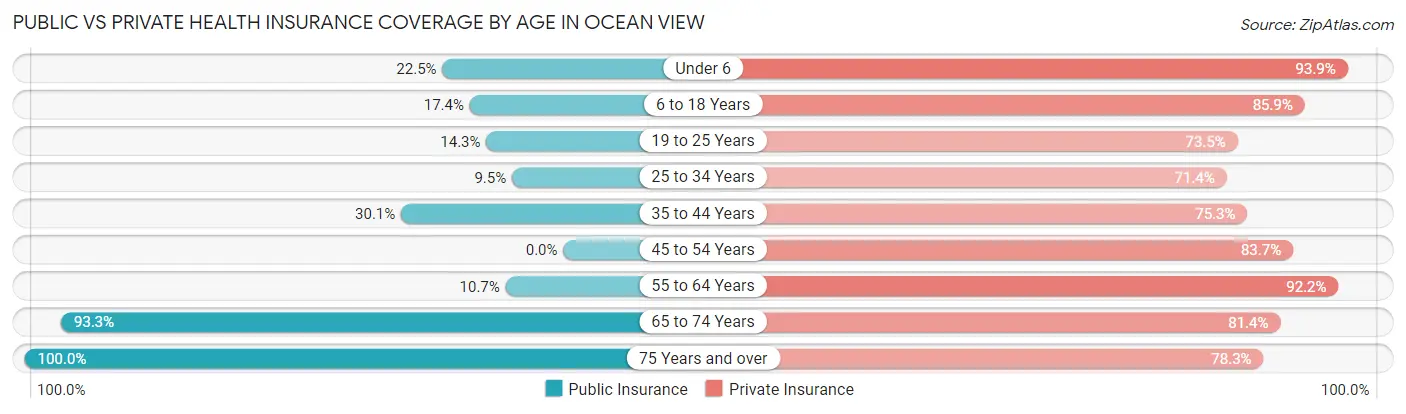
| Age Bracket | Public Insurance | Private Insurance |
| Under 6 | 11 (22.5%) | 46 (93.9%) |
| 6 to 18 Years | 37 (17.4%) | 183 (85.9%) |
| 19 to 25 Years | 21 (14.3%) | 108 (73.5%) |
| 25 to 34 Years | 14 (9.5%) | 105 (71.4%) |
| 35 to 44 Years | 28 (30.1%) | 70 (75.3%) |
| 45 to 54 Years | 0 (0.0%) | 103 (83.7%) |
| 55 to 64 Years | 67 (10.7%) | 576 (92.2%) |
| 65 to 74 Years | 526 (93.3%) | 459 (81.4%) |
| 75 Years and over | 699 (100.0%) | 547 (78.2%) |
| Total | 1,403 (52.7%) | 2,197 (82.6%) |
Disability Status by Sex by Age in Ocean View
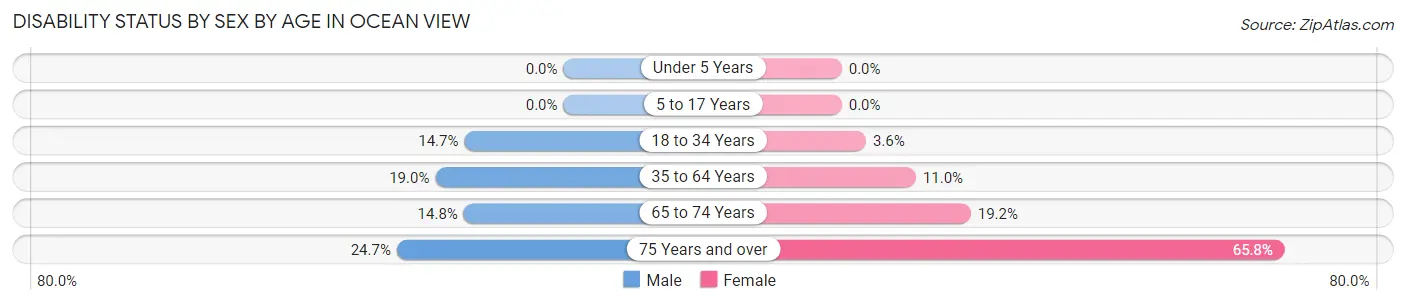
| Age Bracket | Male | Female |
| Under 5 Years | 0 (0.0%) | 0 (0.0%) |
| 5 to 17 Years | 0 (0.0%) | 0 (0.0%) |
| 18 to 34 Years | 20 (14.7%) | 6 (3.6%) |
| 35 to 64 Years | 58 (19.0%) | 59 (11.0%) |
| 65 to 74 Years | 41 (14.8%) | 55 (19.2%) |
| 75 Years and over | 71 (24.7%) | 271 (65.8%) |
Disability Class by Sex by Age in Ocean View
Disability Class: Hearing Difficulty
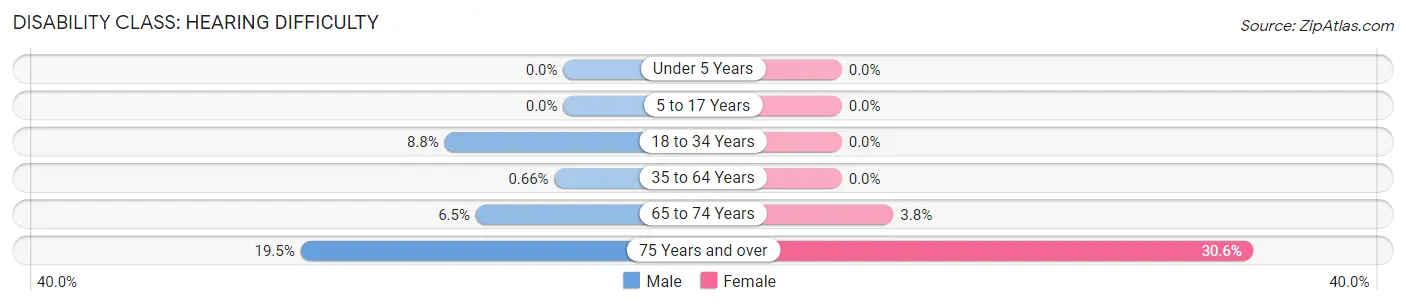
| Age Bracket | Male | Female |
| Under 5 Years | 0 (0.0%) | 0 (0.0%) |
| 5 to 17 Years | 0 (0.0%) | 0 (0.0%) |
| 18 to 34 Years | 12 (8.8%) | 0 (0.0%) |
| 35 to 64 Years | 2 (0.7%) | 0 (0.0%) |
| 65 to 74 Years | 18 (6.5%) | 11 (3.8%) |
| 75 Years and over | 56 (19.5%) | 126 (30.6%) |
Disability Class: Vision Difficulty
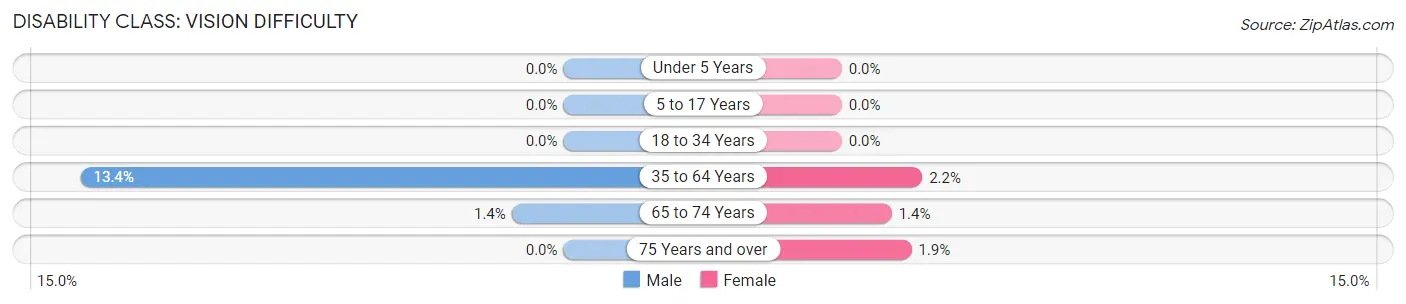
| Age Bracket | Male | Female |
| Under 5 Years | 0 (0.0%) | 0 (0.0%) |
| 5 to 17 Years | 0 (0.0%) | 0 (0.0%) |
| 18 to 34 Years | 0 (0.0%) | 0 (0.0%) |
| 35 to 64 Years | 41 (13.4%) | 12 (2.2%) |
| 65 to 74 Years | 4 (1.4%) | 4 (1.4%) |
| 75 Years and over | 0 (0.0%) | 8 (1.9%) |
Disability Class: Cognitive Difficulty
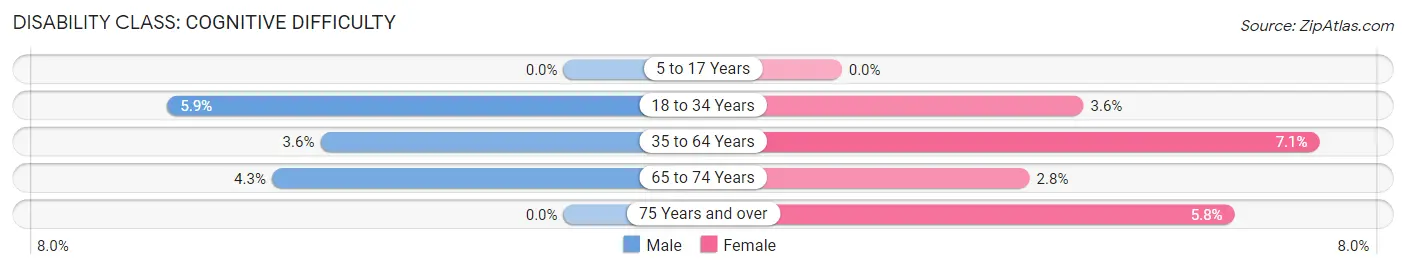
| Age Bracket | Male | Female |
| 5 to 17 Years | 0 (0.0%) | 0 (0.0%) |
| 18 to 34 Years | 8 (5.9%) | 6 (3.6%) |
| 35 to 64 Years | 11 (3.6%) | 38 (7.1%) |
| 65 to 74 Years | 12 (4.3%) | 8 (2.8%) |
| 75 Years and over | 0 (0.0%) | 24 (5.8%) |
Disability Class: Ambulatory Difficulty
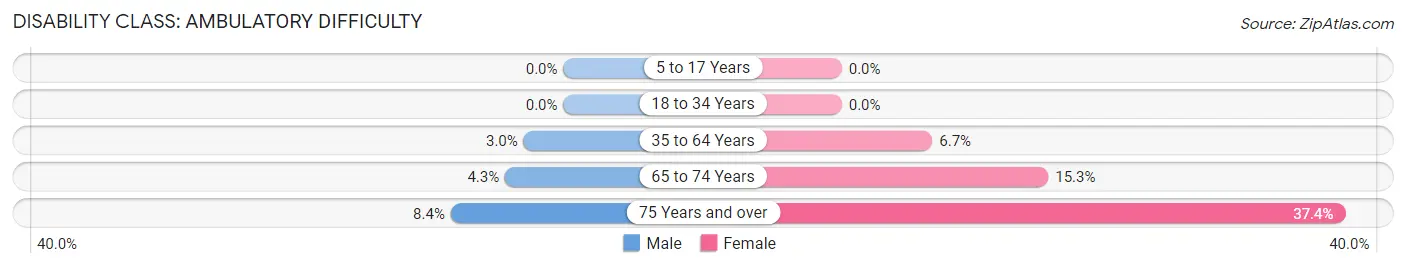
| Age Bracket | Male | Female |
| 5 to 17 Years | 0 (0.0%) | 0 (0.0%) |
| 18 to 34 Years | 0 (0.0%) | 0 (0.0%) |
| 35 to 64 Years | 9 (2.9%) | 36 (6.7%) |
| 65 to 74 Years | 12 (4.3%) | 44 (15.3%) |
| 75 Years and over | 24 (8.4%) | 154 (37.4%) |
Disability Class: Self-Care Difficulty
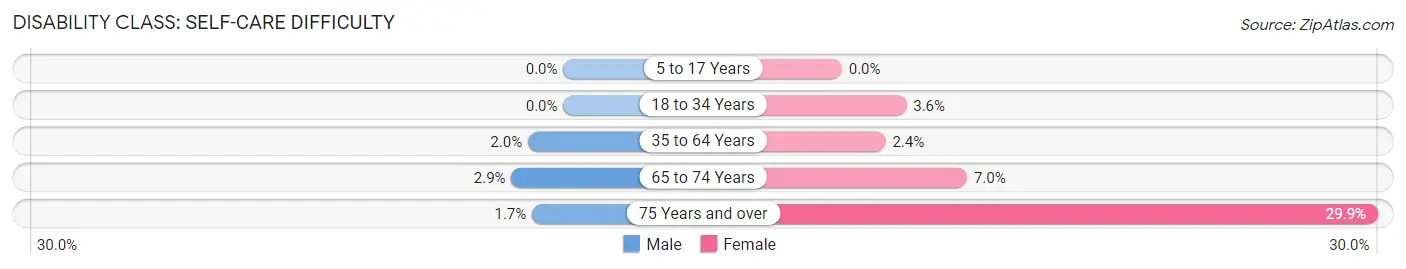
| Age Bracket | Male | Female |
| 5 to 17 Years | 0 (0.0%) | 0 (0.0%) |
| 18 to 34 Years | 0 (0.0%) | 6 (3.6%) |
| 35 to 64 Years | 6 (2.0%) | 13 (2.4%) |
| 65 to 74 Years | 8 (2.9%) | 20 (7.0%) |
| 75 Years and over | 5 (1.7%) | 123 (29.8%) |
Technology Access in Ocean View
Computing Device Access in Ocean View
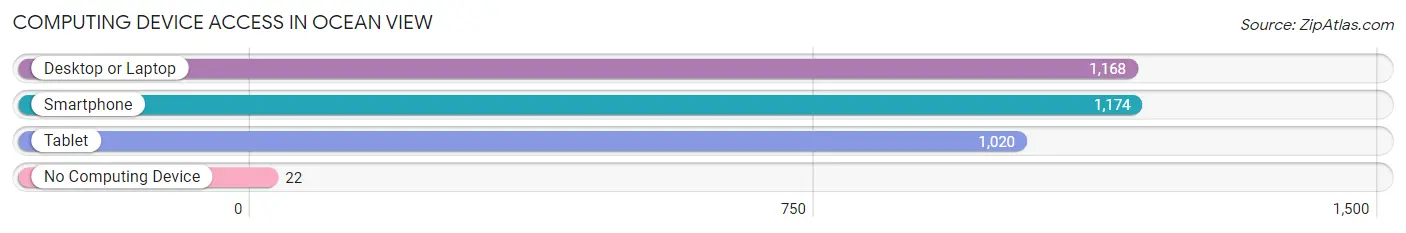
| Device Type | # Households | % Households |
| Desktop or Laptop | 1,168 | 91.5% |
| Smartphone | 1,174 | 91.9% |
| Tablet | 1,020 | 79.9% |
| No Computing Device | 22 | 1.7% |
| Total | 1,277 | 100.0% |
Internet Access in Ocean View
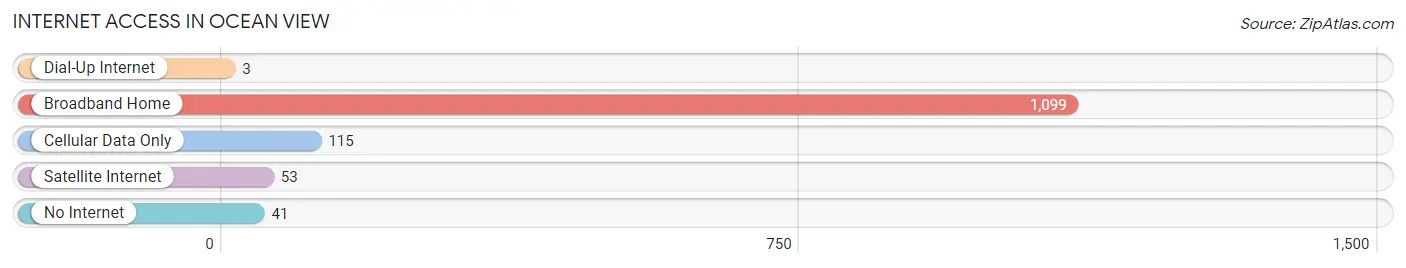
| Internet Type | # Households | % Households |
| Dial-Up Internet | 3 | 0.2% |
| Broadband Home | 1,099 | 86.1% |
| Cellular Data Only | 115 | 9.0% |
| Satellite Internet | 53 | 4.2% |
| No Internet | 41 | 3.2% |
| Total | 1,277 | 100.0% |
Ocean View Summary
View, Delaware is a small town located in Sussex County, Delaware. It is situated on the Atlantic Ocean, just south of Rehoboth Beach. The town has a population of approximately 1,500 people and is a popular tourist destination.
Geography
Ocean View is located in the coastal plain region of Delaware, which is characterized by flat terrain and sandy soils. The town is situated on the Atlantic Ocean, just south of Rehoboth Beach. The town is bordered by the Indian River to the north and the Assawoman Bay to the south. The town is located approximately 10 miles south of the state capital, Dover.
Climate
Ocean View has a humid subtropical climate, with hot, humid summers and mild winters. The average annual temperature is around 60°F, with an average high of around 80°F in the summer and an average low of around 40°F in the winter. The town receives an average of 45 inches of precipitation per year, with most of it falling in the summer months.
Economy
The economy of Ocean View is largely based on tourism. The town is a popular destination for beachgoers, and there are numerous hotels, restaurants, and other businesses catering to tourists. The town also has a small fishing industry, with several commercial fishing boats operating out of the harbor.
Demographics
As of the 2010 census, the population of Ocean View was 1,541. The racial makeup of the town was 94.3% White, 2.2% African American, 0.7% Native American, 0.7% Asian, 0.2% Pacific Islander, 0.7% from other races, and 1.2% from two or more races. Hispanic or Latino of any race were 2.2% of the population.
The median household income in Ocean View was $50,938, and the median family income was $60,938. The per capita income for the town was $25,938. About 8.3% of families and 10.2% of the population were below the poverty line, including 14.3% of those under age 18 and 5.2% of those age 65 or over.
Conclusion
Ocean View, Delaware is a small town located on the Atlantic Ocean, just south of Rehoboth Beach. The town has a population of approximately 1,500 people and is a popular tourist destination. The economy of Ocean View is largely based on tourism, with numerous hotels, restaurants, and other businesses catering to tourists. The town also has a small fishing industry. The population of Ocean View is predominantly White, with a small percentage of African American, Native American, Asian, and Pacific Islander residents. The median household income in Ocean View is $50,938, and the per capita income is $25,938.
Common Questions
What is Per Capita Income in Ocean View?
Per Capita income in Ocean View is $46,215.
What is the Median Family Income in Ocean View?
Median Family Income in Ocean View is $89,736.
What is the Median Household income in Ocean View?
Median Household Income in Ocean View is $88,004.
What is Income or Wage Gap in Ocean View?
Income or Wage Gap in Ocean View is 43.8%.
Women in Ocean View earn 56.2 cents for every dollar earned by a man.
What is Family Income Deficit in Ocean View?
Family Income Deficit in Ocean View is $14,564.
Families that are below poverty line in Ocean View earn $14,564 less on average than the poverty threshold level.
What is Inequality or Gini Index in Ocean View?
Inequality or Gini Index in Ocean View is 0.42.
What is the Total Population of Ocean View?
Total Population of Ocean View is 2,660.
What is the Total Male Population of Ocean View?
Total Male Population of Ocean View is 1,139.
What is the Total Female Population of Ocean View?
Total Female Population of Ocean View is 1,521.
What is the Ratio of Males per 100 Females in Ocean View?
There are 74.88 Males per 100 Females in Ocean View.
What is the Ratio of Females per 100 Males in Ocean View?
There are 133.54 Females per 100 Males in Ocean View.
What is the Median Population Age in Ocean View?
Median Population Age in Ocean View is 63.8 Years.
What is the Average Family Size in Ocean View
Average Family Size in Ocean View is 2.3 People.
What is the Average Household Size in Ocean View
Average Household Size in Ocean View is 2.1 People.
How Large is the Labor Force in Ocean View?
There are 923 People in the Labor Forcein in Ocean View.
What is the Percentage of People in the Labor Force in Ocean View?
38.2% of People are in the Labor Force in Ocean View.
What is the Unemployment Rate in Ocean View?
Unemployment Rate in Ocean View is 1.5%.