Bridgeville, DE Map & Demographics
Bridgeville Map
Bridgeville Overview
$42,044
PER CAPITA INCOME
$76,295
AVG FAMILY INCOME
$61,523
AVG HOUSEHOLD INCOME
11.4%
WAGE / INCOME GAP [ % ]
88.6¢/ $1
WAGE / INCOME GAP [ $ ]
0.46
INEQUALITY / GINI INDEX
2,590
TOTAL POPULATION
1,275
MALE POPULATION
1,315
FEMALE POPULATION
96.96
MALES / 100 FEMALES
103.14
FEMALES / 100 MALES
57.3
MEDIAN AGE
2.6
AVG FAMILY SIZE
2.3
AVG HOUSEHOLD SIZE
873
LABOR FORCE [ PEOPLE ]
41.5%
PERCENT IN LABOR FORCE
7.6%
UNEMPLOYMENT RATE
Bridgeville Zip Codes
Bridgeville Area Codes
Income in Bridgeville
Income Overview in Bridgeville
Per Capita Income in Bridgeville is $42,044, while median incomes of families and households are $76,295 and $61,523 respectively.
| Characteristic | Number | Measure |
| Per Capita Income | 2,590 | $42,044 |
| Median Family Income | 775 | $76,295 |
| Mean Family Income | 775 | $110,251 |
| Median Household Income | 1,147 | $61,523 |
| Mean Household Income | 1,147 | $93,458 |
| Income Deficit | 775 | $0 |
| Wage / Income Gap (%) | 2,590 | 11.36% |
| Wage / Income Gap ($) | 2,590 | 88.64¢ per $1 |
| Gini / Inequality Index | 2,590 | 0.46 |
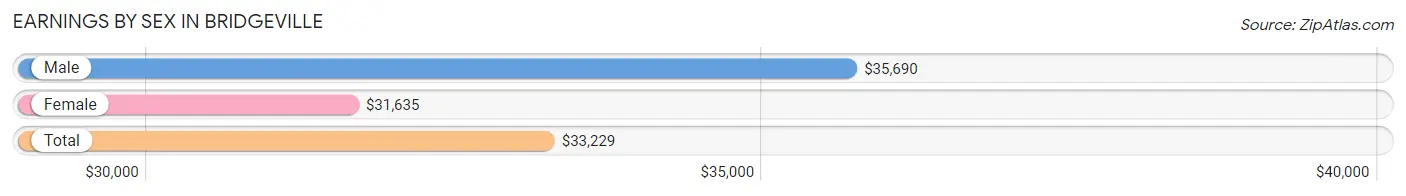
Earnings by Sex in Bridgeville
Average Earnings in Bridgeville are $33,229, $35,690 for men and $31,635 for women, a difference of 11.4%.
| Sex | Number | Average Earnings |
| Male | 502 (56.6%) | $35,690 |
| Female | 385 (43.4%) | $31,635 |
| Total | 887 (100.0%) | $33,229 |
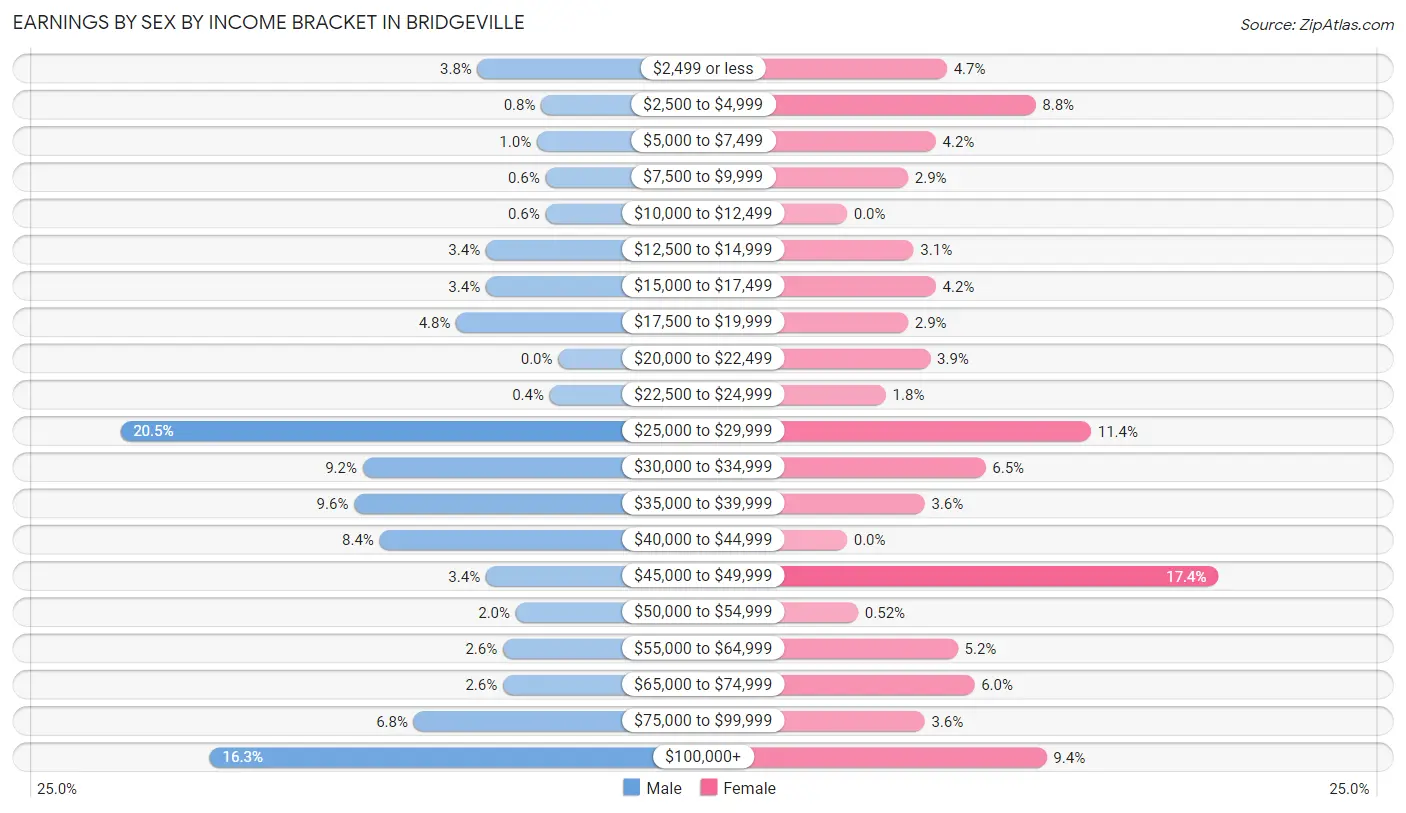
Earnings by Sex by Income Bracket in Bridgeville
The most common earnings brackets in Bridgeville are $25,000 to $29,999 for men (103 | 20.5%) and $45,000 to $49,999 for women (67 | 17.4%).
| Income | Male | Female |
| $2,499 or less | 19 (3.8%) | 18 (4.7%) |
| $2,500 to $4,999 | 4 (0.8%) | 34 (8.8%) |
| $5,000 to $7,499 | 5 (1.0%) | 16 (4.2%) |
| $7,500 to $9,999 | 3 (0.6%) | 11 (2.9%) |
| $10,000 to $12,499 | 3 (0.6%) | 0 (0.0%) |
| $12,500 to $14,999 | 17 (3.4%) | 12 (3.1%) |
| $15,000 to $17,499 | 17 (3.4%) | 16 (4.2%) |
| $17,500 to $19,999 | 24 (4.8%) | 11 (2.9%) |
| $20,000 to $22,499 | 0 (0.0%) | 15 (3.9%) |
| $22,500 to $24,999 | 2 (0.4%) | 7 (1.8%) |
| $25,000 to $29,999 | 103 (20.5%) | 44 (11.4%) |
| $30,000 to $34,999 | 46 (9.2%) | 25 (6.5%) |
| $35,000 to $39,999 | 48 (9.6%) | 14 (3.6%) |
| $40,000 to $44,999 | 42 (8.4%) | 0 (0.0%) |
| $45,000 to $49,999 | 17 (3.4%) | 67 (17.4%) |
| $50,000 to $54,999 | 10 (2.0%) | 2 (0.5%) |
| $55,000 to $64,999 | 13 (2.6%) | 20 (5.2%) |
| $65,000 to $74,999 | 13 (2.6%) | 23 (6.0%) |
| $75,000 to $99,999 | 34 (6.8%) | 14 (3.6%) |
| $100,000+ | 82 (16.3%) | 36 (9.3%) |
| Total | 502 (100.0%) | 385 (100.0%) |
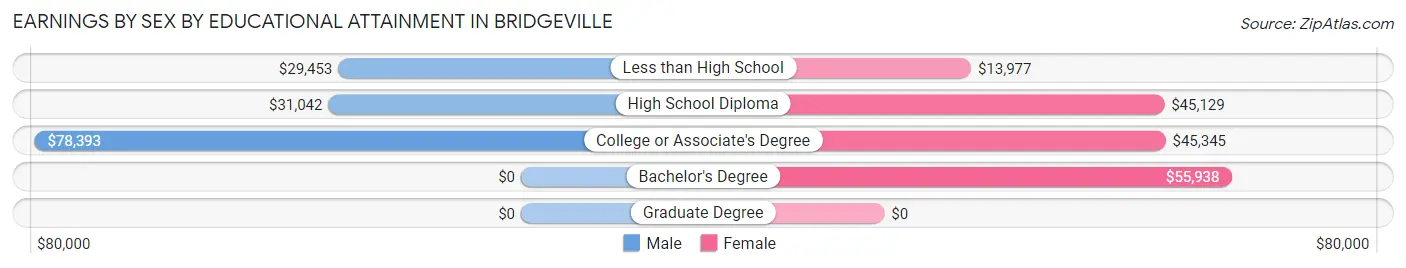
Earnings by Sex by Educational Attainment in Bridgeville
Average earnings in Bridgeville are $35,905 for men and $36,696 for women, a difference of 2.2%. Men with an educational attainment of college or associate's degree enjoy the highest average annual earnings of $78,393, while those with less than high school education earn the least with $29,453. Women with an educational attainment of bachelor's degree earn the most with the average annual earnings of $55,938, while those with less than high school education have the smallest earnings of $13,977.
| Educational Attainment | Male Income | Female Income |
| Less than High School | $29,453 | $13,977 |
| High School Diploma | $31,042 | $45,129 |
| College or Associate's Degree | $78,393 | $45,345 |
| Bachelor's Degree | - | - |
| Graduate Degree | - | - |
| Total | $35,905 | $36,696 |
Family Income in Bridgeville
Family Income Brackets in Bridgeville
According to the Bridgeville family income data, there are 141 families falling into the $75,000 to $99,999 income range, which is the most common income bracket and makes up 18.2% of all families. Conversely, the $10,000 to $14,999 income bracket is the least frequent group with only 12 families (1.5%) belonging to this category.
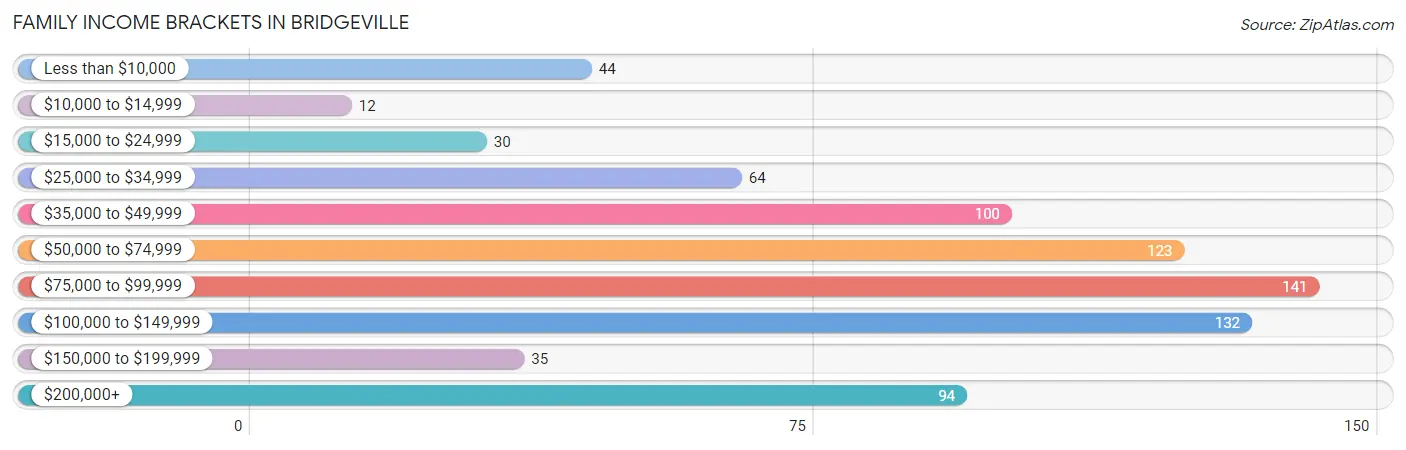
| Income Bracket | # Families | % Families |
| Less than $10,000 | 44 | 5.7% |
| $10,000 to $14,999 | 12 | 1.5% |
| $15,000 to $24,999 | 30 | 3.9% |
| $25,000 to $34,999 | 64 | 8.3% |
| $35,000 to $49,999 | 100 | 12.9% |
| $50,000 to $74,999 | 123 | 15.9% |
| $75,000 to $99,999 | 141 | 18.2% |
| $100,000 to $149,999 | 132 | 17.0% |
| $150,000 to $199,999 | 35 | 4.5% |
| $200,000+ | 94 | 12.1% |
Family Income by Famaliy Size in Bridgeville
2-person families (479 | 61.8%) account for the highest median family income in Bridgeville with $93,188 per family, while 2-person families (479 | 61.8%) have the highest median income of $46,594 per family member.
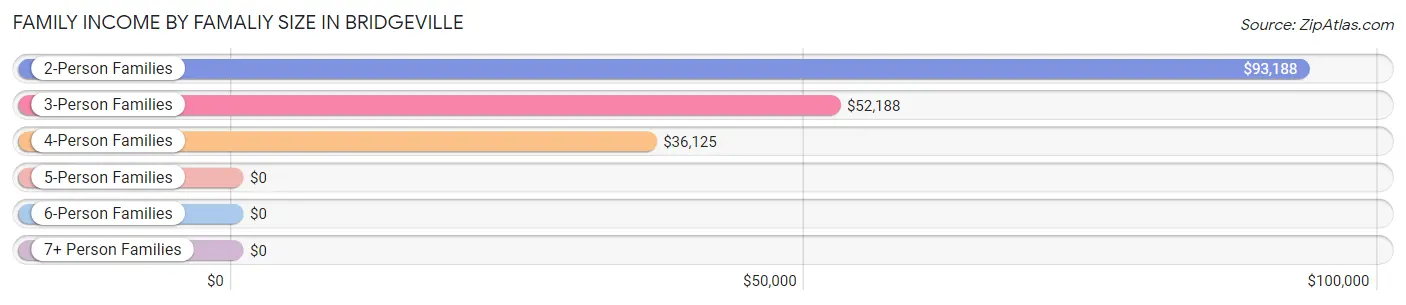
| Income Bracket | # Families | Median Income |
| 2-Person Families | 479 (61.8%) | $93,188 |
| 3-Person Families | 79 (10.2%) | $52,188 |
| 4-Person Families | 203 (26.2%) | $36,125 |
| 5-Person Families | 14 (1.8%) | $0 |
| 6-Person Families | 0 (0.0%) | $0 |
| 7+ Person Families | 0 (0.0%) | $0 |
| Total | 775 (100.0%) | $76,295 |
Family Income by Number of Earners in Bridgeville
The median family income in Bridgeville is $76,295, with families comprising 3+ earners (19) having the highest median family income of $203,173, while families with 1 earner (304) have the lowest median family income of $55,789, accounting for 2.5% and 39.2% of families, respectively.
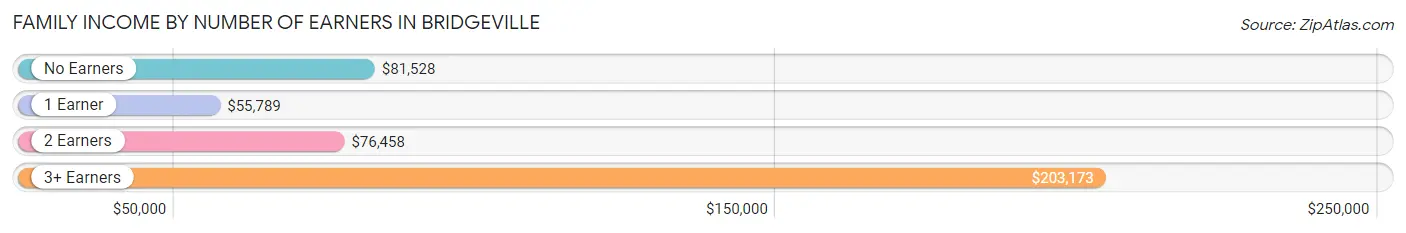
| Number of Earners | # Families | Median Income |
| No Earners | 331 (42.7%) | $81,528 |
| 1 Earner | 304 (39.2%) | $55,789 |
| 2 Earners | 121 (15.6%) | $76,458 |
| 3+ Earners | 19 (2.5%) | $203,173 |
| Total | 775 (100.0%) | $76,295 |
Household Income in Bridgeville
Household Income Brackets in Bridgeville
With 241 households falling in the category, the $50,000 to $74,999 income range is the most frequent in Bridgeville, accounting for 21.0% of all households. In contrast, only 22 households (1.9%) fall into the less than $10,000 income bracket, making it the least populous group.
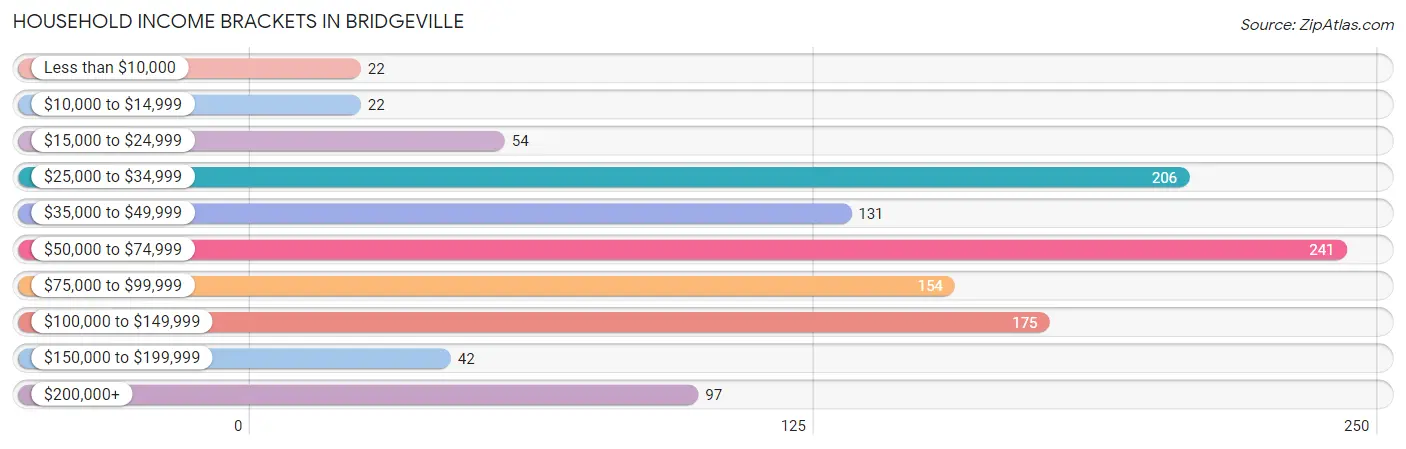
| Income Bracket | # Households | % Households |
| Less than $10,000 | 22 | 1.9% |
| $10,000 to $14,999 | 22 | 1.9% |
| $15,000 to $24,999 | 54 | 4.7% |
| $25,000 to $34,999 | 206 | 18.0% |
| $35,000 to $49,999 | 131 | 11.4% |
| $50,000 to $74,999 | 241 | 21.0% |
| $75,000 to $99,999 | 154 | 13.4% |
| $100,000 to $149,999 | 175 | 15.3% |
| $150,000 to $199,999 | 42 | 3.7% |
| $200,000+ | 97 | 8.5% |
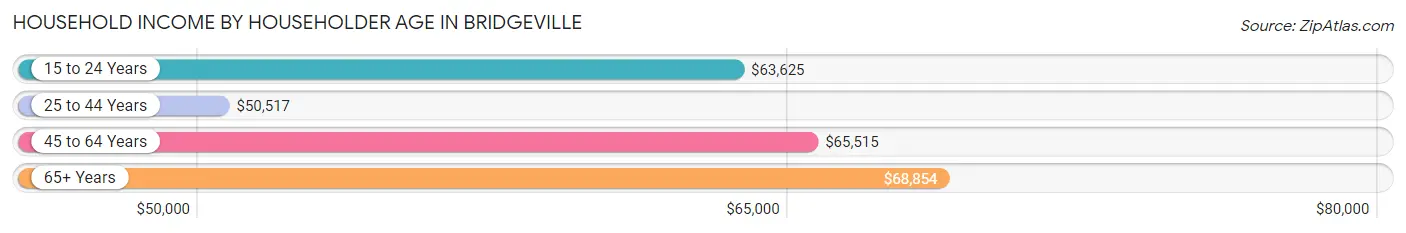
Household Income by Householder Age in Bridgeville
The median household income in Bridgeville is $61,523, with the highest median household income of $68,854 found in the 65+ years age bracket for the primary householder. A total of 671 households (58.5%) fall into this category. Meanwhile, the 25 to 44 years age bracket for the primary householder has the lowest median household income of $50,517, with 246 households (21.4%) in this group.
| Income Bracket | # Households | Median Income |
| 15 to 24 Years | 19 (1.7%) | $63,625 |
| 25 to 44 Years | 246 (21.4%) | $50,517 |
| 45 to 64 Years | 211 (18.4%) | $65,515 |
| 65+ Years | 671 (58.5%) | $68,854 |
| Total | 1,147 (100.0%) | $61,523 |
Poverty in Bridgeville
Income Below Poverty by Sex and Age in Bridgeville
With 15.1% poverty level for males and 13.8% for females among the residents of Bridgeville, 16 and 17 year old males and 12 to 14 year old females are the most vulnerable to poverty, with 3 males (100.0%) and 12 females (75.0%) in their respective age groups living below the poverty level.
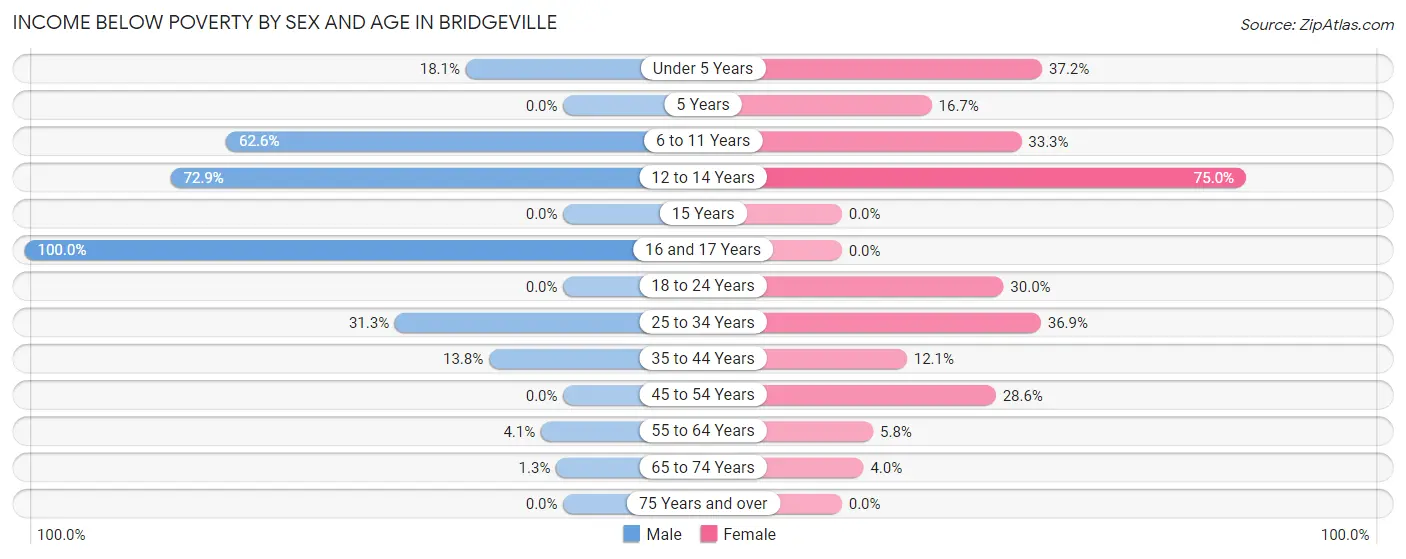
| Age Bracket | Male | Female |
| Under 5 Years | 23 (18.1%) | 29 (37.2%) |
| 5 Years | 0 (0.0%) | 2 (16.7%) |
| 6 to 11 Years | 77 (62.6%) | 10 (33.3%) |
| 12 to 14 Years | 35 (72.9%) | 12 (75.0%) |
| 15 Years | 0 (0.0%) | 0 (0.0%) |
| 16 and 17 Years | 3 (100.0%) | 0 (0.0%) |
| 18 to 24 Years | 0 (0.0%) | 24 (30.0%) |
| 25 to 34 Years | 25 (31.2%) | 41 (36.9%) |
| 35 to 44 Years | 16 (13.8%) | 17 (12.1%) |
| 45 to 54 Years | 0 (0.0%) | 16 (28.6%) |
| 55 to 64 Years | 7 (4.1%) | 9 (5.8%) |
| 65 to 74 Years | 4 (1.3%) | 18 (4.0%) |
| 75 Years and over | 0 (0.0%) | 0 (0.0%) |
| Total | 190 (15.1%) | 178 (13.8%) |
Income Above Poverty by Sex and Age in Bridgeville
According to the poverty statistics in Bridgeville, males aged 15 years and females aged 16 and 17 years are the age groups that are most secure financially, with 100.0% of males and 100.0% of females in these age groups living above the poverty line.
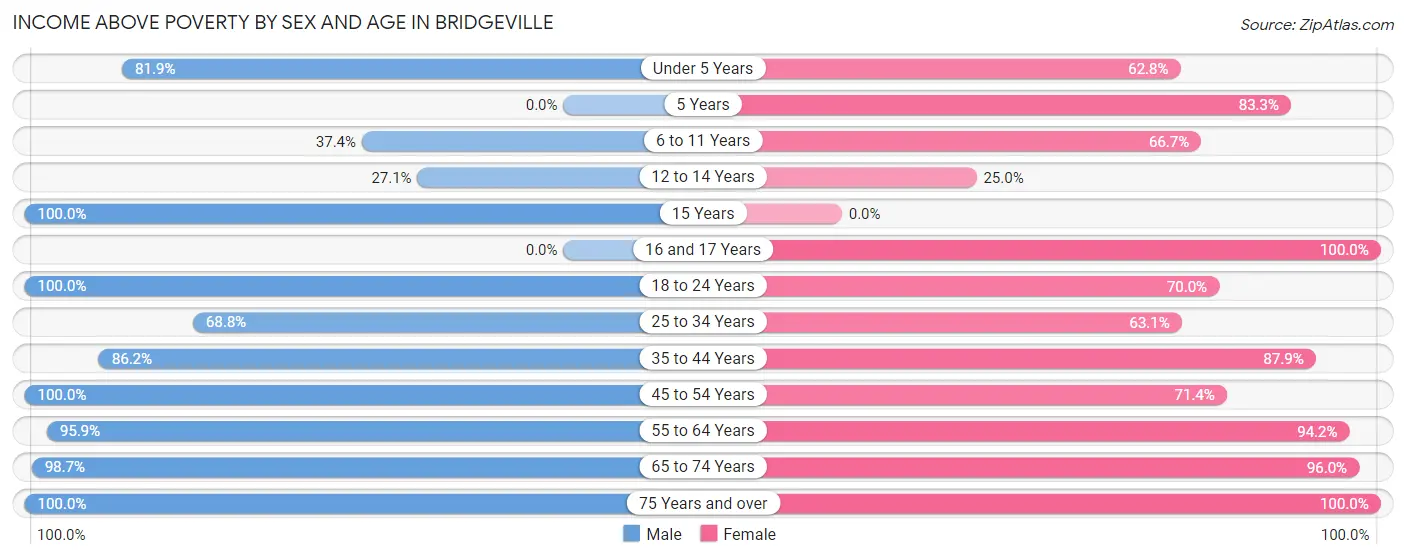
| Age Bracket | Male | Female |
| Under 5 Years | 104 (81.9%) | 49 (62.8%) |
| 5 Years | 0 (0.0%) | 10 (83.3%) |
| 6 to 11 Years | 46 (37.4%) | 20 (66.7%) |
| 12 to 14 Years | 13 (27.1%) | 4 (25.0%) |
| 15 Years | 12 (100.0%) | 0 (0.0%) |
| 16 and 17 Years | 0 (0.0%) | 27 (100.0%) |
| 18 to 24 Years | 61 (100.0%) | 56 (70.0%) |
| 25 to 34 Years | 55 (68.8%) | 70 (63.1%) |
| 35 to 44 Years | 100 (86.2%) | 124 (87.9%) |
| 45 to 54 Years | 66 (100.0%) | 40 (71.4%) |
| 55 to 64 Years | 162 (95.9%) | 146 (94.2%) |
| 65 to 74 Years | 300 (98.7%) | 430 (96.0%) |
| 75 Years and over | 145 (100.0%) | 141 (100.0%) |
| Total | 1,064 (84.9%) | 1,117 (86.3%) |
Income Below Poverty Among Married-Couple Families in Bridgeville
The poverty statistics for married-couple families in Bridgeville show that 2.5% or 13 of the total 531 families live below the poverty line. Families with 1 or 2 children have the highest poverty rate of 14.8%, comprising of 12 families. On the other hand, families with 3 or 4 children have the lowest poverty rate of 0.0%, which includes 0 families.
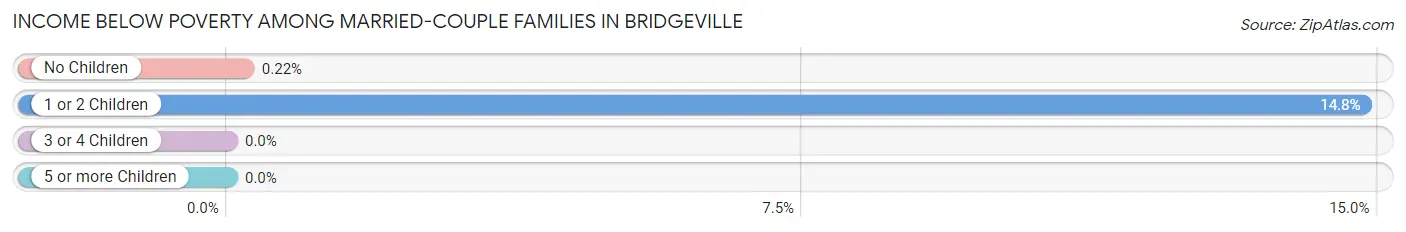
| Children | Above Poverty | Below Poverty |
| No Children | 445 (99.8%) | 1 (0.2%) |
| 1 or 2 Children | 69 (85.2%) | 12 (14.8%) |
| 3 or 4 Children | 4 (100.0%) | 0 (0.0%) |
| 5 or more Children | 0 (0.0%) | 0 (0.0%) |
| Total | 518 (97.6%) | 13 (2.5%) |
Income Below Poverty Among Single-Parent Households in Bridgeville
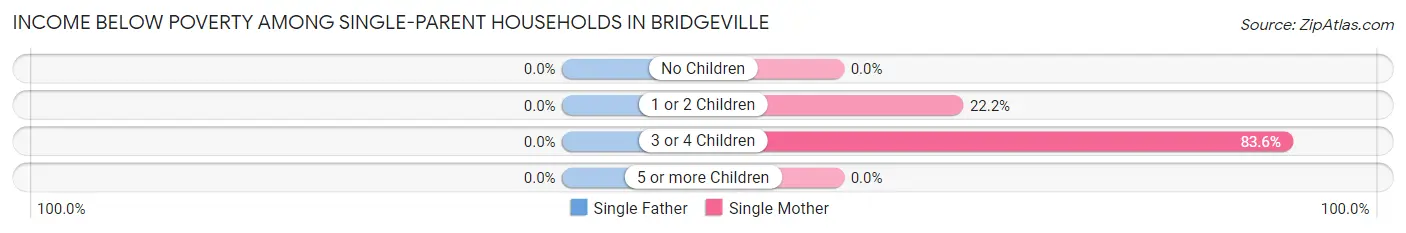
| Children | Single Father | Single Mother |
| No Children | 0 (0.0%) | 0 (0.0%) |
| 1 or 2 Children | 0 (0.0%) | 22 (22.2%) |
| 3 or 4 Children | 0 (0.0%) | 46 (83.6%) |
| 5 or more Children | 0 (0.0%) | 0 (0.0%) |
| Total | 0 (0.0%) | 68 (35.2%) |
Income Below Poverty Among Married-Couple vs Single-Parent Households in Bridgeville
The poverty data for Bridgeville shows that 13 of the married-couple family households (2.5%) and 68 of the single-parent households (27.9%) are living below the poverty level. Within the married-couple family households, those with 1 or 2 children have the highest poverty rate, with 12 households (14.8%) falling below the poverty line. Among the single-parent households, those with 3 or 4 children have the highest poverty rate, with 46 household (70.8%) living below poverty.
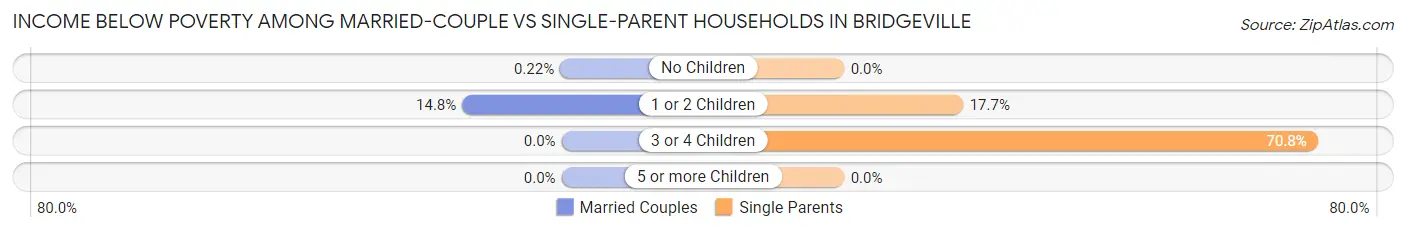
| Children | Married-Couple Families | Single-Parent Households |
| No Children | 1 (0.2%) | 0 (0.0%) |
| 1 or 2 Children | 12 (14.8%) | 22 (17.7%) |
| 3 or 4 Children | 0 (0.0%) | 46 (70.8%) |
| 5 or more Children | 0 (0.0%) | 0 (0.0%) |
| Total | 13 (2.5%) | 68 (27.9%) |
Race in Bridgeville
The most populous races in Bridgeville are White / Caucasian (1,714 | 66.2%), Black / African American (697 | 26.9%), and Hispanic or Latino (312 | 12.0%).
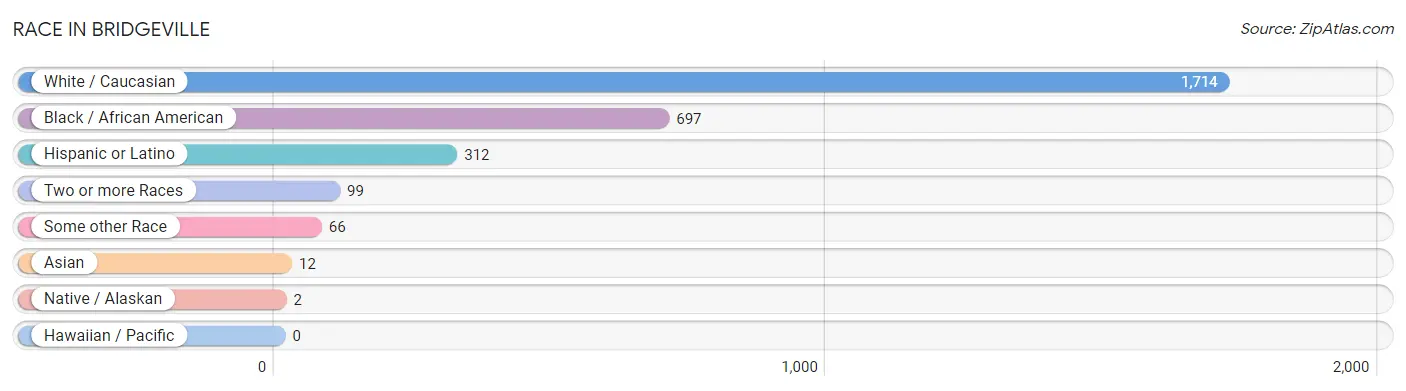
| Race | # Population | % Population |
| Asian | 12 | 0.5% |
| Black / African American | 697 | 26.9% |
| Hawaiian / Pacific | 0 | 0.0% |
| Hispanic or Latino | 312 | 12.0% |
| Native / Alaskan | 2 | 0.1% |
| White / Caucasian | 1,714 | 66.2% |
| Two or more Races | 99 | 3.8% |
| Some other Race | 66 | 2.5% |
| Total | 2,590 | 100.0% |
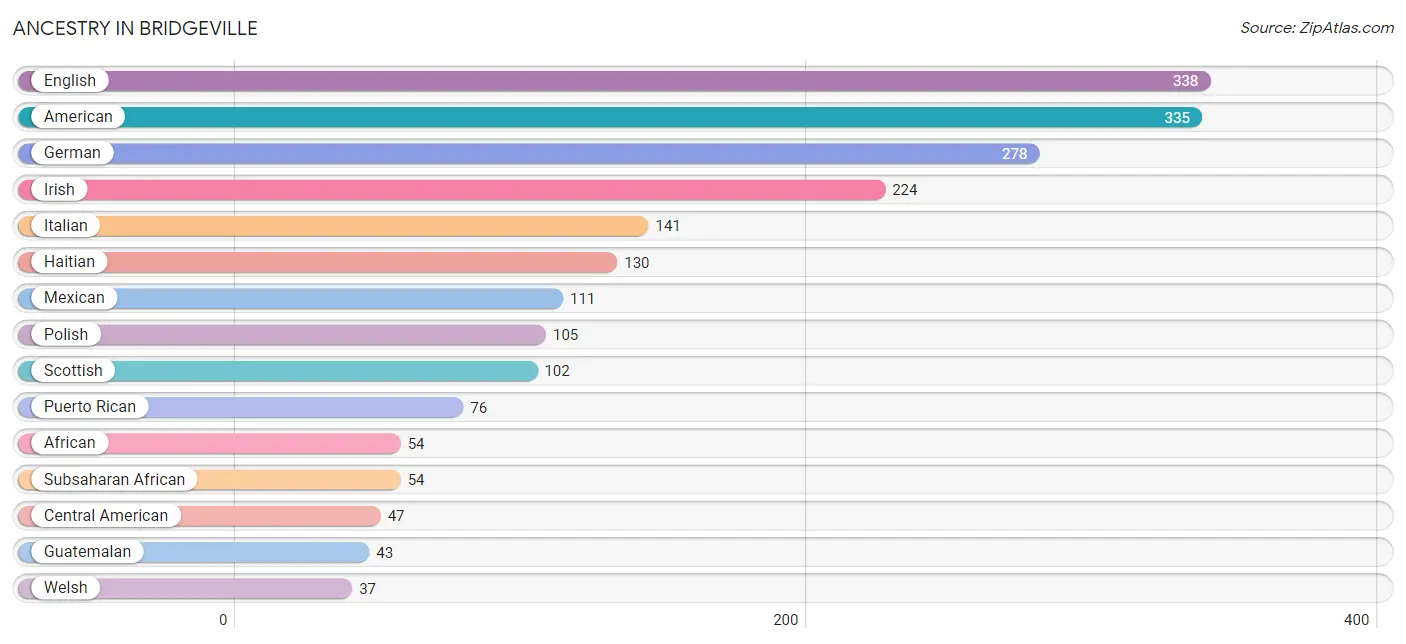
Ancestry in Bridgeville
The most populous ancestries reported in Bridgeville are English (338 | 13.1%), American (335 | 12.9%), German (278 | 10.7%), Irish (224 | 8.6%), and Italian (141 | 5.4%), together accounting for 50.8% of all Bridgeville residents.
| Ancestry | # Population | % Population |
| African | 54 | 2.1% |
| American | 335 | 12.9% |
| Arab | 10 | 0.4% |
| Austrian | 10 | 0.4% |
| British | 12 | 0.5% |
| Burmese | 3 | 0.1% |
| Central American | 47 | 1.8% |
| Cherokee | 6 | 0.2% |
| Cuban | 19 | 0.7% |
| Czech | 8 | 0.3% |
| Danish | 4 | 0.2% |
| Dominican | 9 | 0.4% |
| Dutch | 19 | 0.7% |
| Eastern European | 4 | 0.2% |
| English | 338 | 13.1% |
| European | 20 | 0.8% |
| French | 4 | 0.2% |
| French Canadian | 22 | 0.9% |
| German | 278 | 10.7% |
| Guatemalan | 43 | 1.7% |
| Haitian | 130 | 5.0% |
| Honduran | 4 | 0.2% |
| Hungarian | 8 | 0.3% |
| Irish | 224 | 8.6% |
| Italian | 141 | 5.4% |
| Korean | 6 | 0.2% |
| Latvian | 4 | 0.2% |
| Lebanese | 10 | 0.4% |
| Lithuanian | 23 | 0.9% |
| Mexican | 111 | 4.3% |
| Navajo | 3 | 0.1% |
| Norwegian | 4 | 0.2% |
| Polish | 105 | 4.1% |
| Portuguese | 14 | 0.5% |
| Puerto Rican | 76 | 2.9% |
| Russian | 27 | 1.0% |
| Scandinavian | 4 | 0.2% |
| Scotch-Irish | 17 | 0.7% |
| Scottish | 102 | 3.9% |
| Serbian | 1 | 0.0% |
| Slovak | 15 | 0.6% |
| Subsaharan African | 54 | 2.1% |
| Swedish | 14 | 0.5% |
| Swiss | 5 | 0.2% |
| Thai | 3 | 0.1% |
| Ukrainian | 8 | 0.3% |
| Welsh | 37 | 1.4% | View All 47 Rows |
Immigrants in Bridgeville
The most numerous immigrant groups reported in Bridgeville came from Latin America (165 | 6.4%), Central America (92 | 3.5%), Caribbean (73 | 2.8%), Haiti (70 | 2.7%), and Mexico (62 | 2.4%), together accounting for 17.8% of all Bridgeville residents.
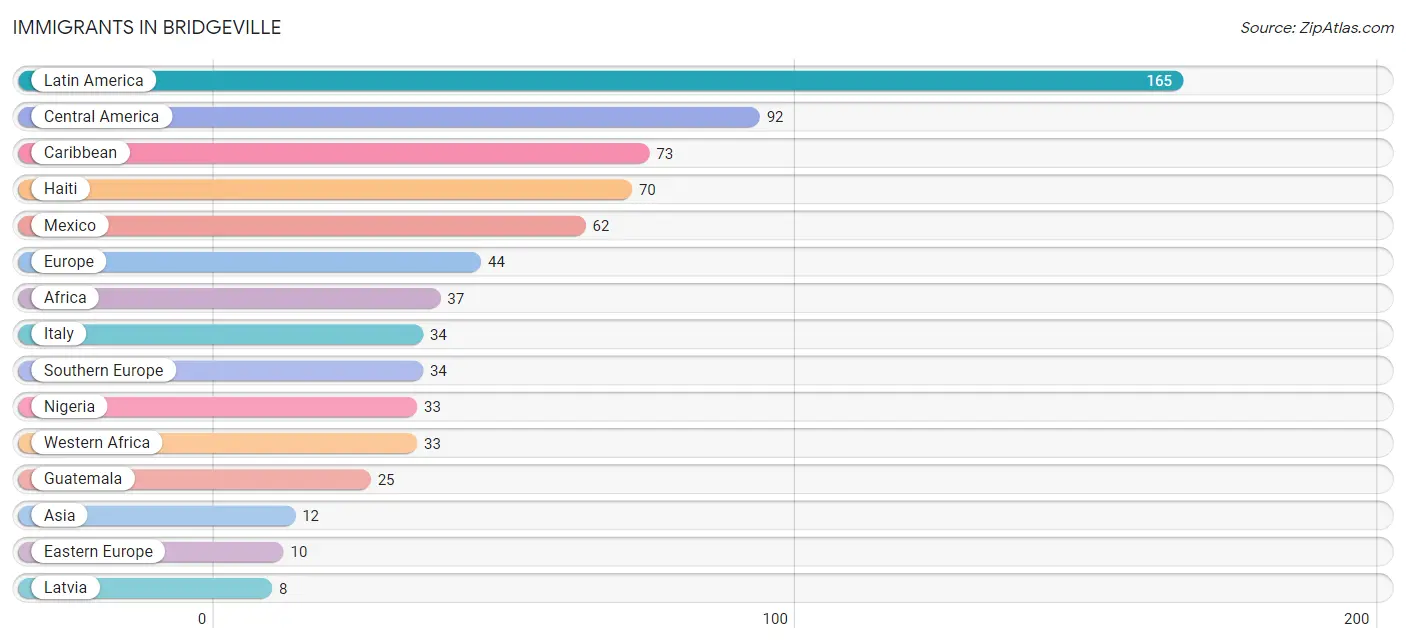
| Immigration Origin | # Population | % Population |
| Africa | 37 | 1.4% |
| Asia | 12 | 0.5% |
| Canada | 4 | 0.2% |
| Caribbean | 73 | 2.8% |
| Central America | 92 | 3.5% |
| Costa Rica | 5 | 0.2% |
| Eastern Asia | 3 | 0.1% |
| Eastern Europe | 10 | 0.4% |
| Egypt | 4 | 0.2% |
| Europe | 44 | 1.7% |
| Guatemala | 25 | 1.0% |
| Haiti | 70 | 2.7% |
| India | 3 | 0.1% |
| Italy | 34 | 1.3% |
| Korea | 3 | 0.1% |
| Latin America | 165 | 6.4% |
| Latvia | 8 | 0.3% |
| Mexico | 62 | 2.4% |
| Nigeria | 33 | 1.3% |
| Northern Africa | 4 | 0.2% |
| Philippines | 6 | 0.2% |
| Russia | 2 | 0.1% |
| South Central Asia | 3 | 0.1% |
| South Eastern Asia | 6 | 0.2% |
| Southern Europe | 34 | 1.3% |
| Trinidad and Tobago | 3 | 0.1% |
| Western Africa | 33 | 1.3% | View All 27 Rows |
Sex and Age in Bridgeville
Sex and Age in Bridgeville
The most populous age groups in Bridgeville are 70 to 74 Years (165 | 12.9%) for men and 65 to 69 Years (306 | 23.3%) for women.
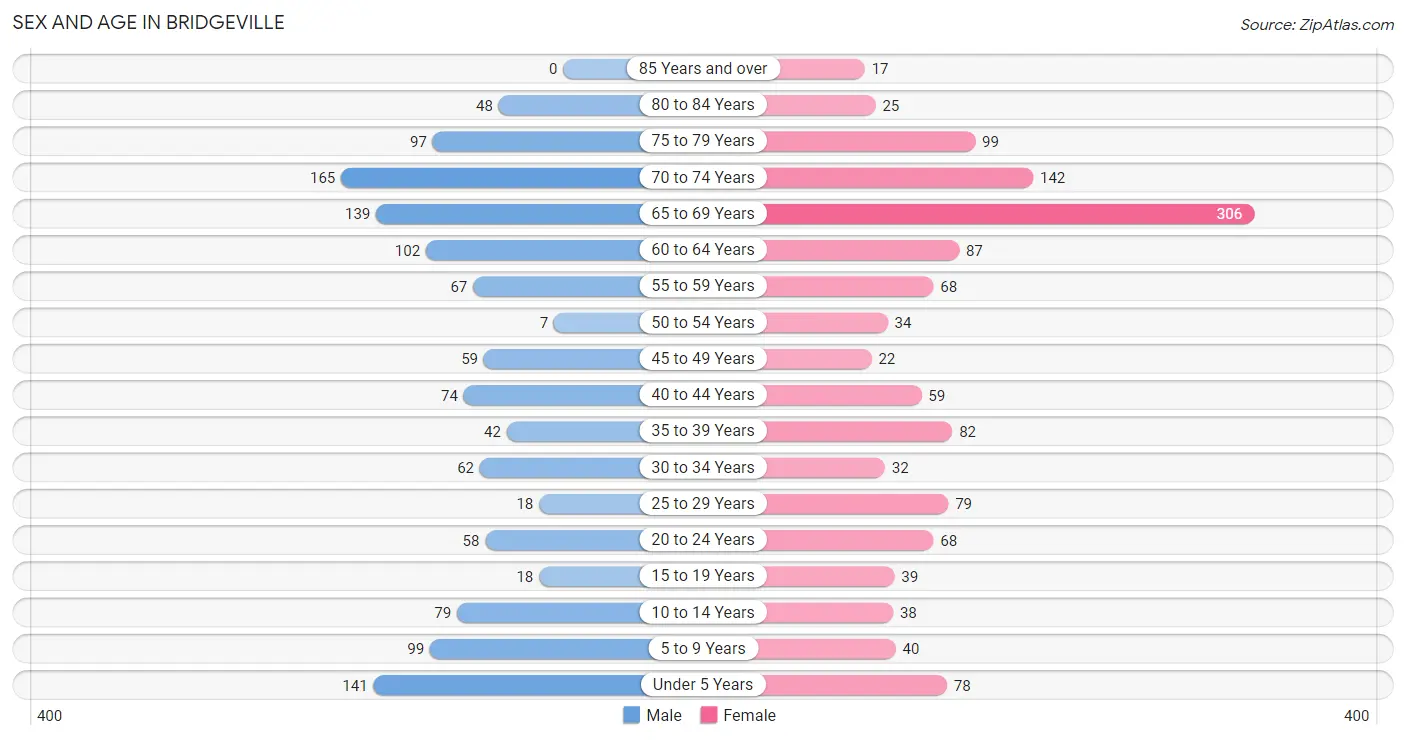
| Age Bracket | Male | Female |
| Under 5 Years | 141 (11.1%) | 78 (5.9%) |
| 5 to 9 Years | 99 (7.8%) | 40 (3.0%) |
| 10 to 14 Years | 79 (6.2%) | 38 (2.9%) |
| 15 to 19 Years | 18 (1.4%) | 39 (3.0%) |
| 20 to 24 Years | 58 (4.5%) | 68 (5.2%) |
| 25 to 29 Years | 18 (1.4%) | 79 (6.0%) |
| 30 to 34 Years | 62 (4.9%) | 32 (2.4%) |
| 35 to 39 Years | 42 (3.3%) | 82 (6.2%) |
| 40 to 44 Years | 74 (5.8%) | 59 (4.5%) |
| 45 to 49 Years | 59 (4.6%) | 22 (1.7%) |
| 50 to 54 Years | 7 (0.5%) | 34 (2.6%) |
| 55 to 59 Years | 67 (5.2%) | 68 (5.2%) |
| 60 to 64 Years | 102 (8.0%) | 87 (6.6%) |
| 65 to 69 Years | 139 (10.9%) | 306 (23.3%) |
| 70 to 74 Years | 165 (12.9%) | 142 (10.8%) |
| 75 to 79 Years | 97 (7.6%) | 99 (7.5%) |
| 80 to 84 Years | 48 (3.8%) | 25 (1.9%) |
| 85 Years and over | 0 (0.0%) | 17 (1.3%) |
| Total | 1,275 (100.0%) | 1,315 (100.0%) |
Families and Households in Bridgeville
Median Family Size in Bridgeville
The median family size in Bridgeville is 2.65 persons per family, with single male/father families (51 | 6.6%) accounting for the largest median family size of 3.08 persons per family. On the other hand, married-couple families (531 | 68.5%) represent the smallest median family size with 2.53 persons per family.
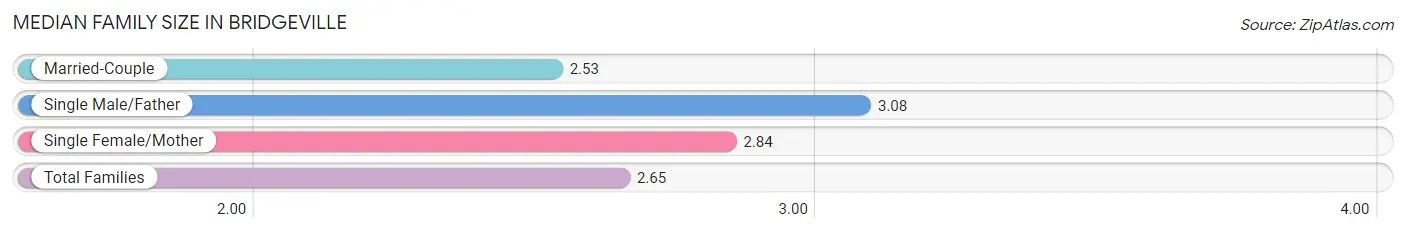
| Family Type | # Families | Family Size |
| Married-Couple | 531 (68.5%) | 2.53 |
| Single Male/Father | 51 (6.6%) | 3.08 |
| Single Female/Mother | 193 (24.9%) | 2.84 |
| Total Families | 775 (100.0%) | 2.65 |
Median Household Size in Bridgeville
The median household size in Bridgeville is 2.26 persons per household, with single male/father households (51 | 4.4%) accounting for the largest median household size of 3.51 persons per household. non-family households (372 | 32.4%) represent the smallest median household size with 1.13 persons per household.
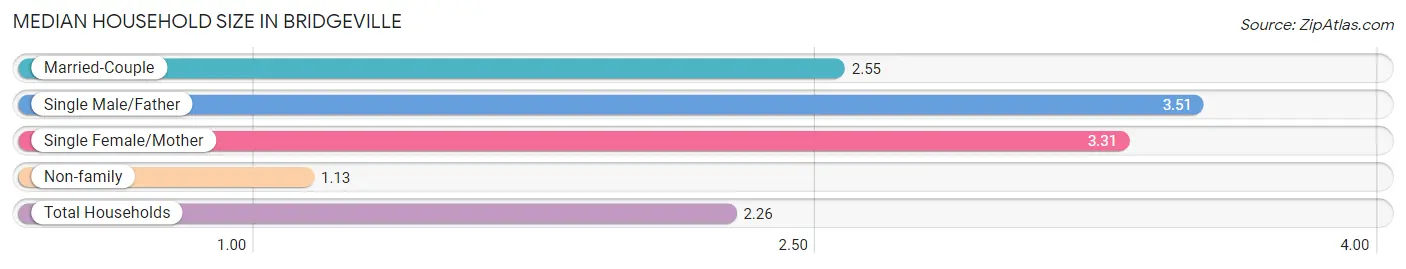
| Household Type | # Households | Household Size |
| Married-Couple | 531 (46.3%) | 2.55 |
| Single Male/Father | 51 (4.4%) | 3.51 |
| Single Female/Mother | 193 (16.8%) | 3.31 |
| Non-family | 372 (32.4%) | 1.13 |
| Total Households | 1,147 (100.0%) | 2.26 |
Household Size by Marriage Status in Bridgeville
Out of a total of 1,147 households in Bridgeville, 775 (67.6%) are family households, while 372 (32.4%) are nonfamily households. The most numerous type of family households are 2-person households, comprising 463, and the most common type of nonfamily households are 1-person households, comprising 338.
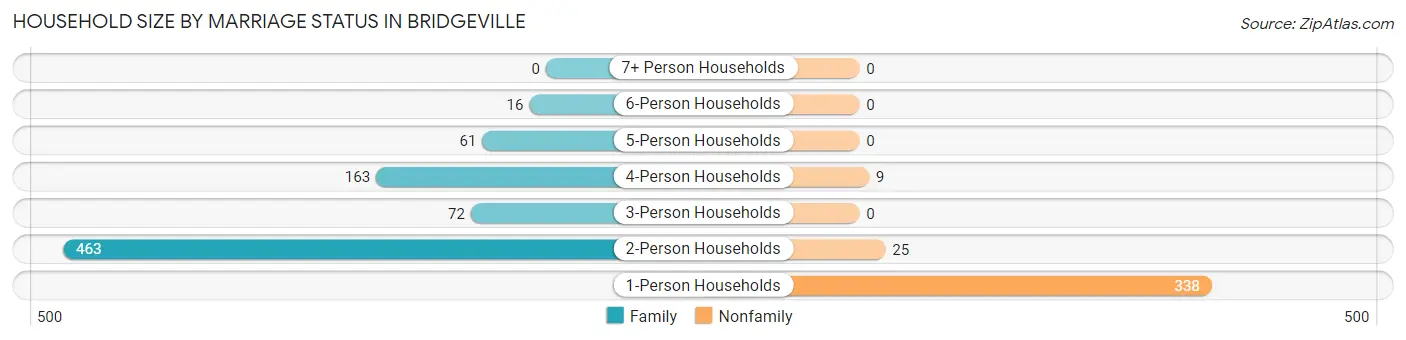
| Household Size | Family Households | Nonfamily Households |
| 1-Person Households | - | 338 (29.5%) |
| 2-Person Households | 463 (40.4%) | 25 (2.2%) |
| 3-Person Households | 72 (6.3%) | 0 (0.0%) |
| 4-Person Households | 163 (14.2%) | 9 (0.8%) |
| 5-Person Households | 61 (5.3%) | 0 (0.0%) |
| 6-Person Households | 16 (1.4%) | 0 (0.0%) |
| 7+ Person Households | 0 (0.0%) | 0 (0.0%) |
| Total | 775 (67.6%) | 372 (32.4%) |
Female Fertility in Bridgeville
Fertility by Age in Bridgeville
Average fertility rate in Bridgeville is 44.0 births per 1,000 women. Women in the age bracket of 20 to 34 years have the highest fertility rate with 78.0 births per 1,000 women. Women in the age bracket of 20 to 34 years acount for 82.4% of all women with births.
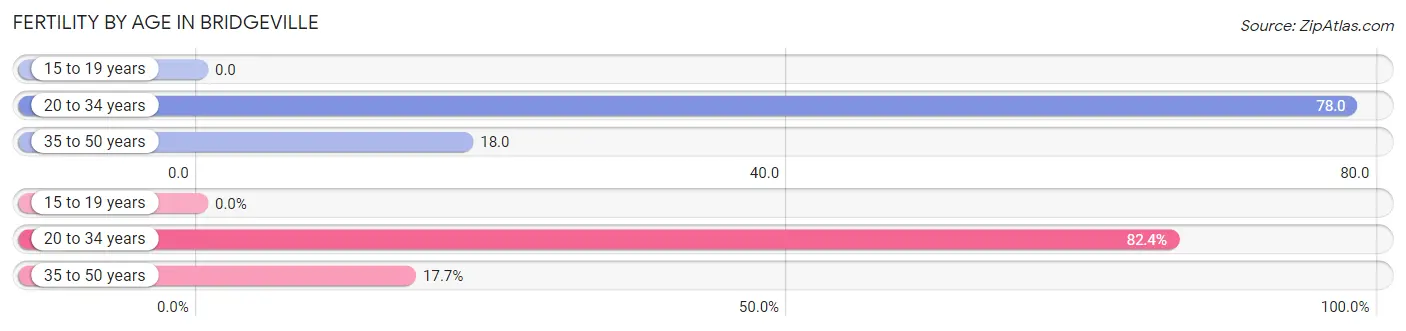
| Age Bracket | Women with Births | Births / 1,000 Women |
| 15 to 19 years | 0 (0.0%) | 0.0 |
| 20 to 34 years | 14 (82.4%) | 78.0 |
| 35 to 50 years | 3 (17.6%) | 18.0 |
| Total | 17 (100.0%) | 44.0 |
Fertility by Age by Marriage Status in Bridgeville
41.2% of women with births (17) in Bridgeville are married. The highest percentage of unmarried women with births falls into 20 to 34 years age bracket with 71.4% of them unmarried at the time of birth, while the lowest percentage of unmarried women with births belong to 35 to 50 years age bracket with 0.0% of them unmarried.
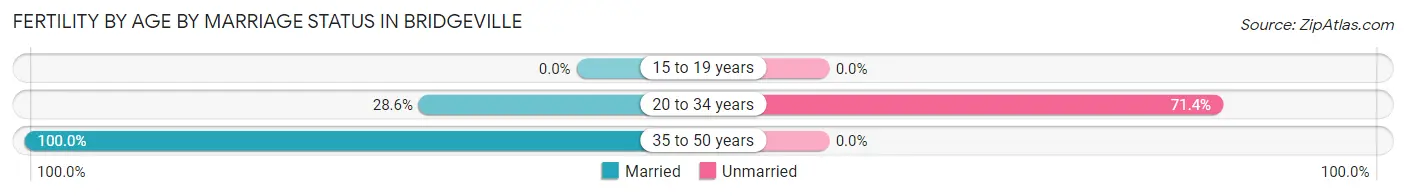
| Age Bracket | Married | Unmarried |
| 15 to 19 years | 0 (0.0%) | 0 (0.0%) |
| 20 to 34 years | 4 (28.6%) | 10 (71.4%) |
| 35 to 50 years | 3 (100.0%) | 0 (0.0%) |
| Total | 7 (41.2%) | 10 (58.8%) |
Fertility by Education in Bridgeville
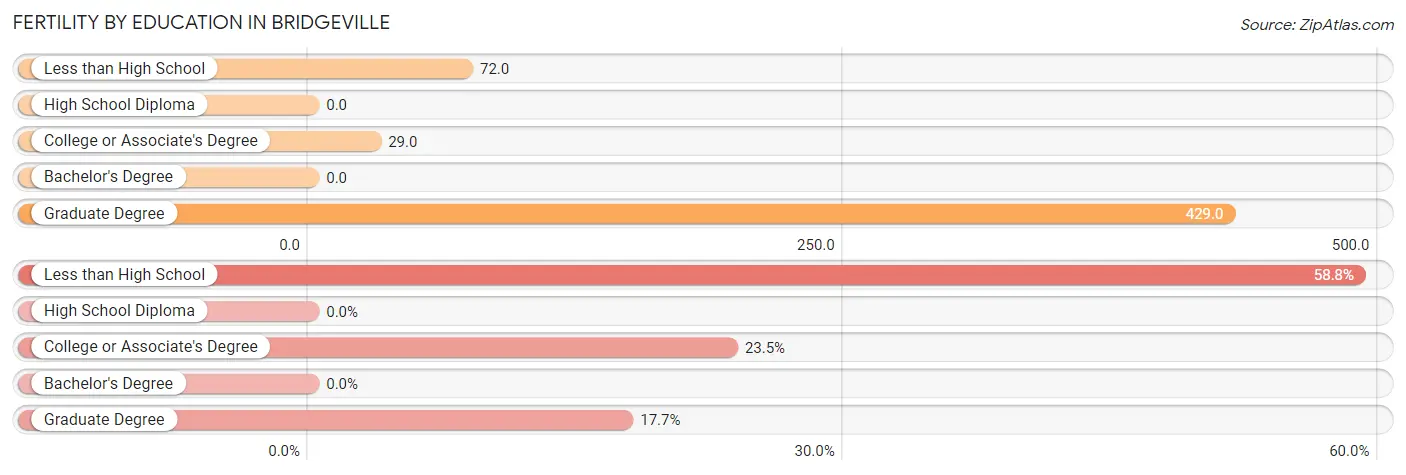
| Educational Attainment | Women with Births | Births / 1,000 Women |
| Less than High School | 10 (58.8%) | 72.0 |
| High School Diploma | 0 (0.0%) | 0.0 |
| College or Associate's Degree | 4 (23.5%) | 29.0 |
| Bachelor's Degree | 0 (0.0%) | 0.0 |
| Graduate Degree | 3 (17.6%) | 429.0 |
| Total | 17 (100.0%) | 44.0 |
Fertility by Education by Marriage Status in Bridgeville
58.8% of women with births in Bridgeville are unmarried. Women with the educational attainment of college or associate's degree are most likely to be married with 100.0% of them married at childbirth, while women with the educational attainment of less than high school are least likely to be married with 100.0% of them unmarried at childbirth.
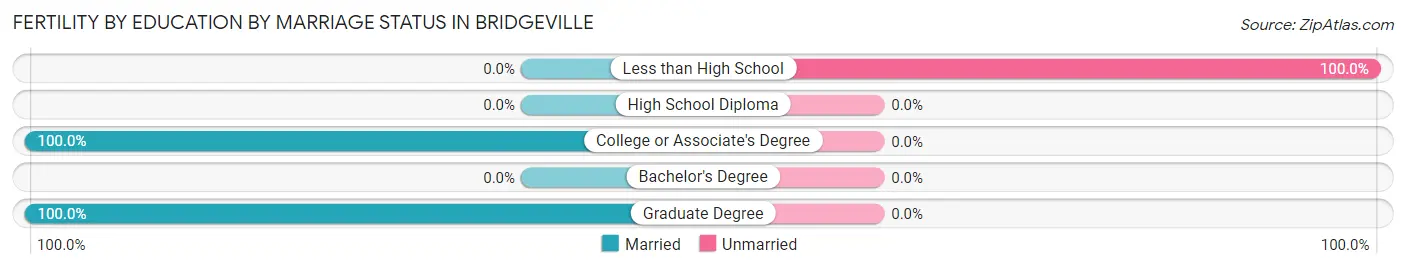
| Educational Attainment | Married | Unmarried |
| Less than High School | 0 (0.0%) | 10 (100.0%) |
| High School Diploma | 0 (0.0%) | 0 (0.0%) |
| College or Associate's Degree | 4 (100.0%) | 0 (0.0%) |
| Bachelor's Degree | 0 (0.0%) | 0 (0.0%) |
| Graduate Degree | 3 (100.0%) | 0 (0.0%) |
| Total | 7 (41.2%) | 10 (58.8%) |
Employment Characteristics in Bridgeville
Employment by Class of Employer in Bridgeville
Among the 784 employed individuals in Bridgeville, private company employees (612 | 78.1%), self-employed (incorporated) (40 | 5.1%), and not-for-profit organizations (40 | 5.1%) make up the most common classes of employment.
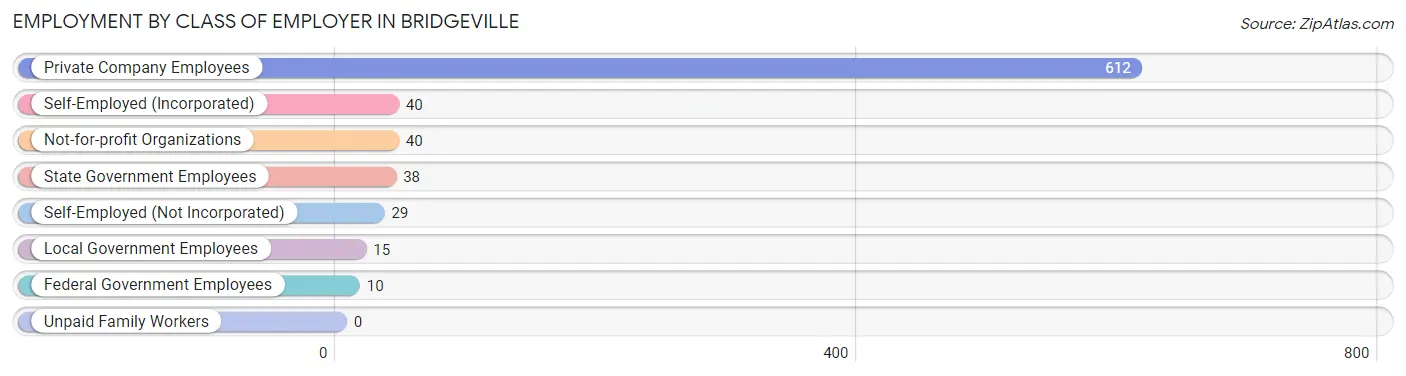
| Employer Class | # Employees | % Employees |
| Private Company Employees | 612 | 78.1% |
| Self-Employed (Incorporated) | 40 | 5.1% |
| Self-Employed (Not Incorporated) | 29 | 3.7% |
| Not-for-profit Organizations | 40 | 5.1% |
| Local Government Employees | 15 | 1.9% |
| State Government Employees | 38 | 4.9% |
| Federal Government Employees | 10 | 1.3% |
| Unpaid Family Workers | 0 | 0.0% |
| Total | 784 | 100.0% |
Employment Status by Age in Bridgeville
According to the labor force statistics for Bridgeville, out of the total population over 16 years of age (2,103), 41.5% or 873 individuals are in the labor force, with 7.6% or 66 of them unemployed. The age group with the highest labor force participation rate is 25 to 29 years, with 84.5% or 82 individuals in the labor force. Within the labor force, the 30 to 34 years age range has the highest percentage of unemployed individuals, with 43.1% or 28 of them being unemployed.
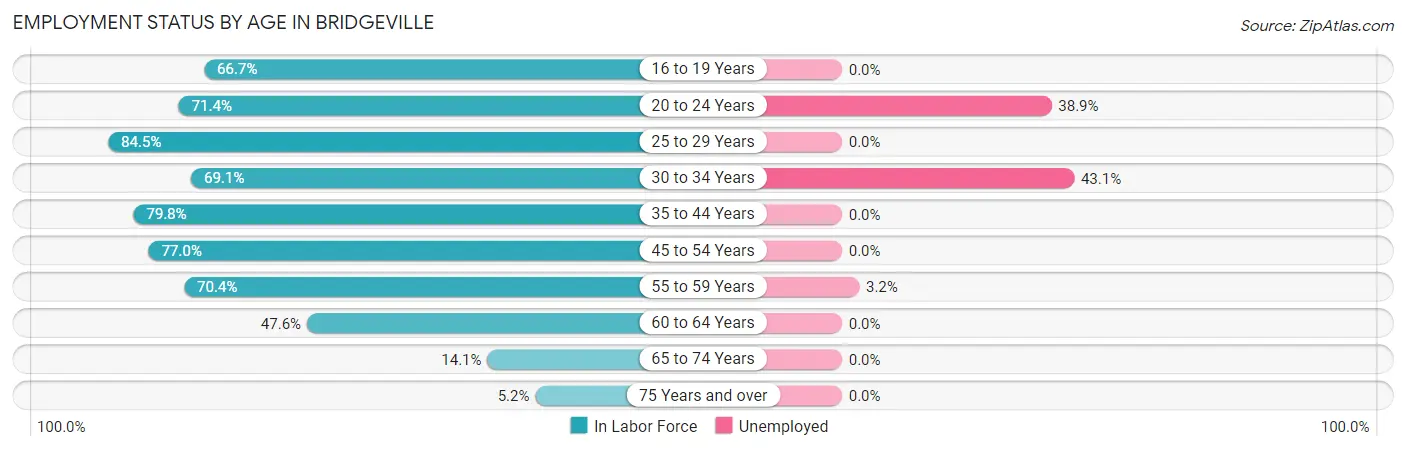
| Age Bracket | In Labor Force | Unemployed |
| 16 to 19 Years | 30 (66.7%) | 0 (0.0%) |
| 20 to 24 Years | 90 (71.4%) | 35 (38.9%) |
| 25 to 29 Years | 82 (84.5%) | 0 (0.0%) |
| 30 to 34 Years | 65 (69.1%) | 28 (43.1%) |
| 35 to 44 Years | 205 (79.8%) | 0 (0.0%) |
| 45 to 54 Years | 94 (77.0%) | 0 (0.0%) |
| 55 to 59 Years | 95 (70.4%) | 3 (3.2%) |
| 60 to 64 Years | 90 (47.6%) | 0 (0.0%) |
| 65 to 74 Years | 106 (14.1%) | 0 (0.0%) |
| 75 Years and over | 15 (5.2%) | 0 (0.0%) |
| Total | 873 (41.5%) | 66 (7.6%) |
Employment Status by Educational Attainment in Bridgeville
According to labor force statistics for Bridgeville, 70.6% of individuals (631) out of the total population between 25 and 64 years of age (894) are in the labor force, with 4.9% or 31 of them being unemployed. The group with the highest labor force participation rate are those with the educational attainment of bachelor's degree or higher, with 78.9% or 127 individuals in the labor force. Within the labor force, individuals with high school diploma education have the highest percentage of unemployment, with 12.0% or 25 of them being unemployed.
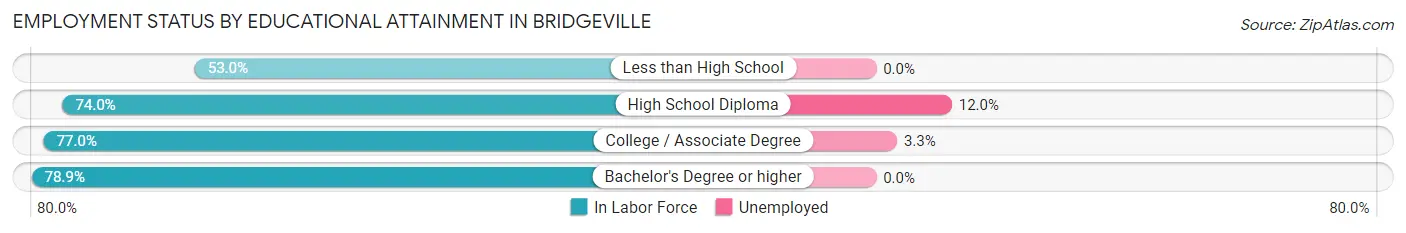
| Educational Attainment | In Labor Force | Unemployed |
| Less than High School | 115 (53.0%) | 0 (0.0%) |
| High School Diploma | 208 (74.0%) | 34 (12.0%) |
| College / Associate Degree | 181 (77.0%) | 8 (3.3%) |
| Bachelor's Degree or higher | 127 (78.9%) | 0 (0.0%) |
| Total | 631 (70.6%) | 44 (4.9%) |
Employment Occupations by Sex in Bridgeville
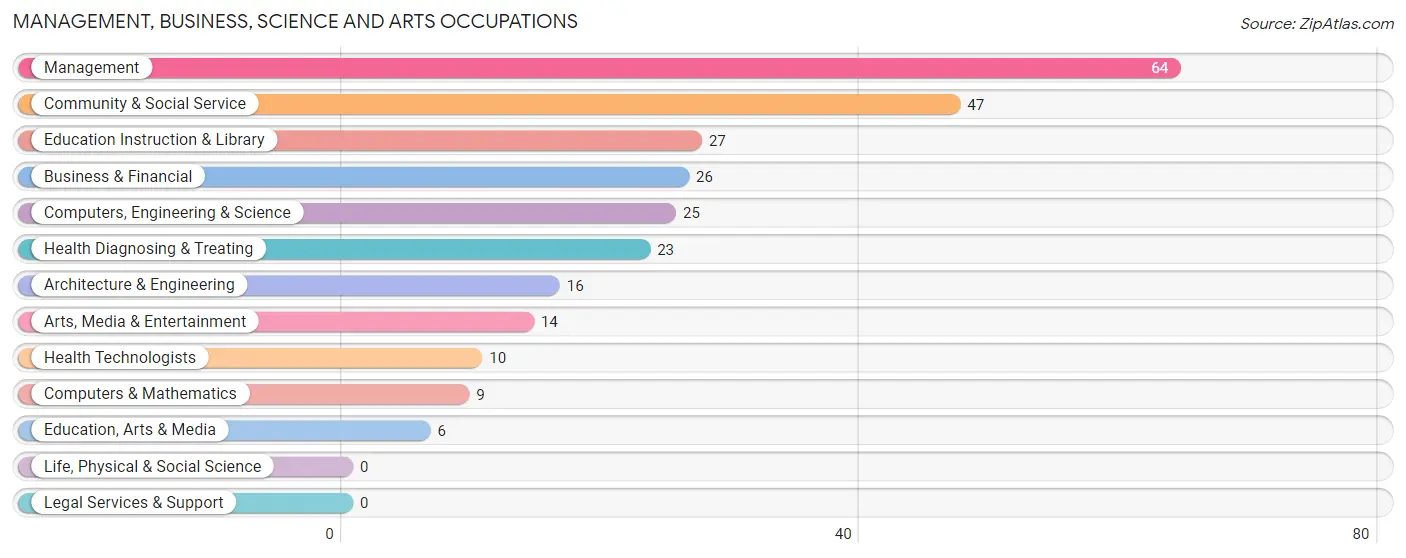
Management, Business, Science and Arts Occupations
The most common Management, Business, Science and Arts occupations in Bridgeville are Management (64 | 7.9%), Community & Social Service (47 | 5.8%), Education Instruction & Library (27 | 3.4%), Business & Financial (26 | 3.2%), and Computers, Engineering & Science (25 | 3.1%).
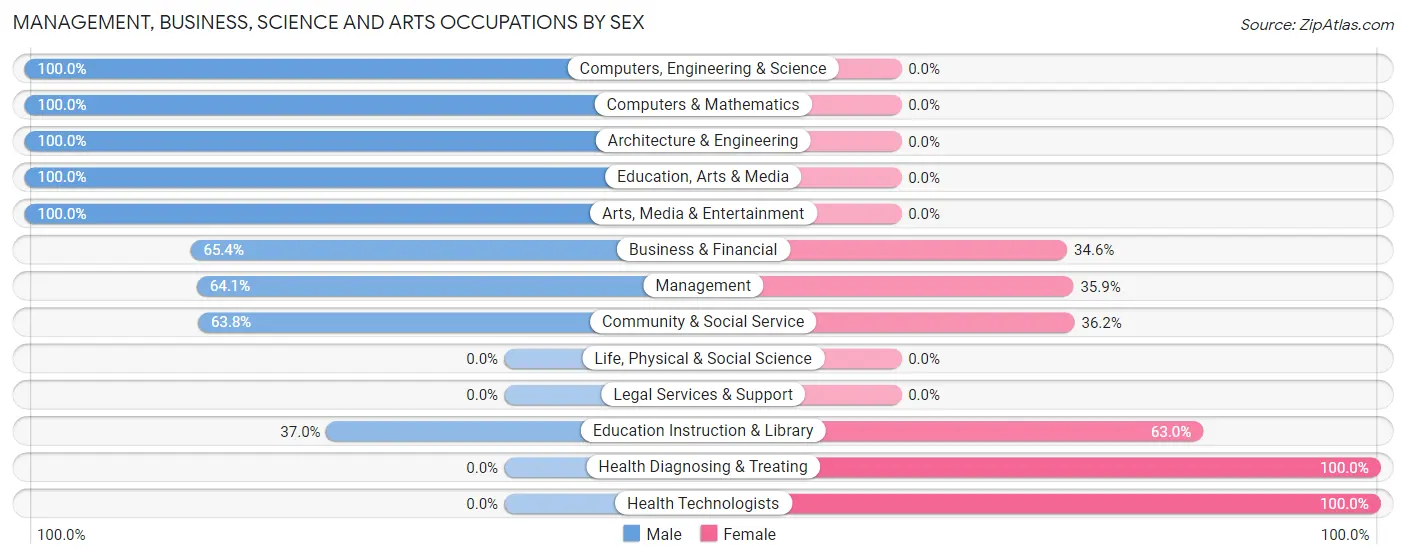
Management, Business, Science and Arts Occupations by Sex
Within the Management, Business, Science and Arts occupations in Bridgeville, the most male-oriented occupations are Computers, Engineering & Science (100.0%), Computers & Mathematics (100.0%), and Architecture & Engineering (100.0%), while the most female-oriented occupations are Health Diagnosing & Treating (100.0%), Health Technologists (100.0%), and Education Instruction & Library (63.0%).
| Occupation | Male | Female |
| Management | 41 (64.1%) | 23 (35.9%) |
| Business & Financial | 17 (65.4%) | 9 (34.6%) |
| Computers, Engineering & Science | 25 (100.0%) | 0 (0.0%) |
| Computers & Mathematics | 9 (100.0%) | 0 (0.0%) |
| Architecture & Engineering | 16 (100.0%) | 0 (0.0%) |
| Life, Physical & Social Science | 0 (0.0%) | 0 (0.0%) |
| Community & Social Service | 30 (63.8%) | 17 (36.2%) |
| Education, Arts & Media | 6 (100.0%) | 0 (0.0%) |
| Legal Services & Support | 0 (0.0%) | 0 (0.0%) |
| Education Instruction & Library | 10 (37.0%) | 17 (63.0%) |
| Arts, Media & Entertainment | 14 (100.0%) | 0 (0.0%) |
| Health Diagnosing & Treating | 0 (0.0%) | 23 (100.0%) |
| Health Technologists | 0 (0.0%) | 10 (100.0%) |
| Total (Category) | 113 (61.1%) | 72 (38.9%) |
| Total (Overall) | 460 (57.1%) | 346 (42.9%) |
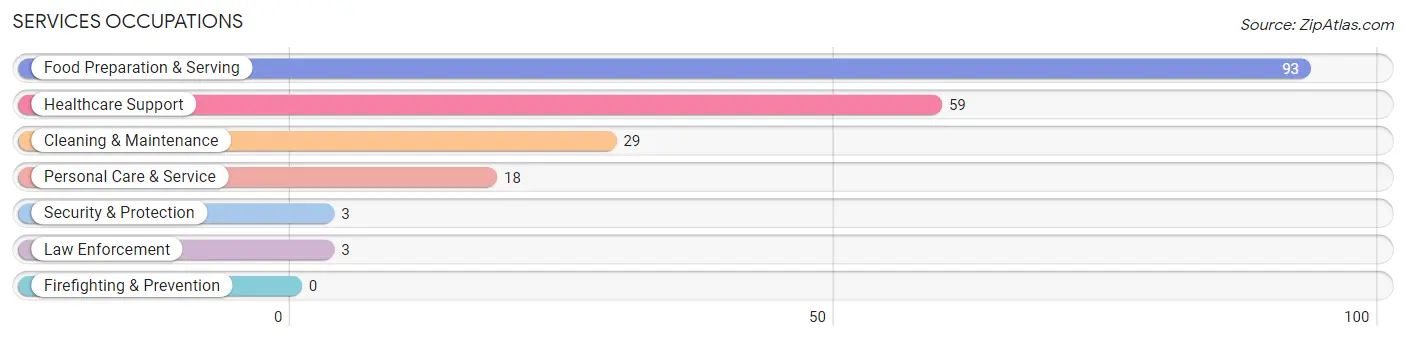
Services Occupations
The most common Services occupations in Bridgeville are Food Preparation & Serving (93 | 11.5%), Healthcare Support (59 | 7.3%), Cleaning & Maintenance (29 | 3.6%), Personal Care & Service (18 | 2.2%), and Security & Protection (3 | 0.4%).
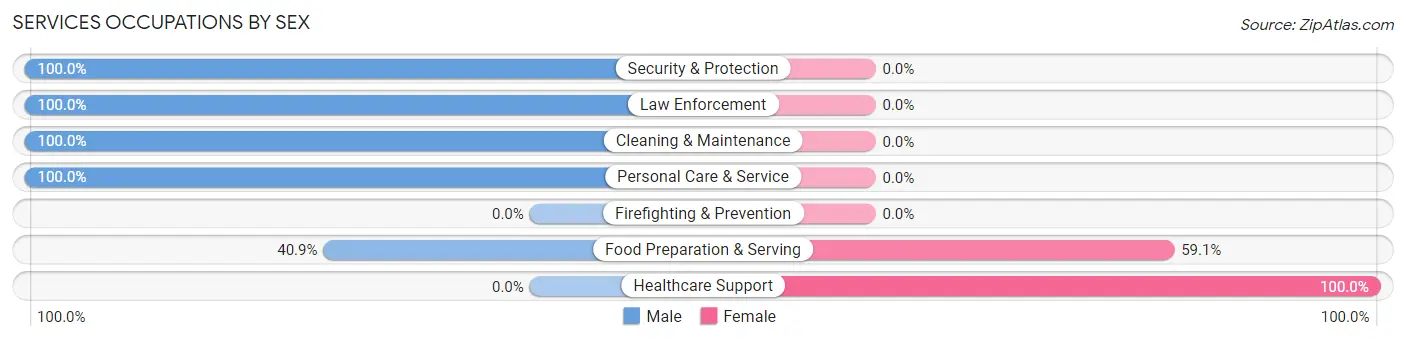
Services Occupations by Sex
Within the Services occupations in Bridgeville, the most male-oriented occupations are Security & Protection (100.0%), Law Enforcement (100.0%), and Cleaning & Maintenance (100.0%), while the most female-oriented occupations are Healthcare Support (100.0%), and Food Preparation & Serving (59.1%).
| Occupation | Male | Female |
| Healthcare Support | 0 (0.0%) | 59 (100.0%) |
| Security & Protection | 3 (100.0%) | 0 (0.0%) |
| Firefighting & Prevention | 0 (0.0%) | 0 (0.0%) |
| Law Enforcement | 3 (100.0%) | 0 (0.0%) |
| Food Preparation & Serving | 38 (40.9%) | 55 (59.1%) |
| Cleaning & Maintenance | 29 (100.0%) | 0 (0.0%) |
| Personal Care & Service | 18 (100.0%) | 0 (0.0%) |
| Total (Category) | 88 (43.6%) | 114 (56.4%) |
| Total (Overall) | 460 (57.1%) | 346 (42.9%) |
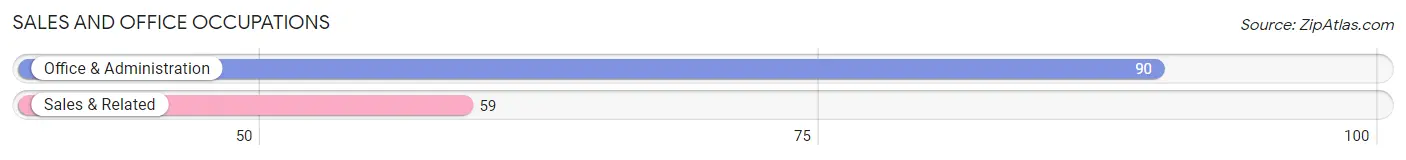
Sales and Office Occupations
The most common Sales and Office occupations in Bridgeville are Office & Administration (90 | 11.2%), and Sales & Related (59 | 7.3%).
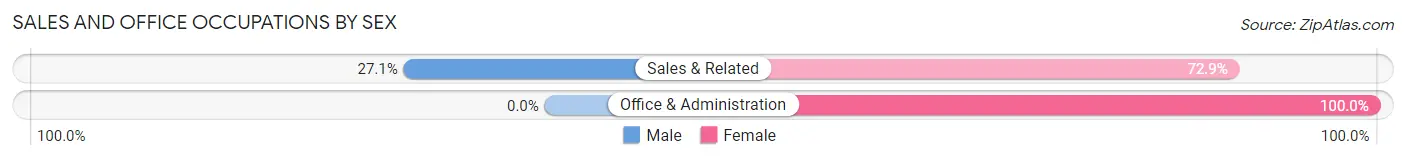
Sales and Office Occupations by Sex
| Occupation | Male | Female |
| Sales & Related | 16 (27.1%) | 43 (72.9%) |
| Office & Administration | 0 (0.0%) | 90 (100.0%) |
| Total (Category) | 16 (10.7%) | 133 (89.3%) |
| Total (Overall) | 460 (57.1%) | 346 (42.9%) |
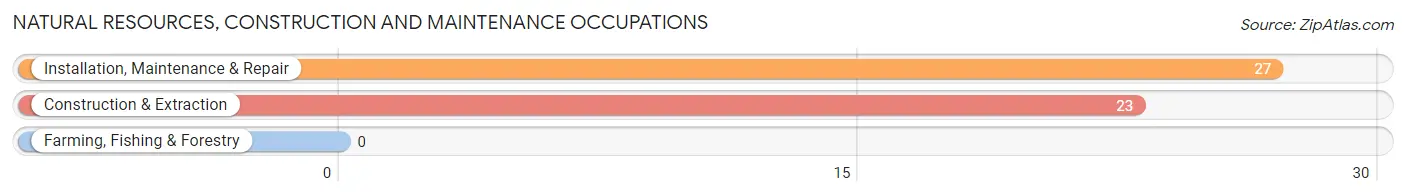
Natural Resources, Construction and Maintenance Occupations
The most common Natural Resources, Construction and Maintenance occupations in Bridgeville are Installation, Maintenance & Repair (27 | 3.4%), and Construction & Extraction (23 | 2.9%).
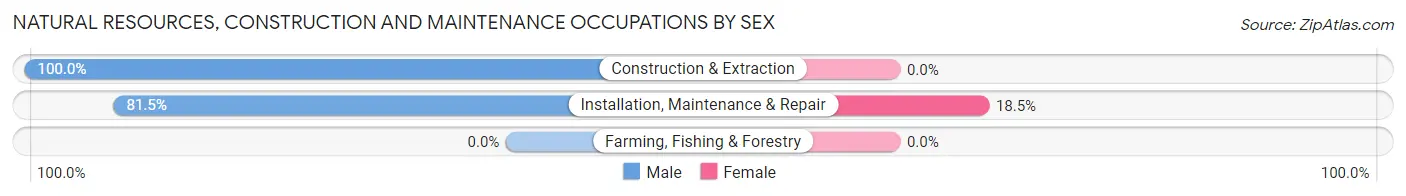
Natural Resources, Construction and Maintenance Occupations by Sex
| Occupation | Male | Female |
| Farming, Fishing & Forestry | 0 (0.0%) | 0 (0.0%) |
| Construction & Extraction | 23 (100.0%) | 0 (0.0%) |
| Installation, Maintenance & Repair | 22 (81.5%) | 5 (18.5%) |
| Total (Category) | 45 (90.0%) | 5 (10.0%) |
| Total (Overall) | 460 (57.1%) | 346 (42.9%) |
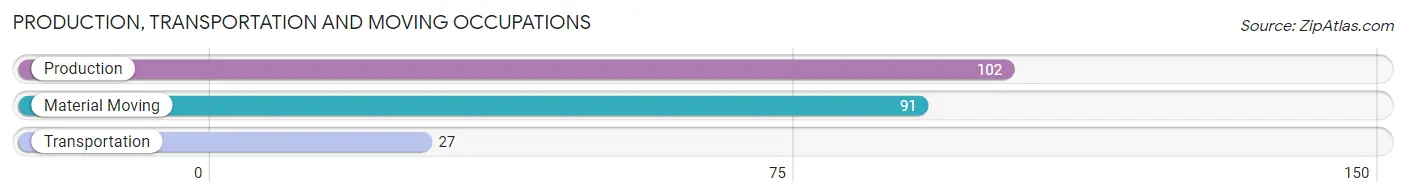
Production, Transportation and Moving Occupations
The most common Production, Transportation and Moving occupations in Bridgeville are Production (102 | 12.7%), Material Moving (91 | 11.3%), and Transportation (27 | 3.4%).
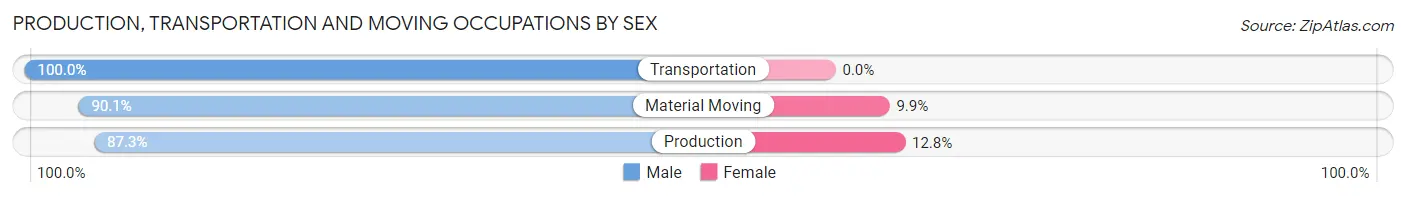
Production, Transportation and Moving Occupations by Sex
| Occupation | Male | Female |
| Production | 89 (87.3%) | 13 (12.8%) |
| Transportation | 27 (100.0%) | 0 (0.0%) |
| Material Moving | 82 (90.1%) | 9 (9.9%) |
| Total (Category) | 198 (90.0%) | 22 (10.0%) |
| Total (Overall) | 460 (57.1%) | 346 (42.9%) |
Employment Industries by Sex in Bridgeville
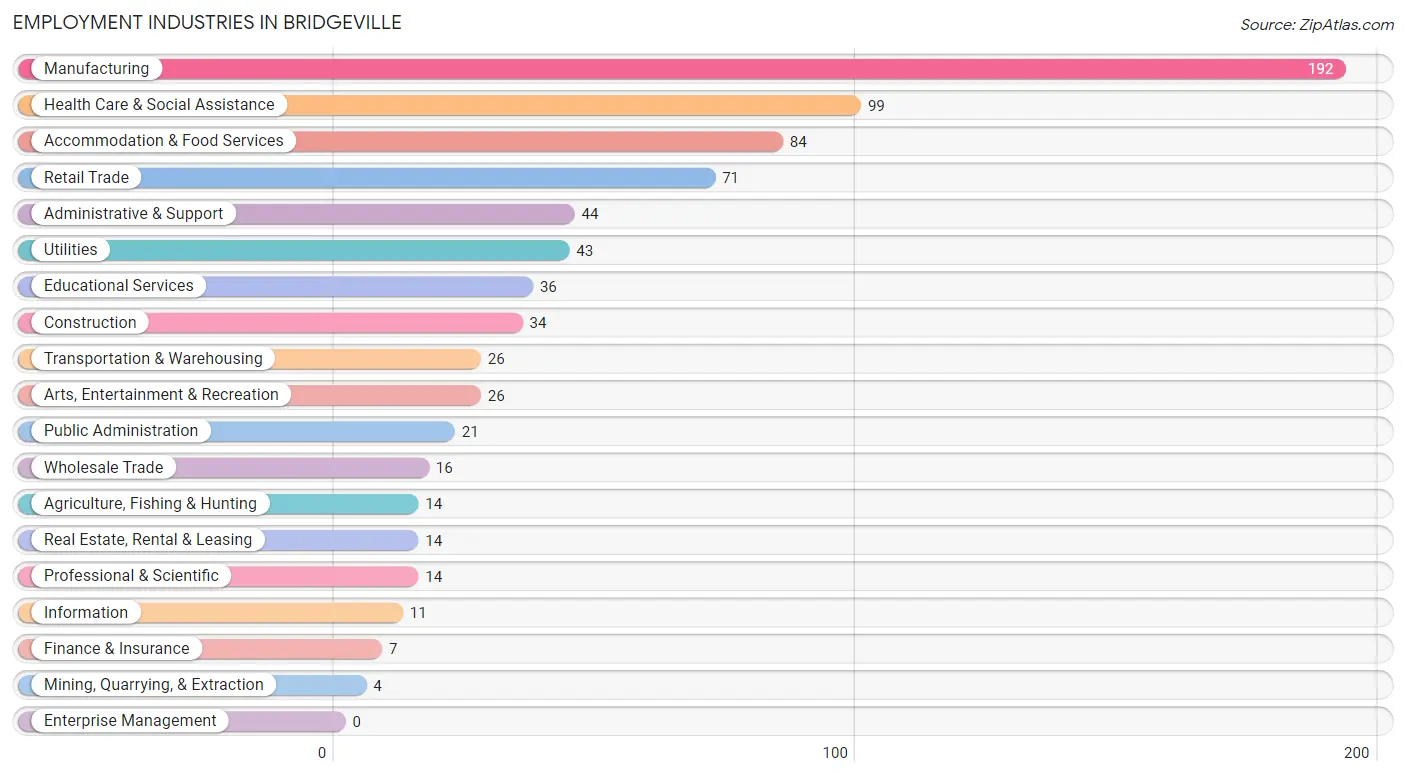
Employment Industries in Bridgeville
The major employment industries in Bridgeville include Manufacturing (192 | 23.8%), Health Care & Social Assistance (99 | 12.3%), Accommodation & Food Services (84 | 10.4%), Retail Trade (71 | 8.8%), and Administrative & Support (44 | 5.5%).
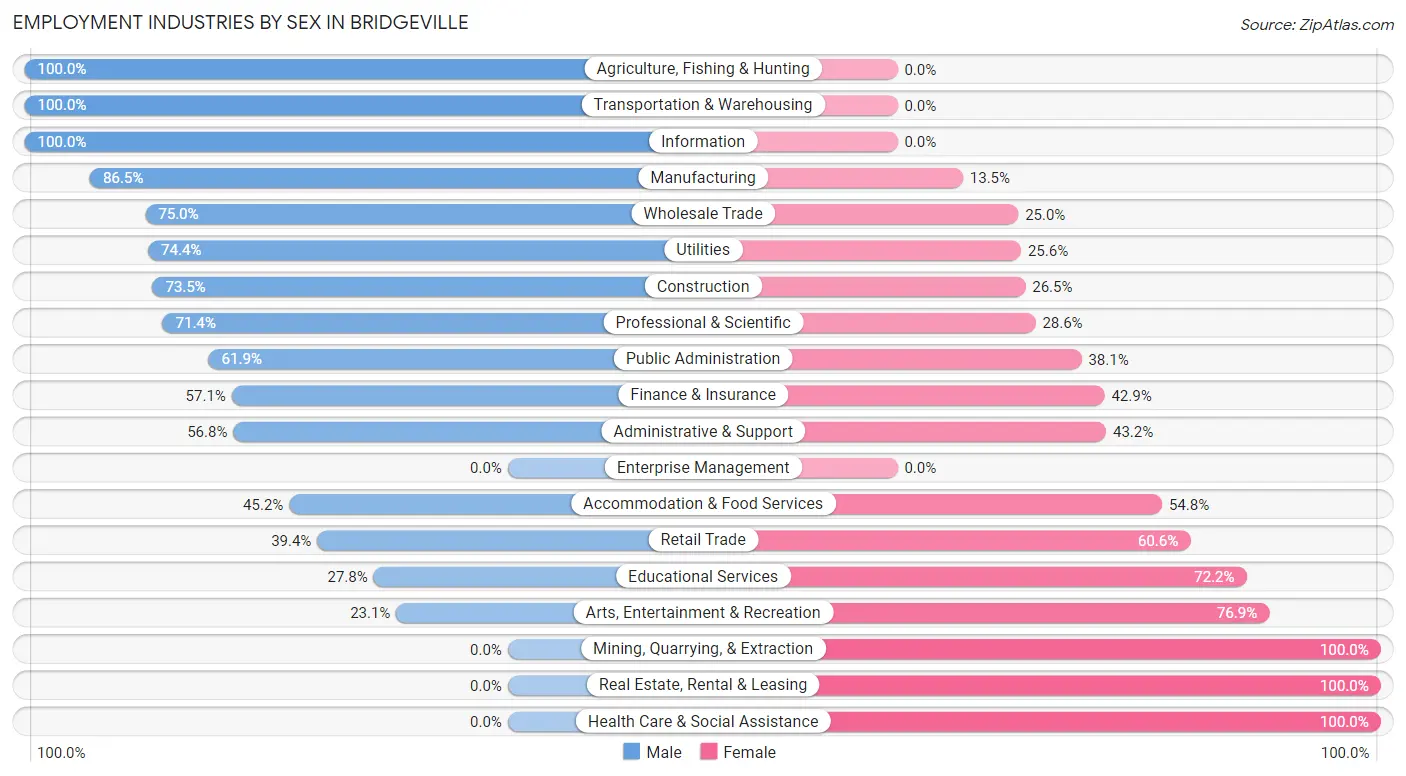
Employment Industries by Sex in Bridgeville
The Bridgeville industries that see more men than women are Agriculture, Fishing & Hunting (100.0%), Transportation & Warehousing (100.0%), and Information (100.0%), whereas the industries that tend to have a higher number of women are Mining, Quarrying, & Extraction (100.0%), Real Estate, Rental & Leasing (100.0%), and Health Care & Social Assistance (100.0%).
| Industry | Male | Female |
| Agriculture, Fishing & Hunting | 14 (100.0%) | 0 (0.0%) |
| Mining, Quarrying, & Extraction | 0 (0.0%) | 4 (100.0%) |
| Construction | 25 (73.5%) | 9 (26.5%) |
| Manufacturing | 166 (86.5%) | 26 (13.5%) |
| Wholesale Trade | 12 (75.0%) | 4 (25.0%) |
| Retail Trade | 28 (39.4%) | 43 (60.6%) |
| Transportation & Warehousing | 26 (100.0%) | 0 (0.0%) |
| Utilities | 32 (74.4%) | 11 (25.6%) |
| Information | 11 (100.0%) | 0 (0.0%) |
| Finance & Insurance | 4 (57.1%) | 3 (42.9%) |
| Real Estate, Rental & Leasing | 0 (0.0%) | 14 (100.0%) |
| Professional & Scientific | 10 (71.4%) | 4 (28.6%) |
| Enterprise Management | 0 (0.0%) | 0 (0.0%) |
| Administrative & Support | 25 (56.8%) | 19 (43.2%) |
| Educational Services | 10 (27.8%) | 26 (72.2%) |
| Health Care & Social Assistance | 0 (0.0%) | 99 (100.0%) |
| Arts, Entertainment & Recreation | 6 (23.1%) | 20 (76.9%) |
| Accommodation & Food Services | 38 (45.2%) | 46 (54.8%) |
| Public Administration | 13 (61.9%) | 8 (38.1%) |
| Total | 460 (57.1%) | 346 (42.9%) |
Education in Bridgeville
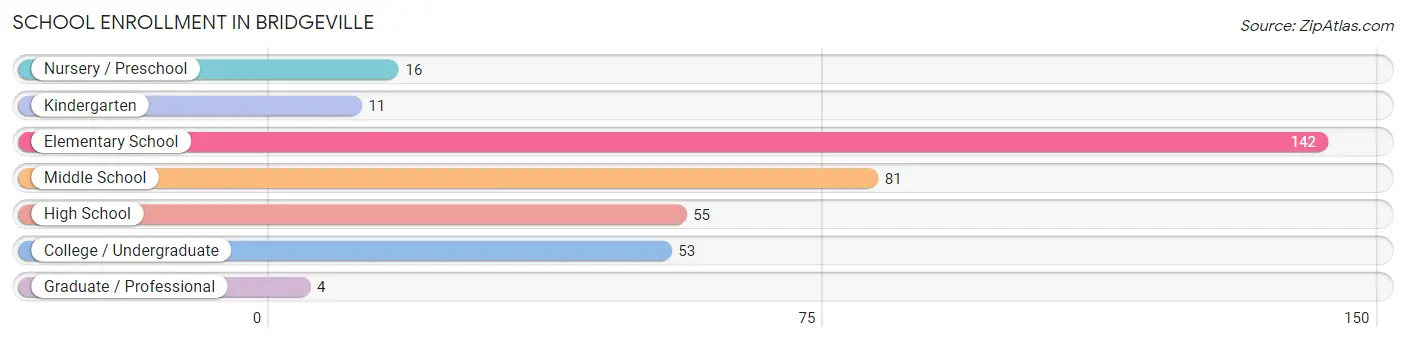
School Enrollment in Bridgeville
The most common levels of schooling among the 362 students in Bridgeville are elementary school (142 | 39.2%), middle school (81 | 22.4%), and high school (55 | 15.2%).
| School Level | # Students | % Students |
| Nursery / Preschool | 16 | 4.4% |
| Kindergarten | 11 | 3.0% |
| Elementary School | 142 | 39.2% |
| Middle School | 81 | 22.4% |
| High School | 55 | 15.2% |
| College / Undergraduate | 53 | 14.6% |
| Graduate / Professional | 4 | 1.1% |
| Total | 362 | 100.0% |
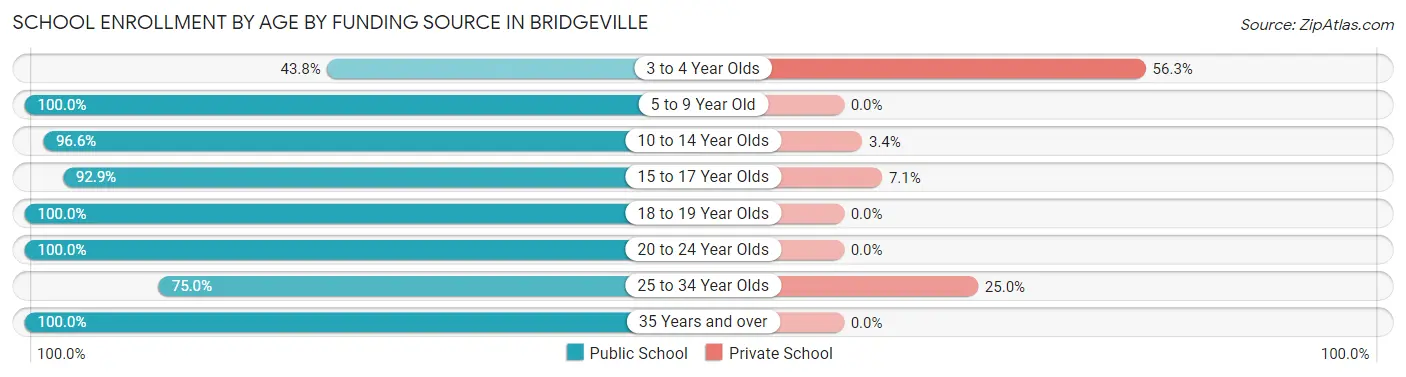
School Enrollment by Age by Funding Source in Bridgeville
Out of a total of 362 students who are enrolled in schools in Bridgeville, 19 (5.2%) attend a private institution, while the remaining 343 (94.8%) are enrolled in public schools. The age group of 3 to 4 year olds has the highest likelihood of being enrolled in private schools, with 9 (56.2% in the age bracket) enrolled. Conversely, the age group of 5 to 9 year old has the lowest likelihood of being enrolled in a private school, with 129 (100.0% in the age bracket) attending a public institution.
| Age Bracket | Public School | Private School |
| 3 to 4 Year Olds | 7 (43.8%) | 9 (56.2%) |
| 5 to 9 Year Old | 129 (100.0%) | 0 (0.0%) |
| 10 to 14 Year Olds | 113 (96.6%) | 4 (3.4%) |
| 15 to 17 Year Olds | 39 (92.9%) | 3 (7.1%) |
| 18 to 19 Year Olds | 12 (100.0%) | 0 (0.0%) |
| 20 to 24 Year Olds | 28 (100.0%) | 0 (0.0%) |
| 25 to 34 Year Olds | 9 (75.0%) | 3 (25.0%) |
| 35 Years and over | 6 (100.0%) | 0 (0.0%) |
| Total | 343 (94.8%) | 19 (5.2%) |
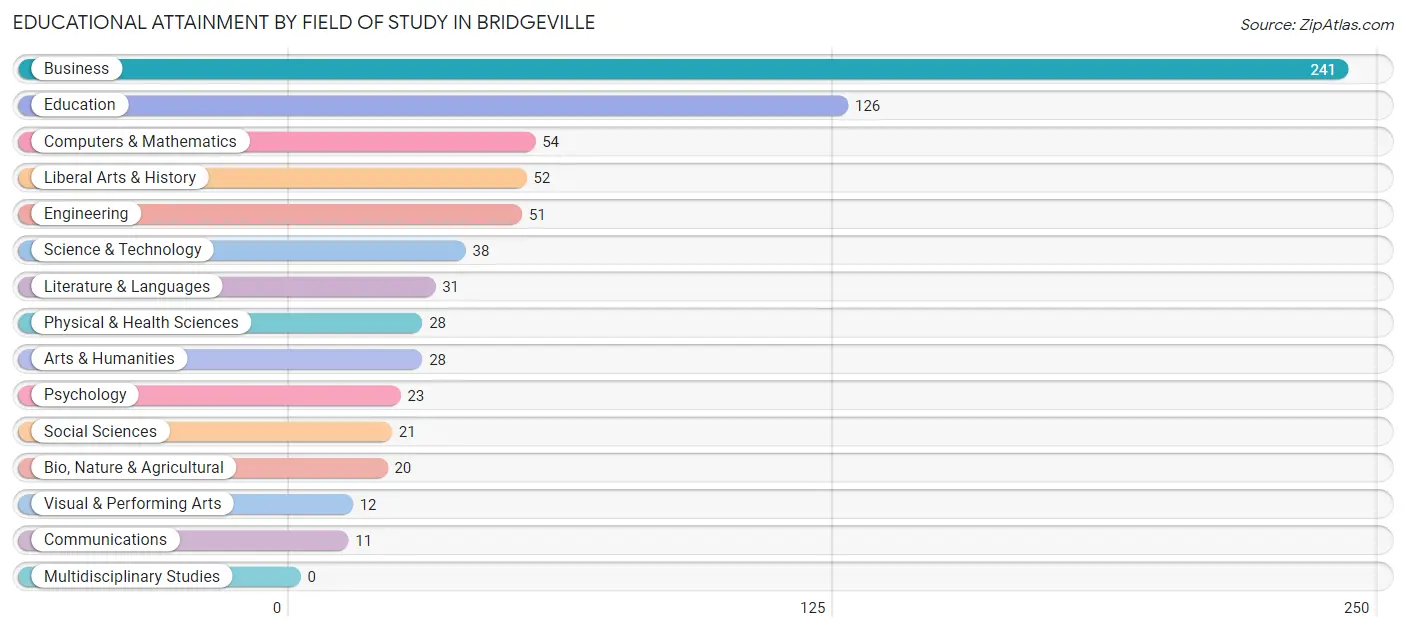
Educational Attainment by Field of Study in Bridgeville
Business (241 | 32.7%), education (126 | 17.1%), computers & mathematics (54 | 7.3%), liberal arts & history (52 | 7.1%), and engineering (51 | 6.9%) are the most common fields of study among 736 individuals in Bridgeville who have obtained a bachelor's degree or higher.
| Field of Study | # Graduates | % Graduates |
| Computers & Mathematics | 54 | 7.3% |
| Bio, Nature & Agricultural | 20 | 2.7% |
| Physical & Health Sciences | 28 | 3.8% |
| Psychology | 23 | 3.1% |
| Social Sciences | 21 | 2.9% |
| Engineering | 51 | 6.9% |
| Multidisciplinary Studies | 0 | 0.0% |
| Science & Technology | 38 | 5.2% |
| Business | 241 | 32.7% |
| Education | 126 | 17.1% |
| Literature & Languages | 31 | 4.2% |
| Liberal Arts & History | 52 | 7.1% |
| Visual & Performing Arts | 12 | 1.6% |
| Communications | 11 | 1.5% |
| Arts & Humanities | 28 | 3.8% |
| Total | 736 | 100.0% |
Transportation & Commute in Bridgeville
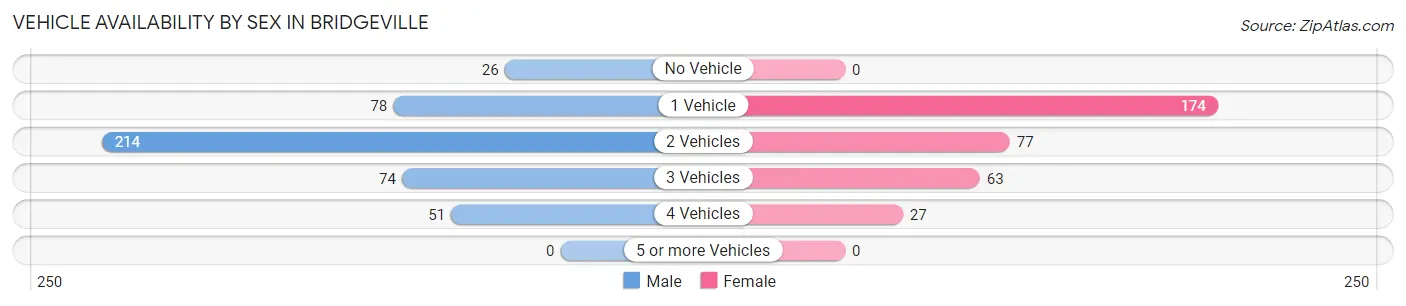
Vehicle Availability by Sex in Bridgeville
The most prevalent vehicle ownership categories in Bridgeville are males with 2 vehicles (214, accounting for 48.3%) and females with 2 vehicles (77, making up 62.8%).
| Vehicles Available | Male | Female |
| No Vehicle | 26 (5.9%) | 0 (0.0%) |
| 1 Vehicle | 78 (17.6%) | 174 (51.0%) |
| 2 Vehicles | 214 (48.3%) | 77 (22.6%) |
| 3 Vehicles | 74 (16.7%) | 63 (18.5%) |
| 4 Vehicles | 51 (11.5%) | 27 (7.9%) |
| 5 or more Vehicles | 0 (0.0%) | 0 (0.0%) |
| Total | 443 (100.0%) | 341 (100.0%) |
Commute Time in Bridgeville
The most frequently occuring commute durations in Bridgeville are 20 to 24 minutes (116 commuters, 16.8%), 30 to 34 minutes (111 commuters, 16.1%), and 15 to 19 minutes (105 commuters, 15.2%).
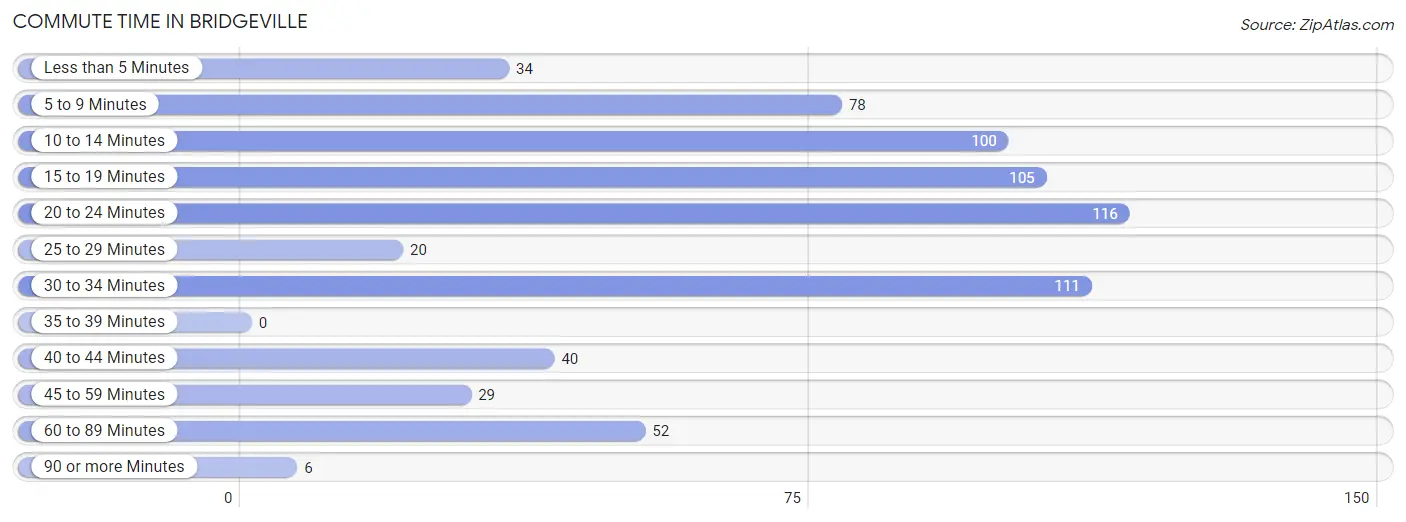
| Commute Time | # Commuters | % Commuters |
| Less than 5 Minutes | 34 | 4.9% |
| 5 to 9 Minutes | 78 | 11.3% |
| 10 to 14 Minutes | 100 | 14.5% |
| 15 to 19 Minutes | 105 | 15.2% |
| 20 to 24 Minutes | 116 | 16.8% |
| 25 to 29 Minutes | 20 | 2.9% |
| 30 to 34 Minutes | 111 | 16.1% |
| 35 to 39 Minutes | 0 | 0.0% |
| 40 to 44 Minutes | 40 | 5.8% |
| 45 to 59 Minutes | 29 | 4.2% |
| 60 to 89 Minutes | 52 | 7.5% |
| 90 or more Minutes | 6 | 0.9% |
Commute Time by Sex in Bridgeville
The most common commute times in Bridgeville are 20 to 24 minutes (97 commuters, 25.6%) for males and 30 to 34 minutes (85 commuters, 27.2%) for females.
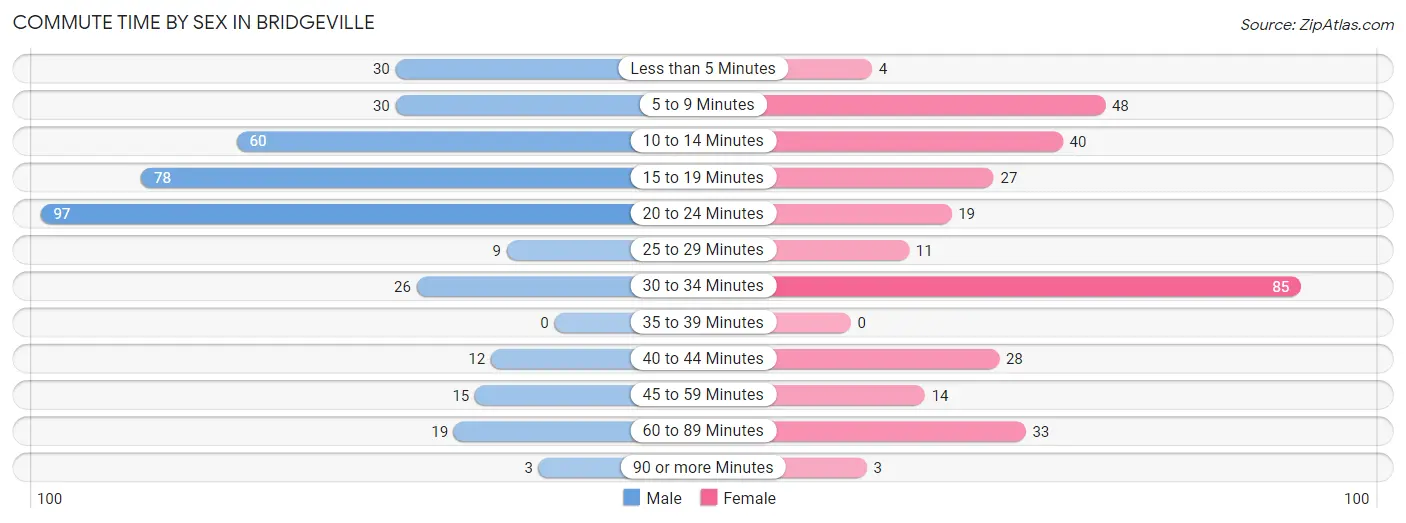
| Commute Time | Male | Female |
| Less than 5 Minutes | 30 (7.9%) | 4 (1.3%) |
| 5 to 9 Minutes | 30 (7.9%) | 48 (15.4%) |
| 10 to 14 Minutes | 60 (15.8%) | 40 (12.8%) |
| 15 to 19 Minutes | 78 (20.6%) | 27 (8.6%) |
| 20 to 24 Minutes | 97 (25.6%) | 19 (6.1%) |
| 25 to 29 Minutes | 9 (2.4%) | 11 (3.5%) |
| 30 to 34 Minutes | 26 (6.9%) | 85 (27.2%) |
| 35 to 39 Minutes | 0 (0.0%) | 0 (0.0%) |
| 40 to 44 Minutes | 12 (3.2%) | 28 (9.0%) |
| 45 to 59 Minutes | 15 (4.0%) | 14 (4.5%) |
| 60 to 89 Minutes | 19 (5.0%) | 33 (10.6%) |
| 90 or more Minutes | 3 (0.8%) | 3 (1.0%) |
Time of Departure to Work by Sex in Bridgeville
The most frequent times of departure to work in Bridgeville are 8:00 AM to 8:29 AM (88, 23.2%) for males and 7:30 AM to 7:59 AM (63, 20.2%) for females.
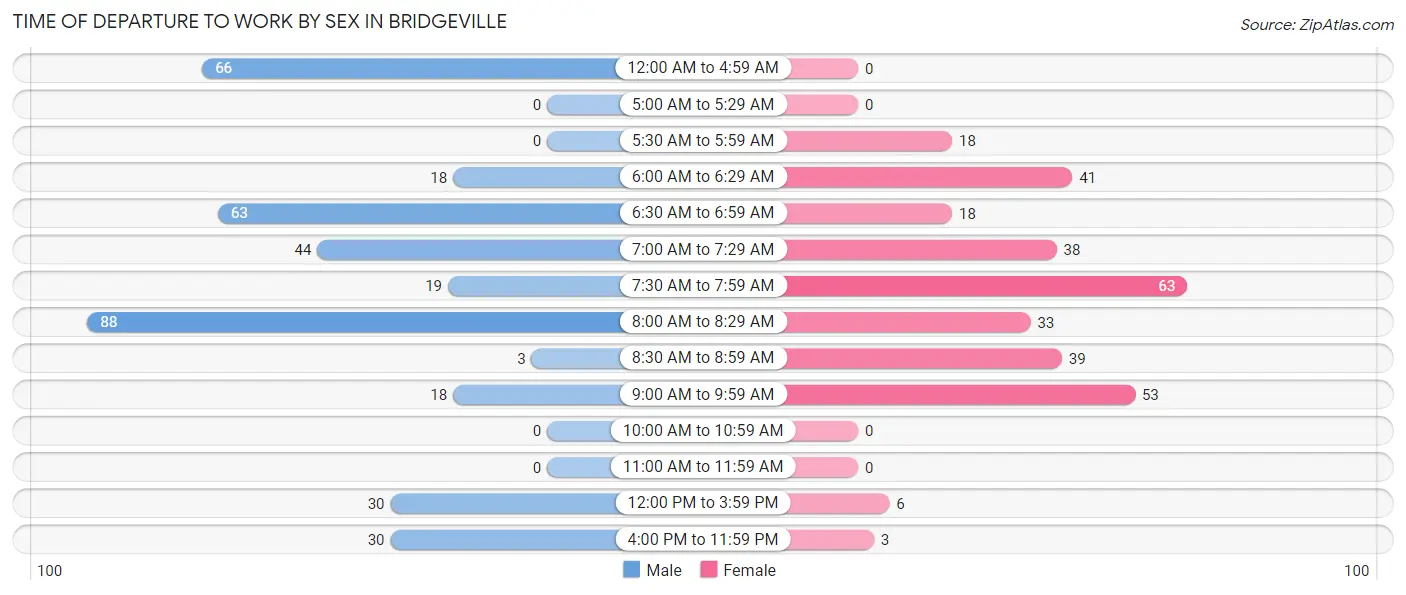
| Time of Departure | Male | Female |
| 12:00 AM to 4:59 AM | 66 (17.4%) | 0 (0.0%) |
| 5:00 AM to 5:29 AM | 0 (0.0%) | 0 (0.0%) |
| 5:30 AM to 5:59 AM | 0 (0.0%) | 18 (5.8%) |
| 6:00 AM to 6:29 AM | 18 (4.8%) | 41 (13.1%) |
| 6:30 AM to 6:59 AM | 63 (16.6%) | 18 (5.8%) |
| 7:00 AM to 7:29 AM | 44 (11.6%) | 38 (12.2%) |
| 7:30 AM to 7:59 AM | 19 (5.0%) | 63 (20.2%) |
| 8:00 AM to 8:29 AM | 88 (23.2%) | 33 (10.6%) |
| 8:30 AM to 8:59 AM | 3 (0.8%) | 39 (12.5%) |
| 9:00 AM to 9:59 AM | 18 (4.8%) | 53 (17.0%) |
| 10:00 AM to 10:59 AM | 0 (0.0%) | 0 (0.0%) |
| 11:00 AM to 11:59 AM | 0 (0.0%) | 0 (0.0%) |
| 12:00 PM to 3:59 PM | 30 (7.9%) | 6 (1.9%) |
| 4:00 PM to 11:59 PM | 30 (7.9%) | 3 (1.0%) |
| Total | 379 (100.0%) | 312 (100.0%) |
Housing Occupancy in Bridgeville
Occupancy by Ownership in Bridgeville
Of the total 1,147 dwellings in Bridgeville, owner-occupied units account for 794 (69.2%), while renter-occupied units make up 353 (30.8%).
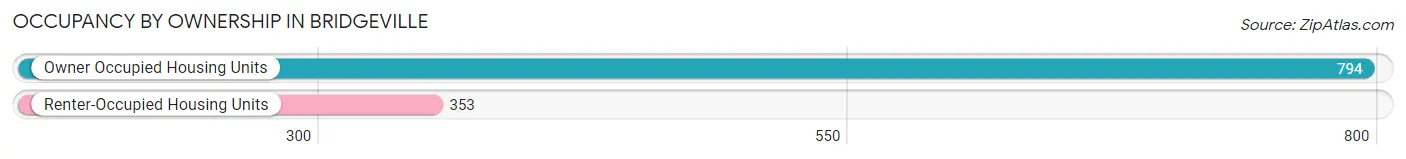
| Occupancy | # Housing Units | % Housing Units |
| Owner Occupied Housing Units | 794 | 69.2% |
| Renter-Occupied Housing Units | 353 | 30.8% |
| Total Occupied Housing Units | 1,147 | 100.0% |
Occupancy by Household Size in Bridgeville
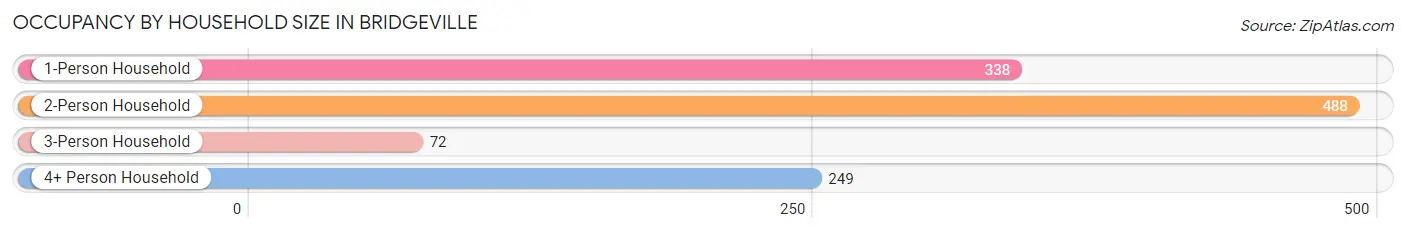
| Household Size | # Housing Units | % Housing Units |
| 1-Person Household | 338 | 29.5% |
| 2-Person Household | 488 | 42.5% |
| 3-Person Household | 72 | 6.3% |
| 4+ Person Household | 249 | 21.7% |
| Total Housing Units | 1,147 | 100.0% |
Occupancy by Ownership by Household Size in Bridgeville
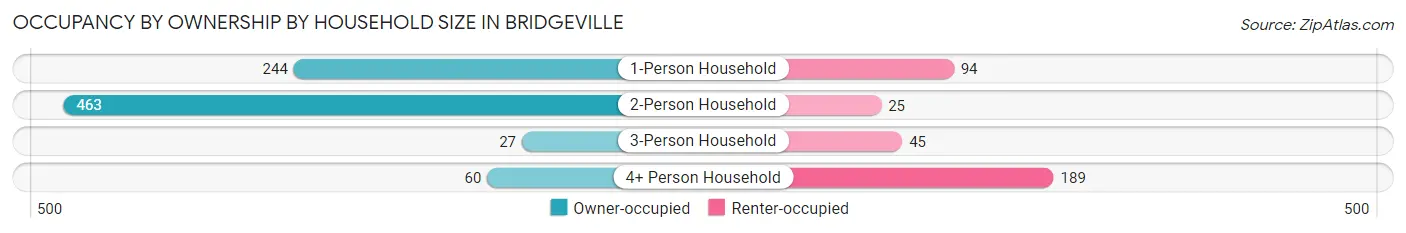
| Household Size | Owner-occupied | Renter-occupied |
| 1-Person Household | 244 (72.2%) | 94 (27.8%) |
| 2-Person Household | 463 (94.9%) | 25 (5.1%) |
| 3-Person Household | 27 (37.5%) | 45 (62.5%) |
| 4+ Person Household | 60 (24.1%) | 189 (75.9%) |
| Total Housing Units | 794 (69.2%) | 353 (30.8%) |
Occupancy by Educational Attainment in Bridgeville
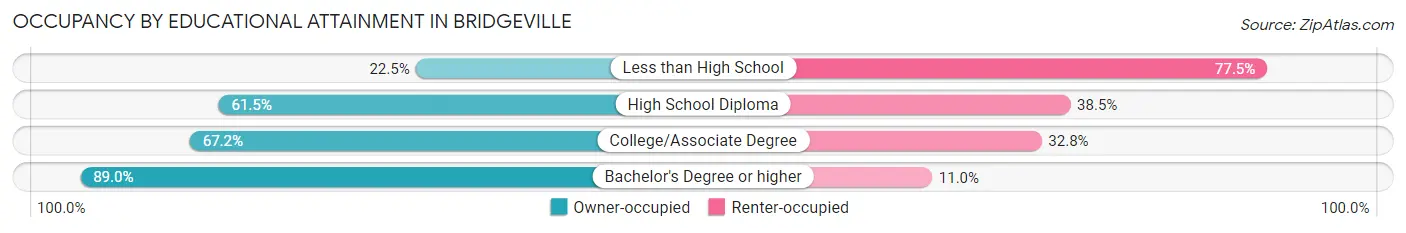
| Household Size | Owner-occupied | Renter-occupied |
| Less than High School | 36 (22.5%) | 124 (77.5%) |
| High School Diploma | 128 (61.5%) | 80 (38.5%) |
| College/Associate Degree | 195 (67.2%) | 95 (32.8%) |
| Bachelor's Degree or higher | 435 (89.0%) | 54 (11.0%) |
Occupancy by Age of Householder in Bridgeville
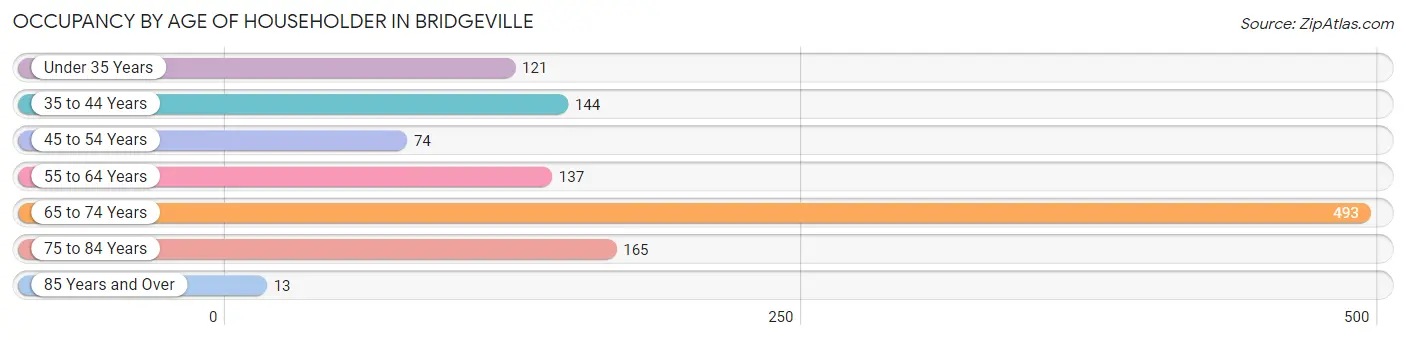
| Age Bracket | # Households | % Households |
| Under 35 Years | 121 | 10.5% |
| 35 to 44 Years | 144 | 12.6% |
| 45 to 54 Years | 74 | 6.5% |
| 55 to 64 Years | 137 | 11.9% |
| 65 to 74 Years | 493 | 43.0% |
| 75 to 84 Years | 165 | 14.4% |
| 85 Years and Over | 13 | 1.1% |
| Total | 1,147 | 100.0% |
Housing Finances in Bridgeville
Median Income by Occupancy in Bridgeville
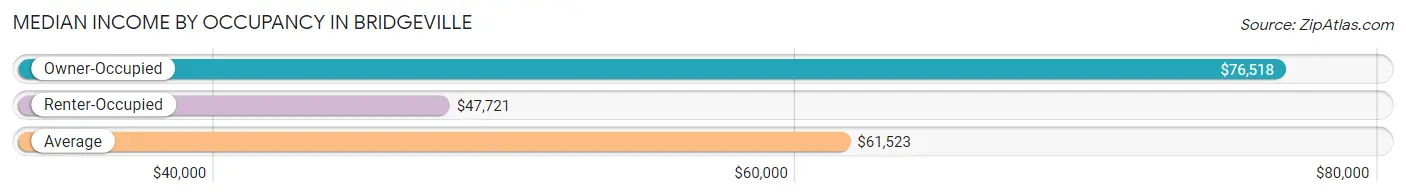
| Occupancy Type | # Households | Median Income |
| Owner-Occupied | 794 (69.2%) | $76,518 |
| Renter-Occupied | 353 (30.8%) | $47,721 |
| Average | 1,147 (100.0%) | $61,523 |
Occupancy by Householder Income Bracket in Bridgeville
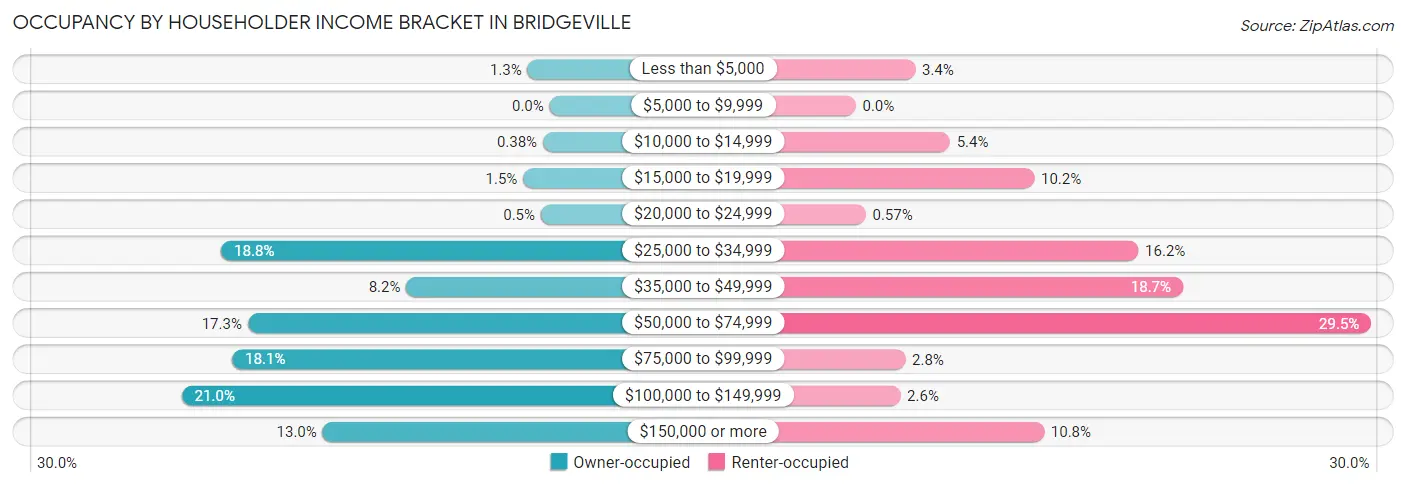
| Income Bracket | Owner-occupied | Renter-occupied |
| Less than $5,000 | 10 (1.3%) | 12 (3.4%) |
| $5,000 to $9,999 | 0 (0.0%) | 0 (0.0%) |
| $10,000 to $14,999 | 3 (0.4%) | 19 (5.4%) |
| $15,000 to $19,999 | 12 (1.5%) | 36 (10.2%) |
| $20,000 to $24,999 | 4 (0.5%) | 2 (0.6%) |
| $25,000 to $34,999 | 149 (18.8%) | 57 (16.2%) |
| $35,000 to $49,999 | 65 (8.2%) | 66 (18.7%) |
| $50,000 to $74,999 | 137 (17.2%) | 104 (29.5%) |
| $75,000 to $99,999 | 144 (18.1%) | 10 (2.8%) |
| $100,000 to $149,999 | 167 (21.0%) | 9 (2.5%) |
| $150,000 or more | 103 (13.0%) | 38 (10.8%) |
| Total | 794 (100.0%) | 353 (100.0%) |
Monthly Housing Cost Tiers in Bridgeville
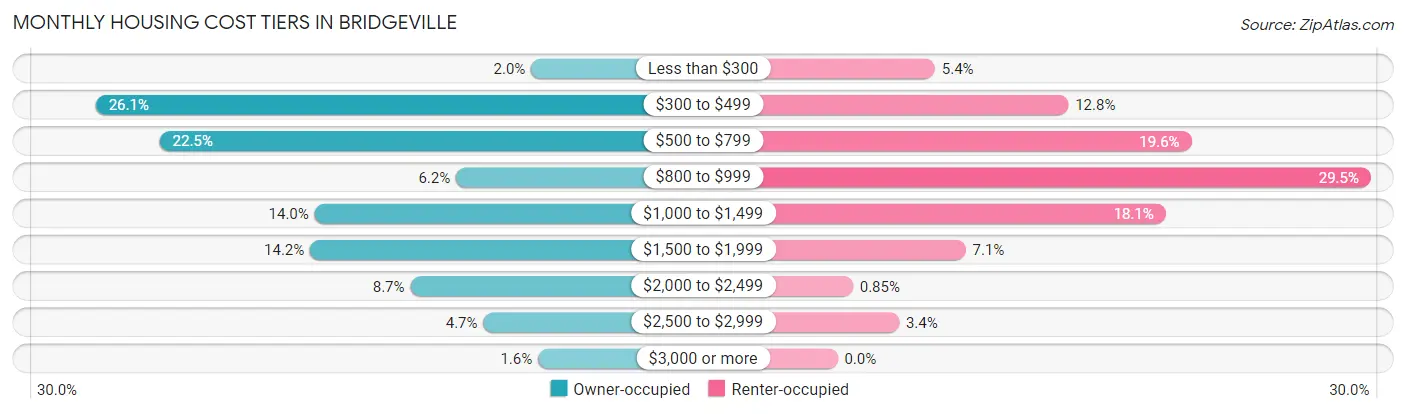
| Monthly Cost | Owner-occupied | Renter-occupied |
| Less than $300 | 16 (2.0%) | 19 (5.4%) |
| $300 to $499 | 207 (26.1%) | 45 (12.8%) |
| $500 to $799 | 179 (22.5%) | 69 (19.6%) |
| $800 to $999 | 49 (6.2%) | 104 (29.5%) |
| $1,000 to $1,499 | 111 (14.0%) | 64 (18.1%) |
| $1,500 to $1,999 | 113 (14.2%) | 25 (7.1%) |
| $2,000 to $2,499 | 69 (8.7%) | 3 (0.9%) |
| $2,500 to $2,999 | 37 (4.7%) | 12 (3.4%) |
| $3,000 or more | 13 (1.6%) | 0 (0.0%) |
| Total | 794 (100.0%) | 353 (100.0%) |
Physical Housing Characteristics in Bridgeville
Housing Structures in Bridgeville
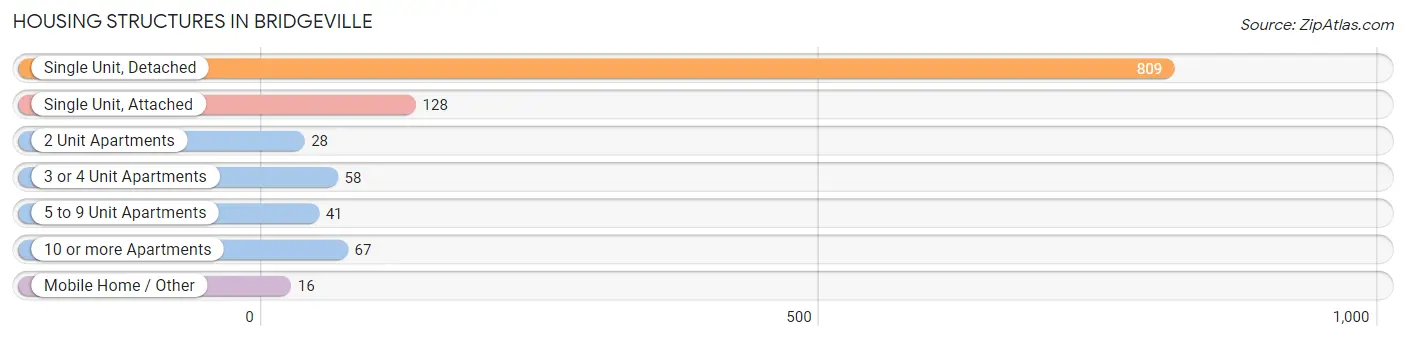
| Structure Type | # Housing Units | % Housing Units |
| Single Unit, Detached | 809 | 70.5% |
| Single Unit, Attached | 128 | 11.2% |
| 2 Unit Apartments | 28 | 2.4% |
| 3 or 4 Unit Apartments | 58 | 5.1% |
| 5 to 9 Unit Apartments | 41 | 3.6% |
| 10 or more Apartments | 67 | 5.8% |
| Mobile Home / Other | 16 | 1.4% |
| Total | 1,147 | 100.0% |
Housing Structures by Occupancy in Bridgeville
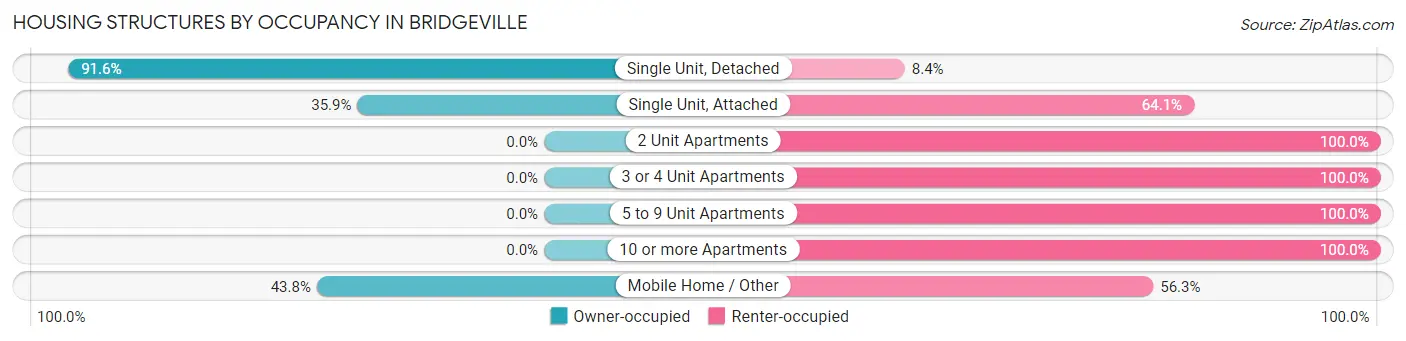
| Structure Type | Owner-occupied | Renter-occupied |
| Single Unit, Detached | 741 (91.6%) | 68 (8.4%) |
| Single Unit, Attached | 46 (35.9%) | 82 (64.1%) |
| 2 Unit Apartments | 0 (0.0%) | 28 (100.0%) |
| 3 or 4 Unit Apartments | 0 (0.0%) | 58 (100.0%) |
| 5 to 9 Unit Apartments | 0 (0.0%) | 41 (100.0%) |
| 10 or more Apartments | 0 (0.0%) | 67 (100.0%) |
| Mobile Home / Other | 7 (43.8%) | 9 (56.2%) |
| Total | 794 (69.2%) | 353 (30.8%) |
Housing Structures by Number of Rooms in Bridgeville
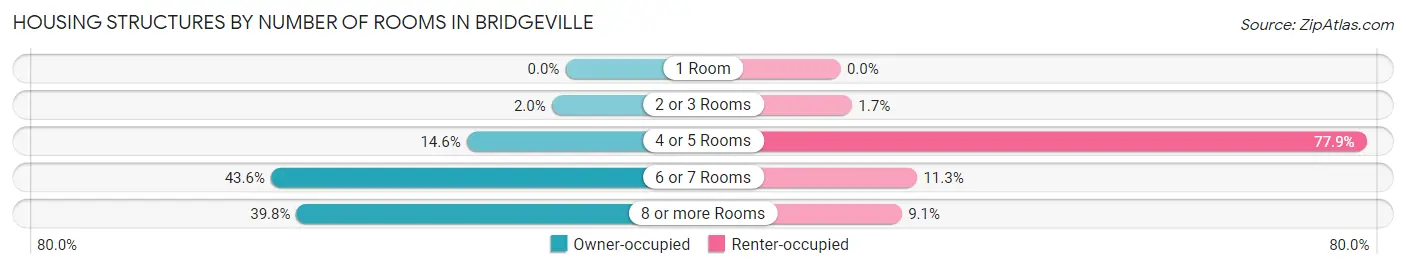
| Number of Rooms | Owner-occupied | Renter-occupied |
| 1 Room | 0 (0.0%) | 0 (0.0%) |
| 2 or 3 Rooms | 16 (2.0%) | 6 (1.7%) |
| 4 or 5 Rooms | 116 (14.6%) | 275 (77.9%) |
| 6 or 7 Rooms | 346 (43.6%) | 40 (11.3%) |
| 8 or more Rooms | 316 (39.8%) | 32 (9.1%) |
| Total | 794 (100.0%) | 353 (100.0%) |
Housing Structure by Heating Type in Bridgeville
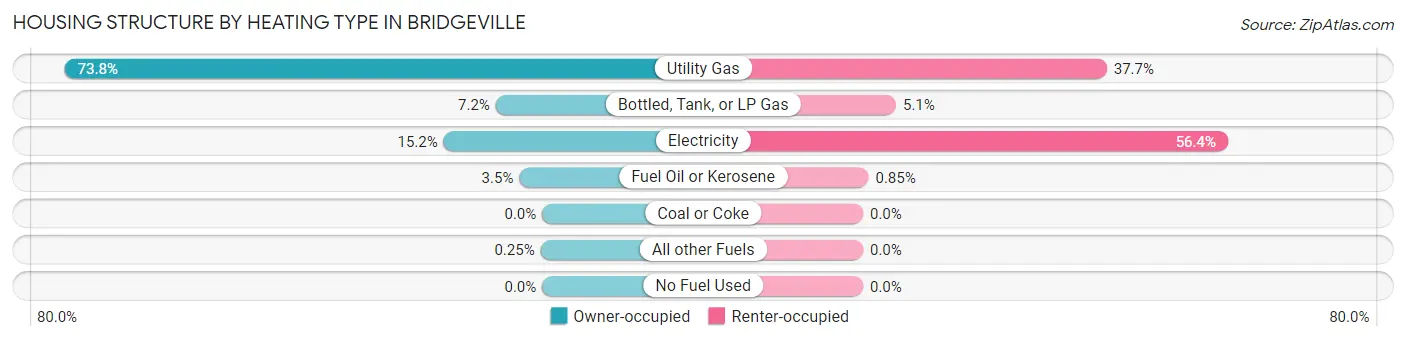
| Heating Type | Owner-occupied | Renter-occupied |
| Utility Gas | 586 (73.8%) | 133 (37.7%) |
| Bottled, Tank, or LP Gas | 57 (7.2%) | 18 (5.1%) |
| Electricity | 121 (15.2%) | 199 (56.4%) |
| Fuel Oil or Kerosene | 28 (3.5%) | 3 (0.9%) |
| Coal or Coke | 0 (0.0%) | 0 (0.0%) |
| All other Fuels | 2 (0.3%) | 0 (0.0%) |
| No Fuel Used | 0 (0.0%) | 0 (0.0%) |
| Total | 794 (100.0%) | 353 (100.0%) |
Household Vehicle Usage in Bridgeville
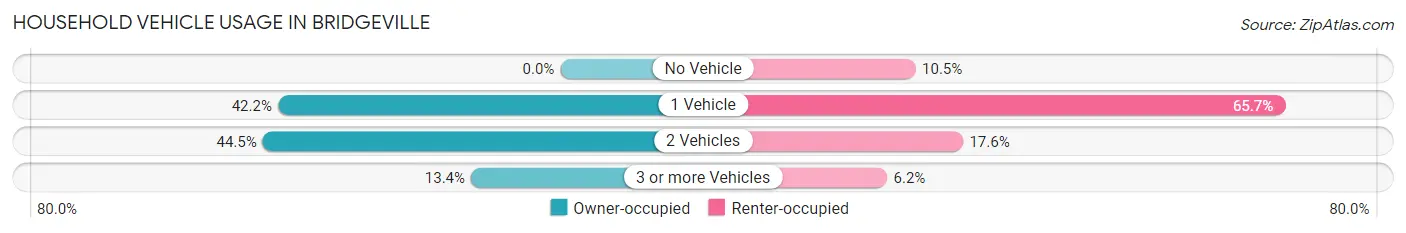
| Vehicles per Household | Owner-occupied | Renter-occupied |
| No Vehicle | 0 (0.0%) | 37 (10.5%) |
| 1 Vehicle | 335 (42.2%) | 232 (65.7%) |
| 2 Vehicles | 353 (44.5%) | 62 (17.6%) |
| 3 or more Vehicles | 106 (13.4%) | 22 (6.2%) |
| Total | 794 (100.0%) | 353 (100.0%) |
Real Estate & Mortgages in Bridgeville
Real Estate and Mortgage Overview in Bridgeville
| Characteristic | Without Mortgage | With Mortgage |
| Housing Units | 429 | 365 |
| Median Property Value | $355,500 | $336,300 |
| Median Household Income | $66,761 | $65 |
| Monthly Housing Costs | $496 | $13 |
| Real Estate Taxes | $2,608 | $4 |
Property Value by Mortgage Status in Bridgeville
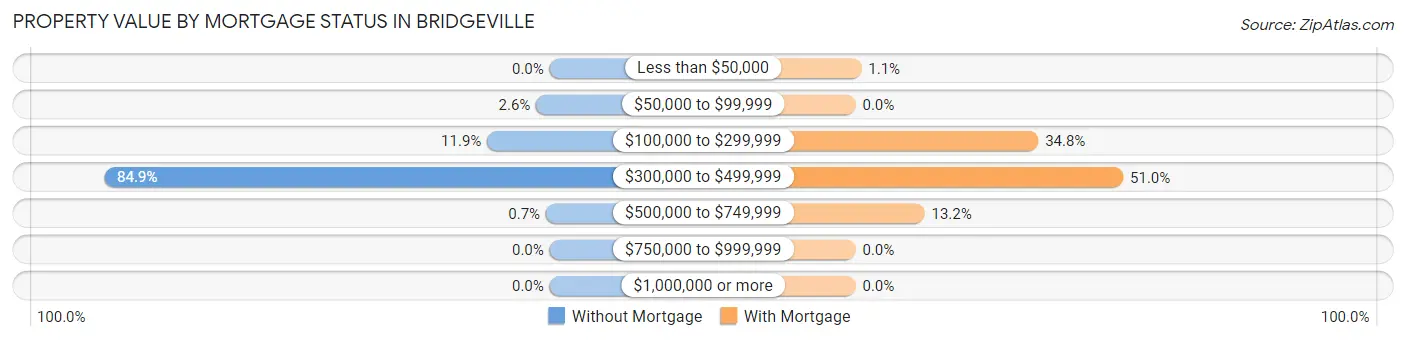
| Property Value | Without Mortgage | With Mortgage |
| Less than $50,000 | 0 (0.0%) | 4 (1.1%) |
| $50,000 to $99,999 | 11 (2.6%) | 0 (0.0%) |
| $100,000 to $299,999 | 51 (11.9%) | 127 (34.8%) |
| $300,000 to $499,999 | 364 (84.9%) | 186 (51.0%) |
| $500,000 to $749,999 | 3 (0.7%) | 48 (13.2%) |
| $750,000 to $999,999 | 0 (0.0%) | 0 (0.0%) |
| $1,000,000 or more | 0 (0.0%) | 0 (0.0%) |
| Total | 429 (100.0%) | 365 (100.0%) |
Household Income by Mortgage Status in Bridgeville
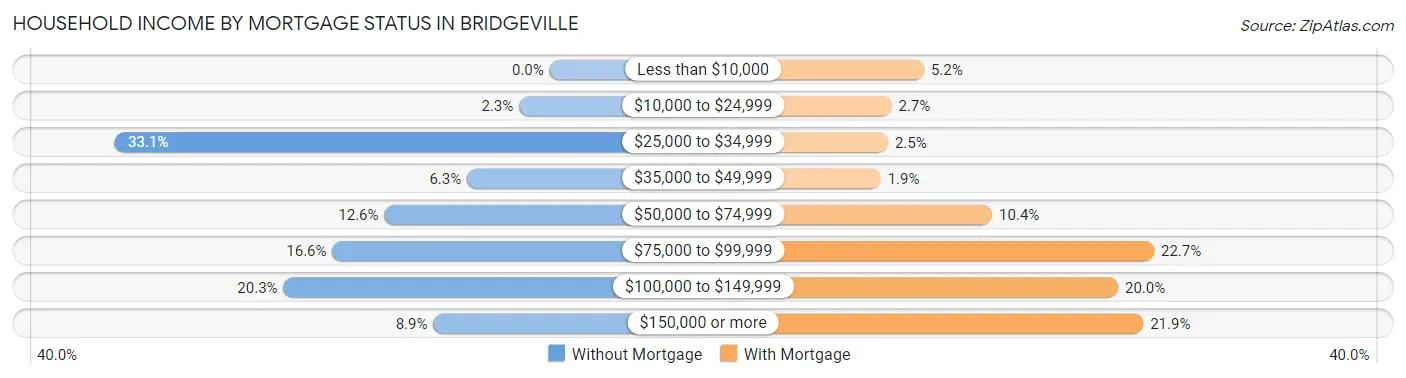
| Household Income | Without Mortgage | With Mortgage |
| Less than $10,000 | 0 (0.0%) | 19 (5.2%) |
| $10,000 to $24,999 | 10 (2.3%) | 10 (2.7%) |
| $25,000 to $34,999 | 142 (33.1%) | 9 (2.5%) |
| $35,000 to $49,999 | 27 (6.3%) | 7 (1.9%) |
| $50,000 to $74,999 | 54 (12.6%) | 38 (10.4%) |
| $75,000 to $99,999 | 71 (16.6%) | 83 (22.7%) |
| $100,000 to $149,999 | 87 (20.3%) | 73 (20.0%) |
| $150,000 or more | 38 (8.9%) | 80 (21.9%) |
| Total | 429 (100.0%) | 365 (100.0%) |
Property Value to Household Income Ratio in Bridgeville
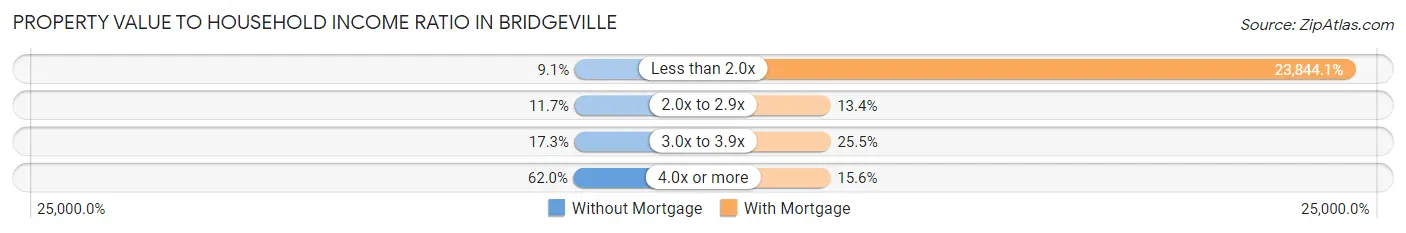
| Value-to-Income Ratio | Without Mortgage | With Mortgage |
| Less than 2.0x | 39 (9.1%) | 87,031 (23,844.1%) |
| 2.0x to 2.9x | 50 (11.7%) | 49 (13.4%) |
| 3.0x to 3.9x | 74 (17.2%) | 93 (25.5%) |
| 4.0x or more | 266 (62.0%) | 57 (15.6%) |
| Total | 429 (100.0%) | 365 (100.0%) |
Real Estate Taxes by Mortgage Status in Bridgeville
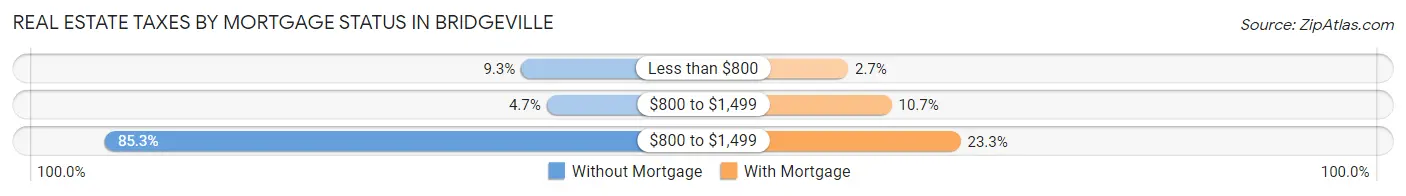
| Property Taxes | Without Mortgage | With Mortgage |
| Less than $800 | 40 (9.3%) | 10 (2.7%) |
| $800 to $1,499 | 20 (4.7%) | 39 (10.7%) |
| $800 to $1,499 | 366 (85.3%) | 85 (23.3%) |
| Total | 429 (100.0%) | 365 (100.0%) |
Health & Disability in Bridgeville
Health Insurance Coverage by Age in Bridgeville
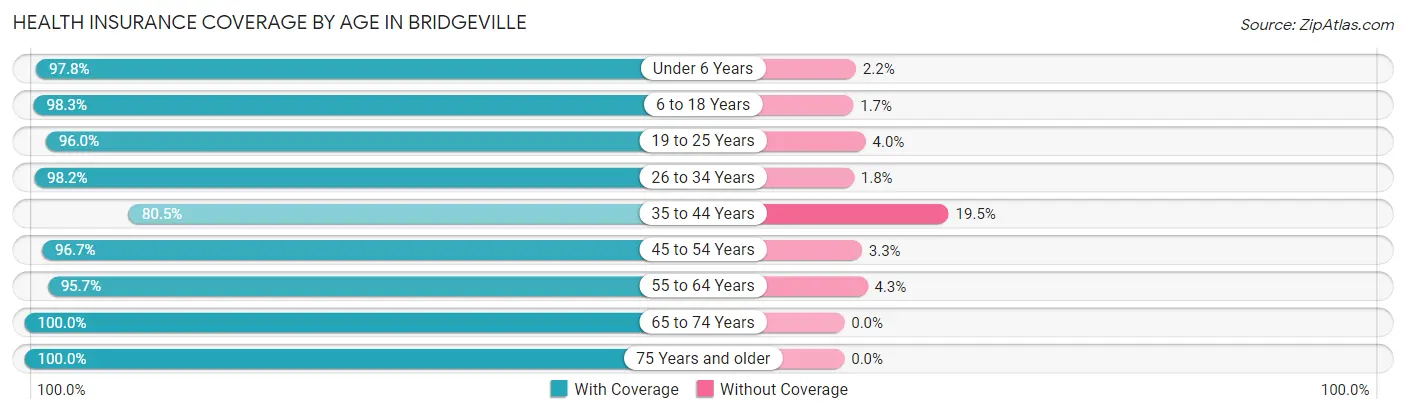
| Age Bracket | With Coverage | Without Coverage |
| Under 6 Years | 226 (97.8%) | 5 (2.2%) |
| 6 to 18 Years | 293 (98.3%) | 5 (1.7%) |
| 19 to 25 Years | 145 (96.0%) | 6 (4.0%) |
| 26 to 34 Years | 166 (98.2%) | 3 (1.8%) |
| 35 to 44 Years | 207 (80.5%) | 50 (19.5%) |
| 45 to 54 Years | 118 (96.7%) | 4 (3.3%) |
| 55 to 64 Years | 310 (95.7%) | 14 (4.3%) |
| 65 to 74 Years | 752 (100.0%) | 0 (0.0%) |
| 75 Years and older | 286 (100.0%) | 0 (0.0%) |
| Total | 2,503 (96.6%) | 87 (3.4%) |
Health Insurance Coverage by Citizenship Status in Bridgeville
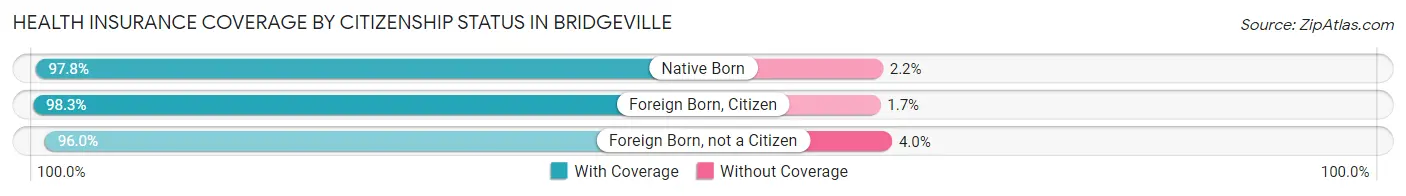
| Citizenship Status | With Coverage | Without Coverage |
| Native Born | 226 (97.8%) | 5 (2.2%) |
| Foreign Born, Citizen | 293 (98.3%) | 5 (1.7%) |
| Foreign Born, not a Citizen | 145 (96.0%) | 6 (4.0%) |
Health Insurance Coverage by Household Income in Bridgeville
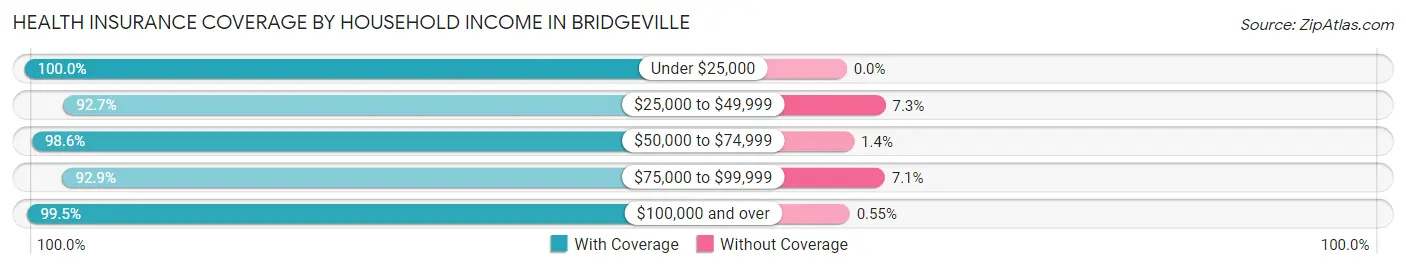
| Household Income | With Coverage | Without Coverage |
| Under $25,000 | 246 (100.0%) | 0 (0.0%) |
| $25,000 to $49,999 | 664 (92.7%) | 52 (7.3%) |
| $50,000 to $74,999 | 573 (98.6%) | 8 (1.4%) |
| $75,000 to $99,999 | 300 (92.9%) | 23 (7.1%) |
| $100,000 and over | 720 (99.5%) | 4 (0.5%) |
Public vs Private Health Insurance Coverage by Age in Bridgeville
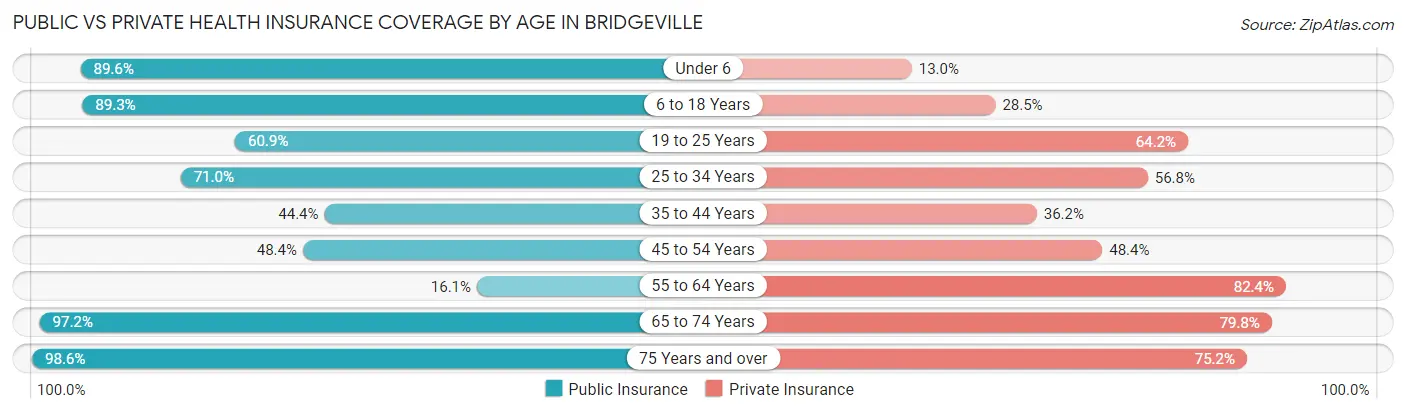
| Age Bracket | Public Insurance | Private Insurance |
| Under 6 | 207 (89.6%) | 30 (13.0%) |
| 6 to 18 Years | 266 (89.3%) | 85 (28.5%) |
| 19 to 25 Years | 92 (60.9%) | 97 (64.2%) |
| 25 to 34 Years | 120 (71.0%) | 96 (56.8%) |
| 35 to 44 Years | 114 (44.4%) | 93 (36.2%) |
| 45 to 54 Years | 59 (48.4%) | 59 (48.4%) |
| 55 to 64 Years | 52 (16.1%) | 267 (82.4%) |
| 65 to 74 Years | 731 (97.2%) | 600 (79.8%) |
| 75 Years and over | 282 (98.6%) | 215 (75.2%) |
| Total | 1,923 (74.3%) | 1,542 (59.5%) |
Disability Status by Sex by Age in Bridgeville
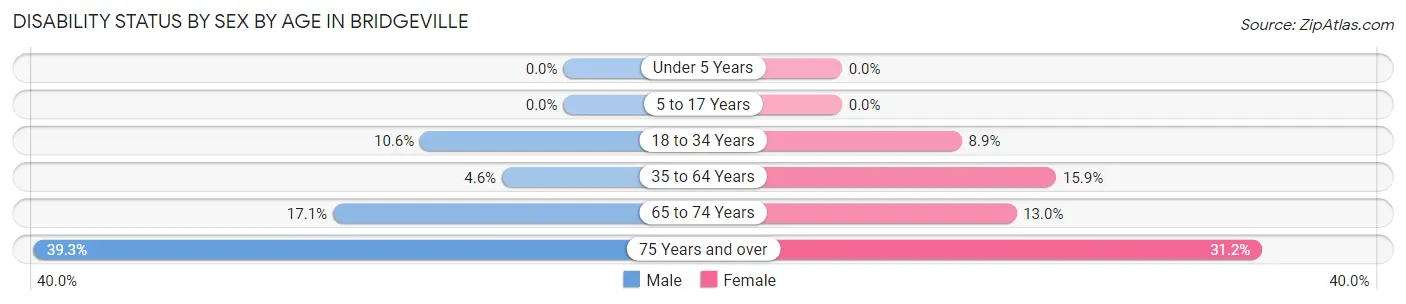
| Age Bracket | Male | Female |
| Under 5 Years | 0 (0.0%) | 0 (0.0%) |
| 5 to 17 Years | 0 (0.0%) | 0 (0.0%) |
| 18 to 34 Years | 15 (10.6%) | 17 (8.9%) |
| 35 to 64 Years | 16 (4.6%) | 56 (15.9%) |
| 65 to 74 Years | 52 (17.1%) | 58 (13.0%) |
| 75 Years and over | 57 (39.3%) | 44 (31.2%) |
Disability Class by Sex by Age in Bridgeville
Disability Class: Hearing Difficulty
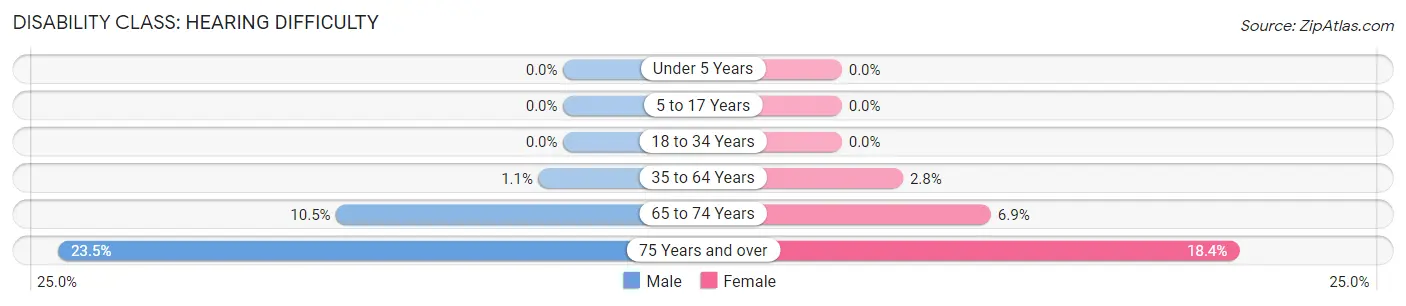
| Age Bracket | Male | Female |
| Under 5 Years | 0 (0.0%) | 0 (0.0%) |
| 5 to 17 Years | 0 (0.0%) | 0 (0.0%) |
| 18 to 34 Years | 0 (0.0%) | 0 (0.0%) |
| 35 to 64 Years | 4 (1.1%) | 10 (2.8%) |
| 65 to 74 Years | 32 (10.5%) | 31 (6.9%) |
| 75 Years and over | 34 (23.4%) | 26 (18.4%) |
Disability Class: Vision Difficulty
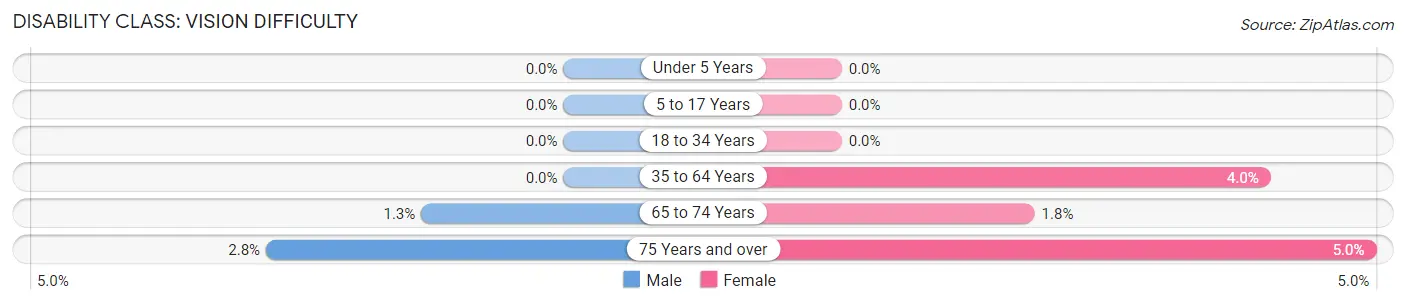
| Age Bracket | Male | Female |
| Under 5 Years | 0 (0.0%) | 0 (0.0%) |
| 5 to 17 Years | 0 (0.0%) | 0 (0.0%) |
| 18 to 34 Years | 0 (0.0%) | 0 (0.0%) |
| 35 to 64 Years | 0 (0.0%) | 14 (4.0%) |
| 65 to 74 Years | 4 (1.3%) | 8 (1.8%) |
| 75 Years and over | 4 (2.8%) | 7 (5.0%) |
Disability Class: Cognitive Difficulty
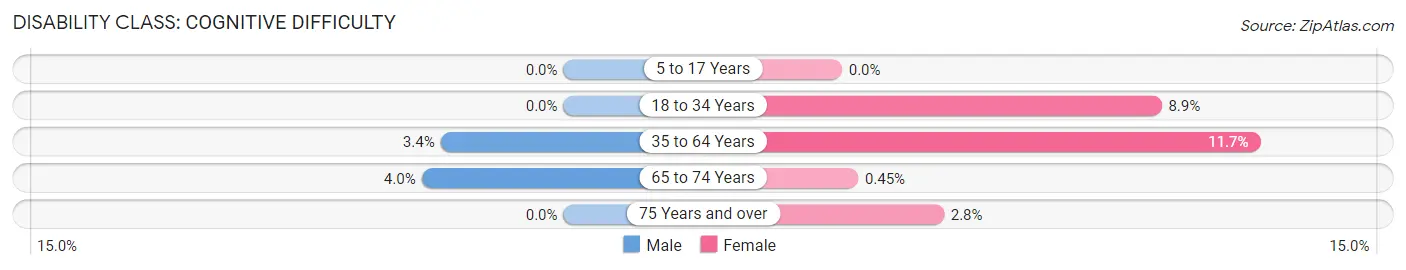
| Age Bracket | Male | Female |
| 5 to 17 Years | 0 (0.0%) | 0 (0.0%) |
| 18 to 34 Years | 0 (0.0%) | 17 (8.9%) |
| 35 to 64 Years | 12 (3.4%) | 41 (11.7%) |
| 65 to 74 Years | 12 (4.0%) | 2 (0.4%) |
| 75 Years and over | 0 (0.0%) | 4 (2.8%) |
Disability Class: Ambulatory Difficulty
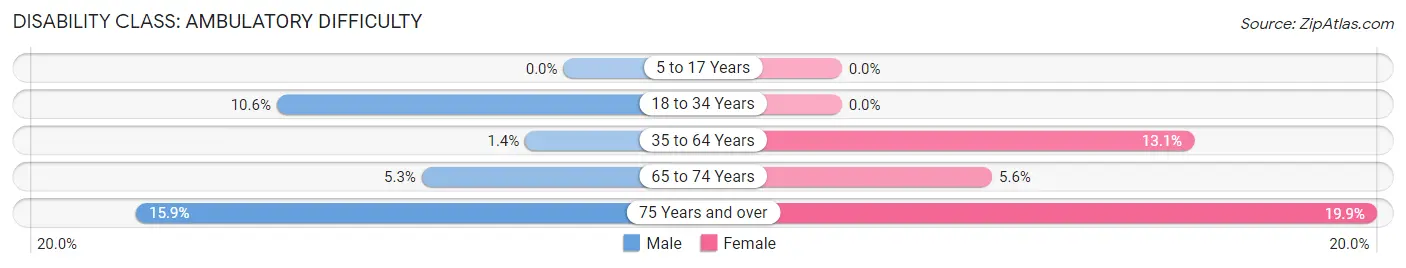
| Age Bracket | Male | Female |
| 5 to 17 Years | 0 (0.0%) | 0 (0.0%) |
| 18 to 34 Years | 15 (10.6%) | 0 (0.0%) |
| 35 to 64 Years | 5 (1.4%) | 46 (13.1%) |
| 65 to 74 Years | 16 (5.3%) | 25 (5.6%) |
| 75 Years and over | 23 (15.9%) | 28 (19.9%) |
Disability Class: Self-Care Difficulty
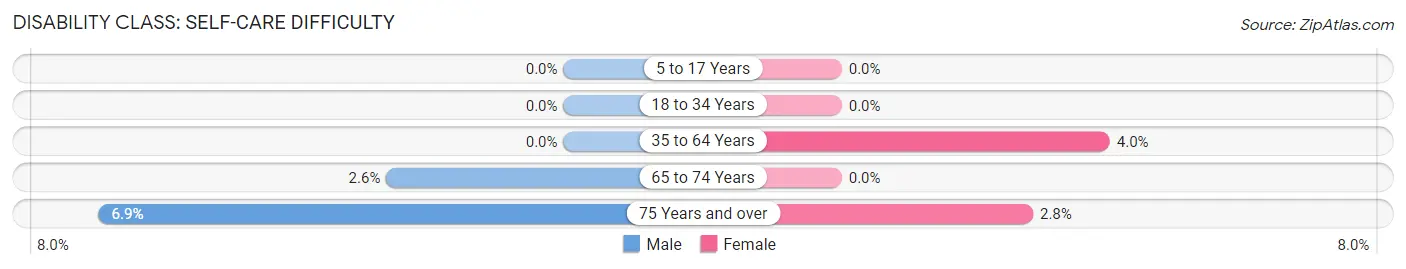
| Age Bracket | Male | Female |
| 5 to 17 Years | 0 (0.0%) | 0 (0.0%) |
| 18 to 34 Years | 0 (0.0%) | 0 (0.0%) |
| 35 to 64 Years | 0 (0.0%) | 14 (4.0%) |
| 65 to 74 Years | 8 (2.6%) | 0 (0.0%) |
| 75 Years and over | 10 (6.9%) | 4 (2.8%) |
Technology Access in Bridgeville
Computing Device Access in Bridgeville
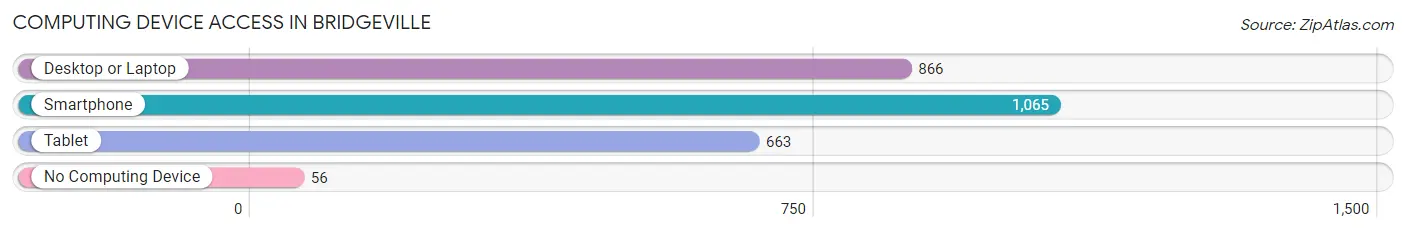
| Device Type | # Households | % Households |
| Desktop or Laptop | 866 | 75.5% |
| Smartphone | 1,065 | 92.8% |
| Tablet | 663 | 57.8% |
| No Computing Device | 56 | 4.9% |
| Total | 1,147 | 100.0% |
Internet Access in Bridgeville
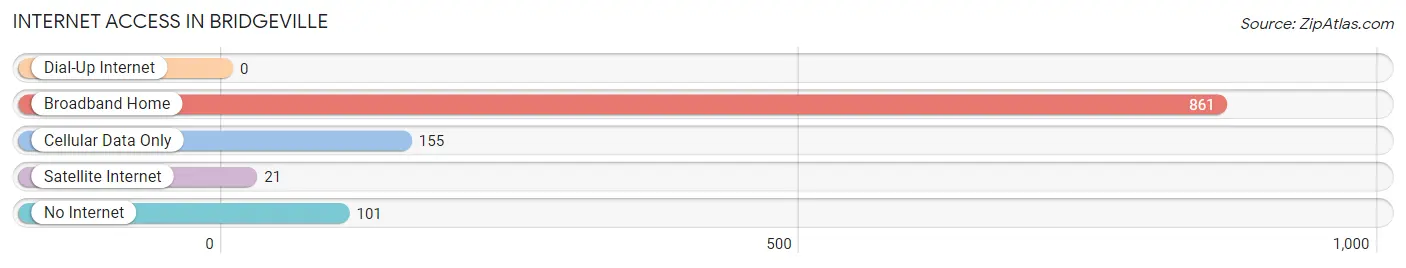
| Internet Type | # Households | % Households |
| Dial-Up Internet | 0 | 0.0% |
| Broadband Home | 861 | 75.1% |
| Cellular Data Only | 155 | 13.5% |
| Satellite Internet | 21 | 1.8% |
| No Internet | 101 | 8.8% |
| Total | 1,147 | 100.0% |
Bridgeville Summary
Bridgeville is a town located in Sussex County, Delaware, United States. It is located in the southern part of the state, about 25 miles south of Dover, the state capital. The town was founded in 1794 and incorporated in 1831. As of the 2010 census, the population of Bridgeville was 1,393.
Geography
Bridgeville is located at 38°45'25" North, 75°37'17" West (38.7569, -75.6214). It is situated in the southern part of Sussex County, about 25 miles south of Dover, the state capital. The town is located in the Delmarva Peninsula, which is bordered by the Chesapeake Bay to the west and the Atlantic Ocean to the east. The town is situated on the Nanticoke River, which flows through the town and is a major source of water for the area.
The town has a total area of 1.2 square miles, all of which is land. The town is located in a rural area, with the nearest major city being Salisbury, Maryland, which is about 25 miles to the east.
Demographics
As of the 2010 census, there were 1,393 people, 545 households, and 382 families residing in the town. The population density was 1,164.2 people per square mile. There were 590 housing units at an average density of 492.5 per square mile. The racial makeup of the town was 81.2% White, 14.2% African American, 0.4% Native American, 0.6% Asian, 0.1% Pacific Islander, 1.3% from other races, and 2.2% from two or more races. Hispanic or Latino of any race were 3.2% of the population.
There were 545 households, out of which 28.2% had children under the age of 18 living with them, 51.3% were married couples living together, 11.7% had a female householder with no husband present, and 32.2% were non-families. 27.3% of all households were made up of individuals, and 12.2% had someone living alone who was 65 years of age or older. The average household size was 2.55 and the average family size was 3.09.
In the town, the population was spread out, with 24.2% under the age of 18, 7.2% from 18 to 24, 25.2% from 25 to 44, 27.2% from 45 to 64, and 16.2% who were 65 years of age or older. The median age was 40 years. For every 100 females, there were 94.2 males. For every 100 females age 18 and over, there were 91.2 males.
The median income for a household in the town was $41,250, and the median income for a family was $48,750. Males had a median income of $35,000 versus $25,000 for females. The per capita income for the town was $19,945. About 8.2% of families and 10.2% of the population were below the poverty line, including 14.2% of those under age 18 and 8.2% of those age 65 or over.
Economy
The economy of Bridgeville is largely based on agriculture. The town is home to several large farms, which produce a variety of crops, including corn, soybeans, wheat, and hay. The town is also home to several poultry farms, which produce eggs and chicken for the local market.
The town is also home to several small businesses, including restaurants, retail stores, and service providers. The town is also home to several manufacturing companies, which produce a variety of products, including furniture, clothing, and electronics.
The town is also home to several tourist attractions, including the Nanticoke River Museum, the Bridgeville Historical Society, and the Bridgeville Speedway. The town is also home to several parks, including the Bridgeville State Park and the Nanticoke River Wildlife Area.
Conclusion
Bridgeville is a small town located in Sussex County, Delaware. It is situated in the southern part of the state, about 25 miles south of Dover, the state capital. The town was founded in 1794 and incorporated in 1831. As of the 2010 census, the population of Bridgeville was 1,393. The town has a total area of 1.2 square miles, all of which is land. The town is located in a rural area, with the nearest major city being Salisbury, Maryland, which is about 25 miles to the east.
The economy of Bridgeville is largely based on agriculture. The town is home to several large farms, which produce a variety of crops, including corn, soybeans, wheat, and hay. The town is also home to several poultry farms, which produce eggs and chicken for the local market. The town is also home to several small businesses, including restaurants, retail stores, and service providers. The town is also home to several manufacturing companies, which produce a variety of products, including furniture, clothing, and electronics. The town is also home to several tourist attractions, including the Nanticoke River Museum, the Bridgeville Historical Society, and the Bridgeville Speedway.
Common Questions
What is Per Capita Income in Bridgeville?
Per Capita income in Bridgeville is $42,044.
What is the Median Family Income in Bridgeville?
Median Family Income in Bridgeville is $76,295.
What is the Median Household income in Bridgeville?
Median Household Income in Bridgeville is $61,523.
What is Income or Wage Gap in Bridgeville?
Income or Wage Gap in Bridgeville is 11.4%.
Women in Bridgeville earn 88.6 cents for every dollar earned by a man.
What is Inequality or Gini Index in Bridgeville?
Inequality or Gini Index in Bridgeville is 0.46.
What is the Total Population of Bridgeville?
Total Population of Bridgeville is 2,590.
What is the Total Male Population of Bridgeville?
Total Male Population of Bridgeville is 1,275.
What is the Total Female Population of Bridgeville?
Total Female Population of Bridgeville is 1,315.
What is the Ratio of Males per 100 Females in Bridgeville?
There are 96.96 Males per 100 Females in Bridgeville.
What is the Ratio of Females per 100 Males in Bridgeville?
There are 103.14 Females per 100 Males in Bridgeville.
What is the Median Population Age in Bridgeville?
Median Population Age in Bridgeville is 57.3 Years.
What is the Average Family Size in Bridgeville
Average Family Size in Bridgeville is 2.6 People.
What is the Average Household Size in Bridgeville
Average Household Size in Bridgeville is 2.3 People.
How Large is the Labor Force in Bridgeville?
There are 873 People in the Labor Forcein in Bridgeville.
What is the Percentage of People in the Labor Force in Bridgeville?
41.5% of People are in the Labor Force in Bridgeville.
What is the Unemployment Rate in Bridgeville?
Unemployment Rate in Bridgeville is 7.6%.