Ellendale, DE Map & Demographics
Ellendale Map
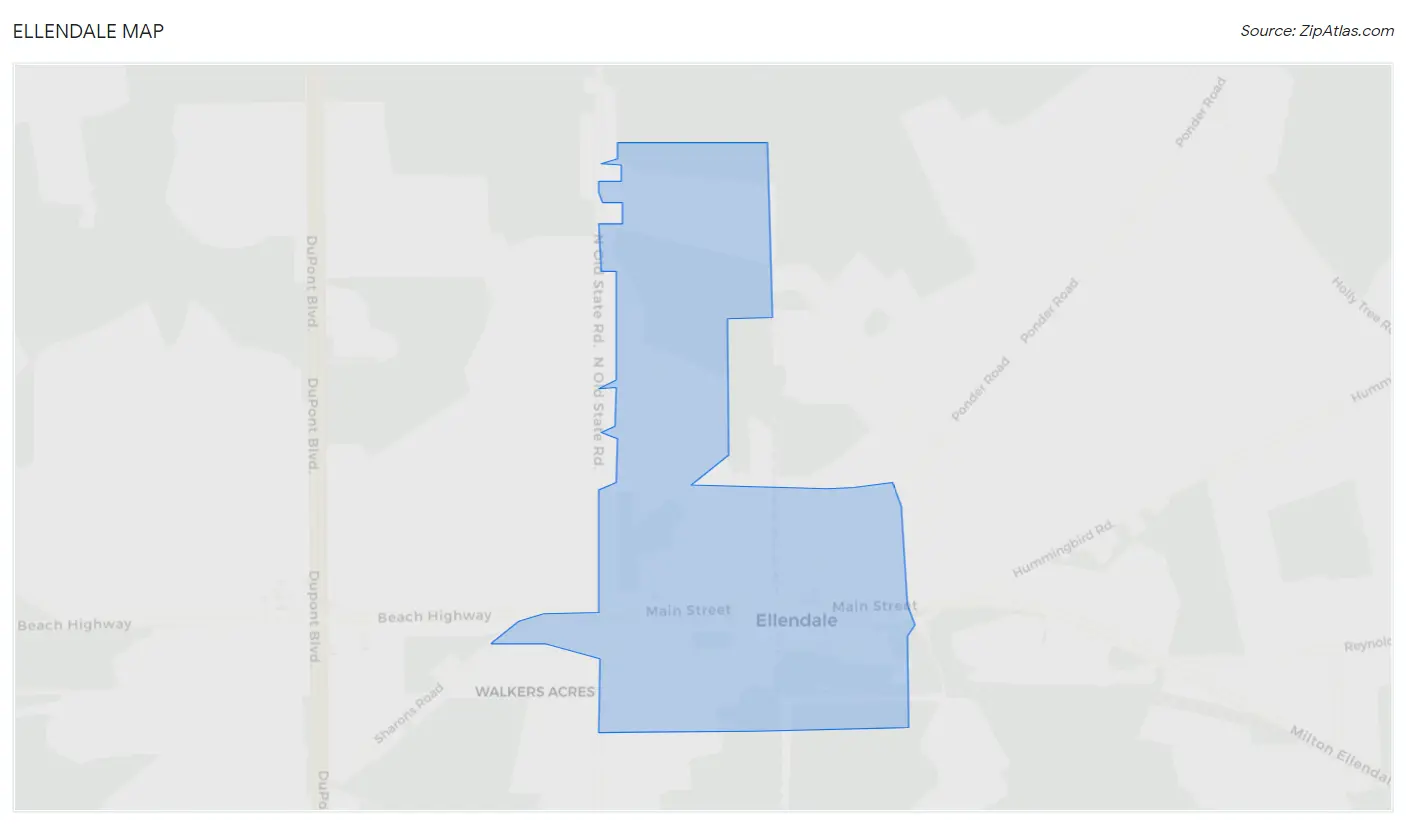
Ellendale Overview
$20,258
PER CAPITA INCOME
$74,688
AVG FAMILY INCOME
$64,886
AVG HOUSEHOLD INCOME
34.4%
WAGE / INCOME GAP [ % ]
65.6¢/ $1
WAGE / INCOME GAP [ $ ]
0.33
INEQUALITY / GINI INDEX
609
TOTAL POPULATION
356
MALE POPULATION
253
FEMALE POPULATION
140.71
MALES / 100 FEMALES
71.07
FEMALES / 100 MALES
17.4
MEDIAN AGE
4.1
AVG FAMILY SIZE
3.6
AVG HOUSEHOLD SIZE
189
LABOR FORCE [ PEOPLE ]
59.6%
PERCENT IN LABOR FORCE
Ellendale Zip Codes
Ellendale Area Codes
Income in Ellendale
Income Overview in Ellendale
Per Capita Income in Ellendale is $20,258, while median incomes of families and households are $74,688 and $64,886 respectively.
| Characteristic | Number | Measure |
| Per Capita Income | 609 | $20,258 |
| Median Family Income | 139 | $74,688 |
| Mean Family Income | 139 | $66,499 |
| Median Household Income | 169 | $64,886 |
| Mean Household Income | 169 | $69,475 |
| Income Deficit | 139 | $0 |
| Wage / Income Gap (%) | 609 | 34.42% |
| Wage / Income Gap ($) | 609 | 65.58¢ per $1 |
| Gini / Inequality Index | 609 | 0.33 |
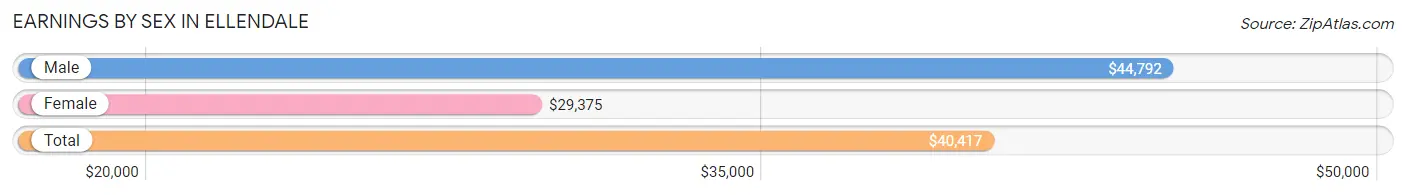
Earnings by Sex in Ellendale
Average Earnings in Ellendale are $40,417, $44,792 for men and $29,375 for women, a difference of 34.4%.
| Sex | Number | Average Earnings |
| Male | 91 (46.2%) | $44,792 |
| Female | 106 (53.8%) | $29,375 |
| Total | 197 (100.0%) | $40,417 |
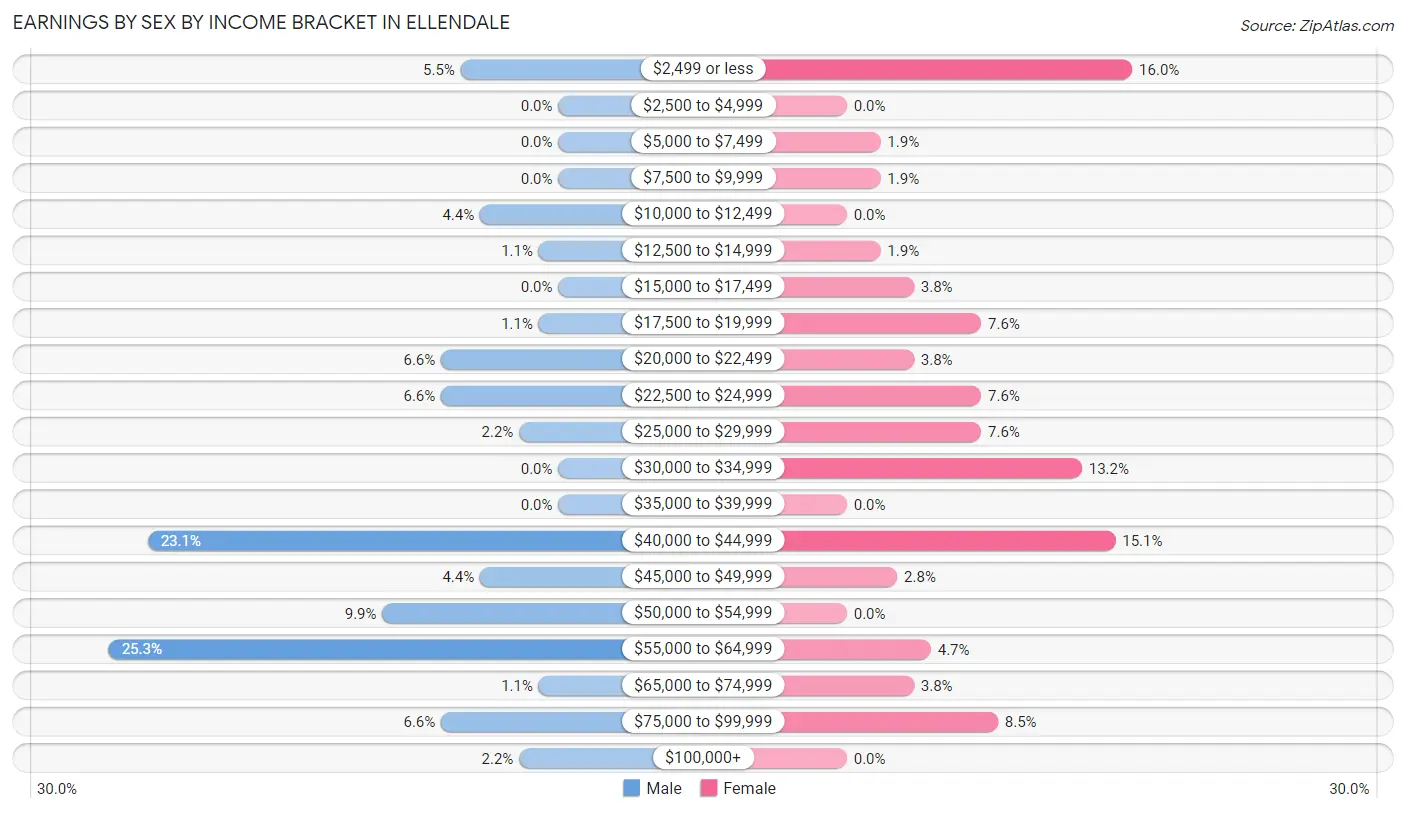
Earnings by Sex by Income Bracket in Ellendale
The most common earnings brackets in Ellendale are $55,000 to $64,999 for men (23 | 25.3%) and $2,499 or less for women (17 | 16.0%).
| Income | Male | Female |
| $2,499 or less | 5 (5.5%) | 17 (16.0%) |
| $2,500 to $4,999 | 0 (0.0%) | 0 (0.0%) |
| $5,000 to $7,499 | 0 (0.0%) | 2 (1.9%) |
| $7,500 to $9,999 | 0 (0.0%) | 2 (1.9%) |
| $10,000 to $12,499 | 4 (4.4%) | 0 (0.0%) |
| $12,500 to $14,999 | 1 (1.1%) | 2 (1.9%) |
| $15,000 to $17,499 | 0 (0.0%) | 4 (3.8%) |
| $17,500 to $19,999 | 1 (1.1%) | 8 (7.5%) |
| $20,000 to $22,499 | 6 (6.6%) | 4 (3.8%) |
| $22,500 to $24,999 | 6 (6.6%) | 8 (7.5%) |
| $25,000 to $29,999 | 2 (2.2%) | 8 (7.5%) |
| $30,000 to $34,999 | 0 (0.0%) | 14 (13.2%) |
| $35,000 to $39,999 | 0 (0.0%) | 0 (0.0%) |
| $40,000 to $44,999 | 21 (23.1%) | 16 (15.1%) |
| $45,000 to $49,999 | 4 (4.4%) | 3 (2.8%) |
| $50,000 to $54,999 | 9 (9.9%) | 0 (0.0%) |
| $55,000 to $64,999 | 23 (25.3%) | 5 (4.7%) |
| $65,000 to $74,999 | 1 (1.1%) | 4 (3.8%) |
| $75,000 to $99,999 | 6 (6.6%) | 9 (8.5%) |
| $100,000+ | 2 (2.2%) | 0 (0.0%) |
| Total | 91 (100.0%) | 106 (100.0%) |
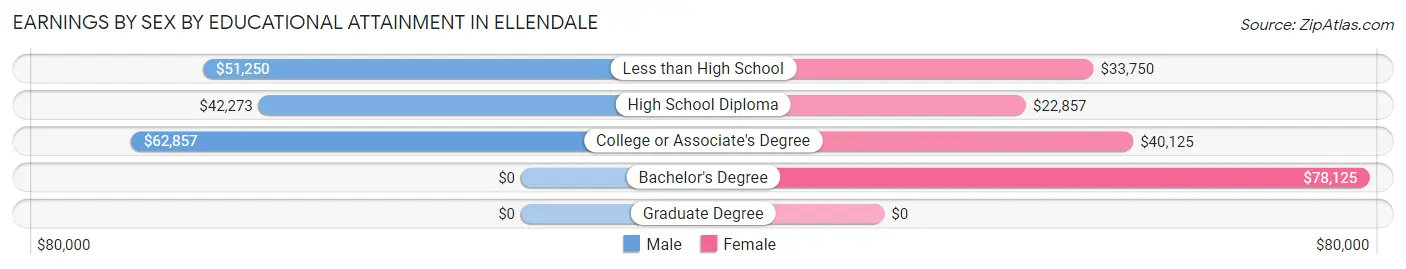
Earnings by Sex by Educational Attainment in Ellendale
Average earnings in Ellendale are $46,250 for men and $31,458 for women, a difference of 32.0%. Men with an educational attainment of college or associate's degree enjoy the highest average annual earnings of $62,857, while those with high school diploma education earn the least with $42,273. Women with an educational attainment of bachelor's degree earn the most with the average annual earnings of $78,125, while those with high school diploma education have the smallest earnings of $22,857.
| Educational Attainment | Male Income | Female Income |
| Less than High School | $51,250 | $33,750 |
| High School Diploma | $42,273 | $22,857 |
| College or Associate's Degree | $62,857 | $40,125 |
| Bachelor's Degree | - | - |
| Graduate Degree | - | - |
| Total | $46,250 | $31,458 |
Family Income in Ellendale
Family Income Brackets in Ellendale
According to the Ellendale family income data, there are 52 families falling into the $75,000 to $99,999 income range, which is the most common income bracket and makes up 37.4% of all families. Conversely, the $200,000+ income bracket is the least frequent group with only 1 families (0.7%) belonging to this category.
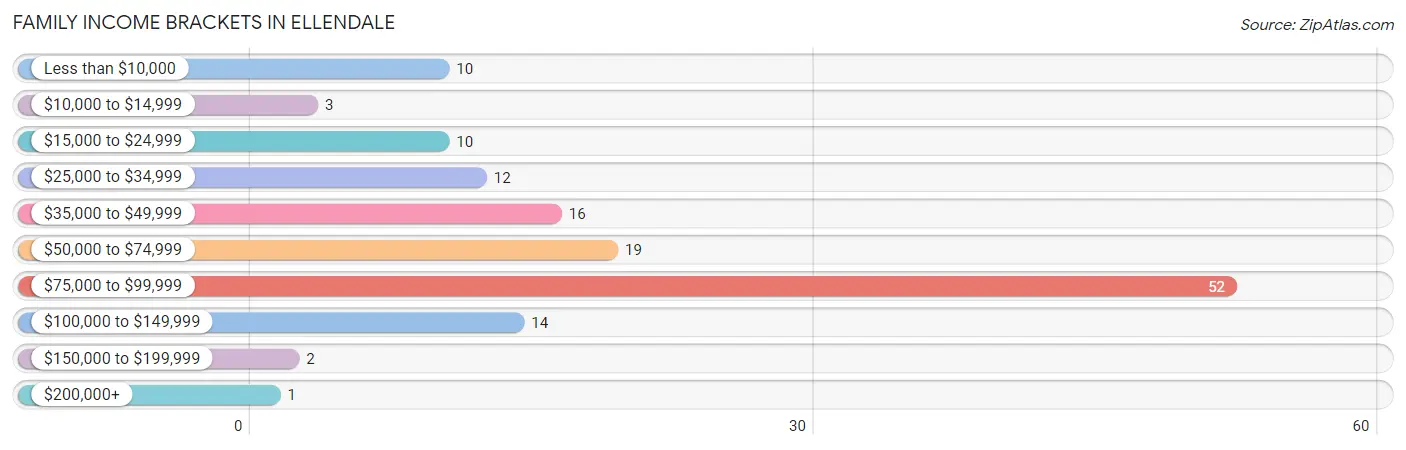
| Income Bracket | # Families | % Families |
| Less than $10,000 | 10 | 7.2% |
| $10,000 to $14,999 | 3 | 2.2% |
| $15,000 to $24,999 | 10 | 7.2% |
| $25,000 to $34,999 | 12 | 8.6% |
| $35,000 to $49,999 | 16 | 11.5% |
| $50,000 to $74,999 | 19 | 13.7% |
| $75,000 to $99,999 | 52 | 37.4% |
| $100,000 to $149,999 | 14 | 10.1% |
| $150,000 to $199,999 | 2 | 1.4% |
| $200,000+ | 1 | 0.7% |
Family Income by Famaliy Size in Ellendale
2-person families (44 | 31.7%) account for the highest median family income in Ellendale with $83,958 per family, while 2-person families (44 | 31.7%) have the highest median income of $41,979 per family member.
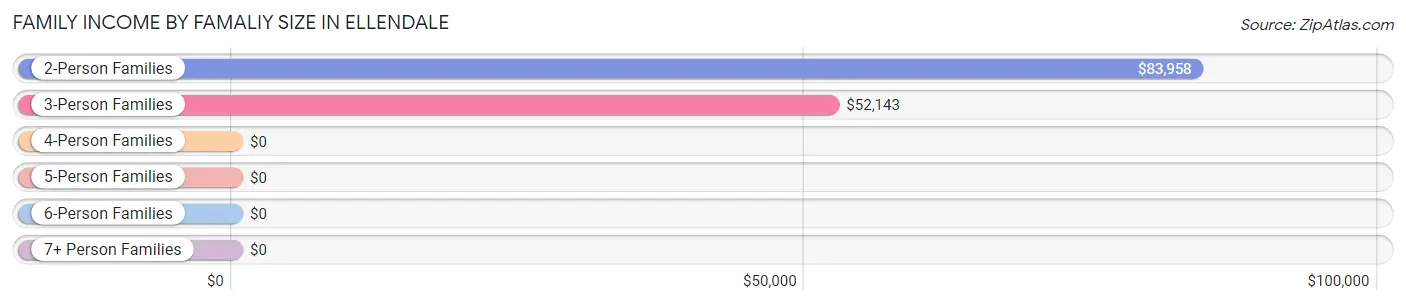
| Income Bracket | # Families | Median Income |
| 2-Person Families | 44 (31.7%) | $83,958 |
| 3-Person Families | 38 (27.3%) | $52,143 |
| 4-Person Families | 37 (26.6%) | $0 |
| 5-Person Families | 13 (9.3%) | $0 |
| 6-Person Families | 6 (4.3%) | $0 |
| 7+ Person Families | 1 (0.7%) | $0 |
| Total | 139 (100.0%) | $74,688 |
Family Income by Number of Earners in Ellendale
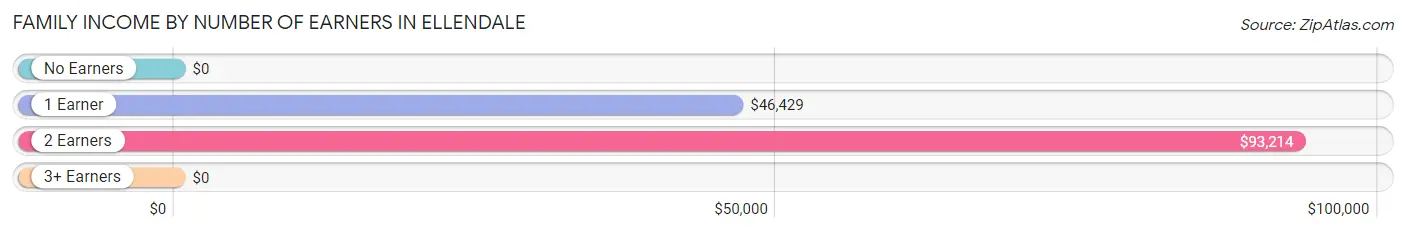
| Number of Earners | # Families | Median Income |
| No Earners | 16 (11.5%) | $0 |
| 1 Earner | 76 (54.7%) | $46,429 |
| 2 Earners | 44 (31.7%) | $93,214 |
| 3+ Earners | 3 (2.2%) | $0 |
| Total | 139 (100.0%) | $74,688 |
Household Income in Ellendale
Household Income Brackets in Ellendale
With 50 households falling in the category, the $75,000 to $99,999 income range is the most frequent in Ellendale, accounting for 29.6% of all households. In contrast, only 1 households (0.6%) fall into the $200,000+ income bracket, making it the least populous group.
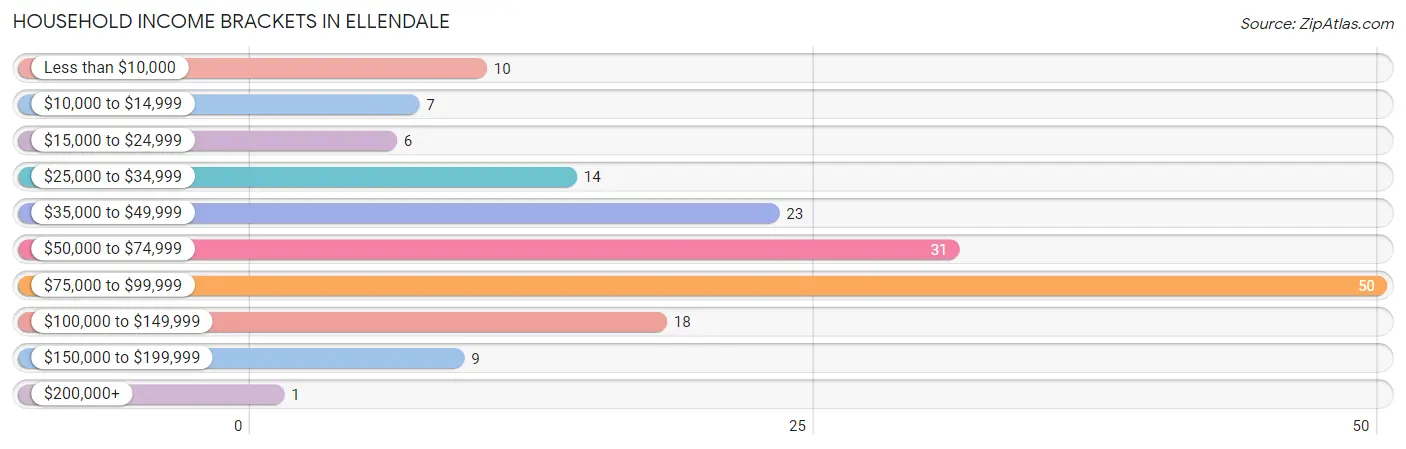
| Income Bracket | # Households | % Households |
| Less than $10,000 | 10 | 5.9% |
| $10,000 to $14,999 | 7 | 4.1% |
| $15,000 to $24,999 | 6 | 3.6% |
| $25,000 to $34,999 | 14 | 8.3% |
| $35,000 to $49,999 | 23 | 13.6% |
| $50,000 to $74,999 | 31 | 18.3% |
| $75,000 to $99,999 | 50 | 29.6% |
| $100,000 to $149,999 | 18 | 10.7% |
| $150,000 to $199,999 | 9 | 5.3% |
| $200,000+ | 1 | 0.6% |
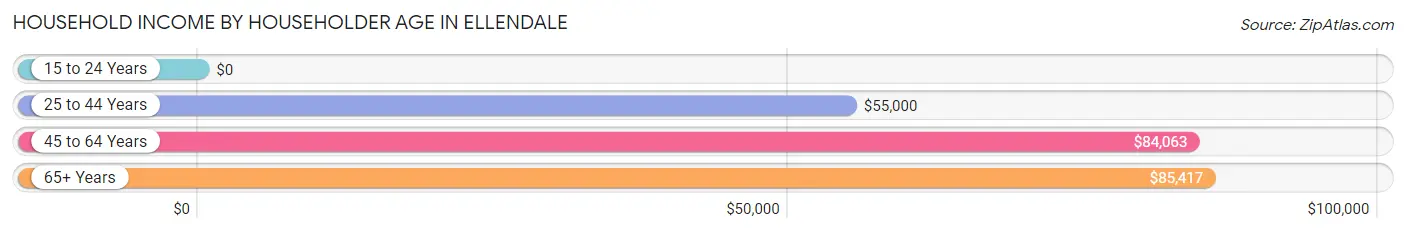
Household Income by Householder Age in Ellendale
The median household income in Ellendale is $64,886, with the highest median household income of $85,417 found in the 65+ years age bracket for the primary householder. A total of 30 households (17.7%) fall into this category.
| Income Bracket | # Households | Median Income |
| 15 to 24 Years | 0 (0.0%) | $0 |
| 25 to 44 Years | 82 (48.5%) | $55,000 |
| 45 to 64 Years | 57 (33.7%) | $84,063 |
| 65+ Years | 30 (17.7%) | $85,417 |
| Total | 169 (100.0%) | $64,886 |
Poverty in Ellendale
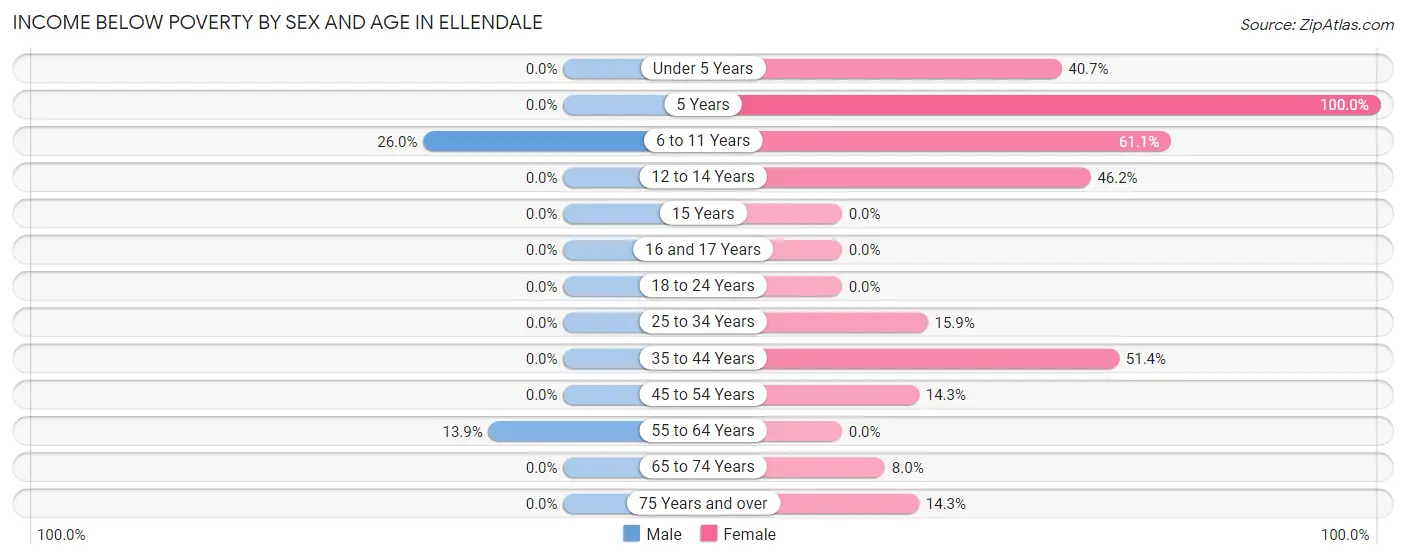
Income Below Poverty by Sex and Age in Ellendale
With 5.1% poverty level for males and 28.5% for females among the residents of Ellendale, 6 to 11 year old males and 5 year old females are the most vulnerable to poverty, with 13 males (26.0%) and 2 females (100.0%) in their respective age groups living below the poverty level.
| Age Bracket | Male | Female |
| Under 5 Years | 0 (0.0%) | 11 (40.7%) |
| 5 Years | 0 (0.0%) | 2 (100.0%) |
| 6 to 11 Years | 13 (26.0%) | 22 (61.1%) |
| 12 to 14 Years | 0 (0.0%) | 6 (46.2%) |
| 15 Years | 0 (0.0%) | 0 (0.0%) |
| 16 and 17 Years | 0 (0.0%) | 0 (0.0%) |
| 18 to 24 Years | 0 (0.0%) | 0 (0.0%) |
| 25 to 34 Years | 0 (0.0%) | 7 (15.9%) |
| 35 to 44 Years | 0 (0.0%) | 18 (51.4%) |
| 45 to 54 Years | 0 (0.0%) | 3 (14.3%) |
| 55 to 64 Years | 5 (13.9%) | 0 (0.0%) |
| 65 to 74 Years | 0 (0.0%) | 2 (8.0%) |
| 75 Years and over | 0 (0.0%) | 1 (14.3%) |
| Total | 18 (5.1%) | 72 (28.5%) |
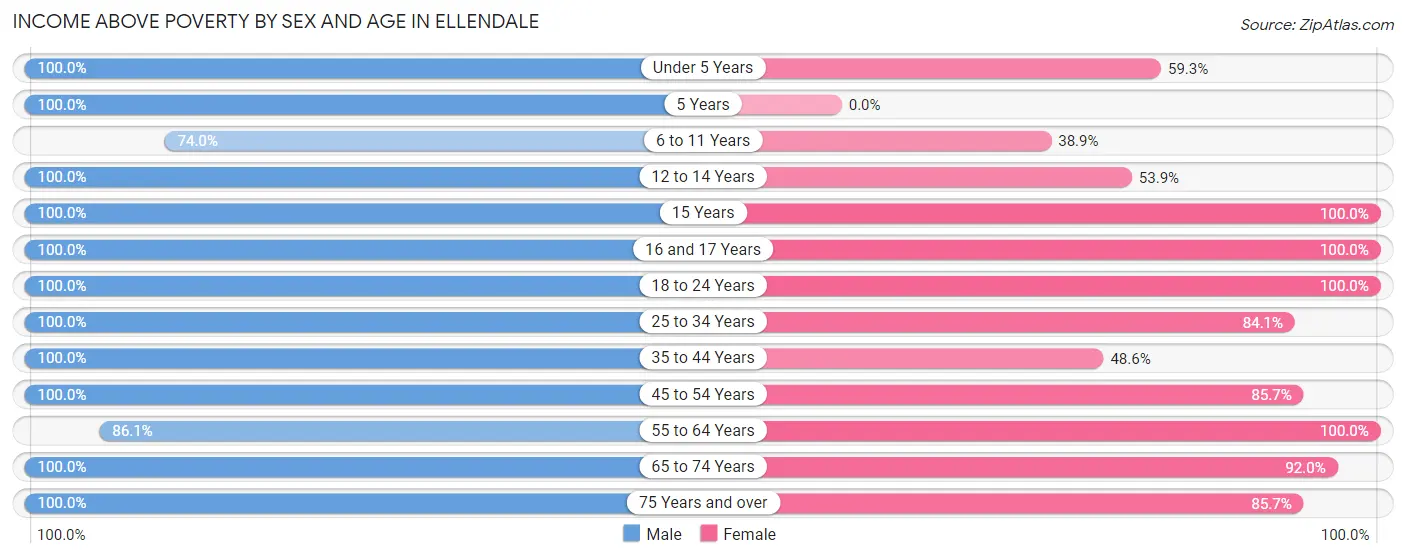
Income Above Poverty by Sex and Age in Ellendale
According to the poverty statistics in Ellendale, males aged under 5 years and females aged 15 years are the age groups that are most secure financially, with 100.0% of males and 100.0% of females in these age groups living above the poverty line.
| Age Bracket | Male | Female |
| Under 5 Years | 140 (100.0%) | 16 (59.3%) |
| 5 Years | 6 (100.0%) | 0 (0.0%) |
| 6 to 11 Years | 37 (74.0%) | 14 (38.9%) |
| 12 to 14 Years | 4 (100.0%) | 7 (53.8%) |
| 15 Years | 12 (100.0%) | 2 (100.0%) |
| 16 and 17 Years | 12 (100.0%) | 5 (100.0%) |
| 18 to 24 Years | 6 (100.0%) | 15 (100.0%) |
| 25 to 34 Years | 28 (100.0%) | 37 (84.1%) |
| 35 to 44 Years | 15 (100.0%) | 17 (48.6%) |
| 45 to 54 Years | 24 (100.0%) | 18 (85.7%) |
| 55 to 64 Years | 31 (86.1%) | 21 (100.0%) |
| 65 to 74 Years | 17 (100.0%) | 23 (92.0%) |
| 75 Years and over | 6 (100.0%) | 6 (85.7%) |
| Total | 338 (94.9%) | 181 (71.5%) |
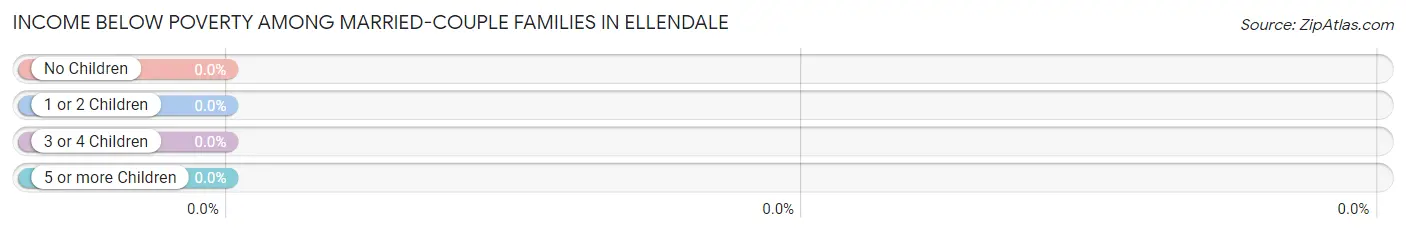
Income Below Poverty Among Married-Couple Families in Ellendale
| Children | Above Poverty | Below Poverty |
| No Children | 36 (100.0%) | 0 (0.0%) |
| 1 or 2 Children | 24 (100.0%) | 0 (0.0%) |
| 3 or 4 Children | 11 (100.0%) | 0 (0.0%) |
| 5 or more Children | 1 (100.0%) | 0 (0.0%) |
| Total | 72 (100.0%) | 0 (0.0%) |
Income Below Poverty Among Single-Parent Households in Ellendale
According to the poverty data in Ellendale, 27.3% or 3 single-father households and 32.1% or 18 single-mother households are living below the poverty line. Among single-father households, those with 3 or 4 children have the highest poverty rate, with 3 households (33.3%) experiencing poverty. Likewise, among single-mother households, those with 3 or 4 children have the highest poverty rate, with 18 households (72.0%) falling below the poverty line.
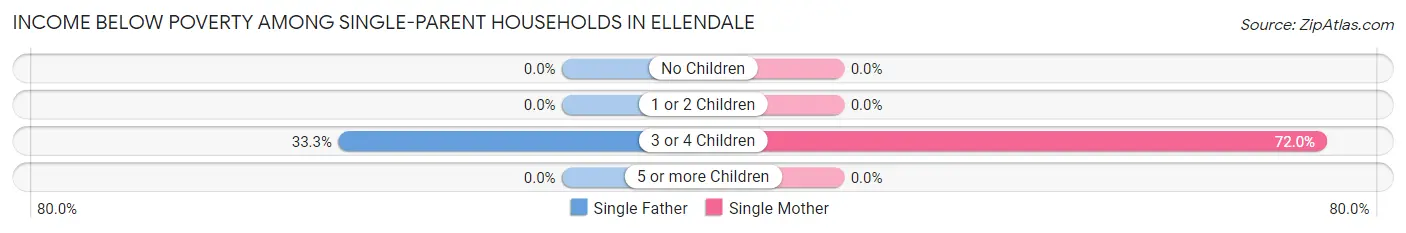
| Children | Single Father | Single Mother |
| No Children | 0 (0.0%) | 0 (0.0%) |
| 1 or 2 Children | 0 (0.0%) | 0 (0.0%) |
| 3 or 4 Children | 3 (33.3%) | 18 (72.0%) |
| 5 or more Children | 0 (0.0%) | 0 (0.0%) |
| Total | 3 (27.3%) | 18 (32.1%) |
Income Below Poverty Among Married-Couple vs Single-Parent Households in Ellendale
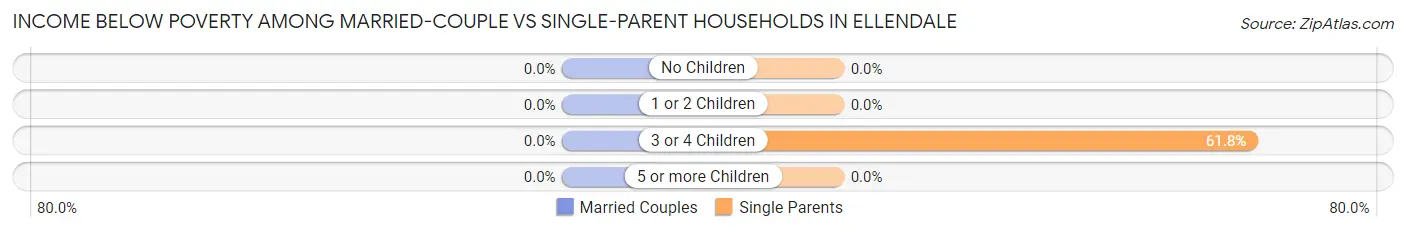
| Children | Married-Couple Families | Single-Parent Households |
| No Children | 0 (0.0%) | 0 (0.0%) |
| 1 or 2 Children | 0 (0.0%) | 0 (0.0%) |
| 3 or 4 Children | 0 (0.0%) | 21 (61.8%) |
| 5 or more Children | 0 (0.0%) | 0 (0.0%) |
| Total | 0 (0.0%) | 21 (31.3%) |
Race in Ellendale
The most populous races in Ellendale are White / Caucasian (244 | 40.1%), Hispanic or Latino (222 | 36.4%), and Two or more Races (165 | 27.1%).
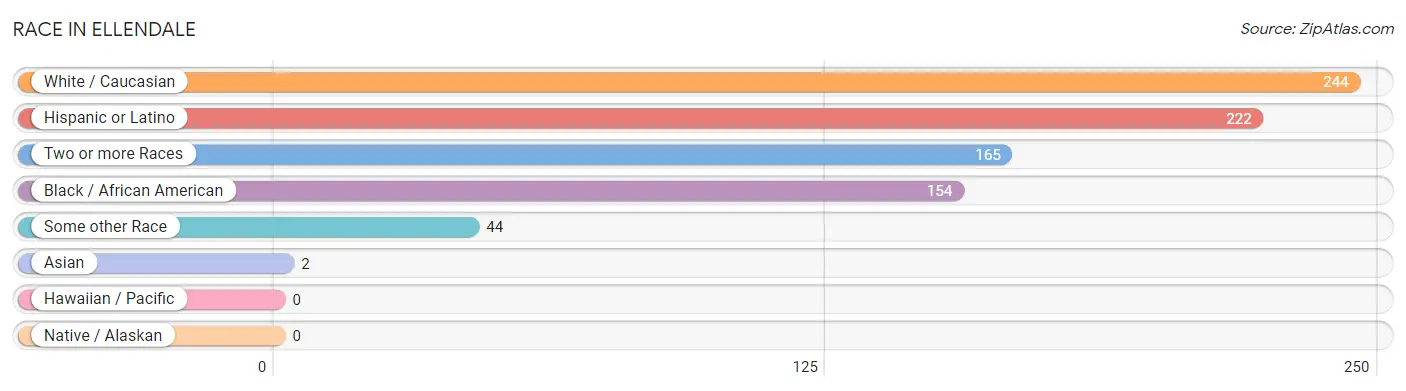
| Race | # Population | % Population |
| Asian | 2 | 0.3% |
| Black / African American | 154 | 25.3% |
| Hawaiian / Pacific | 0 | 0.0% |
| Hispanic or Latino | 222 | 36.4% |
| Native / Alaskan | 0 | 0.0% |
| White / Caucasian | 244 | 40.1% |
| Two or more Races | 165 | 27.1% |
| Some other Race | 44 | 7.2% |
| Total | 609 | 100.0% |
Ancestry in Ellendale
The most populous ancestries reported in Ellendale are Puerto Rican (163 | 26.8%), Irish (84 | 13.8%), German (72 | 11.8%), American (41 | 6.7%), and Central American (36 | 5.9%), together accounting for 65.0% of all Ellendale residents.
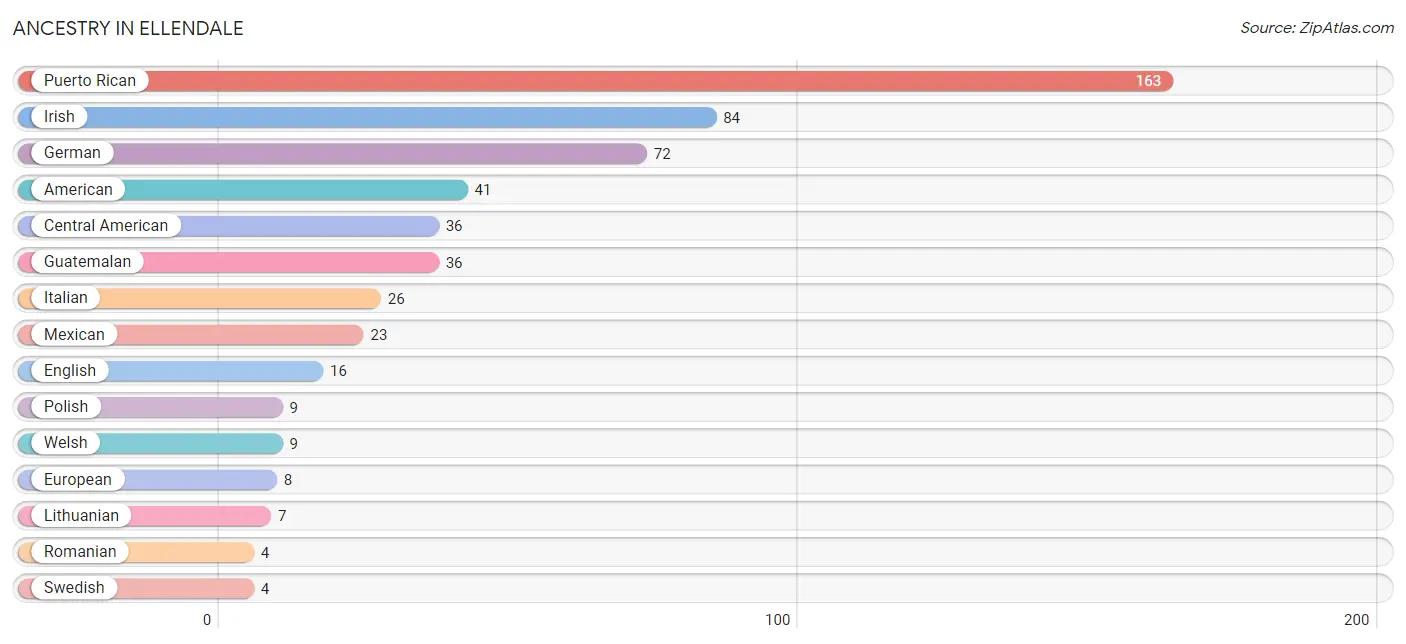
| Ancestry | # Population | % Population |
| American | 41 | 6.7% |
| Central American | 36 | 5.9% |
| Czech | 2 | 0.3% |
| Danish | 3 | 0.5% |
| English | 16 | 2.6% |
| European | 8 | 1.3% |
| German | 72 | 11.8% |
| Guatemalan | 36 | 5.9% |
| Irish | 84 | 13.8% |
| Italian | 26 | 4.3% |
| Lithuanian | 7 | 1.1% |
| Mexican | 23 | 3.8% |
| Northern European | 2 | 0.3% |
| Pakistani | 2 | 0.3% |
| Polish | 9 | 1.5% |
| Puerto Rican | 163 | 26.8% |
| Romanian | 4 | 0.7% |
| Scotch-Irish | 2 | 0.3% |
| Swedish | 4 | 0.7% |
| Ukrainian | 1 | 0.2% |
| Welsh | 9 | 1.5% | View All 21 Rows |
Immigrants in Ellendale
The most numerous immigrant groups reported in Ellendale came from Central America (24 | 3.9%), Latin America (24 | 3.9%), Guatemala (20 | 3.3%), Eastern Europe (4 | 0.7%), and Europe (4 | 0.7%), together accounting for 12.5% of all Ellendale residents.
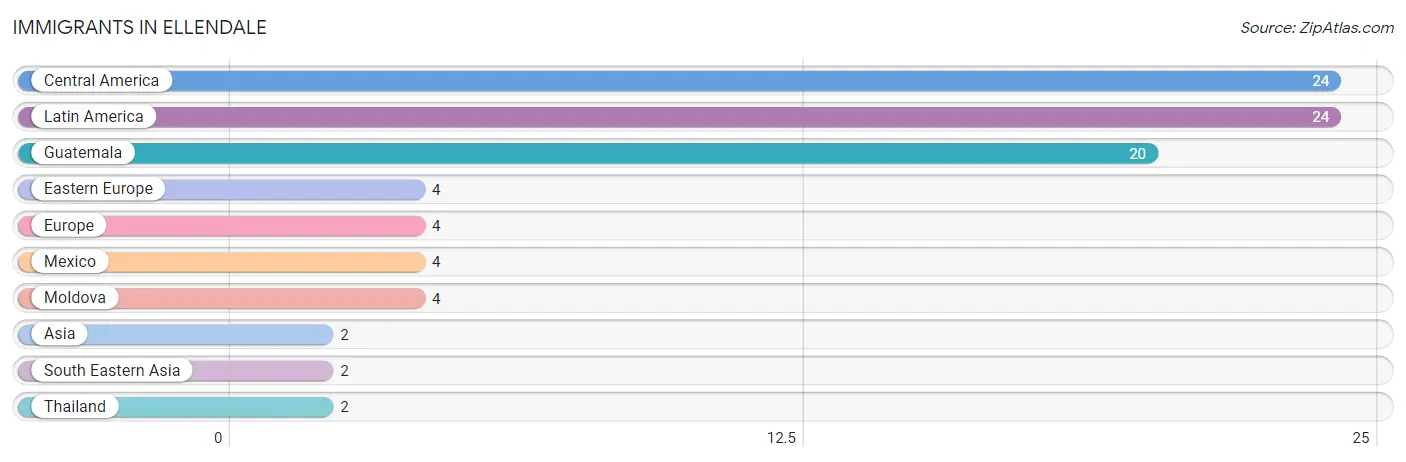
| Immigration Origin | # Population | % Population |
| Asia | 2 | 0.3% |
| Central America | 24 | 3.9% |
| Eastern Europe | 4 | 0.7% |
| Europe | 4 | 0.7% |
| Guatemala | 20 | 3.3% |
| Latin America | 24 | 3.9% |
| Mexico | 4 | 0.7% |
| Moldova | 4 | 0.7% |
| South Eastern Asia | 2 | 0.3% |
| Thailand | 2 | 0.3% | View All 10 Rows |
Sex and Age in Ellendale
Sex and Age in Ellendale
The most populous age groups in Ellendale are Under 5 Years (140 | 39.3%) for men and 30 to 34 Years (32 | 12.7%) for women.
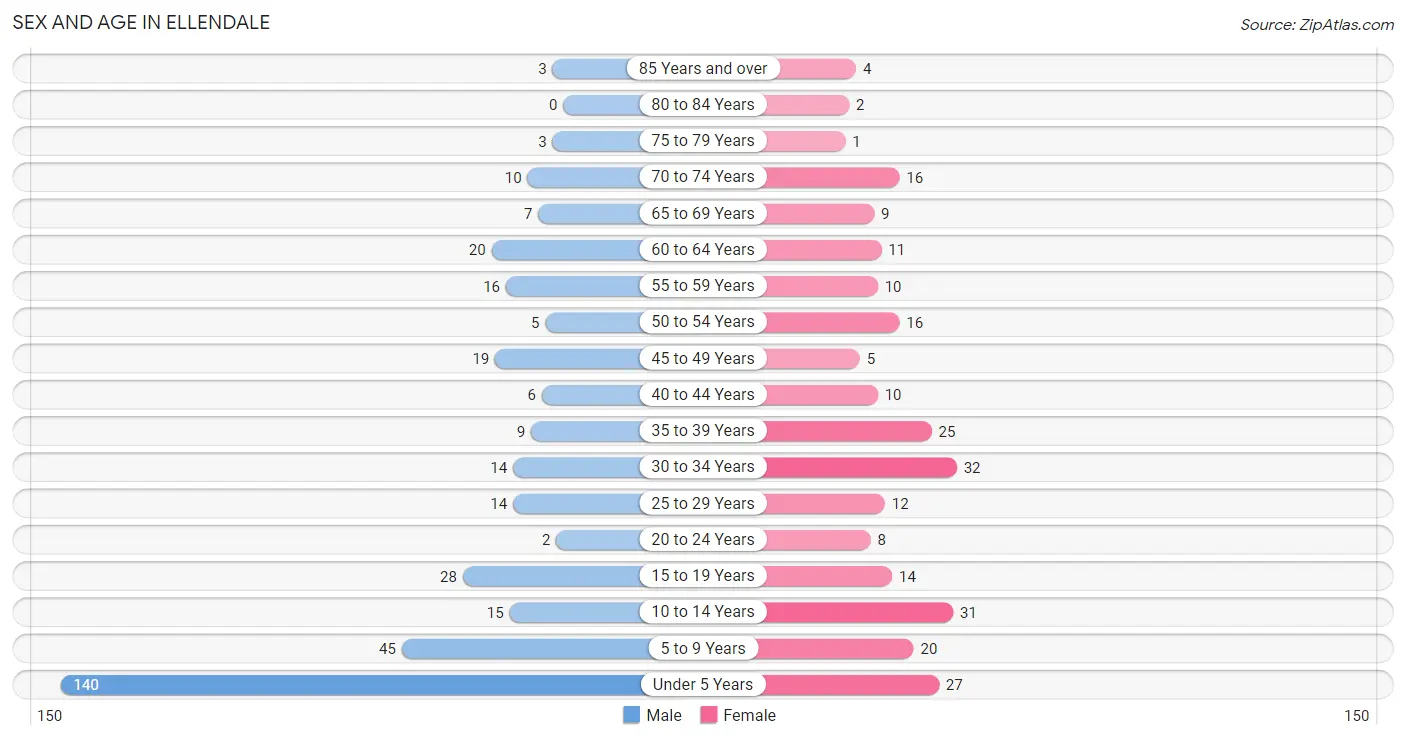
| Age Bracket | Male | Female |
| Under 5 Years | 140 (39.3%) | 27 (10.7%) |
| 5 to 9 Years | 45 (12.6%) | 20 (7.9%) |
| 10 to 14 Years | 15 (4.2%) | 31 (12.2%) |
| 15 to 19 Years | 28 (7.9%) | 14 (5.5%) |
| 20 to 24 Years | 2 (0.6%) | 8 (3.2%) |
| 25 to 29 Years | 14 (3.9%) | 12 (4.7%) |
| 30 to 34 Years | 14 (3.9%) | 32 (12.7%) |
| 35 to 39 Years | 9 (2.5%) | 25 (9.9%) |
| 40 to 44 Years | 6 (1.7%) | 10 (4.0%) |
| 45 to 49 Years | 19 (5.3%) | 5 (2.0%) |
| 50 to 54 Years | 5 (1.4%) | 16 (6.3%) |
| 55 to 59 Years | 16 (4.5%) | 10 (4.0%) |
| 60 to 64 Years | 20 (5.6%) | 11 (4.3%) |
| 65 to 69 Years | 7 (2.0%) | 9 (3.6%) |
| 70 to 74 Years | 10 (2.8%) | 16 (6.3%) |
| 75 to 79 Years | 3 (0.8%) | 1 (0.4%) |
| 80 to 84 Years | 0 (0.0%) | 2 (0.8%) |
| 85 Years and over | 3 (0.8%) | 4 (1.6%) |
| Total | 356 (100.0%) | 253 (100.0%) |
Families and Households in Ellendale
Median Family Size in Ellendale
The median family size in Ellendale is 4.07 persons per family, with married-couple families (72 | 51.8%) accounting for the largest median family size of 4.82 persons per family. On the other hand, single female/mother families (56 | 40.3%) represent the smallest median family size with 3.11 persons per family.
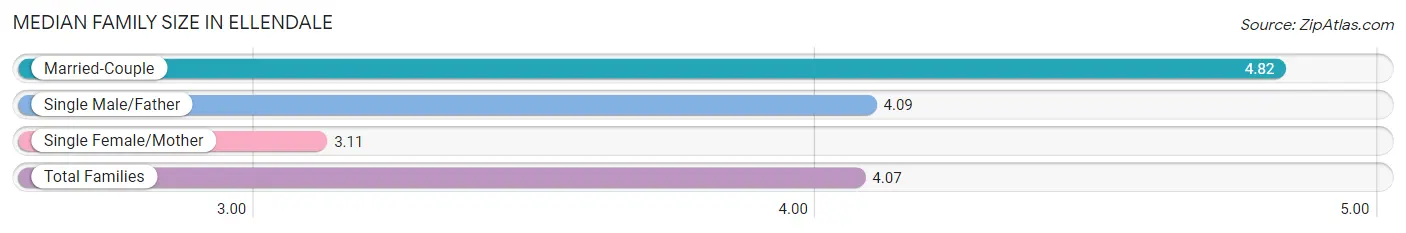
| Family Type | # Families | Family Size |
| Married-Couple | 72 (51.8%) | 4.82 |
| Single Male/Father | 11 (7.9%) | 4.09 |
| Single Female/Mother | 56 (40.3%) | 3.11 |
| Total Families | 139 (100.0%) | 4.07 |
Median Household Size in Ellendale
The median household size in Ellendale is 3.60 persons per household, with married-couple households (72 | 42.6%) accounting for the largest median household size of 4.82 persons per household. non-family households (30 | 17.7%) represent the smallest median household size with 1.13 persons per household.
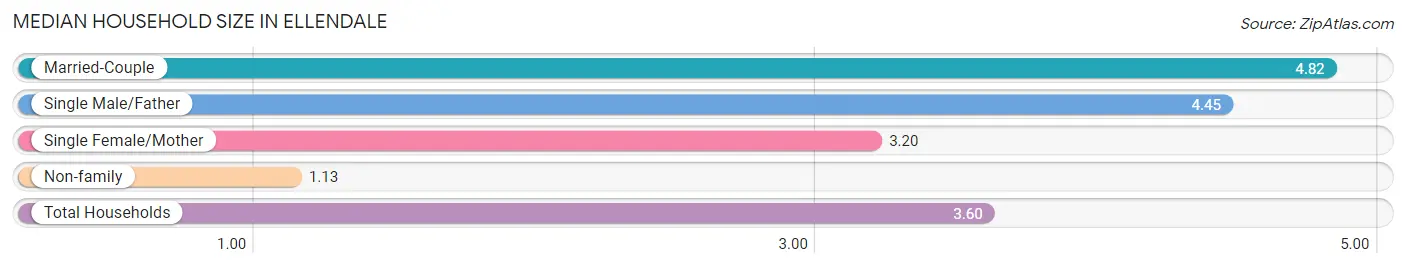
| Household Type | # Households | Household Size |
| Married-Couple | 72 (42.6%) | 4.82 |
| Single Male/Father | 11 (6.5%) | 4.45 |
| Single Female/Mother | 56 (33.1%) | 3.20 |
| Non-family | 30 (17.7%) | 1.13 |
| Total Households | 169 (100.0%) | 3.60 |
Household Size by Marriage Status in Ellendale
Out of a total of 169 households in Ellendale, 139 (82.3%) are family households, while 30 (17.7%) are nonfamily households. The most numerous type of family households are 2-person households, comprising 42, and the most common type of nonfamily households are 1-person households, comprising 28.
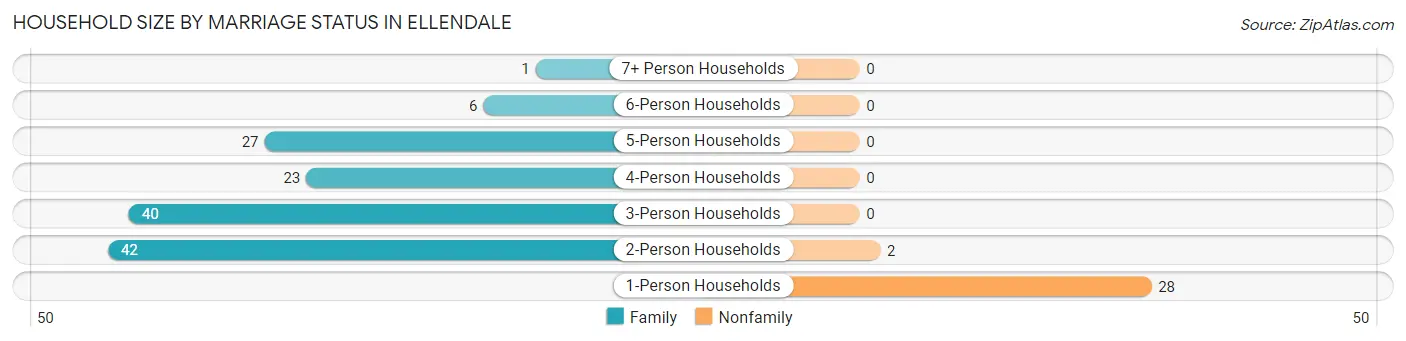
| Household Size | Family Households | Nonfamily Households |
| 1-Person Households | - | 28 (16.6%) |
| 2-Person Households | 42 (24.8%) | 2 (1.2%) |
| 3-Person Households | 40 (23.7%) | 0 (0.0%) |
| 4-Person Households | 23 (13.6%) | 0 (0.0%) |
| 5-Person Households | 27 (16.0%) | 0 (0.0%) |
| 6-Person Households | 6 (3.5%) | 0 (0.0%) |
| 7+ Person Households | 1 (0.6%) | 0 (0.0%) |
| Total | 139 (82.3%) | 30 (17.7%) |
Female Fertility in Ellendale
Fertility by Age in Ellendale
Average fertility rate in Ellendale is 236.0 births per 1,000 women. Women in the age bracket of 20 to 34 years have the highest fertility rate with 288.0 births per 1,000 women. Women in the age bracket of 20 to 34 years acount for 60.0% of all women with births.
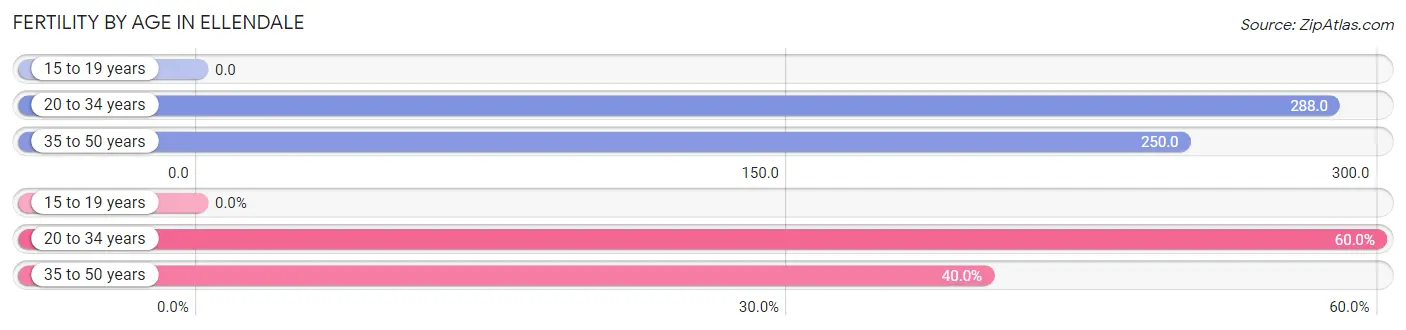
| Age Bracket | Women with Births | Births / 1,000 Women |
| 15 to 19 years | 0 (0.0%) | 0.0 |
| 20 to 34 years | 15 (60.0%) | 288.0 |
| 35 to 50 years | 10 (40.0%) | 250.0 |
| Total | 25 (100.0%) | 236.0 |
Fertility by Age by Marriage Status in Ellendale
60.0% of women with births (25) in Ellendale are married. The highest percentage of unmarried women with births falls into 35 to 50 years age bracket with 100.0% of them unmarried at the time of birth, while the lowest percentage of unmarried women with births belong to 20 to 34 years age bracket with 0.0% of them unmarried.
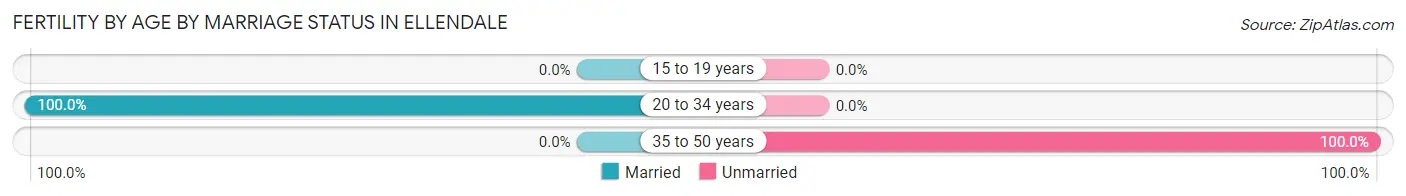
| Age Bracket | Married | Unmarried |
| 15 to 19 years | 0 (0.0%) | 0 (0.0%) |
| 20 to 34 years | 15 (100.0%) | 0 (0.0%) |
| 35 to 50 years | 0 (0.0%) | 10 (100.0%) |
| Total | 15 (60.0%) | 10 (40.0%) |
Fertility by Education in Ellendale
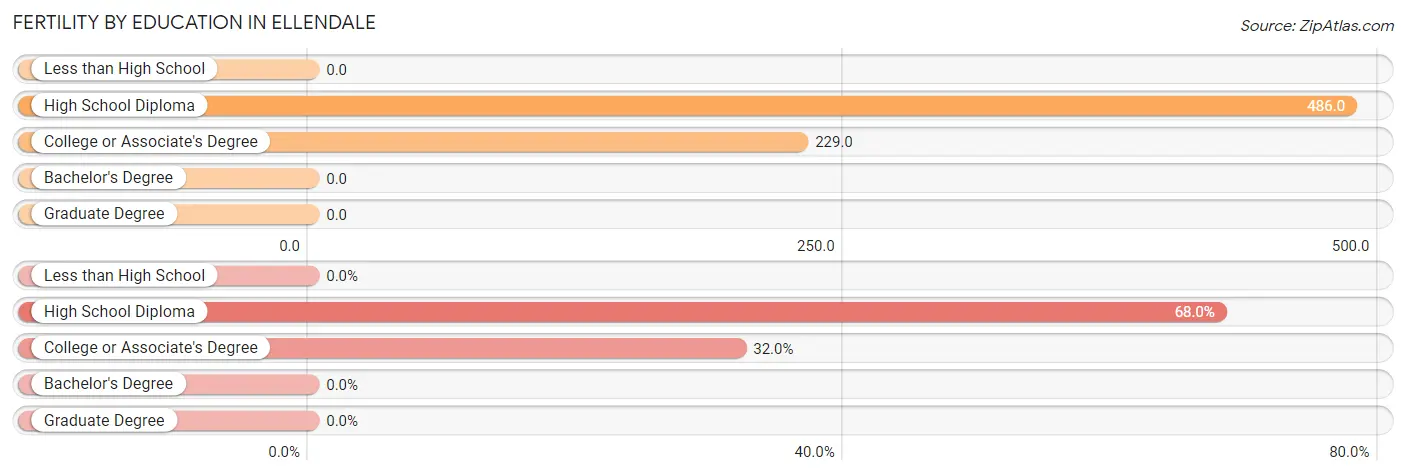
| Educational Attainment | Women with Births | Births / 1,000 Women |
| Less than High School | 0 (0.0%) | 0.0 |
| High School Diploma | 17 (68.0%) | 486.0 |
| College or Associate's Degree | 8 (32.0%) | 229.0 |
| Bachelor's Degree | 0 (0.0%) | 0.0 |
| Graduate Degree | 0 (0.0%) | 0.0 |
| Total | 25 (100.0%) | 236.0 |
Fertility by Education by Marriage Status in Ellendale
40.0% of women with births in Ellendale are unmarried. Women with the educational attainment of college or associate's degree are most likely to be married with 100.0% of them married at childbirth, while women with the educational attainment of high school diploma are least likely to be married with 58.8% of them unmarried at childbirth.
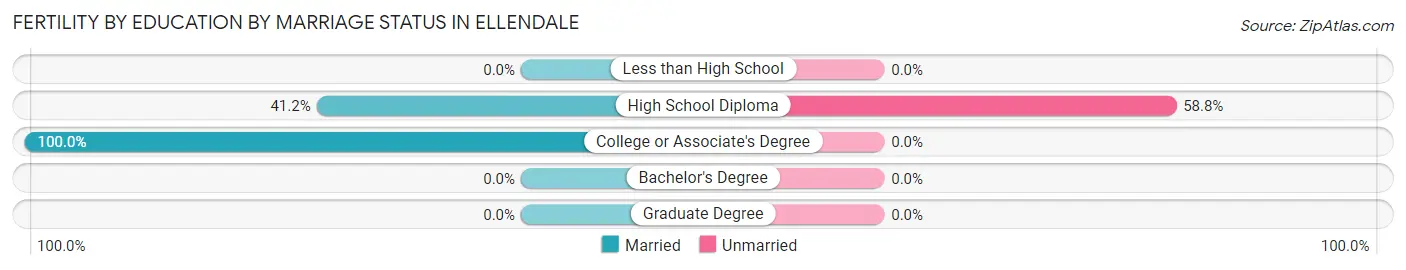
| Educational Attainment | Married | Unmarried |
| Less than High School | 0 (0.0%) | 0 (0.0%) |
| High School Diploma | 7 (41.2%) | 10 (58.8%) |
| College or Associate's Degree | 8 (100.0%) | 0 (0.0%) |
| Bachelor's Degree | 0 (0.0%) | 0 (0.0%) |
| Graduate Degree | 0 (0.0%) | 0 (0.0%) |
| Total | 15 (60.0%) | 10 (40.0%) |
Employment Characteristics in Ellendale
Employment by Class of Employer in Ellendale
Among the 187 employed individuals in Ellendale, private company employees (110 | 58.8%), not-for-profit organizations (42 | 22.5%), and self-employed (not incorporated) (15 | 8.0%) make up the most common classes of employment.
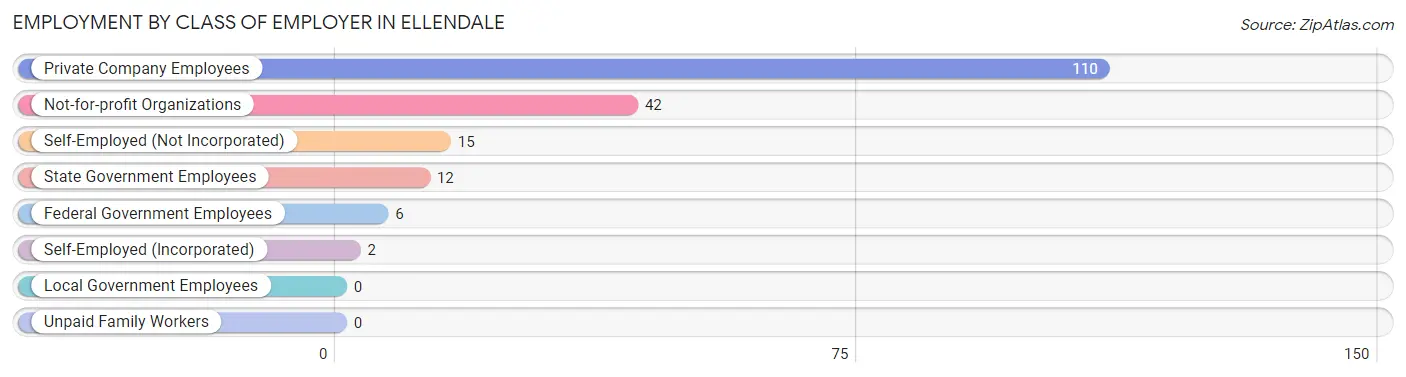
| Employer Class | # Employees | % Employees |
| Private Company Employees | 110 | 58.8% |
| Self-Employed (Incorporated) | 2 | 1.1% |
| Self-Employed (Not Incorporated) | 15 | 8.0% |
| Not-for-profit Organizations | 42 | 22.5% |
| Local Government Employees | 0 | 0.0% |
| State Government Employees | 12 | 6.4% |
| Federal Government Employees | 6 | 3.2% |
| Unpaid Family Workers | 0 | 0.0% |
| Total | 187 | 100.0% |
Employment Status by Age in Ellendale
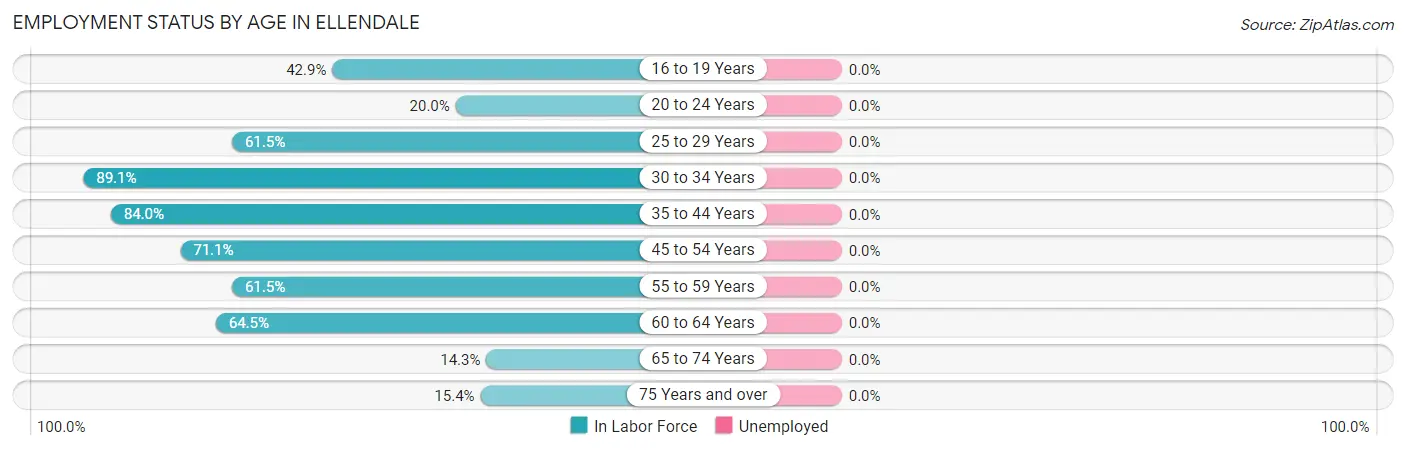
| Age Bracket | In Labor Force | Unemployed |
| 16 to 19 Years | 12 (42.9%) | 0 (0.0%) |
| 20 to 24 Years | 2 (20.0%) | 0 (0.0%) |
| 25 to 29 Years | 16 (61.5%) | 0 (0.0%) |
| 30 to 34 Years | 41 (89.1%) | 0 (0.0%) |
| 35 to 44 Years | 42 (84.0%) | 0 (0.0%) |
| 45 to 54 Years | 32 (71.1%) | 0 (0.0%) |
| 55 to 59 Years | 16 (61.5%) | 0 (0.0%) |
| 60 to 64 Years | 20 (64.5%) | 0 (0.0%) |
| 65 to 74 Years | 6 (14.3%) | 0 (0.0%) |
| 75 Years and over | 2 (15.4%) | 0 (0.0%) |
| Total | 189 (59.6%) | 0 (0.0%) |
Employment Status by Educational Attainment in Ellendale
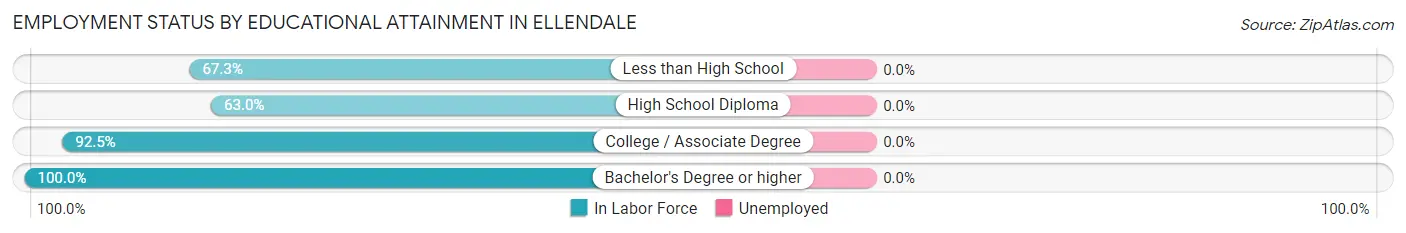
| Educational Attainment | In Labor Force | Unemployed |
| Less than High School | 33 (67.3%) | 0 (0.0%) |
| High School Diploma | 63 (63.0%) | 0 (0.0%) |
| College / Associate Degree | 49 (92.5%) | 0 (0.0%) |
| Bachelor's Degree or higher | 22 (100.0%) | 0 (0.0%) |
| Total | 167 (74.6%) | 0 (0.0%) |
Employment Occupations by Sex in Ellendale
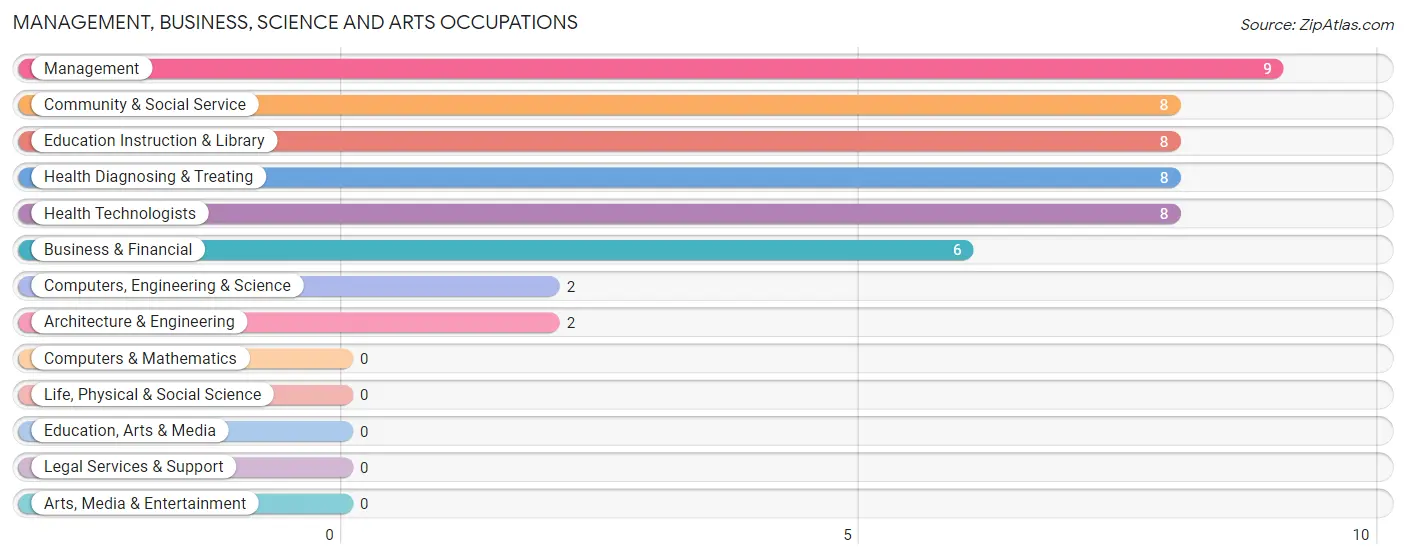
Management, Business, Science and Arts Occupations
The most common Management, Business, Science and Arts occupations in Ellendale are Management (9 | 4.8%), Community & Social Service (8 | 4.3%), Education Instruction & Library (8 | 4.3%), Health Diagnosing & Treating (8 | 4.3%), and Health Technologists (8 | 4.3%).
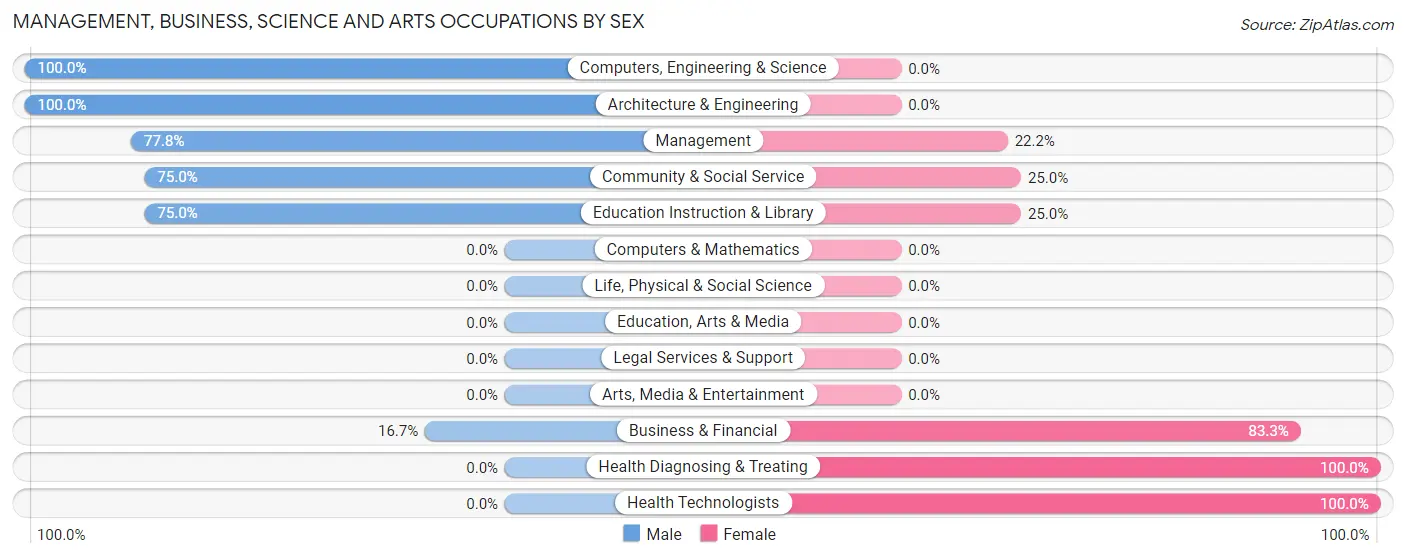
Management, Business, Science and Arts Occupations by Sex
Within the Management, Business, Science and Arts occupations in Ellendale, the most male-oriented occupations are Computers, Engineering & Science (100.0%), Architecture & Engineering (100.0%), and Management (77.8%), while the most female-oriented occupations are Health Diagnosing & Treating (100.0%), Health Technologists (100.0%), and Business & Financial (83.3%).
| Occupation | Male | Female |
| Management | 7 (77.8%) | 2 (22.2%) |
| Business & Financial | 1 (16.7%) | 5 (83.3%) |
| Computers, Engineering & Science | 2 (100.0%) | 0 (0.0%) |
| Computers & Mathematics | 0 (0.0%) | 0 (0.0%) |
| Architecture & Engineering | 2 (100.0%) | 0 (0.0%) |
| Life, Physical & Social Science | 0 (0.0%) | 0 (0.0%) |
| Community & Social Service | 6 (75.0%) | 2 (25.0%) |
| Education, Arts & Media | 0 (0.0%) | 0 (0.0%) |
| Legal Services & Support | 0 (0.0%) | 0 (0.0%) |
| Education Instruction & Library | 6 (75.0%) | 2 (25.0%) |
| Arts, Media & Entertainment | 0 (0.0%) | 0 (0.0%) |
| Health Diagnosing & Treating | 0 (0.0%) | 8 (100.0%) |
| Health Technologists | 0 (0.0%) | 8 (100.0%) |
| Total (Category) | 16 (48.5%) | 17 (51.5%) |
| Total (Overall) | 89 (47.3%) | 99 (52.7%) |
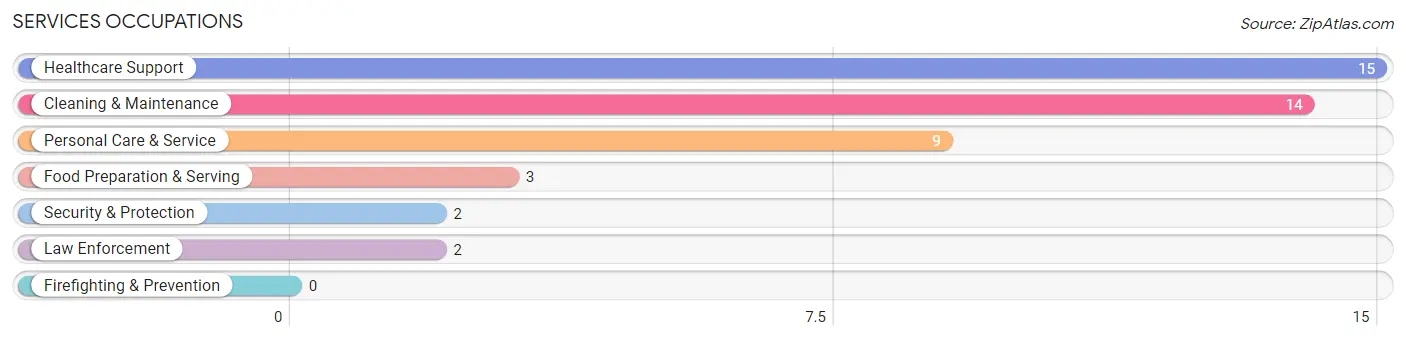
Services Occupations
The most common Services occupations in Ellendale are Healthcare Support (15 | 8.0%), Cleaning & Maintenance (14 | 7.4%), Personal Care & Service (9 | 4.8%), Food Preparation & Serving (3 | 1.6%), and Security & Protection (2 | 1.1%).
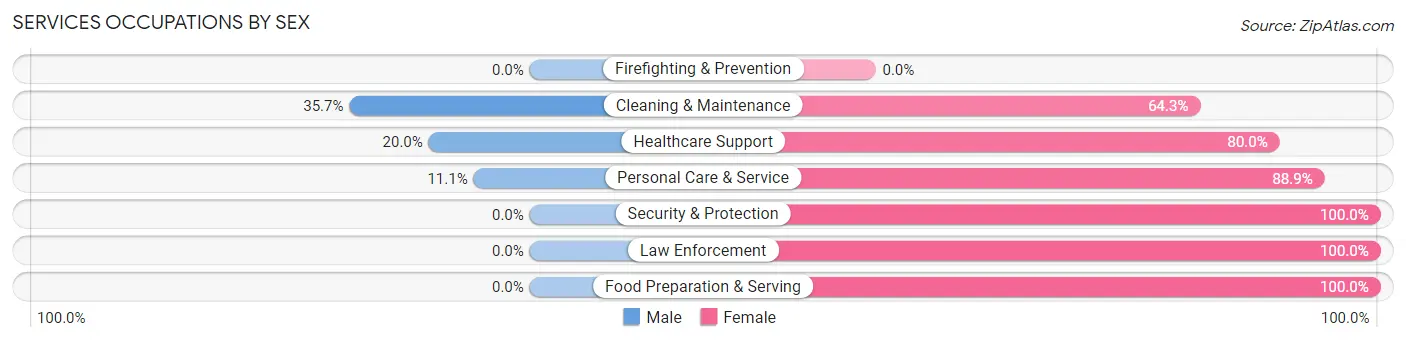
Services Occupations by Sex
Within the Services occupations in Ellendale, the most male-oriented occupations are Cleaning & Maintenance (35.7%), Healthcare Support (20.0%), and Personal Care & Service (11.1%), while the most female-oriented occupations are Security & Protection (100.0%), Law Enforcement (100.0%), and Food Preparation & Serving (100.0%).
| Occupation | Male | Female |
| Healthcare Support | 3 (20.0%) | 12 (80.0%) |
| Security & Protection | 0 (0.0%) | 2 (100.0%) |
| Firefighting & Prevention | 0 (0.0%) | 0 (0.0%) |
| Law Enforcement | 0 (0.0%) | 2 (100.0%) |
| Food Preparation & Serving | 0 (0.0%) | 3 (100.0%) |
| Cleaning & Maintenance | 5 (35.7%) | 9 (64.3%) |
| Personal Care & Service | 1 (11.1%) | 8 (88.9%) |
| Total (Category) | 9 (20.9%) | 34 (79.1%) |
| Total (Overall) | 89 (47.3%) | 99 (52.7%) |
Sales and Office Occupations
The most common Sales and Office occupations in Ellendale are Sales & Related (38 | 20.2%), and Office & Administration (21 | 11.2%).
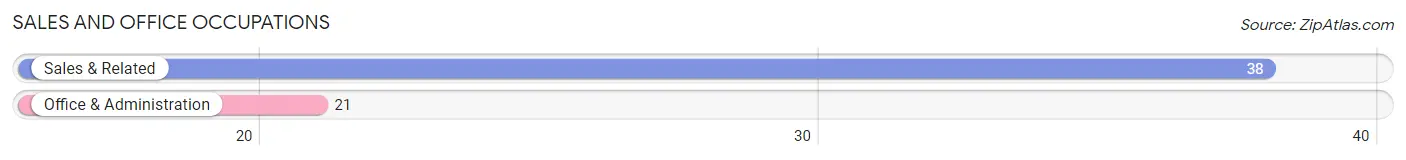
Sales and Office Occupations by Sex
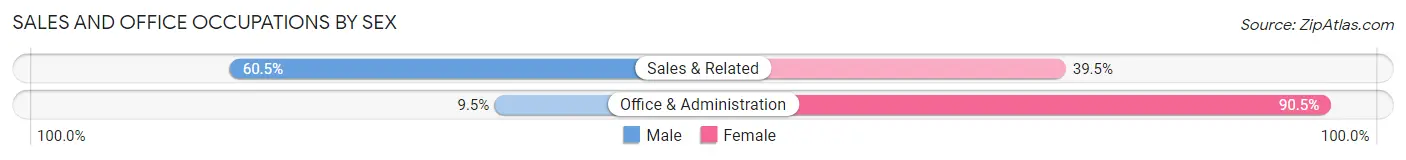
| Occupation | Male | Female |
| Sales & Related | 23 (60.5%) | 15 (39.5%) |
| Office & Administration | 2 (9.5%) | 19 (90.5%) |
| Total (Category) | 25 (42.4%) | 34 (57.6%) |
| Total (Overall) | 89 (47.3%) | 99 (52.7%) |
Natural Resources, Construction and Maintenance Occupations
The most common Natural Resources, Construction and Maintenance occupations in Ellendale are Construction & Extraction (16 | 8.5%), Installation, Maintenance & Repair (10 | 5.3%), and Farming, Fishing & Forestry (1 | 0.5%).
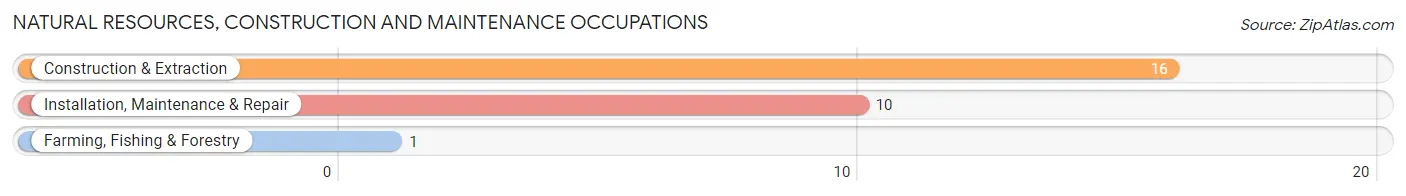
Natural Resources, Construction and Maintenance Occupations by Sex
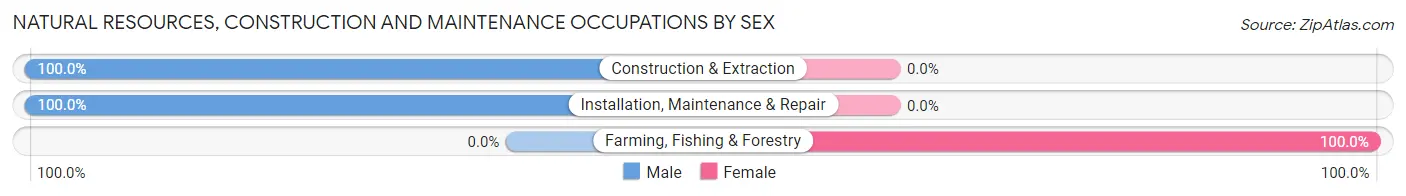
| Occupation | Male | Female |
| Farming, Fishing & Forestry | 0 (0.0%) | 1 (100.0%) |
| Construction & Extraction | 16 (100.0%) | 0 (0.0%) |
| Installation, Maintenance & Repair | 10 (100.0%) | 0 (0.0%) |
| Total (Category) | 26 (96.3%) | 1 (3.7%) |
| Total (Overall) | 89 (47.3%) | 99 (52.7%) |
Production, Transportation and Moving Occupations
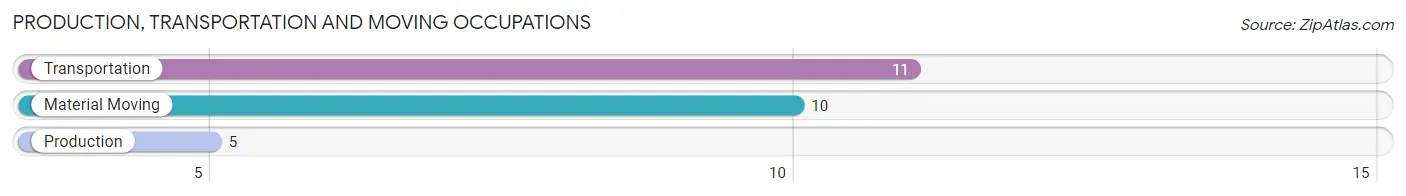
The most common Production, Transportation and Moving occupations in Ellendale are Transportation (11 | 5.9%), Material Moving (10 | 5.3%), and Production (5 | 2.7%).
Production, Transportation and Moving Occupations by Sex
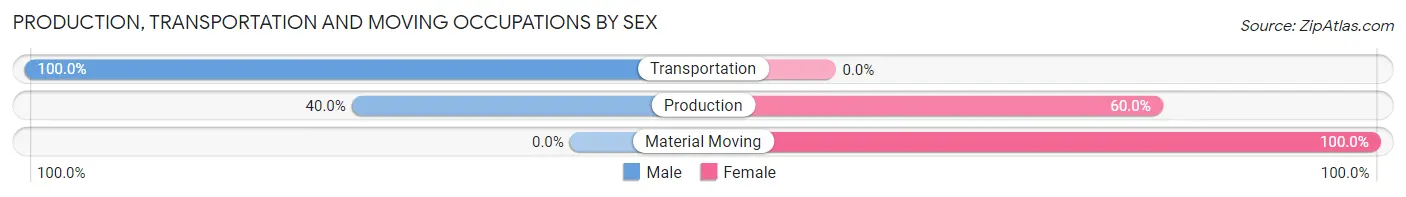
| Occupation | Male | Female |
| Production | 2 (40.0%) | 3 (60.0%) |
| Transportation | 11 (100.0%) | 0 (0.0%) |
| Material Moving | 0 (0.0%) | 10 (100.0%) |
| Total (Category) | 13 (50.0%) | 13 (50.0%) |
| Total (Overall) | 89 (47.3%) | 99 (52.7%) |
Employment Industries by Sex in Ellendale
Employment Industries in Ellendale
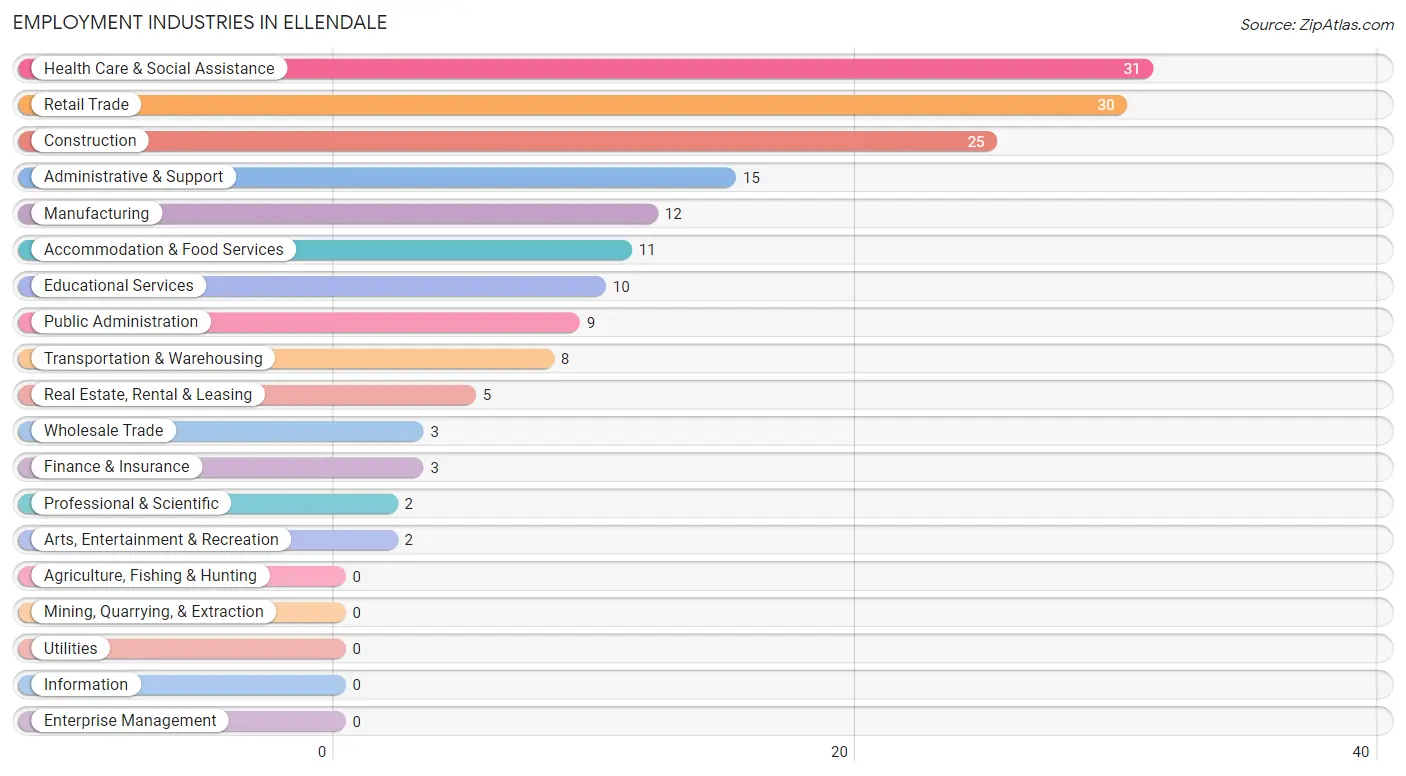
The major employment industries in Ellendale include Health Care & Social Assistance (31 | 16.5%), Retail Trade (30 | 16.0%), Construction (25 | 13.3%), Administrative & Support (15 | 8.0%), and Manufacturing (12 | 6.4%).
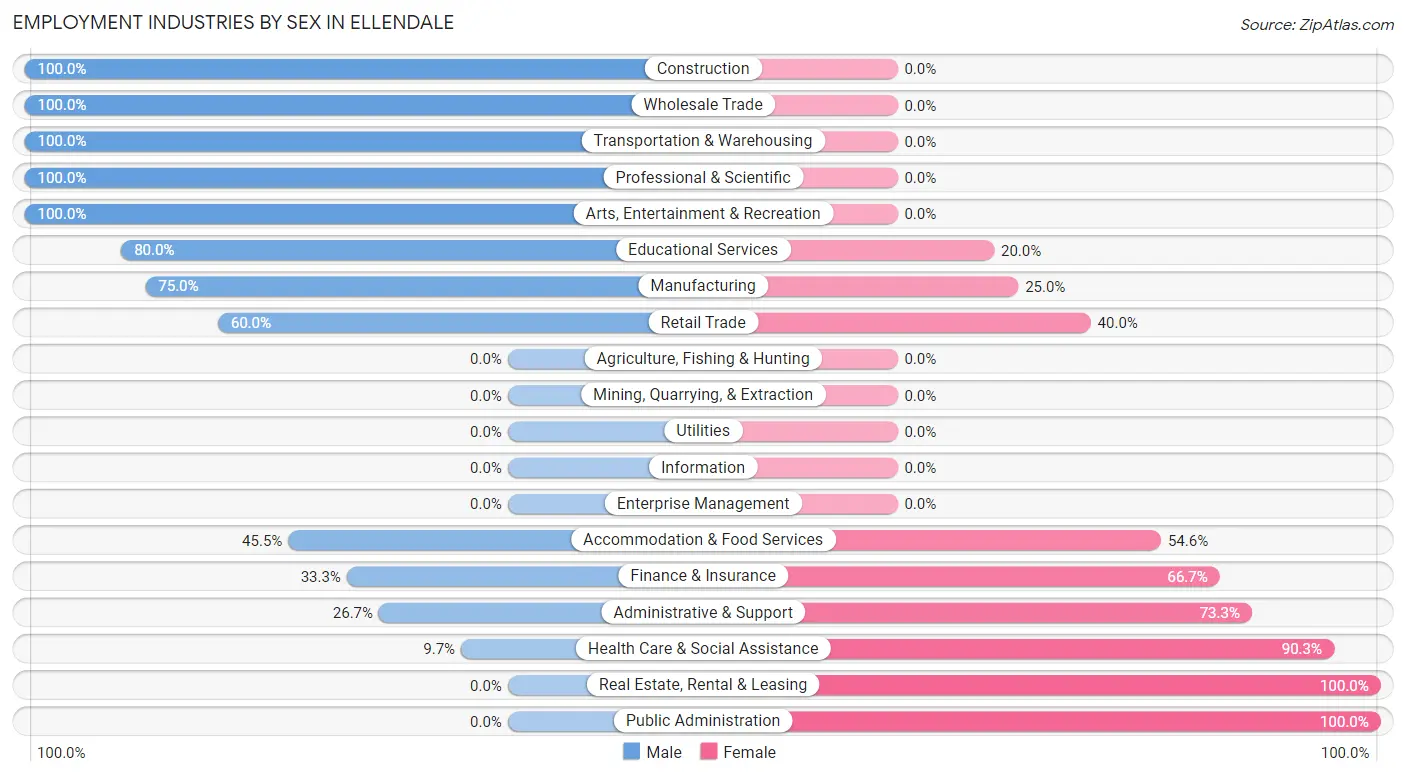
Employment Industries by Sex in Ellendale
The Ellendale industries that see more men than women are Construction (100.0%), Wholesale Trade (100.0%), and Transportation & Warehousing (100.0%), whereas the industries that tend to have a higher number of women are Real Estate, Rental & Leasing (100.0%), Public Administration (100.0%), and Health Care & Social Assistance (90.3%).
| Industry | Male | Female |
| Agriculture, Fishing & Hunting | 0 (0.0%) | 0 (0.0%) |
| Mining, Quarrying, & Extraction | 0 (0.0%) | 0 (0.0%) |
| Construction | 25 (100.0%) | 0 (0.0%) |
| Manufacturing | 9 (75.0%) | 3 (25.0%) |
| Wholesale Trade | 3 (100.0%) | 0 (0.0%) |
| Retail Trade | 18 (60.0%) | 12 (40.0%) |
| Transportation & Warehousing | 8 (100.0%) | 0 (0.0%) |
| Utilities | 0 (0.0%) | 0 (0.0%) |
| Information | 0 (0.0%) | 0 (0.0%) |
| Finance & Insurance | 1 (33.3%) | 2 (66.7%) |
| Real Estate, Rental & Leasing | 0 (0.0%) | 5 (100.0%) |
| Professional & Scientific | 2 (100.0%) | 0 (0.0%) |
| Enterprise Management | 0 (0.0%) | 0 (0.0%) |
| Administrative & Support | 4 (26.7%) | 11 (73.3%) |
| Educational Services | 8 (80.0%) | 2 (20.0%) |
| Health Care & Social Assistance | 3 (9.7%) | 28 (90.3%) |
| Arts, Entertainment & Recreation | 2 (100.0%) | 0 (0.0%) |
| Accommodation & Food Services | 5 (45.5%) | 6 (54.5%) |
| Public Administration | 0 (0.0%) | 9 (100.0%) |
| Total | 89 (47.3%) | 99 (52.7%) |
Education in Ellendale
School Enrollment in Ellendale
The most common levels of schooling among the 157 students in Ellendale are middle school (52 | 33.1%), elementary school (37 | 23.6%), and high school (36 | 22.9%).
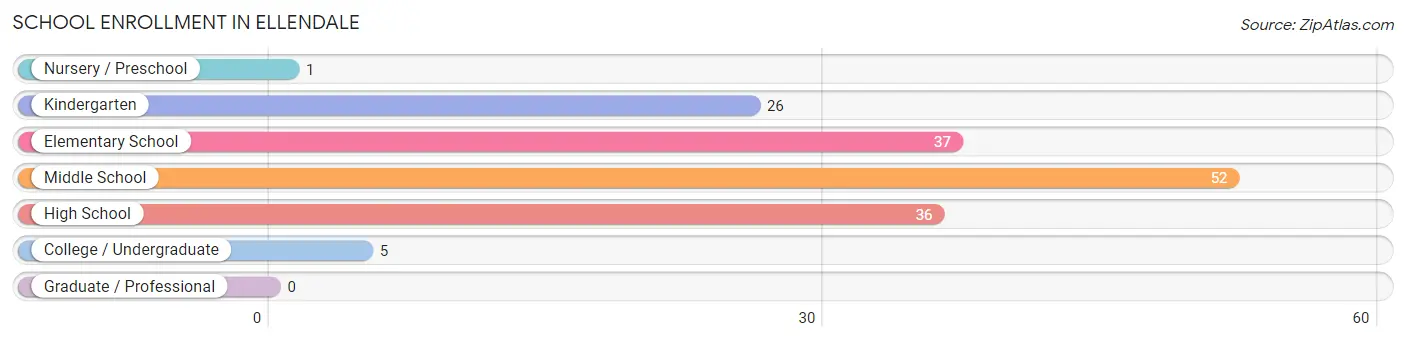
| School Level | # Students | % Students |
| Nursery / Preschool | 1 | 0.6% |
| Kindergarten | 26 | 16.6% |
| Elementary School | 37 | 23.6% |
| Middle School | 52 | 33.1% |
| High School | 36 | 22.9% |
| College / Undergraduate | 5 | 3.2% |
| Graduate / Professional | 0 | 0.0% |
| Total | 157 | 100.0% |
School Enrollment by Age by Funding Source in Ellendale
Out of a total of 157 students who are enrolled in schools in Ellendale, 8 (5.1%) attend a private institution, while the remaining 149 (94.9%) are enrolled in public schools. The age group of 3 to 4 year olds has the highest likelihood of being enrolled in private schools, with 1 (100.0% in the age bracket) enrolled. Conversely, the age group of 10 to 14 year olds has the lowest likelihood of being enrolled in a private school, with 46 (100.0% in the age bracket) attending a public institution.
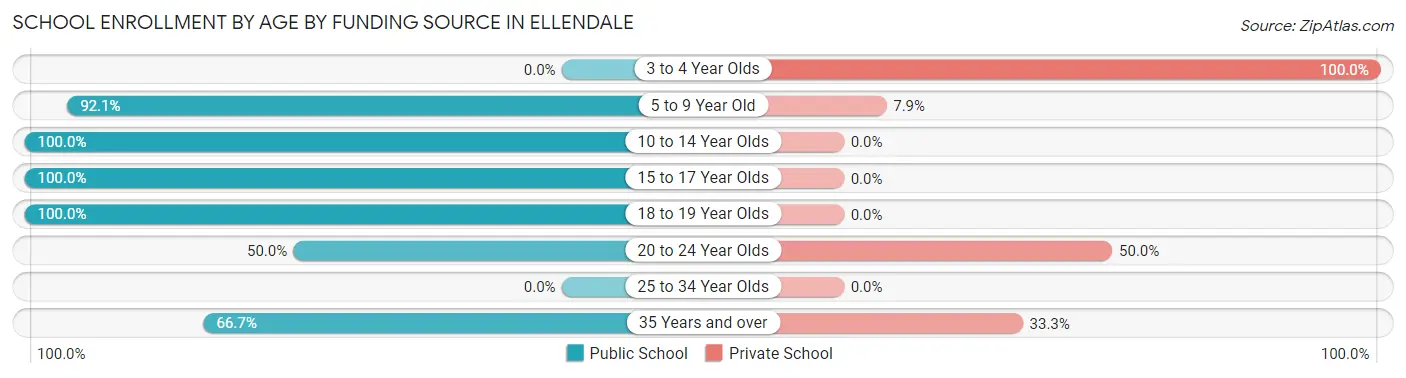
| Age Bracket | Public School | Private School |
| 3 to 4 Year Olds | 0 (0.0%) | 1 (100.0%) |
| 5 to 9 Year Old | 58 (92.1%) | 5 (7.9%) |
| 10 to 14 Year Olds | 46 (100.0%) | 0 (0.0%) |
| 15 to 17 Year Olds | 31 (100.0%) | 0 (0.0%) |
| 18 to 19 Year Olds | 11 (100.0%) | 0 (0.0%) |
| 20 to 24 Year Olds | 1 (50.0%) | 1 (50.0%) |
| 25 to 34 Year Olds | 0 (0.0%) | 0 (0.0%) |
| 35 Years and over | 2 (66.7%) | 1 (33.3%) |
| Total | 149 (94.9%) | 8 (5.1%) |
Educational Attainment by Field of Study in Ellendale
Science & technology (10 | 27.8%), education (9 | 25.0%), business (5 | 13.9%), arts & humanities (4 | 11.1%), and literature & languages (3 | 8.3%) are the most common fields of study among 36 individuals in Ellendale who have obtained a bachelor's degree or higher.
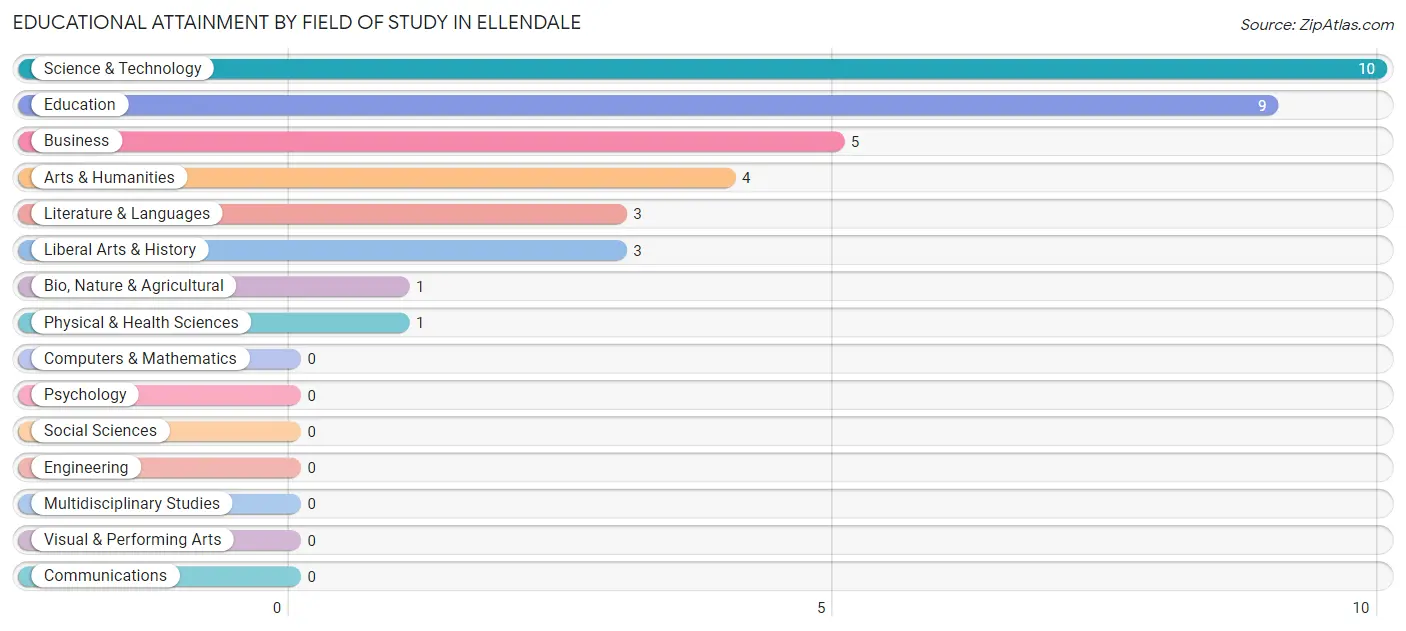
| Field of Study | # Graduates | % Graduates |
| Computers & Mathematics | 0 | 0.0% |
| Bio, Nature & Agricultural | 1 | 2.8% |
| Physical & Health Sciences | 1 | 2.8% |
| Psychology | 0 | 0.0% |
| Social Sciences | 0 | 0.0% |
| Engineering | 0 | 0.0% |
| Multidisciplinary Studies | 0 | 0.0% |
| Science & Technology | 10 | 27.8% |
| Business | 5 | 13.9% |
| Education | 9 | 25.0% |
| Literature & Languages | 3 | 8.3% |
| Liberal Arts & History | 3 | 8.3% |
| Visual & Performing Arts | 0 | 0.0% |
| Communications | 0 | 0.0% |
| Arts & Humanities | 4 | 11.1% |
| Total | 36 | 100.0% |
Transportation & Commute in Ellendale
Vehicle Availability by Sex in Ellendale
The most prevalent vehicle ownership categories in Ellendale are males with 2 vehicles (44, accounting for 48.9%) and females with 2 vehicles (56, making up 45.4%).
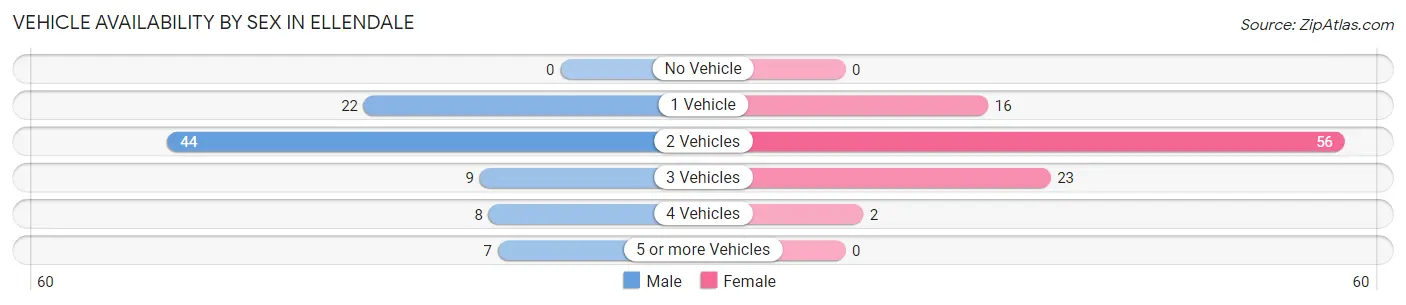
| Vehicles Available | Male | Female |
| No Vehicle | 0 (0.0%) | 0 (0.0%) |
| 1 Vehicle | 22 (24.4%) | 16 (16.5%) |
| 2 Vehicles | 44 (48.9%) | 56 (57.7%) |
| 3 Vehicles | 9 (10.0%) | 23 (23.7%) |
| 4 Vehicles | 8 (8.9%) | 2 (2.1%) |
| 5 or more Vehicles | 7 (7.8%) | 0 (0.0%) |
| Total | 90 (100.0%) | 97 (100.0%) |
Commute Time in Ellendale
The most frequently occuring commute durations in Ellendale are 20 to 24 minutes (39 commuters, 22.7%), 15 to 19 minutes (30 commuters, 17.4%), and 30 to 34 minutes (28 commuters, 16.3%).
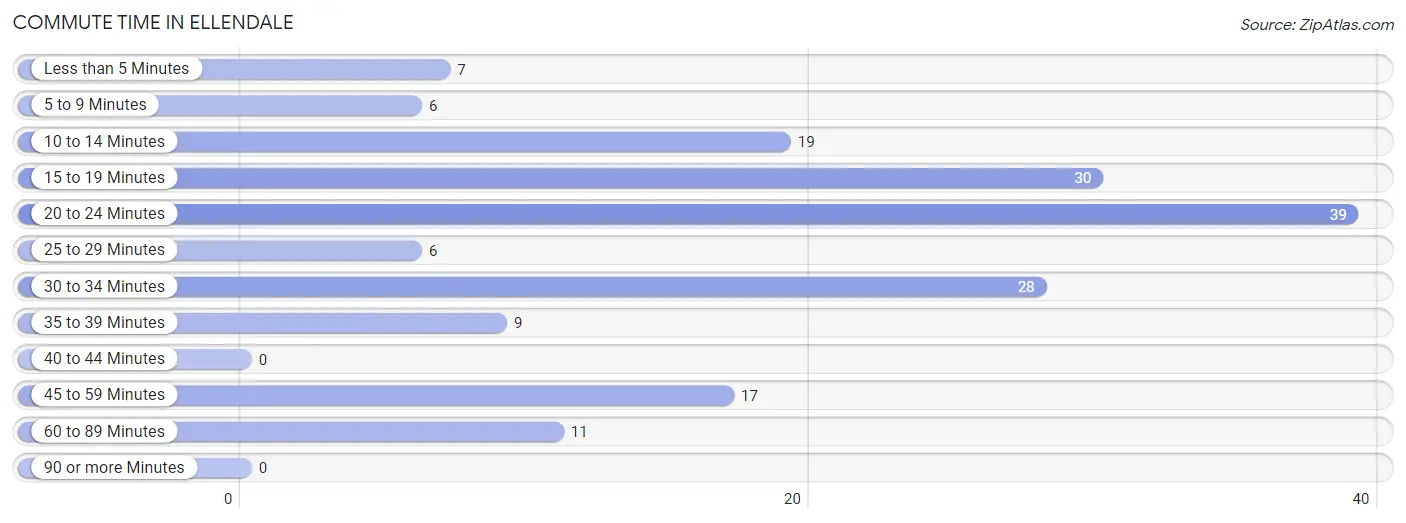
| Commute Time | # Commuters | % Commuters |
| Less than 5 Minutes | 7 | 4.1% |
| 5 to 9 Minutes | 6 | 3.5% |
| 10 to 14 Minutes | 19 | 11.1% |
| 15 to 19 Minutes | 30 | 17.4% |
| 20 to 24 Minutes | 39 | 22.7% |
| 25 to 29 Minutes | 6 | 3.5% |
| 30 to 34 Minutes | 28 | 16.3% |
| 35 to 39 Minutes | 9 | 5.2% |
| 40 to 44 Minutes | 0 | 0.0% |
| 45 to 59 Minutes | 17 | 9.9% |
| 60 to 89 Minutes | 11 | 6.4% |
| 90 or more Minutes | 0 | 0.0% |
Commute Time by Sex in Ellendale
The most common commute times in Ellendale are 10 to 14 minutes (19 commuters, 22.1%) for males and 20 to 24 minutes (29 commuters, 33.7%) for females.
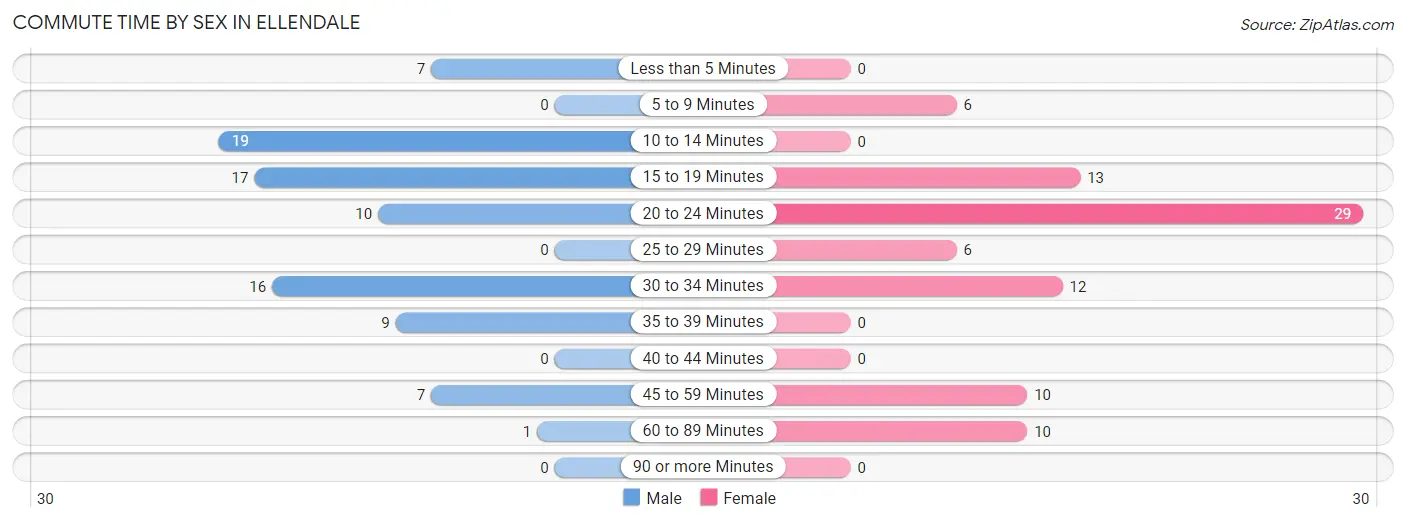
| Commute Time | Male | Female |
| Less than 5 Minutes | 7 (8.1%) | 0 (0.0%) |
| 5 to 9 Minutes | 0 (0.0%) | 6 (7.0%) |
| 10 to 14 Minutes | 19 (22.1%) | 0 (0.0%) |
| 15 to 19 Minutes | 17 (19.8%) | 13 (15.1%) |
| 20 to 24 Minutes | 10 (11.6%) | 29 (33.7%) |
| 25 to 29 Minutes | 0 (0.0%) | 6 (7.0%) |
| 30 to 34 Minutes | 16 (18.6%) | 12 (14.0%) |
| 35 to 39 Minutes | 9 (10.5%) | 0 (0.0%) |
| 40 to 44 Minutes | 0 (0.0%) | 0 (0.0%) |
| 45 to 59 Minutes | 7 (8.1%) | 10 (11.6%) |
| 60 to 89 Minutes | 1 (1.2%) | 10 (11.6%) |
| 90 or more Minutes | 0 (0.0%) | 0 (0.0%) |
Time of Departure to Work by Sex in Ellendale
The most frequent times of departure to work in Ellendale are 7:30 AM to 7:59 AM (22, 25.6%) for males and 7:00 AM to 7:29 AM (23, 26.7%) for females.
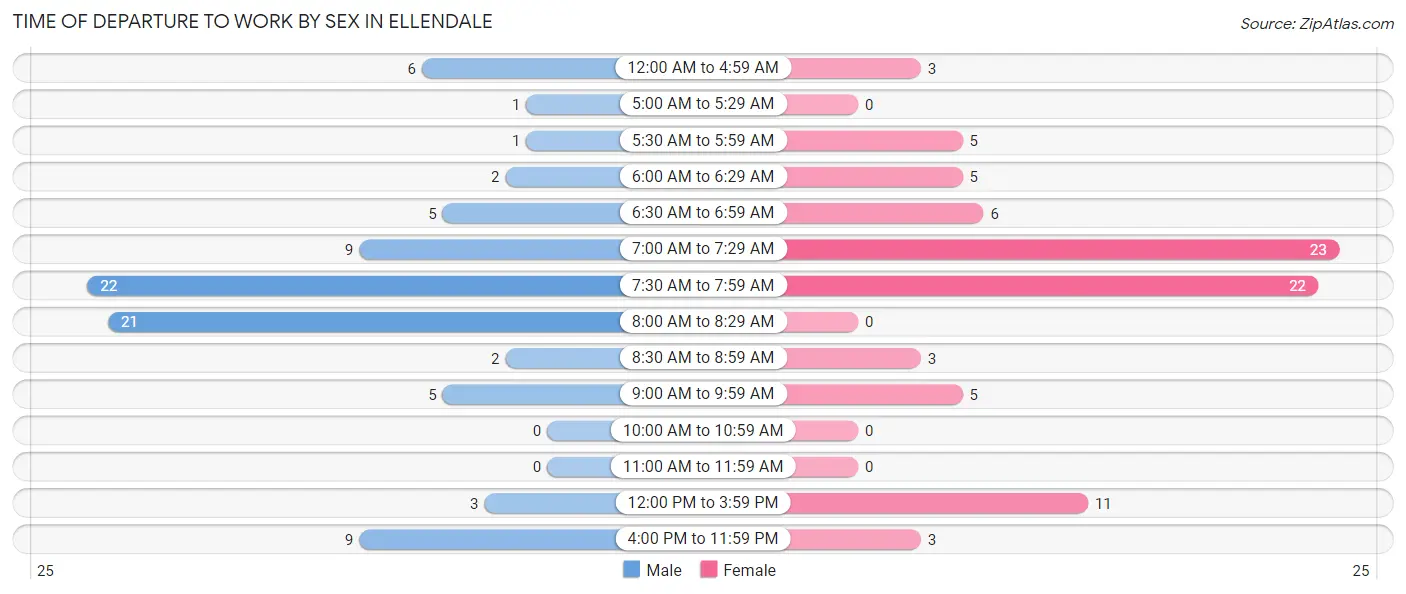
| Time of Departure | Male | Female |
| 12:00 AM to 4:59 AM | 6 (7.0%) | 3 (3.5%) |
| 5:00 AM to 5:29 AM | 1 (1.2%) | 0 (0.0%) |
| 5:30 AM to 5:59 AM | 1 (1.2%) | 5 (5.8%) |
| 6:00 AM to 6:29 AM | 2 (2.3%) | 5 (5.8%) |
| 6:30 AM to 6:59 AM | 5 (5.8%) | 6 (7.0%) |
| 7:00 AM to 7:29 AM | 9 (10.5%) | 23 (26.7%) |
| 7:30 AM to 7:59 AM | 22 (25.6%) | 22 (25.6%) |
| 8:00 AM to 8:29 AM | 21 (24.4%) | 0 (0.0%) |
| 8:30 AM to 8:59 AM | 2 (2.3%) | 3 (3.5%) |
| 9:00 AM to 9:59 AM | 5 (5.8%) | 5 (5.8%) |
| 10:00 AM to 10:59 AM | 0 (0.0%) | 0 (0.0%) |
| 11:00 AM to 11:59 AM | 0 (0.0%) | 0 (0.0%) |
| 12:00 PM to 3:59 PM | 3 (3.5%) | 11 (12.8%) |
| 4:00 PM to 11:59 PM | 9 (10.5%) | 3 (3.5%) |
| Total | 86 (100.0%) | 86 (100.0%) |
Housing Occupancy in Ellendale
Occupancy by Ownership in Ellendale
Of the total 169 dwellings in Ellendale, owner-occupied units account for 140 (82.8%), while renter-occupied units make up 29 (17.2%).
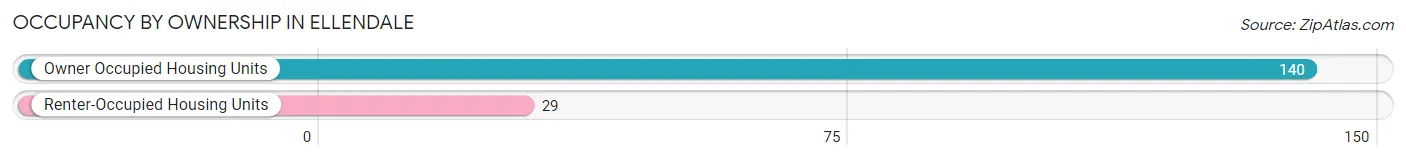
| Occupancy | # Housing Units | % Housing Units |
| Owner Occupied Housing Units | 140 | 82.8% |
| Renter-Occupied Housing Units | 29 | 17.2% |
| Total Occupied Housing Units | 169 | 100.0% |
Occupancy by Household Size in Ellendale
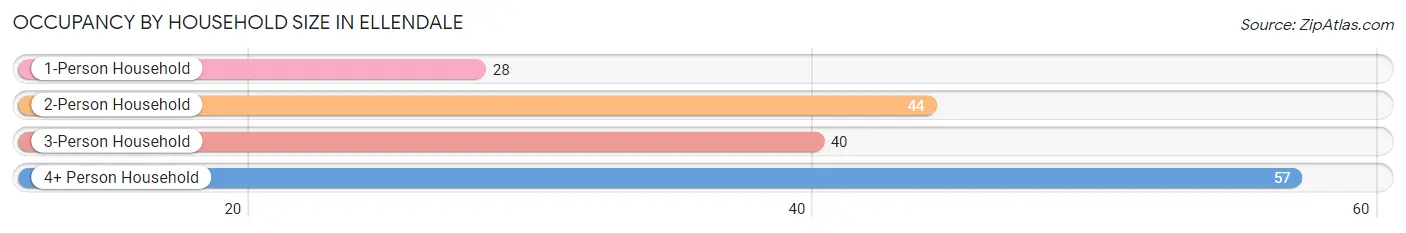
| Household Size | # Housing Units | % Housing Units |
| 1-Person Household | 28 | 16.6% |
| 2-Person Household | 44 | 26.0% |
| 3-Person Household | 40 | 23.7% |
| 4+ Person Household | 57 | 33.7% |
| Total Housing Units | 169 | 100.0% |
Occupancy by Ownership by Household Size in Ellendale
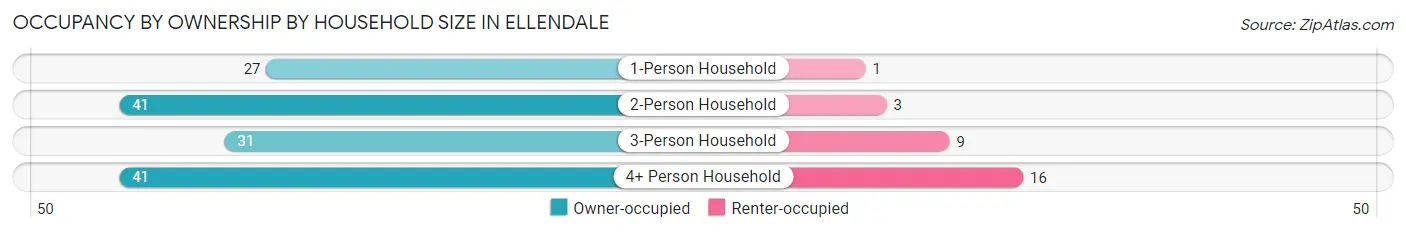
| Household Size | Owner-occupied | Renter-occupied |
| 1-Person Household | 27 (96.4%) | 1 (3.6%) |
| 2-Person Household | 41 (93.2%) | 3 (6.8%) |
| 3-Person Household | 31 (77.5%) | 9 (22.5%) |
| 4+ Person Household | 41 (71.9%) | 16 (28.1%) |
| Total Housing Units | 140 (82.8%) | 29 (17.2%) |
Occupancy by Educational Attainment in Ellendale
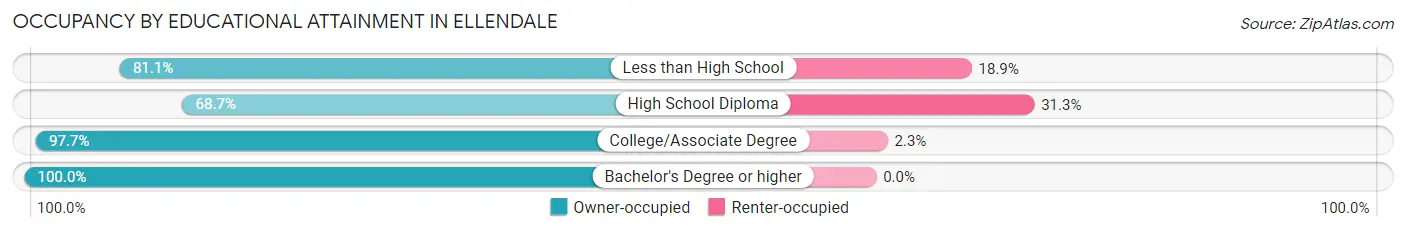
| Household Size | Owner-occupied | Renter-occupied |
| Less than High School | 30 (81.1%) | 7 (18.9%) |
| High School Diploma | 46 (68.7%) | 21 (31.3%) |
| College/Associate Degree | 43 (97.7%) | 1 (2.3%) |
| Bachelor's Degree or higher | 21 (100.0%) | 0 (0.0%) |
Occupancy by Age of Householder in Ellendale
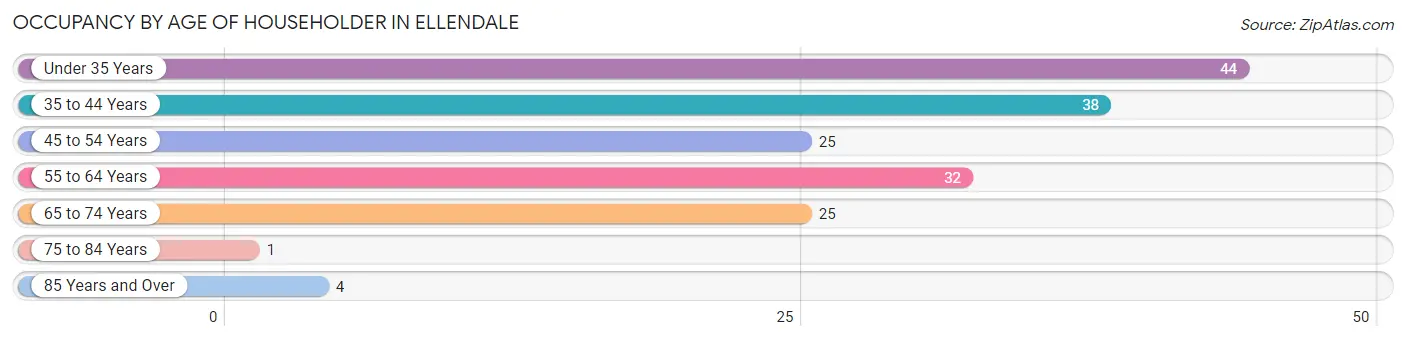
| Age Bracket | # Households | % Households |
| Under 35 Years | 44 | 26.0% |
| 35 to 44 Years | 38 | 22.5% |
| 45 to 54 Years | 25 | 14.8% |
| 55 to 64 Years | 32 | 18.9% |
| 65 to 74 Years | 25 | 14.8% |
| 75 to 84 Years | 1 | 0.6% |
| 85 Years and Over | 4 | 2.4% |
| Total | 169 | 100.0% |
Housing Finances in Ellendale
Median Income by Occupancy in Ellendale
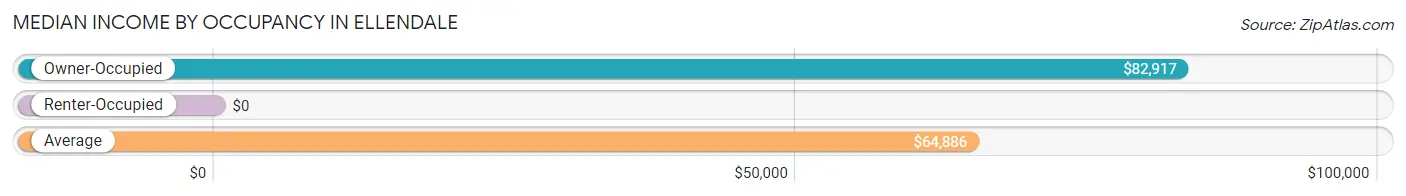
| Occupancy Type | # Households | Median Income |
| Owner-Occupied | 140 (82.8%) | $82,917 |
| Renter-Occupied | 29 (17.2%) | $0 |
| Average | 169 (100.0%) | $64,886 |
Occupancy by Householder Income Bracket in Ellendale
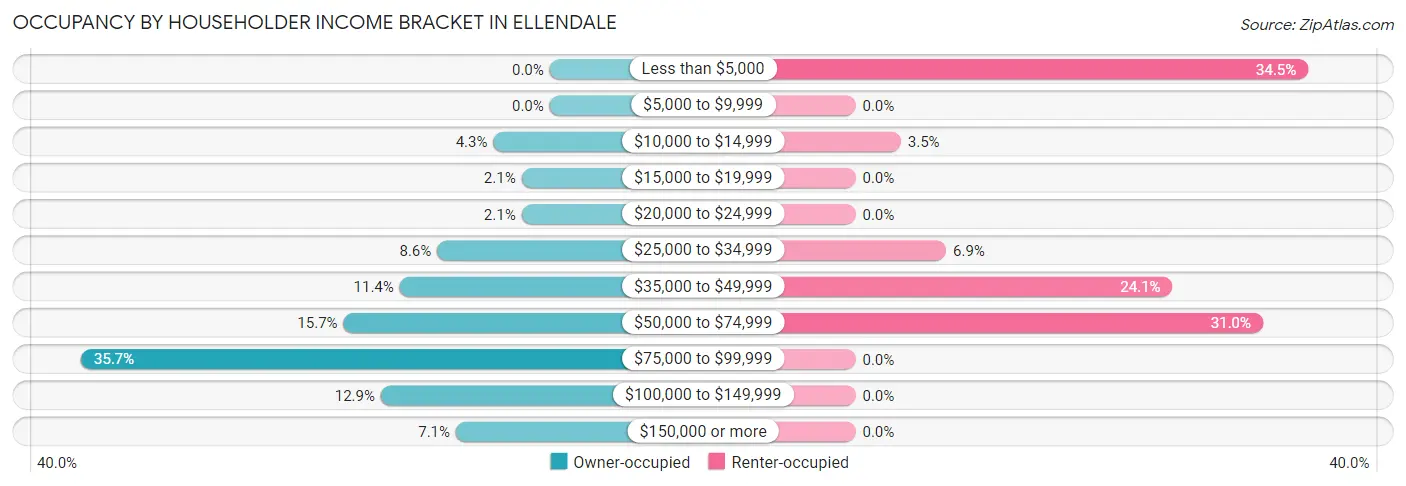
| Income Bracket | Owner-occupied | Renter-occupied |
| Less than $5,000 | 0 (0.0%) | 10 (34.5%) |
| $5,000 to $9,999 | 0 (0.0%) | 0 (0.0%) |
| $10,000 to $14,999 | 6 (4.3%) | 1 (3.5%) |
| $15,000 to $19,999 | 3 (2.1%) | 0 (0.0%) |
| $20,000 to $24,999 | 3 (2.1%) | 0 (0.0%) |
| $25,000 to $34,999 | 12 (8.6%) | 2 (6.9%) |
| $35,000 to $49,999 | 16 (11.4%) | 7 (24.1%) |
| $50,000 to $74,999 | 22 (15.7%) | 9 (31.0%) |
| $75,000 to $99,999 | 50 (35.7%) | 0 (0.0%) |
| $100,000 to $149,999 | 18 (12.9%) | 0 (0.0%) |
| $150,000 or more | 10 (7.1%) | 0 (0.0%) |
| Total | 140 (100.0%) | 29 (100.0%) |
Monthly Housing Cost Tiers in Ellendale
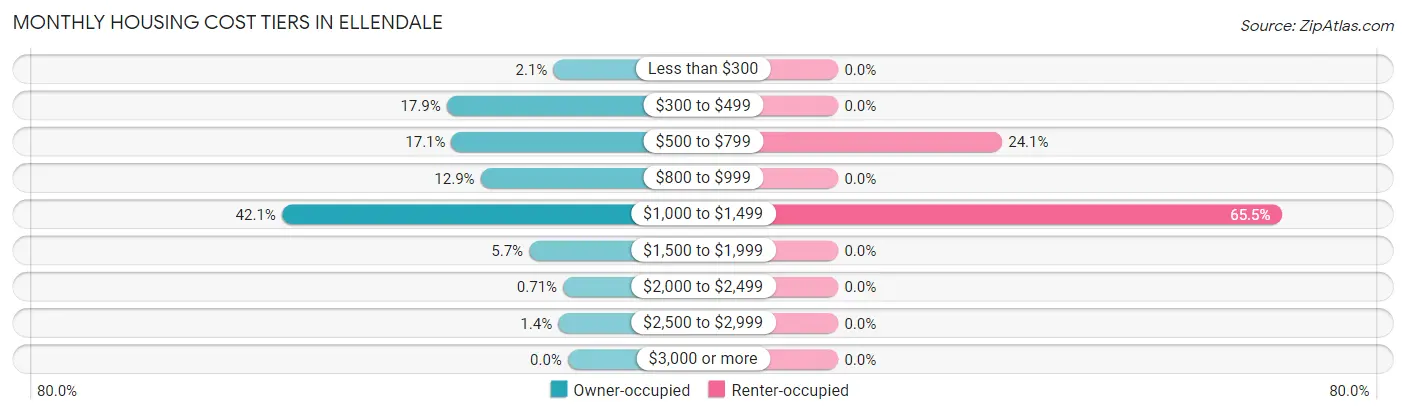
| Monthly Cost | Owner-occupied | Renter-occupied |
| Less than $300 | 3 (2.1%) | 0 (0.0%) |
| $300 to $499 | 25 (17.9%) | 0 (0.0%) |
| $500 to $799 | 24 (17.1%) | 7 (24.1%) |
| $800 to $999 | 18 (12.9%) | 0 (0.0%) |
| $1,000 to $1,499 | 59 (42.1%) | 19 (65.5%) |
| $1,500 to $1,999 | 8 (5.7%) | 0 (0.0%) |
| $2,000 to $2,499 | 1 (0.7%) | 0 (0.0%) |
| $2,500 to $2,999 | 2 (1.4%) | 0 (0.0%) |
| $3,000 or more | 0 (0.0%) | 0 (0.0%) |
| Total | 140 (100.0%) | 29 (100.0%) |
Physical Housing Characteristics in Ellendale
Housing Structures in Ellendale
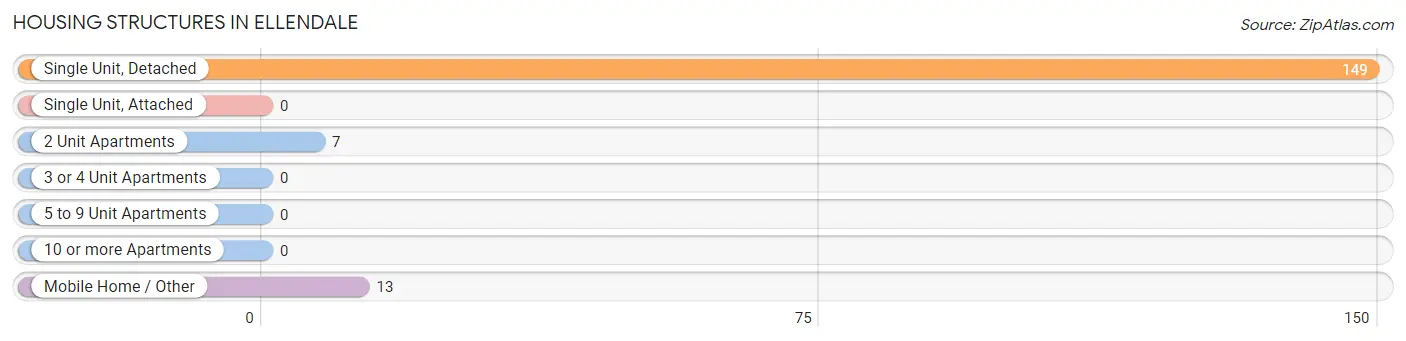
| Structure Type | # Housing Units | % Housing Units |
| Single Unit, Detached | 149 | 88.2% |
| Single Unit, Attached | 0 | 0.0% |
| 2 Unit Apartments | 7 | 4.1% |
| 3 or 4 Unit Apartments | 0 | 0.0% |
| 5 to 9 Unit Apartments | 0 | 0.0% |
| 10 or more Apartments | 0 | 0.0% |
| Mobile Home / Other | 13 | 7.7% |
| Total | 169 | 100.0% |
Housing Structures by Occupancy in Ellendale
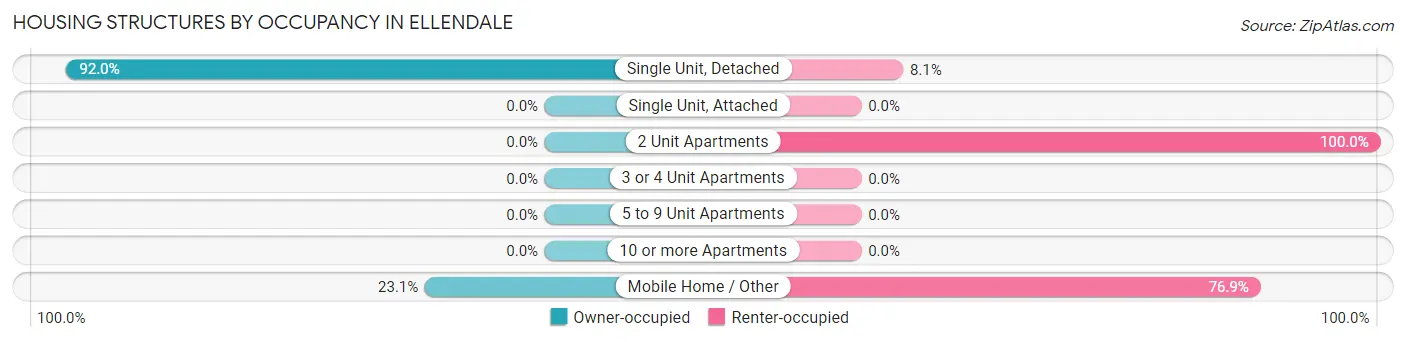
| Structure Type | Owner-occupied | Renter-occupied |
| Single Unit, Detached | 137 (91.9%) | 12 (8.1%) |
| Single Unit, Attached | 0 (0.0%) | 0 (0.0%) |
| 2 Unit Apartments | 0 (0.0%) | 7 (100.0%) |
| 3 or 4 Unit Apartments | 0 (0.0%) | 0 (0.0%) |
| 5 to 9 Unit Apartments | 0 (0.0%) | 0 (0.0%) |
| 10 or more Apartments | 0 (0.0%) | 0 (0.0%) |
| Mobile Home / Other | 3 (23.1%) | 10 (76.9%) |
| Total | 140 (82.8%) | 29 (17.2%) |
Housing Structures by Number of Rooms in Ellendale
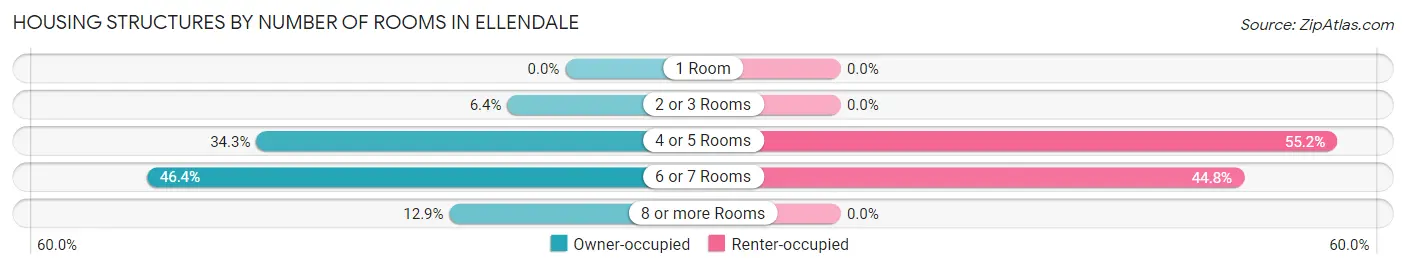
| Number of Rooms | Owner-occupied | Renter-occupied |
| 1 Room | 0 (0.0%) | 0 (0.0%) |
| 2 or 3 Rooms | 9 (6.4%) | 0 (0.0%) |
| 4 or 5 Rooms | 48 (34.3%) | 16 (55.2%) |
| 6 or 7 Rooms | 65 (46.4%) | 13 (44.8%) |
| 8 or more Rooms | 18 (12.9%) | 0 (0.0%) |
| Total | 140 (100.0%) | 29 (100.0%) |
Housing Structure by Heating Type in Ellendale
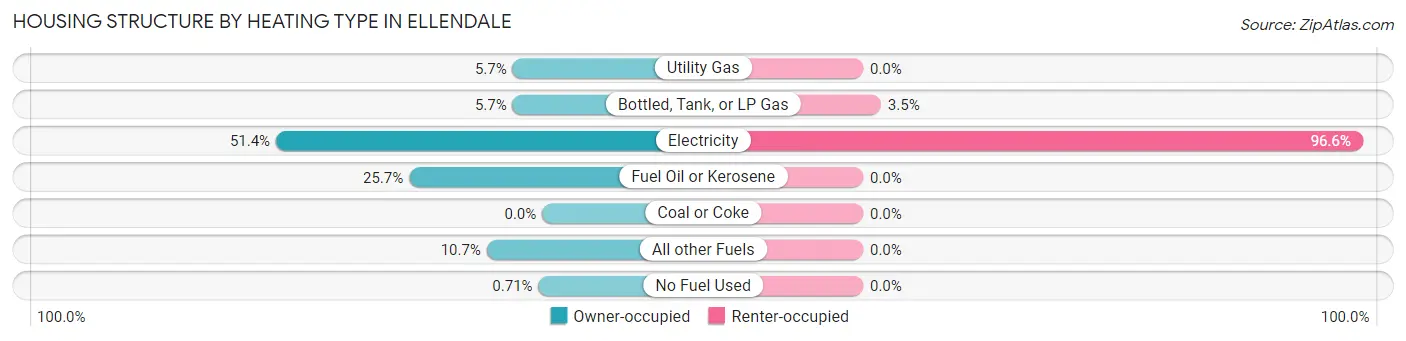
| Heating Type | Owner-occupied | Renter-occupied |
| Utility Gas | 8 (5.7%) | 0 (0.0%) |
| Bottled, Tank, or LP Gas | 8 (5.7%) | 1 (3.5%) |
| Electricity | 72 (51.4%) | 28 (96.6%) |
| Fuel Oil or Kerosene | 36 (25.7%) | 0 (0.0%) |
| Coal or Coke | 0 (0.0%) | 0 (0.0%) |
| All other Fuels | 15 (10.7%) | 0 (0.0%) |
| No Fuel Used | 1 (0.7%) | 0 (0.0%) |
| Total | 140 (100.0%) | 29 (100.0%) |
Household Vehicle Usage in Ellendale
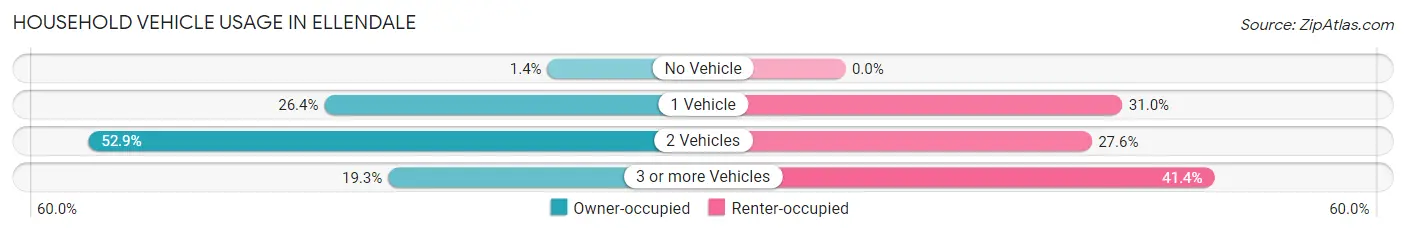
| Vehicles per Household | Owner-occupied | Renter-occupied |
| No Vehicle | 2 (1.4%) | 0 (0.0%) |
| 1 Vehicle | 37 (26.4%) | 9 (31.0%) |
| 2 Vehicles | 74 (52.9%) | 8 (27.6%) |
| 3 or more Vehicles | 27 (19.3%) | 12 (41.4%) |
| Total | 140 (100.0%) | 29 (100.0%) |
Real Estate & Mortgages in Ellendale
Real Estate and Mortgage Overview in Ellendale
| Characteristic | Without Mortgage | With Mortgage |
| Housing Units | 49 | 91 |
| Median Property Value | $181,300 | $223,300 |
| Median Household Income | $78,750 | $3 |
| Monthly Housing Costs | $478 | $0 |
| Real Estate Taxes | $1,018 | $16 |
Property Value by Mortgage Status in Ellendale
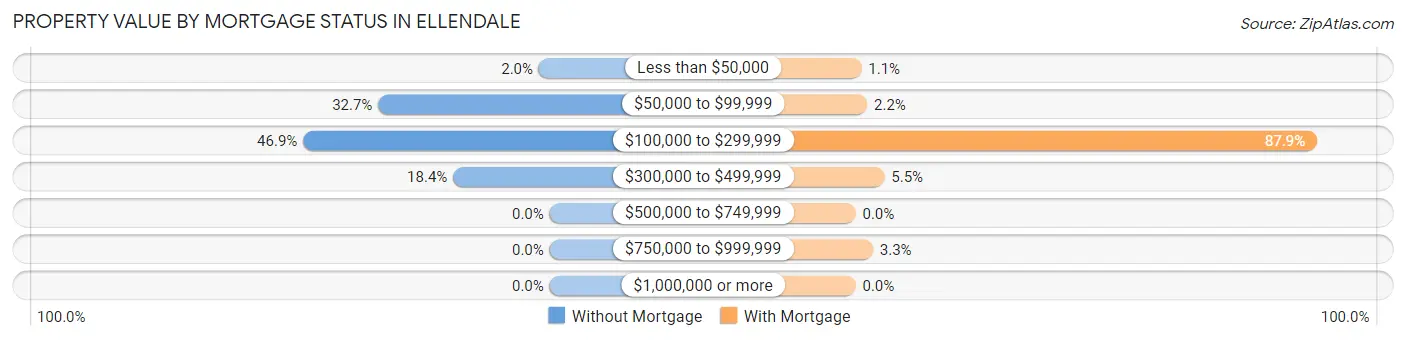
| Property Value | Without Mortgage | With Mortgage |
| Less than $50,000 | 1 (2.0%) | 1 (1.1%) |
| $50,000 to $99,999 | 16 (32.7%) | 2 (2.2%) |
| $100,000 to $299,999 | 23 (46.9%) | 80 (87.9%) |
| $300,000 to $499,999 | 9 (18.4%) | 5 (5.5%) |
| $500,000 to $749,999 | 0 (0.0%) | 0 (0.0%) |
| $750,000 to $999,999 | 0 (0.0%) | 3 (3.3%) |
| $1,000,000 or more | 0 (0.0%) | 0 (0.0%) |
| Total | 49 (100.0%) | 91 (100.0%) |
Household Income by Mortgage Status in Ellendale

| Household Income | Without Mortgage | With Mortgage |
| Less than $10,000 | 0 (0.0%) | 0 (0.0%) |
| $10,000 to $24,999 | 8 (16.3%) | 0 (0.0%) |
| $25,000 to $34,999 | 1 (2.0%) | 4 (4.4%) |
| $35,000 to $49,999 | 11 (22.5%) | 11 (12.1%) |
| $50,000 to $74,999 | 2 (4.1%) | 5 (5.5%) |
| $75,000 to $99,999 | 9 (18.4%) | 20 (22.0%) |
| $100,000 to $149,999 | 11 (22.5%) | 41 (45.1%) |
| $150,000 or more | 7 (14.3%) | 7 (7.7%) |
| Total | 49 (100.0%) | 91 (100.0%) |
Property Value to Household Income Ratio in Ellendale
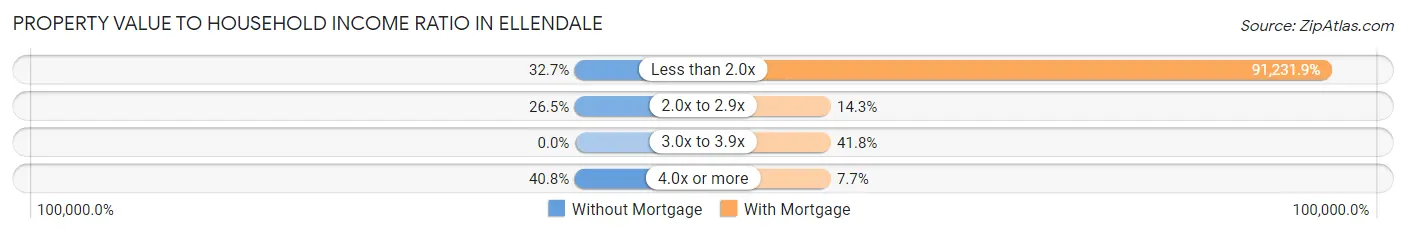
| Value-to-Income Ratio | Without Mortgage | With Mortgage |
| Less than 2.0x | 16 (32.7%) | 83,021 (91,231.9%) |
| 2.0x to 2.9x | 13 (26.5%) | 13 (14.3%) |
| 3.0x to 3.9x | 0 (0.0%) | 38 (41.8%) |
| 4.0x or more | 20 (40.8%) | 7 (7.7%) |
| Total | 49 (100.0%) | 91 (100.0%) |
Real Estate Taxes by Mortgage Status in Ellendale
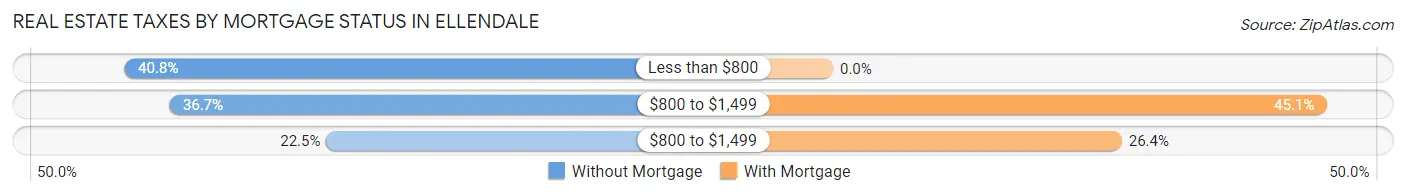
| Property Taxes | Without Mortgage | With Mortgage |
| Less than $800 | 20 (40.8%) | 0 (0.0%) |
| $800 to $1,499 | 18 (36.7%) | 41 (45.1%) |
| $800 to $1,499 | 11 (22.5%) | 24 (26.4%) |
| Total | 49 (100.0%) | 91 (100.0%) |
Health & Disability in Ellendale
Health Insurance Coverage by Age in Ellendale
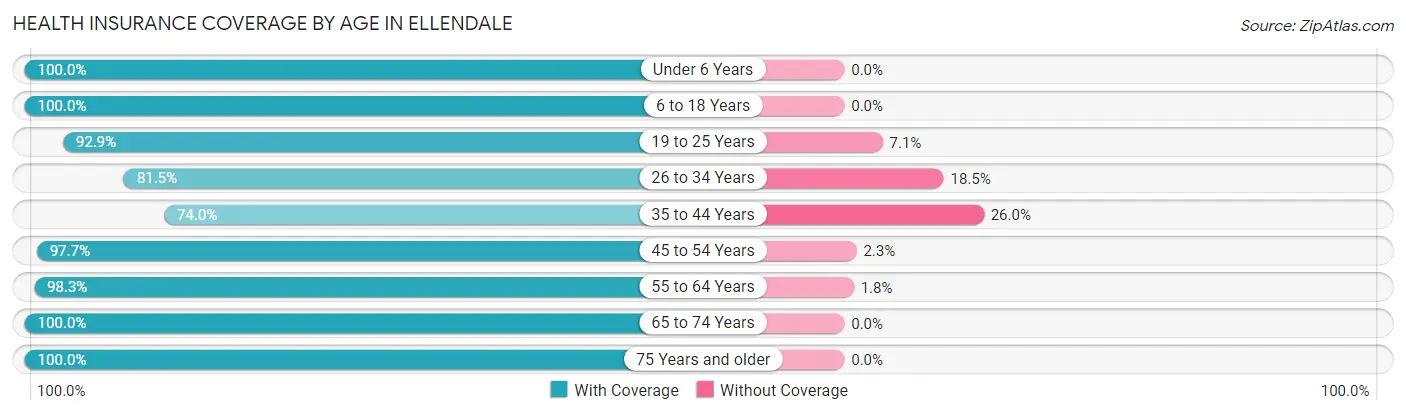
| Age Bracket | With Coverage | Without Coverage |
| Under 6 Years | 175 (100.0%) | 0 (0.0%) |
| 6 to 18 Years | 145 (100.0%) | 0 (0.0%) |
| 19 to 25 Years | 26 (92.9%) | 2 (7.1%) |
| 26 to 34 Years | 44 (81.5%) | 10 (18.5%) |
| 35 to 44 Years | 37 (74.0%) | 13 (26.0%) |
| 45 to 54 Years | 43 (97.7%) | 1 (2.3%) |
| 55 to 64 Years | 56 (98.3%) | 1 (1.8%) |
| 65 to 74 Years | 42 (100.0%) | 0 (0.0%) |
| 75 Years and older | 13 (100.0%) | 0 (0.0%) |
| Total | 581 (95.6%) | 27 (4.4%) |
Health Insurance Coverage by Citizenship Status in Ellendale
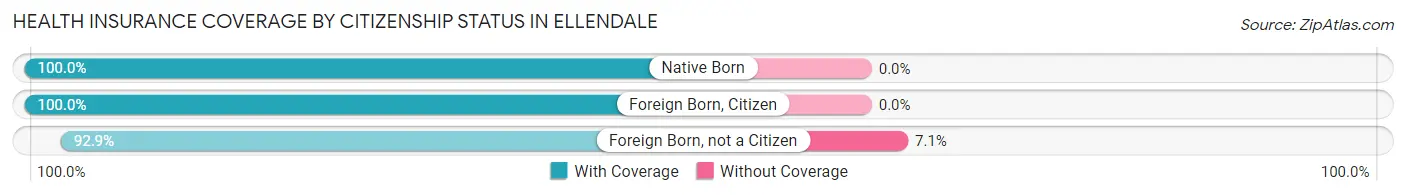
| Citizenship Status | With Coverage | Without Coverage |
| Native Born | 175 (100.0%) | 0 (0.0%) |
| Foreign Born, Citizen | 145 (100.0%) | 0 (0.0%) |
| Foreign Born, not a Citizen | 26 (92.9%) | 2 (7.1%) |
Health Insurance Coverage by Household Income in Ellendale
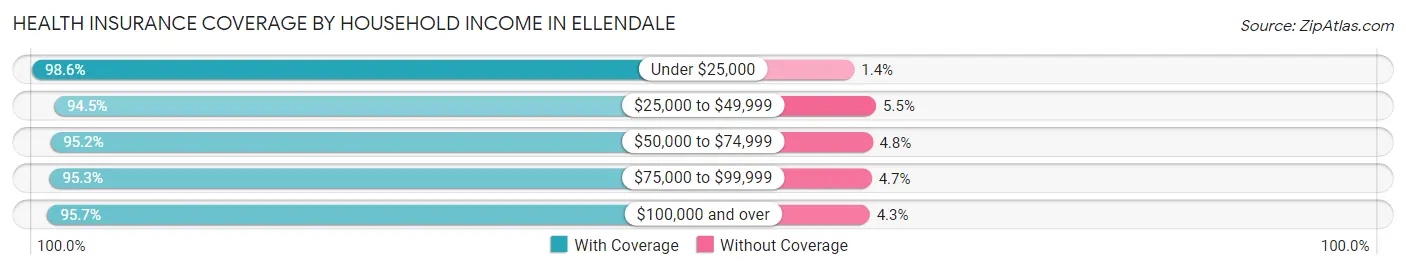
| Household Income | With Coverage | Without Coverage |
| Under $25,000 | 70 (98.6%) | 1 (1.4%) |
| $25,000 to $49,999 | 103 (94.5%) | 6 (5.5%) |
| $50,000 to $74,999 | 198 (95.2%) | 10 (4.8%) |
| $75,000 to $99,999 | 143 (95.3%) | 7 (4.7%) |
| $100,000 and over | 67 (95.7%) | 3 (4.3%) |
Public vs Private Health Insurance Coverage by Age in Ellendale
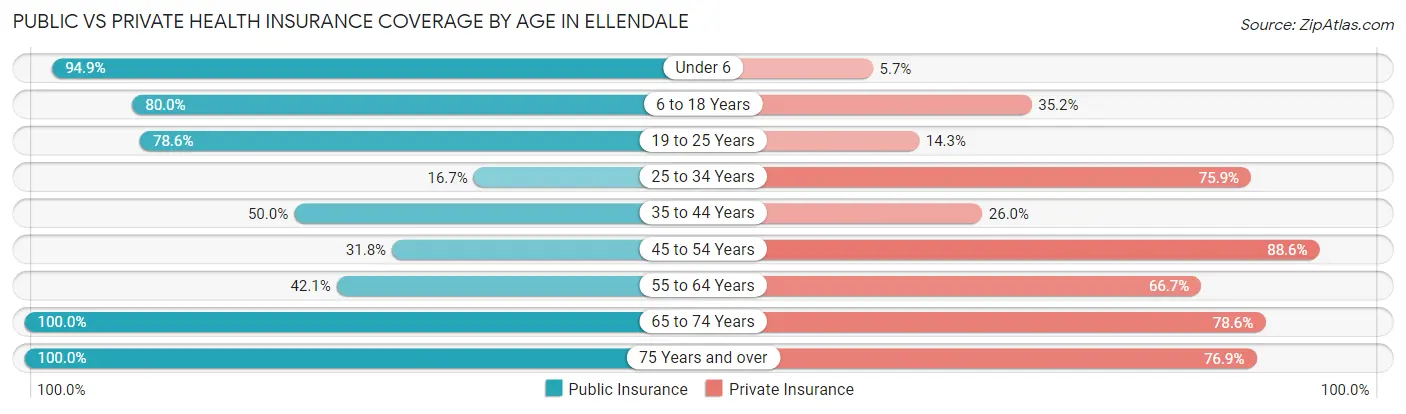
| Age Bracket | Public Insurance | Private Insurance |
| Under 6 | 166 (94.9%) | 10 (5.7%) |
| 6 to 18 Years | 116 (80.0%) | 51 (35.2%) |
| 19 to 25 Years | 22 (78.6%) | 4 (14.3%) |
| 25 to 34 Years | 9 (16.7%) | 41 (75.9%) |
| 35 to 44 Years | 25 (50.0%) | 13 (26.0%) |
| 45 to 54 Years | 14 (31.8%) | 39 (88.6%) |
| 55 to 64 Years | 24 (42.1%) | 38 (66.7%) |
| 65 to 74 Years | 42 (100.0%) | 33 (78.6%) |
| 75 Years and over | 13 (100.0%) | 10 (76.9%) |
| Total | 431 (70.9%) | 239 (39.3%) |
Disability Status by Sex by Age in Ellendale
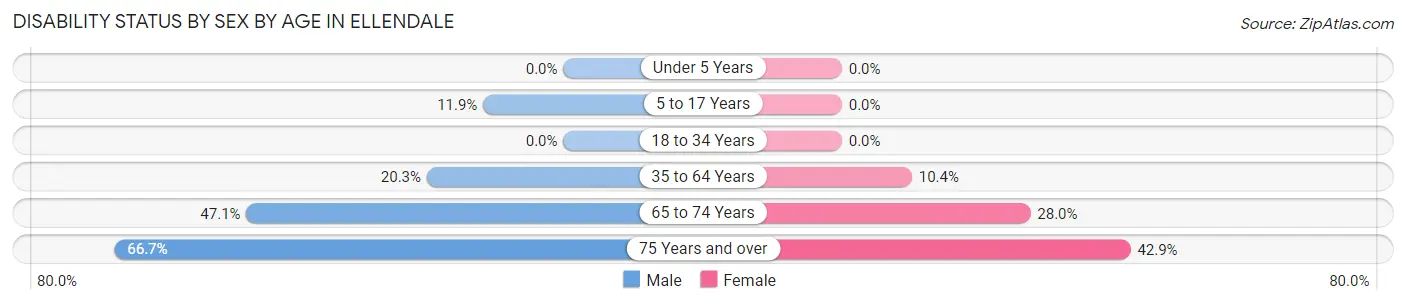
| Age Bracket | Male | Female |
| Under 5 Years | 0 (0.0%) | 0 (0.0%) |
| 5 to 17 Years | 10 (11.9%) | 0 (0.0%) |
| 18 to 34 Years | 0 (0.0%) | 0 (0.0%) |
| 35 to 64 Years | 15 (20.3%) | 8 (10.4%) |
| 65 to 74 Years | 8 (47.1%) | 7 (28.0%) |
| 75 Years and over | 4 (66.7%) | 3 (42.9%) |
Disability Class by Sex by Age in Ellendale
Disability Class: Hearing Difficulty
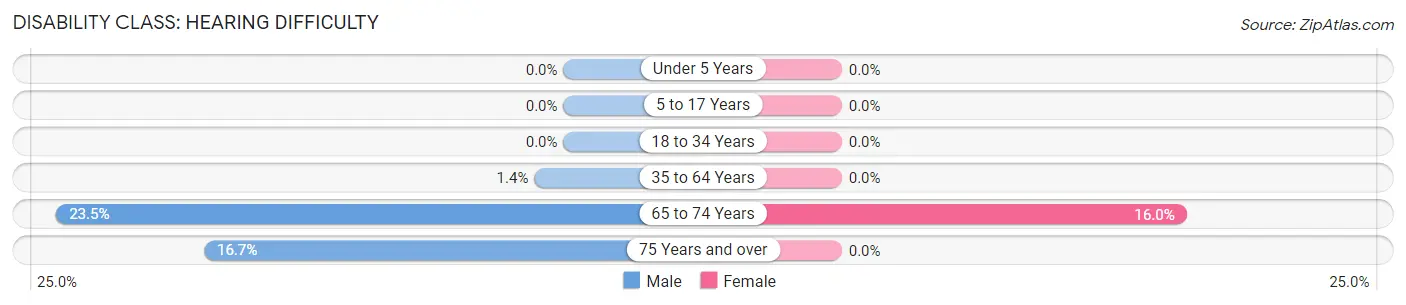
| Age Bracket | Male | Female |
| Under 5 Years | 0 (0.0%) | 0 (0.0%) |
| 5 to 17 Years | 0 (0.0%) | 0 (0.0%) |
| 18 to 34 Years | 0 (0.0%) | 0 (0.0%) |
| 35 to 64 Years | 1 (1.3%) | 0 (0.0%) |
| 65 to 74 Years | 4 (23.5%) | 4 (16.0%) |
| 75 Years and over | 1 (16.7%) | 0 (0.0%) |
Disability Class: Vision Difficulty
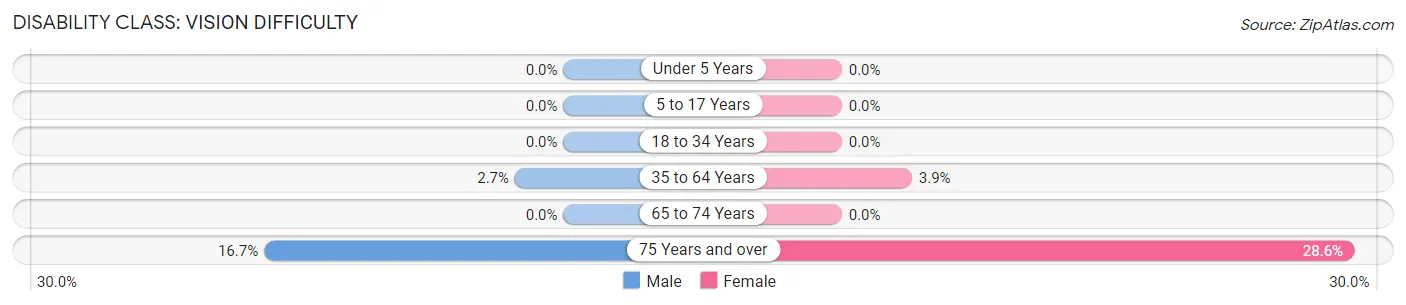
| Age Bracket | Male | Female |
| Under 5 Years | 0 (0.0%) | 0 (0.0%) |
| 5 to 17 Years | 0 (0.0%) | 0 (0.0%) |
| 18 to 34 Years | 0 (0.0%) | 0 (0.0%) |
| 35 to 64 Years | 2 (2.7%) | 3 (3.9%) |
| 65 to 74 Years | 0 (0.0%) | 0 (0.0%) |
| 75 Years and over | 1 (16.7%) | 2 (28.6%) |
Disability Class: Cognitive Difficulty
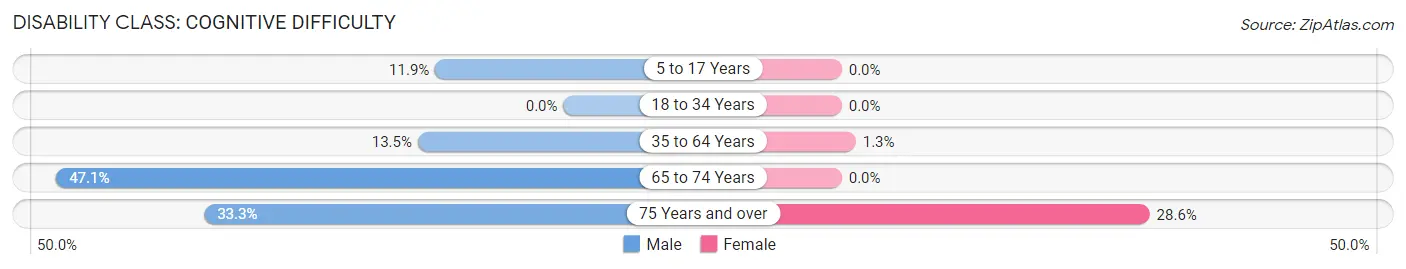
| Age Bracket | Male | Female |
| 5 to 17 Years | 10 (11.9%) | 0 (0.0%) |
| 18 to 34 Years | 0 (0.0%) | 0 (0.0%) |
| 35 to 64 Years | 10 (13.5%) | 1 (1.3%) |
| 65 to 74 Years | 8 (47.1%) | 0 (0.0%) |
| 75 Years and over | 2 (33.3%) | 2 (28.6%) |
Disability Class: Ambulatory Difficulty
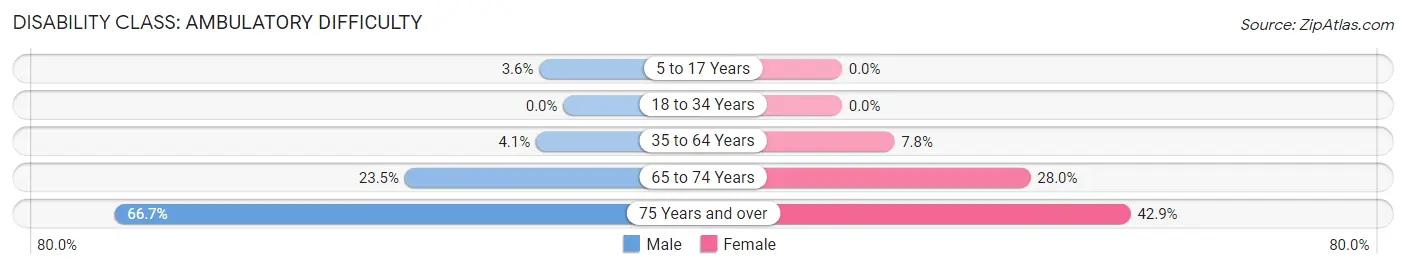
| Age Bracket | Male | Female |
| 5 to 17 Years | 3 (3.6%) | 0 (0.0%) |
| 18 to 34 Years | 0 (0.0%) | 0 (0.0%) |
| 35 to 64 Years | 3 (4.1%) | 6 (7.8%) |
| 65 to 74 Years | 4 (23.5%) | 7 (28.0%) |
| 75 Years and over | 4 (66.7%) | 3 (42.9%) |
Disability Class: Self-Care Difficulty
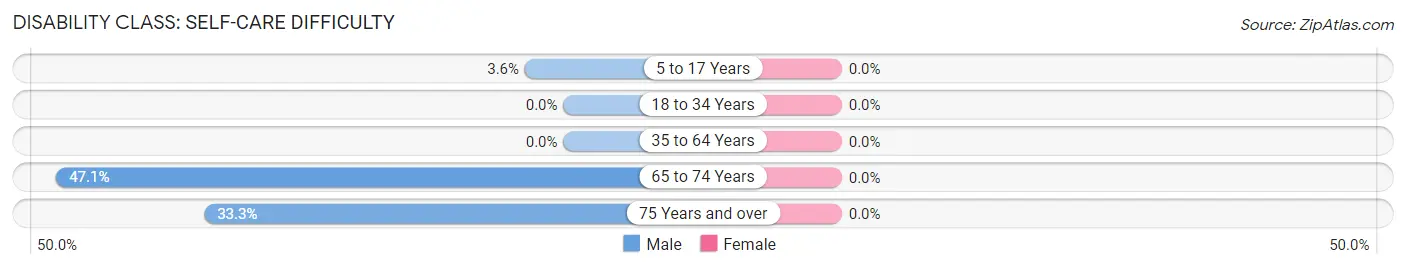
| Age Bracket | Male | Female |
| 5 to 17 Years | 3 (3.6%) | 0 (0.0%) |
| 18 to 34 Years | 0 (0.0%) | 0 (0.0%) |
| 35 to 64 Years | 0 (0.0%) | 0 (0.0%) |
| 65 to 74 Years | 8 (47.1%) | 0 (0.0%) |
| 75 Years and over | 2 (33.3%) | 0 (0.0%) |
Technology Access in Ellendale
Computing Device Access in Ellendale
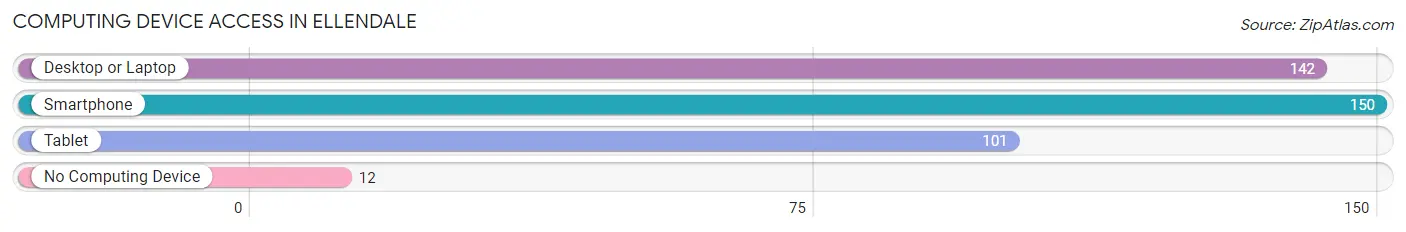
| Device Type | # Households | % Households |
| Desktop or Laptop | 142 | 84.0% |
| Smartphone | 150 | 88.8% |
| Tablet | 101 | 59.8% |
| No Computing Device | 12 | 7.1% |
| Total | 169 | 100.0% |
Internet Access in Ellendale
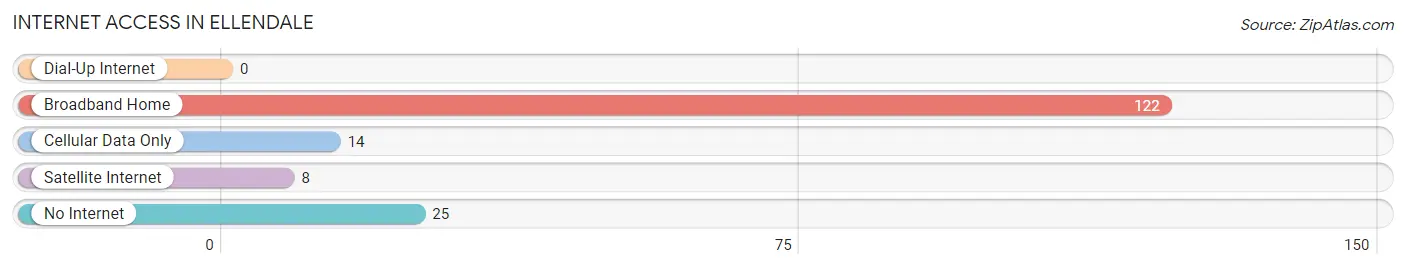
| Internet Type | # Households | % Households |
| Dial-Up Internet | 0 | 0.0% |
| Broadband Home | 122 | 72.2% |
| Cellular Data Only | 14 | 8.3% |
| Satellite Internet | 8 | 4.7% |
| No Internet | 25 | 14.8% |
| Total | 169 | 100.0% |
Ellendale Summary
Ellendale, Delaware is a small town located in Sussex County, Delaware. It is situated in the northern part of the state, about 25 miles from the state capital of Dover. The town has a population of 1,717 people, according to the 2010 census.
History
The area that is now Ellendale was first settled in the late 1700s by a group of Quakers from Pennsylvania. The town was originally known as “Quaker Neck” and was part of a larger area known as Broad Creek Hundred. In 1859, the town was officially incorporated as Ellendale, named after the Ellendale family who had settled in the area in the early 1800s.
The town was a major agricultural center in the 19th century, with many of the town’s residents working in the farming and canning industries. The town also had a thriving lumber industry, with several sawmills located in the area.
In the early 20th century, Ellendale began to experience a period of growth and development. The town was connected to the rest of the state by the Delaware Railroad in 1906, and the town’s first bank opened in 1908. The town also had a thriving business district, with several stores, restaurants, and other businesses located in the downtown area.
Geography
Ellendale is located in northern Sussex County, Delaware. The town is situated on the Broad Creek, a tributary of the Nanticoke River. The town is located about 25 miles from the state capital of Dover.
The town has a total area of 1.2 square miles, all of which is land. The town is located in a rural area, with the nearest major city being Wilmington, Delaware, which is about 40 miles away.
Economy
The economy of Ellendale is largely based on agriculture and tourism. The town is home to several farms, which produce a variety of crops, including corn, soybeans, and wheat. The town also has several wineries and vineyards, which attract tourists from all over the region.
The town also has a thriving business district, with several stores, restaurants, and other businesses located in the downtown area. The town is also home to several manufacturing companies, which produce a variety of products, including furniture, clothing, and electronics.
Demographics
According to the 2010 census, Ellendale has a population of 1,717 people. The town has a median household income of $45,000, and the median age is 42. The town is predominantly white, with about 90% of the population being white. The town also has a small Hispanic population, with about 5% of the population being Hispanic.
The town is also home to a small African American population, with about 2% of the population being African American. The town also has a small Asian population, with about 1% of the population being Asian. The town also has a small Native American population, with about 0.5% of the population being Native American.
Common Questions
What is Per Capita Income in Ellendale?
Per Capita income in Ellendale is $20,258.
What is the Median Family Income in Ellendale?
Median Family Income in Ellendale is $74,688.
What is the Median Household income in Ellendale?
Median Household Income in Ellendale is $64,886.
What is Income or Wage Gap in Ellendale?
Income or Wage Gap in Ellendale is 34.4%.
Women in Ellendale earn 65.6 cents for every dollar earned by a man.
What is Inequality or Gini Index in Ellendale?
Inequality or Gini Index in Ellendale is 0.33.
What is the Total Population of Ellendale?
Total Population of Ellendale is 609.
What is the Total Male Population of Ellendale?
Total Male Population of Ellendale is 356.
What is the Total Female Population of Ellendale?
Total Female Population of Ellendale is 253.
What is the Ratio of Males per 100 Females in Ellendale?
There are 140.71 Males per 100 Females in Ellendale.
What is the Ratio of Females per 100 Males in Ellendale?
There are 71.07 Females per 100 Males in Ellendale.
What is the Median Population Age in Ellendale?
Median Population Age in Ellendale is 17.4 Years.
What is the Average Family Size in Ellendale
Average Family Size in Ellendale is 4.1 People.
What is the Average Household Size in Ellendale
Average Household Size in Ellendale is 3.6 People.
How Large is the Labor Force in Ellendale?
There are 189 People in the Labor Forcein in Ellendale.
What is the Percentage of People in the Labor Force in Ellendale?
59.6% of People are in the Labor Force in Ellendale.