Zip Codes with the Highest Percentage of Households with Income Below $10,000 in New Britain, CT
RELATED REPORTS & OPTIONS
Household Income | $0-10k
New Britain
Compare Zip Codes
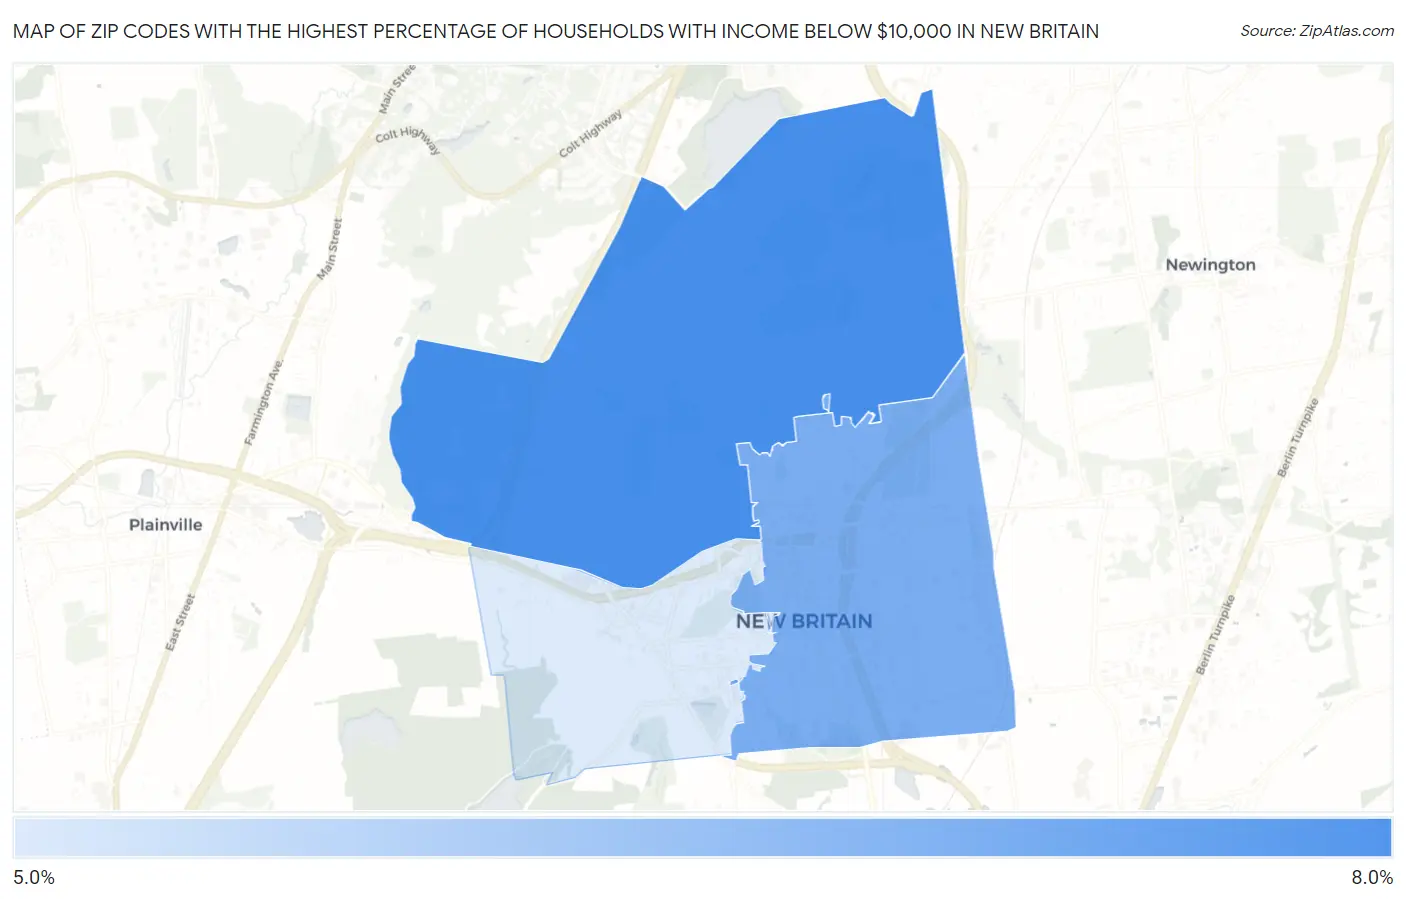
Map of Zip Codes with the Highest Percentage of Households with Income Below $10,000 in New Britain
5.3%
6.8%
Zip Codes with the Highest Percentage of Households with Income Below $10,000 in New Britain, CT
| Zip Code | Households with Income < $10k | vs State | vs National | |
| 1. | 06053 | 6.8% | 4.3%(+2.50)#41 | 4.9%(+1.90)#7,311 |
| 2. | 06051 | 6.3% | 4.3%(+2.00)#45 | 4.9%(+1.40)#8,326 |
| 3. | 06052 | 5.3% | 4.3%(+1.00)#57 | 4.9%(+0.400)#10,844 |
1
Common Questions
What are the Top Zip Codes with the Highest Percentage of Households with Income Below $10,000 in New Britain, CT?
Top Zip Codes with the Highest Percentage of Households with Income Below $10,000 in New Britain, CT are:
What zip code has the Highest Percentage of Households with Income Below $10,000 in New Britain, CT?
06053 has the Highest Percentage of Households with Income Below $10,000 in New Britain, CT with 6.8%.
What is the Percentage of Households with Income Below $10,000 in New Britain, CT?
Percentage of Households with Income Below $10,000 in New Britain is 6.4%.
What is the Percentage of Households with Income Below $10,000 in Connecticut?
Percentage of Households with Income Below $10,000 in Connecticut is 4.3%.
What is the Percentage of Households with Income Below $10,000 in the United States?
Percentage of Households with Income Below $10,000 in the United States is 4.9%.