Zip Codes with the Highest Percentage of Households with Income Below $10,000 in Greenwich, CT
RELATED REPORTS & OPTIONS
Household Income | $0-10k
Greenwich
Compare Zip Codes
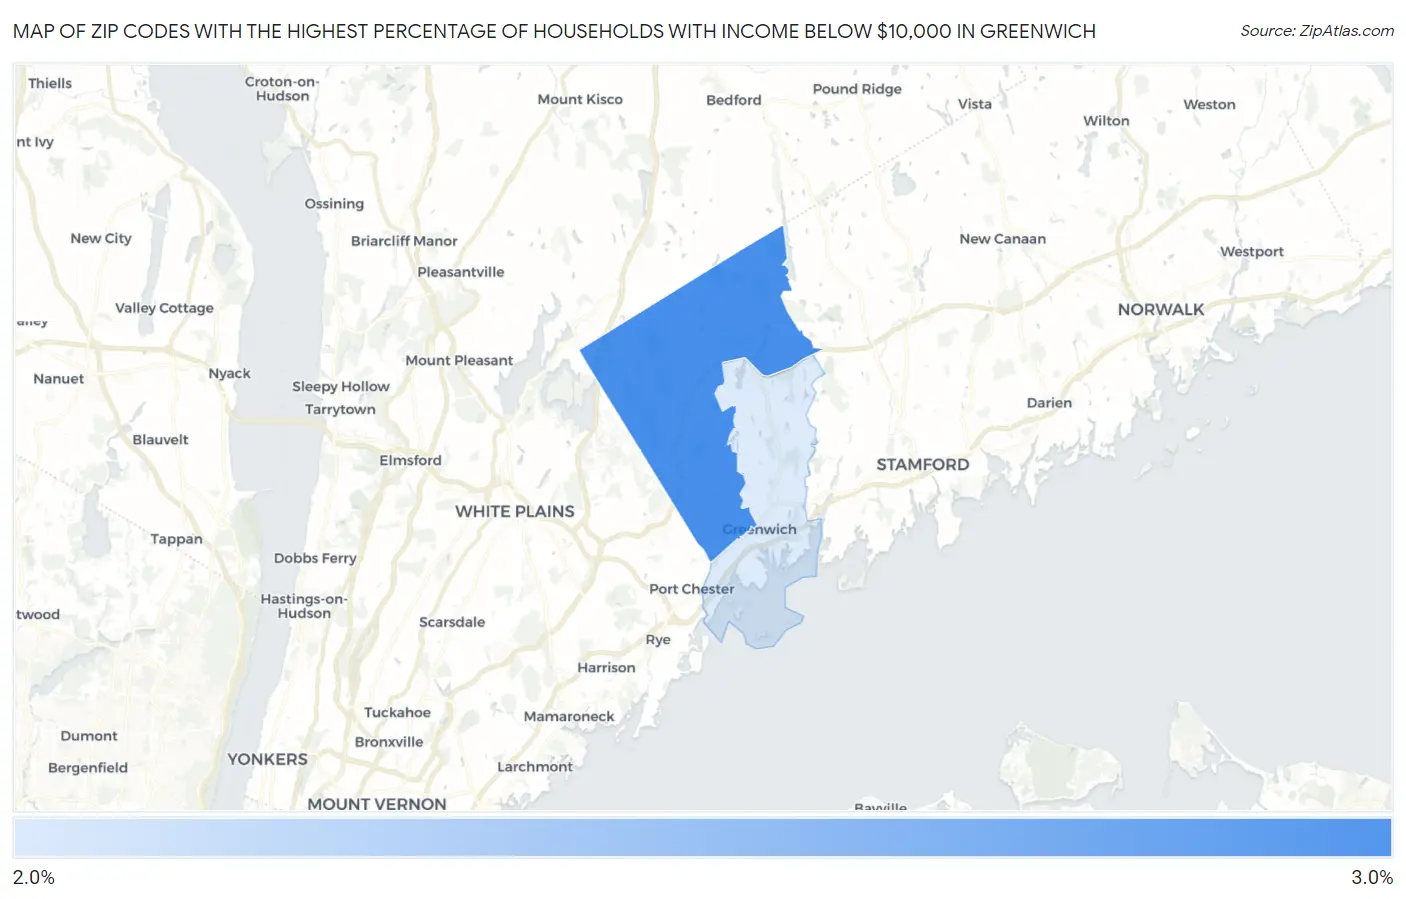
Map of Zip Codes with the Highest Percentage of Households with Income Below $10,000 in Greenwich
2.4%
3.0%
Zip Codes with the Highest Percentage of Households with Income Below $10,000 in Greenwich, CT
| Zip Code | Households with Income < $10k | vs State | vs National | |
| 1. | 06831 | 3.0% | 4.3%(-1.30)#127 | 4.9%(-1.90)#19,441 |
| 2. | 06830 | 2.4% | 4.3%(-1.90)#163 | 4.9%(-2.50)#22,051 |
1
Common Questions
What are the Top Zip Codes with the Highest Percentage of Households with Income Below $10,000 in Greenwich, CT?
Top Zip Codes with the Highest Percentage of Households with Income Below $10,000 in Greenwich, CT are:
What zip code has the Highest Percentage of Households with Income Below $10,000 in Greenwich, CT?
06831 has the Highest Percentage of Households with Income Below $10,000 in Greenwich, CT with 3.0%.
What is the Percentage of Households with Income Below $10,000 in Greenwich, CT?
Percentage of Households with Income Below $10,000 in Greenwich is 3.6%.
What is the Percentage of Households with Income Below $10,000 in Connecticut?
Percentage of Households with Income Below $10,000 in Connecticut is 4.3%.
What is the Percentage of Households with Income Below $10,000 in the United States?
Percentage of Households with Income Below $10,000 in the United States is 4.9%.