Zip Codes with the Highest Percentage of Households with Income Above $100,000 in New Britain, CT
RELATED REPORTS & OPTIONS
Household Income | $100k+
New Britain
Compare Zip Codes
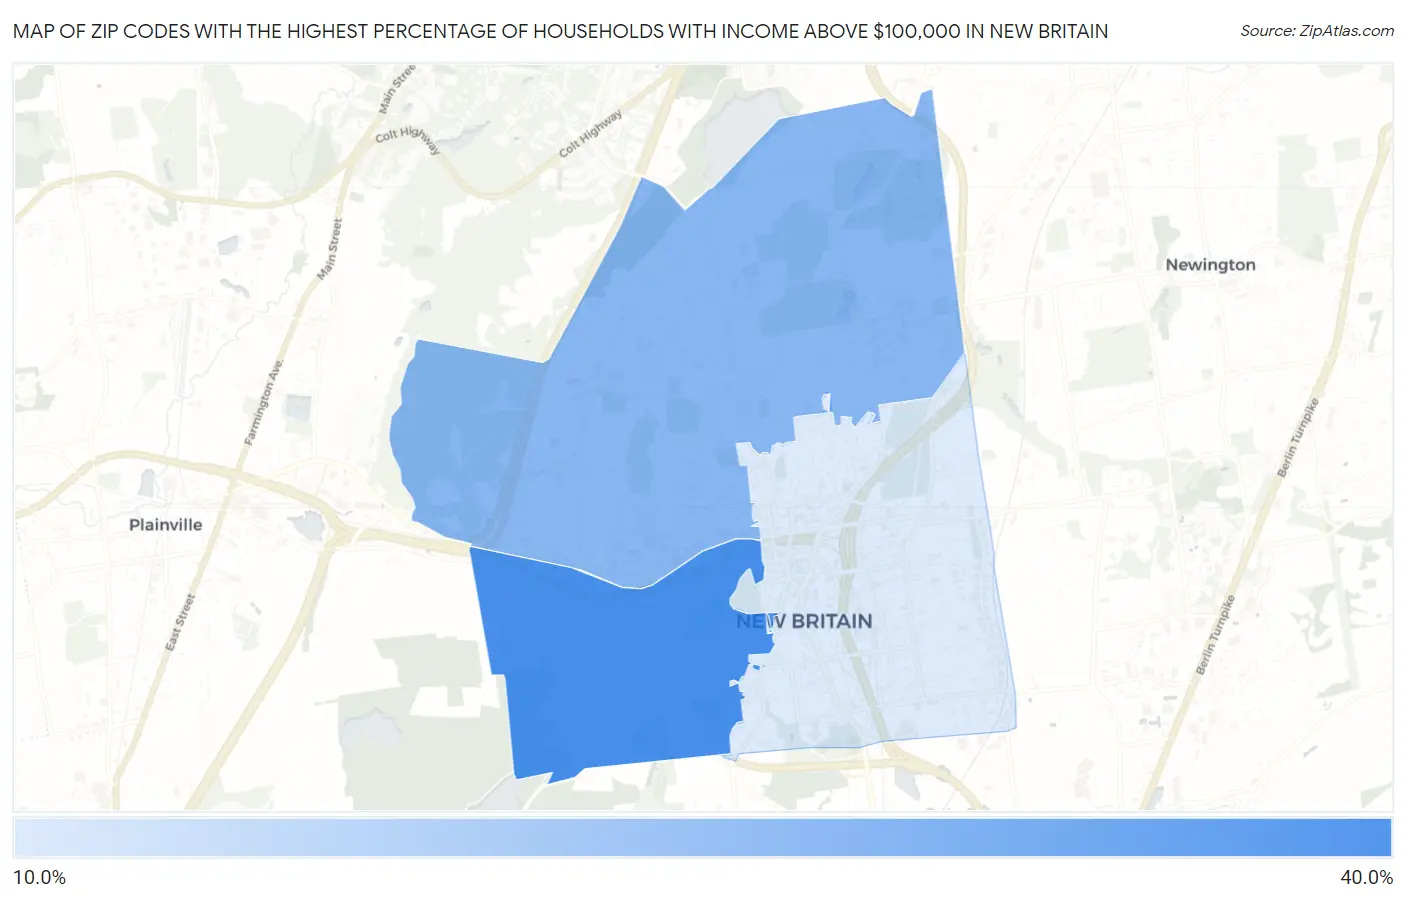
Map of Zip Codes with the Highest Percentage of Households with Income Above $100,000 in New Britain
16.7%
38.1%
Zip Codes with the Highest Percentage of Households with Income Above $100,000 in New Britain, CT
| Zip Code | Households with Income > $100k | vs State | vs National | |
| 1. | 06052 | 38.1% | 45.6%(-7.50)#214 | 37.3%(+0.800)#9,935 |
| 2. | 06053 | 28.6% | 45.6%(-17.0)#245 | 37.3%(-8.70)#16,570 |
| 3. | 06051 | 16.7% | 45.6%(-28.9)#269 | 37.3%(-20.6)#26,430 |
1
Common Questions
What are the Top Zip Codes with the Highest Percentage of Households with Income Above $100,000 in New Britain, CT?
Top Zip Codes with the Highest Percentage of Households with Income Above $100,000 in New Britain, CT are:
What zip code has the Highest Percentage of Households with Income Above $100,000 in New Britain, CT?
06052 has the Highest Percentage of Households with Income Above $100,000 in New Britain, CT with 38.1%.
What is the Percentage of Households with Income Above $100,000 in New Britain, CT?
Percentage of Households with Income Above $100,000 in New Britain is 24.6%.
What is the Percentage of Households with Income Above $100,000 in Connecticut?
Percentage of Households with Income Above $100,000 in Connecticut is 45.6%.
What is the Percentage of Households with Income Above $100,000 in the United States?
Percentage of Households with Income Above $100,000 in the United States is 37.3%.